Counter Trend Trades. (Trading Against The Trend) By Russ Horn
|
|
|
- Ruth Davis
- 6 years ago
- Views:
Transcription
 By Russ Horn")
1 Counter Trend Trades (Trading Against The Trend) By Russ Horn 1
2 RISK DISCLOSURE STATEMENT / DISCLAIMER AGREEMENT Trading any financial market involves risk. This report and all and any of its contents are neither a solicitation nor an offer to Buy/Sell any financial market. The contents of this material are for general information and educational purposes only [contents shall also mean the website or or any website ( the sites ) the content is hosted on, and any correspondence or newsletters or postings related to such website]. Every effort has been made to accurately represent this product and its potential. There is no guarantee that you will earn any money using the techniques, ideas and software in these materials. Examples in these materials are not to be interpreted as a promise or guarantee of earnings. Earning potential is entirely dependent on the person using the product, ideas and techniques. We do not purport this to be a get rich scheme. Although every attempt has been made to assure accuracy, we do not give any express or implied warranty as to its accuracy. We do not accept any liability for error or omission. Examples are provided for illustrative purposes only and should not be construed as investment advice or strategy. No representation is being made that any account or trader will or is likely to achieve profits or losses similar to those discussed in this report or on or on the sites. Past performance is not indicative of future results. By purchasing any content, subscribing to our mailing list or using the website or contents of the website or materials provided herewith, you will be deemed to have accepted these terms and conditions in full as appear also on our site, as do our full earnings disclaimer and privacy policy and CFTC disclaimer and rule 4.41 to be read here with. So too, all the materials contained within this course, including this manual, whether they appear on our domain(s) or are in physical form, are protected by copyright. "Warning: The unauthorized reproduction or distribution of this copyrighted work is illegal. Criminal copyright infringement, including infringement without monetary gain, is investigated by the authorities and is punishable with imprisonment and a fine." We reserve all our rights in this regard. Alaziac Trading CC, in association with the sites, content, and its representatives do not and cannot give investment advice or invite customers or readers to engage in investments through this course or any part of it. The information provided in this content is not intended for distribution to, or use by any person or entity in any jurisdiction or country where such distribution or use would be contrary to law or regulation or which would subject us to any registration requirement within such jurisdiction or country. Hypothetical performance results have many inherent limitations, some of which are mentioned below. No representation is being made that any account will or is likely to achieve profits or losses similar to those shown. In fact, there are frequently sharp differences between hypothetical performance results and actual results subsequently achieved by any particular trading program and method. One of the limitations of hypothetical performance results is that they are generally prepared with the benefit of hindsight. In addition, hypothetical trading does not involve financial risk and no hypothetical trading record can completely account for the impact of financial risk in actual trading. For example, the ability to withstand losses or to adhere to a particular trading program or system in spite of the trading losses are material points that can also adversely affect trading results. There are numerous other factors related to the market in general or to the implementation of any specific trading program, which cannot be fully accounted for in the preparation of hypothetical performance results. All of which can adversely affect actual trading results. We reserve the right to change the set terms and conditions without notice. You can check for updates to this disclaimer at any time by visiting Governing law: this policy and the use of this report / course / DVDs / ebook, provided in any form, and any content on the website are governed by the laws of the Republic of South Africa. If any dispute arises the parties have agreed to resolve it with the help of an arbitrator in the following location: Durban, South Africa. Further details on this are found under the Terms and Conditions on our site. Please ensure you have read and agree with all Terms and Conditions as set out on our site before using any of the materials. Your use and reliance on the materials is based on your acceptance of such Terms and Conditions and policies as appear on the site.. 2
3 Counter Trend Trades The basic Tradeonix system was designed to trade with the trend. Using the TBL, we can easily determine what direction the trend is moving. Trading with the trend is safe. Trading with the trend is productive. Trading with the trend is high probability. The market moves well in the direction of the trend, but it also moves against in the opposite direction. The trend can't last forever, and knowing how to take advantage of the market moves when they go in the opposite direction can add to the bottom line. Trading against the trend isn't as simple as it sounds. The direction of the trend is the direction the market is most likely going to move. If we are going to trade against the trend, we want to have a good reason to do so. If we are going to trade against the trend, we want to ask ourselves, "why is this a good trade to take?" 3
4 What Makes A Good Counter Trend Trade There are a few reasons we would consider taking a trade against the trend. 1. Support and resistance levels 2. Trendlines 3. Patterns 4. Regular Divergence We will cover each of these points, and you will quickly see that many of them will overlap each other. With the introduction of Divergence, I will be introducing an indicator to you. This is the RussMACD. For this manual it will be the usual MACD that you may already be familiar with, and to keep things simple, we will only use the histogram. Image 1 4

5 Counter Trend Trade Signal Before we look at the counter trend trade setups, I want to quickly discuss an actual entry signal. What do we need to see to place a trade. There are 2 phases to any trade. 1. Setup. 2. Signal. Not every setup will yield a signal. When we look at the reasons to take a trade, we will be looking at the variety of setups, but right now, I want to look at a signal. It's simple, every indicator will be in the direction of the counter trend trade with the exception of the TBL. In a long trade, the Switch + TBS + TBM will be bullish while the TBL remains red. In a short trade, the Switch + TBS + TBM will be bearish while the TBL remains green. Image 2 5

6 When you get a signal to go long: 1. Price will be above all the indicators on the chart. 2. The most recent Switch will be blue. (It can appear on the signal candle or earlier). 3. The TBS will be under the price and be green. 4. The TBM will be under the price and be green. 5. The TBL will be red. 6. Tetragram will be grey. When you get a signal to go short: 1. Price will be below all the indicators on the chart. 2. The most recent Switch will be red. (It can appear on the signal candle or earlier). 3. The TBS will be above the price and be red. 4. The TBM will be above the price and be red. 5. The TBL will be green. 6. Tetragram will be grey. Image 3 6

7 Stops And Targets The Counter Trend trades will place Stop Losses and Profit Targets in the same manner any other Tradeonix trade would play out. In a Long trade: 1. Stop loss will be placed just under the TBM. 2. Stop loss will be trailed along the TBM as each new TBM dot appears. 3. A conservative Take Profit will be placed as a 1:1. In a Short trade: 1. Stop loss will be placed just above the TBM + the spread. 2. Stop loss will be trailed along the TBM as each new TBM dot appears. 3. A conservative Take Profit will be placed as a 1:1. Image 4 Now that we have seen what a signal looks like, let's take a look at the setups. 7

8 Support And Resistance Support and resistance levels are commonly acted on as areas of market reversal. Trades watch for these levels and will trade once the market can in some way be confirmed to bounce off one of these levels. For us, a confirmation of a BOUNCE off either support or resistance will be a Tradeonix signal. Support Price will bounce off an already existing level of support. Ideally, this level is not too far away, and it could be close enough to form a nice double bottom chart pattern. As long as the level of support is clear and price looks to be making a bounce from it, this will constitute a good long trade. Image 5 8


9 Another example of support: Image 6 And another example of support: Image 7 9

10 Resistance Price will bounce off an existing level of resistance. The market will make a high and then recede from it. Later on, price will reach back to the same level of resistance. The bounce off the established level of resistance will be followed by the signal to go short. Image 8 10


11 Another example of resistance: Image 9 And a third example of resistance: Image 10 11


12 Trendlines Trendlines are angled, or diagonal, areas of support and resistance. Unlike horizontal support and resistance levels that see the market bounce, we will be using trendlines when the market breaks though them to validate a signal to go long or short. For us, a confirmation of a BREAK through and a close past a trendline will be a Tradeonix signal. When it comes to a trendline, we are looking for definite bounces off a trendline, not a tight movement along it. If the market hugs the trendline quite tightly, any close past the trendline will likely be just market noise and not a real move in the opposite direction. We want the market to make very clear bounces off a trendline in order for it to have any kind of strength, or to be taken seriously. Image 11 12

13 Bullish Trendline A Bullish Trendline is one that appears over top of the price in a downward market. The trendline itself will also be sloped downwards. Once we establish an ideal looking trendline, a close above the trendline will signal a trade to go long. To draw a trendline, we want at least 2 points of reference. We want a high followed by a lower high. We will connect the two highs and extrapolate the trendline ahead of the price. In the example, the TBL is red showing a downtrend. A high is made by the price and as the market drops, a second high is made that is lower than the initial high. We connect the 2 highs to draw a trendline. Once price closes above the trendline AND all the non-tbl indicators are bullish, we have a signal to go long. All of that happens in the same candle. Image 12 13


14 A bullish trendline followed by a signal to go long: Image 13 Another example of a bullish trendline followed by a signal to go long: Image 14 14

15 Bearish Trendline A Bearish Trendline is one that appears under the price in an upward market. The trendline itself will also be sloped upwards. Once we establish an ideal looking trendline, a close below the trendline will signal a trade to go short. To draw a trendline, we want at least 2 points of reference. We want a low followed by a higher low. We will connect the two lows and extrapolate the trendline ahead of the price. In the example, the TBL is green showing an uptrend. A low is made by the price and as the market rises, a second low is made that is higher than the initial low, followed by a third. We connect the 3 lows to draw a trendline. Price does close below the trendline, BUT not all of the non-tbl indicators are bearish yet. Once all of the non-tbl indicators turn bearish, we can take the trade short. Image 15 15


16 Bearish trendline on a real chart: Image 16 Another bearish trendline on a real chart: Image 17 16
17 Patterns There are 2 main chart patterns that we will look at when considering taking a counter trend trade. These can also be lumped in to the support and resistance and trendline category, but if you can see the pattern they make, you will have a higher probability of a successful trade. The patters are: 1. Double Top / Double Bottom 2. Wedge Image 18 Image 19 17

18 Bearish Patterns Double Top With a Double Top, price finds a high, or a level of resistance, and after it's rejected from there, it comes back to test it again. A second rejection from that level will often send price on a larger downward ride. This is very similar to a trade off of resistance, but a Double Top is generally considered to have highs that are closer together without any market wobble between the highs. Image 20 18


19 In this example, a high is made and the second high doesn't quite reach the level of the first. as long as the attempt was there and it looks like it tried, it will still count. Image 21 In this example, a high is made and it's followed by a second high that could not close above it. Attempts were made, but the market only formed wicks. Image 22 19

20 Bearish Wedge This is my favorite reversal pattern. It happens almost every time a decent reversal is about to happen, I watch for it with eagle eyes! In a bearish reversal Wedge, price must be trending higher. At the top of the trend, the last couple of highs are very shallow, almost a kind of topping out. The first high is followed by a slightly higher high. The lows however are not as shallow, they keep rising more dramatically than the highs. Image 23 20


21 Bearish Wedge formation of a real chart: Image 24 Bearish Wedge formation on a real chart: Image 25 21

22 Bullish Patterns Double Bottom With a Double Bottom, price finds a low, or a level of support, and after it's rejected from there, it comes back to test it again. A second rejection from that level will often send price on a larger upward ride. This is very similar to a trade off of support, but a Double Bottom is generally considered to have lows that are closer together without any market wobble between the lows. Image 26 22


23 Double Bottom after a larger move: Double Bottom just after the market open. Image 27 Image 28 23

24 Bullish Wedge In a Bullish Wedge, price must be trending lower. At the bottom of the trend, the last couple of lows are very shallow, almost a kind of bottoming out. The first low is followed by a slightly lower low. The highs however are not as shallow, they keep falling more dramatically than the lows. Image 29 24


25 Bullish Wedge formation: Image 30 Bullish Wedge signals along trade when TBL turns green. The trend isn't really intact until we get a pullback, so this can count as a counter trend trade Image 31 25
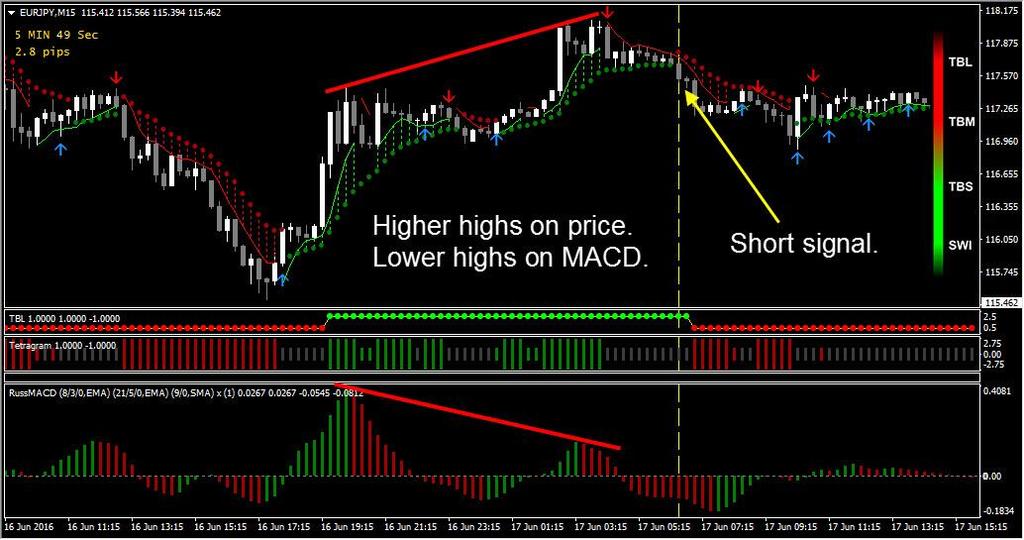
26 Regular Divergence For this we are going to introduce an indicator called the MACD. What we will be looking at is its ability to form highs and lows along with the price. This is a type of oscillating indicator as it goes up and down in its own window. The traditional MACD is a two part indicator, but we are going to only use the histogram. Image 32 The MACD is a great tool to help us get an idea of market momentum. It can really tell when the market is getting weak and can no longer continue to move in its trending direction. Regular Bearish Divergence is when price is making higher highs, but he highs on the MACD re getting lower. This indicates a weakness in the market. Regular Bullish Divergence is when the price is making lower lows, but the MACD is making a higher corresponding low. 26

27 Regular Bearish Divergence As the price makes a high, the MACD will make a corresponding high. for the most part, the MACD will do what the price does. the market makes higher highs, the MACD will do the same. However, once in a while, when the market is likely to change, we will see the MACD does the opposite of what the market does. In the case of Regular Bearish Divergence, as the price makes a higher high, the MACD will make a lower corresponding high. This shows weakness in the market's ability to keep climbing. Once we get a bearish divergence setup, we can take the short signal as it happens. Image 33 27

28 Regular Bearish Divergence: Image 34 Regular Bearish Divergence: Image 35 28

29 Regular Bullish Divergence As the price makes a low, the MACD will make a corresponding low. For the most part, the MACD will do what the price does. The market makes lower lows, the MACD will do the same. However, once in a while, when the market is likely to change, we will see the MACD does the opposite of what the market does. In the case of Regular Bullish Divergence, as the price makes a lower low, the MACD will make a higher corresponding low. This shows weakness in the market's ability to keep dropping. Once we get a bullish divergence setup, we can take the long signal as it happens. Image 36 29


30 Bullish Divergence: Image 37 More bullish Divergence: Image 38 30
31 Conclusion Trading against the prevailing trend can be tricky, but if you have a good reason to do it, then you can make money trading counter trend with less risk. The market moves in 2 directions, there is no reason why we can't get our fair share of both directions. In this manual, you have seen 4 different strategies to make trading against the trend viable. I always ask myself, why is this a good trade to take, and if you can answer that question with any of the methods in this manual, you have your answer. Enjoy trading against the trend!. 31
Different Classes Of Divergence
 Russ Horn Presents Different Classes Of Divergence RISK DISCLOSURE STATEMENT / DISCLAIMER AGREEMENT Trading any financial market involves risk. This report and all and any of its contents are neither a
Tradeonix 2.0. (An Updated Version Of Tradeonix) By Russ Horn
 By Russ Horn") Tradeonix 2.0 (An Updated Version Of Tradeonix) By 1 RISK DISCLOSURE STATEMENT / DISCLAIMER AGREEMENT Trading any financial market involves risk. This report and all and any of its contents are neither
Tradeonix 2.0 (An Updated Version Of Tradeonix) By 1 RISK DISCLOSURE STATEMENT / DISCLAIMER AGREEMENT Trading any financial market involves risk. This report and all and any of its contents are neither
 ADDING THE MACD Forex Strategy Master Published by Old Tree Publishing CC Suite 509, Private Bag X503 Northway, 4065, KZN, ZA www.oldtreepublishing.com Copyright 2013 by Old Tree Publishing CC, KZN, ZA
Russ Horn Presents. Forex Money Bounce
 Presents Forex Money Bounce RISK DISCLOSURE STATEMENT / DISCLAIMER AGREEMENT Trading any financial market involves risk. This report and all and any of its contents are neither a solicitation nor an offer
FOREX INCOME BOSS. Presents. Rejection Spike
 FOREX INCOME BOSS Presents Rejection Spike Published by Alaziac Trading CC Suite 509, Private Bag X503 Northway, 4065, KZN, ZA www.forexincomeboss.com Copyright 2015 by Alaziac Trading CC, KZN, ZA Reproduction
Chart Patterns. (High Probability Chart Patterns) By Russ Horn
 By Russ Horn") (High Probability ) By Russ Horn 1 RISK DISCLOSURE STATEMENT / DISCLAIMER AGREEMENT Trading any financial market involves risk. This report and all and any of its contents are neither a solicitation nor
(High Probability ) By Russ Horn 1 RISK DISCLOSURE STATEMENT / DISCLAIMER AGREEMENT Trading any financial market involves risk. This report and all and any of its contents are neither a solicitation nor
PRESENTS THE MAXTRADE DOMINATOR TRADING SYSTEM. By Toshko Raychev
 PRESENTS THE MAXTRADE DOMINATOR TRADING SYSTEM By Toshko Raychev RISK DISCLOSURE STATEMENT / DISCLAIMER AGREEMENT Trading any financial market involves risk. This report and all and any of its contents
RISK DISCLOSURE STATEMENT / DISCLAIMER AGREEMENT
 RISK DISCLOSURE STATEMENT / DISCLAIMER AGREEMENT Trading any financial market involves risk. This report and all and any of its contents are neither a solicitation nor an offer to Buy/Sell any financial
RISK DISCLOSURE STATEMENT / DISCLAIMER AGREEMENT
 RISK DISCLOSURE STATEMENT / DISCLAIMER AGREEMENT Trading any financial market involves risk. This report and all and any of its contents are neither a solicitation nor an offer to Buy/Sell any financial
Presents. Trade Predator
 Presents RISK DISCLOSURE STATEMENT / DISCLAIMER AGREEMENT Trading any financial market involves risk. This report and all and any of its contents are neither a solicitation nor an offer to Buy/Sell any
FOREX INCOME BOSS. Presents. SRT Profit System
 FOREX INCOME BOSS Presents SRT Profit System Published by Alaziac Trading CC Suite 509, Private Bag X503 Northway, 4065, KZN, ZA www.forexincomeboss.com Copyright 2014 by Alaziac Trading CC, KZN, ZA Reproduction
FOREX TREND SECRETS. New Science Of Forex Trading Published by Alaziac CC Suite 509, Private Bag X503 Northway, 4065, KZN, ZA
 FOREX TREND SECRETS New Science Of Forex Trading Published by Alaziac CC Suite 509, Private Bag X503 Northway, 4065, KZN, ZA www.alaziac.com Copyright 2013 by Alaziac CC, KZN, ZA Reproduction or translation
RISK DISCLOSURE STATEMENT / DISCLAIMER AGREEMENT
 RISK DISCLOSURE STATEMENT / DISCLAIMER AGREEMENT Trading any financial market involves risk. This report and all and any of its contents are neither a solicitation nor an offer to Buy/Sell any financial
Russ Horn Presents PROFIT AUTOMATION TOOL
 Russ Horn Presents PROFIT AUTOMATION TOOL RISK DISCLOSURE STATEMENT / DISCLAIMER AGREEMENT Trading any financial market involves risk. This report and all and any of its contents are neither a solicitation
Presents. Forex Profit Boost
 Presents Forex Profit Boost Forex Profit Boost Published by Alzaiak Trading CC Nominee Old Tree Publishing CC Suite 509, Private Bag X503 Northway, 4065, KZN, ZA www.oldtreepublishing.com Copyright 2014
FOREX GEMINI CODE. Presents. Dynamic Triple Edge
 FOREX GEMINI CODE Presents Forex Gemini Code Published by Alaziac Trading CC Suite 509, Private Bag X503 Northway, 4065, KZN, ZA www.forexgeminicode.com Copyright 2014 by Alaziac Trading CC, KZN, ZA Reproduction
Trading Forex Using High Probability Pattern Trade
 Presents Trading Forex Using High Probability Pattern Trade Trading Forex Using High Probability Pattern Trade Published by Alzaiak Trading CC Nominee Old Tree Publishing CC Suite 509, Private Bag X503
FOREX PROFITABILITY CODE
 FOREX PROFITABILITY CODE Forex Secret Protocol Published by Old Tree Publishing CC Suite 509, Private Bag X503 Northway, 4065, KZN, ZA www.oldtreepublishing.com Copyright 2013 by Old Tree Publishing CC,
The truth behind commonly used indicators
 Presents The truth behind commonly used indicators Pipkey Report Published by Alaziac Trading CC Suite 509, Private Bag X503 Northway, 4065, KZN, ZA www.tradeology.com Copyright 2014 by Alaziac Trading
NEW SCIENCE OF FOREX TRADING. Presents. Rapid Trade Finder
 NEW SCIENCE OF FOREX TRADING Presents Rapid Trade Finder New Science of Forex Trading Published by Alaziac Trading CC Suite 509, Private Bag X503 Northway, 4065, KZN, ZA www.newscienceofforextrading.com
Presents. Forex Cash Geyser. By Joshua Schultz
 Presents Forex Cash Geyser By Joshua Schultz RISK DISCLOSURE STATEMENT / DISCLAIMER AGREEMENT Trading any financial market involves risk. This report and all and any of its contents are neither a solicitation
RISK DISCLOSURE STATEMENT / DISCLAIMER AGREEMENT
 RISK DISCLOSURE STATEMENT / DISCLAIMER AGREEMENT Trading any financial market involves risk. This report and all and any of its contents are neither a solicitation nor an offer to Buy/Sell any financial
PRESENTS. The Target Entry Elevator Indicator. By Michael Nurok
 PRESENTS The Target Entry Elevator Indicator By Michael Nurok RISK DISCLOSURE STATEMENT / DISCLAIMER AGREEMENT Trading any financial market involves risk. This report and all and any of its contents are
HPLR Cash Machine. By A.J. Brown.
 By A.J. Brown www.secretoftrading.com RISK DISCLOSURE STATEMENT / DISCLAIMER AGREEMENT Trading any financial market involves risk. This report and all and any of its contents are neither a solicitation
Fibo Vector Published by Old Tree Publishing CC Suite 509, Private Bag X503 Northway, 4065, KZN, ZA
 Fibo Vector Published by Old Tree Publishing CC Suite 509, Private Bag X503 Northway, 4065, KZN, ZA www.oldtreepublishing.com Copyright Old Tree Publishing CC, KZN, ZA Reproduction or translation of any
Forex Trend Directive
 FOREX GEMINI CODE Presents Forex Trend Directive Forex Gemini Code Published by Alaziac Trading CC Suite 509, Private Bag X503 Northway, 4065, KZN, ZA www.forexgeminicode.com Copyright 2014 by Alaziac
PRESENTS. COG Master Strategy. Trading Forex Using the Center Of Gravity Master Strategy. Wesley Govender
 PRESENTS COG Master Strategy Trading Forex Using the Center Of Gravity Master Strategy Copyright 2013 by Old Tree Publishing CC, KZN, ZA Wesley Govender Reproduction or translation of any part of this
Tradeology Presents. News And Trading
 Tradeology Presents News And Trading News And Trading Published by Alaziac Trading CC Suite 509, Private Bag X503 Northway, 4065, KZN, ZA www.tradeology.com Copyright 2014 by Alaziac Trading CC, KZN, ZA
Designing A Trading System
 Presents Published by Alaziac Trading CC Nominee Old Tree Publishing CC Suite 509, Private Bag X503 Northway, 4065, KZN, ZA Copyright 2017 by Alaziac Trading CC, KZN, ZA Reproduction or translation of
BLACK BOX MONEY SYSTEM
 BLACK BOX MONEY SYSTEM By A.J. Brown www.secretoftrading.com RISK DISCLOSURE STATEMENT / DISCLAIMER AGREEMENT Trading any financial market involves risk. This report and all and any of its contents are
Williams Percent Range
 Williams Percent Range (Williams %R or %R) By Marcille Grapa www.surefiretradingchallenge.com RISK DISCLOSURE STATEMENT / DISCLAIMER AGREEMENT Trading any financial market involves risk. This report and
AUTOMATED TRADE PREDATOR
 Presents AUTOMATED TRADE PREDATOR Automated Trade Predator Published by Alzaiak Trading CC Nominee Old Tree Publishing CC Suite 509, Private Bag X503 Northway, 4065, KZN, ZA www.tradeology.com Copyright
Presents FOREX ALPHA CODE
 Presents FOREX ALPHA CODE Forex Alpha Code Published by Alaziac Trading CC Suite 509, Private Bag X503 Northway, 4065, KZN, ZA www.tradeology.com Copyright 2014 by Alaziac Trading CC, KZN, ZA Reproduction
Divergence and Momentum Trading
 presented by Thomas Wood MicroQuant SM Divergence Trading Workshop Day One Divergence and Momentum Trading Risk Disclaimer Trading or investing carries a high level of risk, and is not suitable for all
presented by Thomas Wood MicroQuant SM Divergence Trading Workshop Day One Naked Trading Part 2
 presented by Thomas Wood MicroQuant SM Divergence Trading Workshop Day One Naked Trading Part 2 Risk Disclaimer Trading or investing carries a high level of risk, and is not suitable for all persons. Before
MACD INDICATOR Moving Average Convergence Divergence Part Three
 MACD INDICATOR Moving Average Convergence Divergence Part Three Reprinted from The Traders Journal Volume 2 Issue 3 By Jason Sidney Following on from the previous article on the MACD indicator we established
1 Published by Old Tree Publishing CC Suite 509, Private Bag X503 Northway, 4065, KZN, ZA
 Published by Old Tree Publishing CC Suite 509, Private Bag X503 Northway, 4065, KZN, ZA www.oldtreepublishing.com Copyright 2013 by Old Tree Publishing CC, KZN, ZA Reproduction or translation of any part
- My 4 Favorite Trades - Essential Trades of a Professional Trader
 presented by Thomas Wood MicroQuant SM Divergence Trading Workshop Day One - My 4 Favorite Trades - Essential Trades of a Professional Trader Risk Disclaimer Trading or investing carries a high level of
1. Introduction 2. Chart Basics 3. Trend Lines 4. Indicators 5. Putting It All Together
 Technical Analysis: A Beginners Guide 1. Introduction 2. Chart Basics 3. Trend Lines 4. Indicators 5. Putting It All Together Disclaimer: Neither these presentations, nor anything on Twitter, Cryptoscores.org,
WAIT FOR CONDITIONS TO BE IN YOUR FAVOUR BEFORE OPENING A TRADE DO NOT LEAVE TRADE OPEN TOO LATE INTO REVERSAL WHEN MARKET MOVES AGAINST YOU
 UT TRADER UT TRADER was designed for traders signalling of trend movements to filter out possible false reverses, whipsaws, ranges. It uses several simple easy to use visual friendly indicators for manual
Naked Trading and Price Action
 presented by Thomas Wood MicroQuant SM Divergence Trading Workshop Day One Naked Trading and Price Action Risk Disclaimer Trading or investing carries a high level of risk, and is not suitable for all
Directional Key System
 1 Directional Key System 2 RISK DISCLOSURE STATEMENT. Trading any financial market involves risk. This e-book, software, and the website and its contents are neither a solicitation nor an offer to Buy/Sell
The content of and this ebook are copyrighted and may not be copied or reproduced.
 All rights reserved. Except for brief quotations in a review of this publication, no part of this publication may be reproduced, stored in a retrieval system, or transmitted in any form or by any means
Compiled by Timon Rossolimos
 Compiled by Timon Rossolimos - 2 - The Seven Best Forex Indicators -All yours! Dear new Forex trader, Everything we do in life, we do for a reason. Why have you taken time out of your day to read this
presented by Thomas Wood MicroQuant SM Divergence Trading Workshop Day One Black Gold
 presented by Thomas Wood MicroQuant SM Divergence Trading Workshop Day One Black Gold Risk Disclaimer Trading or investing carries a high level of risk, and is not suitable for all persons. Before deciding
The Dow Theory by
 The Dow Theory by www.surefire-trading.com Ty Young Anyone who s ever purchased a DVD knows the difference between a wide screen production and a full screen production. To elaborate; when a movie is viewed
Now You Can Have These Trading Gems- Free!
 Presents Killer Patterns Now You Can Have These Trading Gems- Free! The Trading Info Revealed Here is not the Same as the Proven WizardTrader.com Methods But Works Well With Them 1 Copyright Information
DAILY DAY TRADING PLAN
 DAILY DAY TRADING PLAN Gatherplace will be used to place all of your trades. You will be using the 5 minute chart for the trade setup and the 1 minute chart for your entry, stop and trailing stop.you will
McDowell s Special Market Report Using the TradersCoach.com Software Tools
 McDowell s Special Market Report Using the TradersCoach.com Software Tools JULY 2018: Welcome to this month s Market Report! This written report is going to forecast the Dow Jones Industrial Average (hereafter
SPX for the smaller major-4 triangle or SPX to complete the double zigzag. Figure 1.
 Today s break -finally- below SPX2625 (and SPX2613) places the Ball now firmly in the Bears camp, albeit today s strong rally off the lows. And the two main bear counts remain the focus for now: SPX2579-2568
3 Price Action Signals to Compliment ANY Approach to ANY Market
 3 Price Action Signals to Compliment ANY Approach to ANY Market Introduction: It is important to start this report by being clear that these signals and tactics for using Price Action are meant to compliment
INTERMEDIATE EDUCATION GUIDE
 INTERMEDIATE EDUCATION GUIDE CONTENTS Key Chart Patterns That Every Trader Needs To Know Continution Patterns Reversal Patterns Statistical Indicators Support And Resistance Fibonacci Retracement Moving
1 P a g e. Executive Summary
 Executive Summary For three weeks we provided a primary (major b) and alternative count (primary V) up and we keep tracking both until one or the other is disproven. Two weeks ago we projected a major
Intelligent Investing, LLC Major Indices Daily Update 02/28/ 19
 Elliot Wave Updates Today the S&P500 was stuck in a less than 6p range. So there s really not much we can learn. All parameters remain the same a step 2: A move below SPX2764.55 (last Thursday s low) will
Intelligent Investing, LLC Major Indices Daily Update 02/26/ 19
 Elliot Wave Updates Yesterday I found a move below last Friday s high (SPX2794.20) will be a first sign of lower prices as then the decline can t be a 4 th wave because 4 th and 1 st waves can t overlap
Technical Analysis Workshop Series. Session Three
 Technical Analysis Workshop Series Session Three DISCLOSURES & DISCLAIMERS This research material has been prepared by NUS Invest. NUS Invest specifically prohibits the redistribution of this material
In the weekend update I presented 3 different counts for the S&P in order of probability
 In the weekend update I presented 3 different counts for the S&P in order of probability 1) micro-1 ongoing with nano-iv at SPX2578 and nano-v to SPX2595 underway (60%). 2) Micro-2 topped at SPX2590, micro-c
How To Read Charts Like A Pro Your guide to reading stock charts!
 How To Read Charts Like A Pro Your guide to reading stock charts! Courtesy of Swing-Trade-Stocks.com You may distribute this book FREELY or use it as part of a commercial package as long as this page and
The Launchpad Strategy
 presented by Thomas Wood MicroQuant SM Divergence Trading Workshop Day One The Launchpad Strategy Risk Disclaimer Trading or investing carries a high level of risk, and is not suitable for all persons.
Autochartist User Manual
 Autochartist User Manual compliance@ifxbrokers.com www.ifxbrokers.com +27 42 293 0353 INTRODUCTION Chapter 1 Autochartist offers traders automated market-scanning tools that highlight trade opportunities
Presents. The Trading Information Revealed Here is not the Same as the WizardTrader.com Methods -- But Together They Pack a Powerful Punch
 Presents Killer Patterns Now You Can Have These Trading Gems -- Free! The Trading Information Revealed Here is not the Same as the WizardTrader.com Methods -- But Together They Pack a Powerful Punch 1
Copyright Profits Run, Inc. Page 1 of 5 Rev
 This document describes how to manage trades identified with the Trade Alert Software. General Risk Management Ideally risk no more than 2% of your account size on any one trade. Risk means the amount
Intermediate-a? SPX2533
 Summary Like last week, also this week s Friday-price action left a lot to be desired for the Bulls and ambiguity regarding which exact Elliot Wave price pattern remains: major-4 still underway? Major-4
Syl Desaulniers Nison Certified Trainer Nison Candle Software Tech Support
 Syl Desaulniers Nison Certified Trainer Nison Candle Software Tech Support Legal Notice: This webcast and recording is Candlecharts.com and may not be copied, retransmitted, nor distributed in any manner
ALOHA. Arnout aka Soul, Ph.D. 5 P a g e
 I continue to use the wave-i, ii count as my preferred count until proven otherwise. Why? 1) Price bottomed last week right in the preferred target zone for wave-ii. No need to overthink that. 2) The entire
Technical Analysis Workshop Series. Session Six 1, 2, 3 Price-Bars Patterns
 Technical Analysis Workshop Series Session Six 1, 2, 3 Price-Bars Patterns DISCLOSURES & DISCLAIMERS This research material has been prepared by NUS Invest. NUS Invest specifically prohibits the redistribution
Trading Patterns For Stocks And Commodities
 Trading Patterns For Stocks And Commodities It doesn t matter if you are a long-term investor, short swing trader or day trader, you are always looking for an advantageous spot to enter your position.
Trend Profiteer Expert Advisor Settings Quick Reference Guide
 Trend Profiteer Expert Advisor Settings Quick Reference Guide By Michael Nurok www.trendprofiteer.com www.trendprofiteer.com 1 RISK DISCLOSURE STATEMENT / DISCLAIMER AGREEMENT Trading any financial market
No duplication of transmission of the material included within except with express written permission from the author.
 Copyright Option Genius LLC. All Rights Reserved No duplication of transmission of the material included within except with express written permission from the author. Be advised that all information is
DIY Trade Manager Plus
 DIY Trade Manager Plus Version 25.00 User Guide 11 May 2018 1 P a g e Risk Disclosure Statement and Disclaimer Agreement This User Guide ( User Guide ) is for installation and associated illustrative purposes
Candlesticks Discoveries Probability of Success Aug 6, 2016
 Candlesticks Discoveries Probability of Success Aug 6, 2016 The Art & Science of Active Trend Trading Disclaimer U.S. Government Required Disclaimer Commodity Futures Trading Commission Futures and Options
Chapter 2.3. Technical Analysis: Technical Indicators
 Chapter 2.3 Technical Analysis: Technical Indicators 0 TECHNICAL ANALYSIS: TECHNICAL INDICATORS Charts always have a story to tell. However, from time to time those charts may be speaking a language you
Figure 1. SPX 1-min chart. NAS 1-min chart.
 In the weekend update I summarized my findings as Short-term the market should be close to completing intermediate-a, though based on a simple Bollinger Band Study, SPX2820 may well be reached first, which
presented by Thomas Wood MicroQuant SM Divergence Trading Workshop Day One Bond Trading Success
 presented by Thomas Wood MicroQuant SM Divergence Trading Workshop Day One Bond Trading Success Risk Disclaimer Trading or investing carries a high level of risk, and is not suitable for all persons. Before
Tradeciety s Price Action Guide
 Tradeciety s Price Action Guide Welcome... 3 Who am I?... 3 Some impressions from my trading & traveling lifestyle... 4 What Is Price Action?... 6 Candlesticks vs. Chart patterns... 7 Top 3 Candlestick
For general trading knowledge, please get a beginners guide or simply got to :
 www.forexripper.com About The System For general trading knowledge, please get a beginners guide or simply got to : www.babypips.com For more interactive information about the market, there are hundreds
Intra-Day Trading Techniques
 Pristine.com Presents Intra-Day Trading Techniques With Greg Capra Co-Founder of Pristine.com, and Co-Author of the best selling book, Tools and Tactics for the Master Day Trader Copyright 2001, Pristine
Using Volume Based Bars in Your Trading Exclusive Presentation for Infinity Futures
 Using Volume Based Bars in Your Trading Exclusive Presentation for Infinity Futures Trading Futures, Options on Futures, and retail off-exchange foreign currency transactions involves substantial risk
In here, you will learn the trading rules on how to use trade teh 200 exponential moving average with the Awesome Oscillator Indicator.
 Trading Strategy / Gert.Nurme@iBrokers.ee 200 EMA with Awesome Oscillator Introduction The 200 EMA With Awesome Oscillator Forex Trading Strategy is a very simple trend trading system and therefore in
C y c l e C a n d l e s T r a d i n g W o r k s h o p
 C y c l e C a n d l e s Trading Workshop Risk Disclaimer Trading or investing carries a high level of risk, and is not suitable for all persons. Before deciding to trade or invest you should carefully
Ichimoku Kinko Hyo System PDF Strategy Guide + MT4 Indicator Download
 Ichimoku Kinko Hyo System PDF Strategy Guide + MT4 Indicator Download ForexStrategiesWork.com Congratulations! You might not know it yet but you are in for a REAL treat in the Forex World. You now have
1 P a g e. Executive Summary
 Executive Summary Price finally reached our expect SPX2112-2120 and the negative divergences that started to creep in on the daily TIs finally also took their toll over the past 2 days. The weekly charts
BUY SELL PRO. Improve Profitability & Reduce Risk with BUY SELL Pro. Ultimate BUY SELL Indicator for All Time Frames
 BUY SELL PRO Improve Profitability & Reduce Risk with BUY SELL Pro Ultimate BUY SELL Indicator for All Time Frames Risk Disclosure DISCLAIMER: Crypto, futures, stocks and options trading involves substantial
Chapter 2.3. Technical Indicators
 1 Chapter 2.3 Technical Indicators 0 TECHNICAL ANALYSIS: TECHNICAL INDICATORS Charts always have a story to tell. However, sometimes those charts may be speaking a language you do not understand and you
In addition, a word of advice: when in a Bear market and my Elliot Wave Count suggests either down or a few more subdivisions marginally higher
 WOW, who would have known?! Price went from my upper target zone to my lower (see page 2) in just 11 trading hours: The S&P500 lost ~10p/hour Crazy. Big gap ups one day, followed by a 100p drop the next
The Art & Science of Active Trend Trading
 CONNECTING THE DOTS Candlesticks & Convergence of Clues The Art & Science of Active Trend Trading Copyright ATTS 2007-2015 1 Dennis W. Wilborn, P.E. Founder, President Active Trend Trading dww@activetrendtrading.com
1 P a g e. Executive Summary
 Executive Summary Last week I was looking for SPX2455-2475 and the S&P500 gave us SPX2454 on Monday and then started to pullback and consolidate causing for many pundits to already start top calling. Close
Advanced Trading Systems Collection MACD DIVERGENCE FOREX TRADING SYSTEM
 MACD DIVERGENCE FOREX TRADING SYSTEM 1 This system will cover the MACD divergence. With this forex trading system you can trade any currency pair (I suggest EUR/USD and GBD/USD when you start), and you
Trading Tops and Bottoms DAILY T&B REPORT. Let Us Find The Highs And Lows For You. November 7, 2017
 Trading Tops and Bottoms DAILY T&B REPORT Let Us Find The Highs And Lows For You November 7, 2017 DISCLAIMER Videos, newsletters and notifications from Trading Tops and Bottoms are for educational purposes
1 P a g e. Executive Summary
 Executive Summary We can keep the executive summary very simple, and repeat what we said last week: A break below SPX2405 is now needed to put the Bull-count in jeopardy. Until then we have to look up,
Hidden Divergence. Hello there, you will be excited about the information contained in this report.
 Hidden Divergence Hello there, you will be excited about the information contained in this report. Isn t it remarkable how people like us who are in the Trading business have taken frequently interesting
Trade Ideas A.I. Strategy Descriptions Revised : 10/04/2017
 Trade Ideas A.I. Strategy Descriptions Revised : 10/04/2017 The 5 Day Bounce The trigger for this alert has to cross above resistance while also making a 60 minute high on stocks that are trying to bounce
Copyright PriceAction5.com
 1 Copyright PriceAction5.com All rights reserved. Unauthorised resell or copying of this material is unlawful. No portion of this ebook may be copied or resold without written permission. PriceAction5.com
The Art & Science of Active Trend Trading
 Candlesticks Looking for U-Turns The Art & Science of Active Trend Trading Copywrite ATTS 2007-2015 1 Disclaimer U.S. Government Required Disclaimer Commodity Futures Trading Commission Futures and Options
INTRODUCTION CHAPTER 1
 INTRODUCTION CHAPTER 1 Autochartist offers traders automated market-scanning tools that highlight trade opportunities based on support and resistance levels. Autochartist products include: Chart pattern
.. /-!"::- '..- ( \.- - '-/../ '
 ....'-/ -!"::- ' ( \.-../ ' /- Triple Shot Forex Trading System The term "Day Trading" usually refers to the act of buying and selling a financial instrument within the same day. In the Forex market, a
Copyright by Profits Run, Inc. Published by: Profits Run, Inc Beck Rd Unit F1. Wixom, MI
 DISCLAIMER: Stock, forex, futures, and options trading is not appropriate for everyone. There is a substantial risk of loss associated with trading these markets. Losses can and will occur. No system or
GUIDE TO STOCK trading tools
 P age 1 GUIDE TO STOCK trading tools VI. TECHNICAL INDICATORS AND OSCILLATORS I. Introduction to Indicators and Oscillators Technical indicators, to start, are data points derived from a specific formula.
Figure 1. SPX 60 min & NAS 1-min chart.
 BINGO!? Today we reached the ideal SPX2625 target to the T (SPX2625.76) for wave-a. There s now negative divergence again on the hourly RSI5 and the hourly MACD (see Fig 1), while the daily indicators