The AB=CD Secret Pattern
|
|
|
- Preston Eaton
- 5 years ago
- Views:
Transcription

1 The AB=CD Secret Pattern Author: Sundeep Bilkhu Published By: Instant Marketplace Ltd Copyright All rights reserved is owned by Instant Marketplace Ltd
2 Introduction Thank you for downloading your copy of the AB=CD Secret Pattern. You are about to be introduced to a truly amazing geometry trading pattern which professional traders and brokers do not want you to know about. Put simply, it will enable you to take money out the markets by stacking the probability of each trade in your favour. By stacking the probability in your favour you will take positions before the next market reversal occurs. The AB=CD Secret Pattern will show you how to: Identify a secret geometry trading pattern with a low risk and high profit probability allowing you to trade market reversals before they occur Trade against the crowd putting you in the winning 5% as opposed to the losing 95% Be subject to LESS manipulation from the market makers, who tend to buy when you sell and sell when you buy Use the secret pattern to day trade, swing trade or position trade Trade ANY market in the world, whether it be stocks, Forex, indices, commodities, bonds etc Not lose out to the traditional "1-2-3 Pattern" formation Minimise your loses to a maximum of 21.4% of any trade Identify the exact EXIT point by reference to PRICE and TIME Use the secret pattern to take both LONG and SHORT trades Identify the ENTRY point using the secret pattern and applying NO indicators Use 2 confirmation signals to confirm the EXIT point of your trades Take positions so that the risk/reward is in your favour and Take money out the markets! The Basics Have you ever wondered why the market has the miraculous ability to move in the opposite direction of your trade? You know how it goes. You go long and the market drops. You go short and the market goes up. Even worse is the situation where, you go long and the market drops - consequently you close your position because of the loss but guess what, the market goes up again well above your long entry point, which would have put you in the profit had you kept the position open. The same applies to a short position in reverse. Does this sound familiar to you? This does beg the question why did the market move against you? One explanation is that highly experienced professional traders know how to trade against the crowd. They have what I call "Market Anticipation". I once read the following in a trading article "the grandmasters of the markets are those who can anticipate where the market is going before it goes there". If only we could all do this. Whilst 95% of traders are going long, the select few of 5% traders are going Copyright

3 short and selling against the crowd. If enough sell pressure occurs, it can cause the markets to significantly drop. You must also appreciate certain price points in the market have considerable levels of resistance and support and when those points are taken out, the market moves with momentum. When this happens and institutional investors are involved, they need to take cover to protect their positions. This can cause a selling or buying frenzy which can cause the markets to significantly reverse. The Solution You therefore need a method to put yourself with the 5% of traders enabling you to spot low risk and highly profitable probability trades which enable you to take money out of the markets. It is as simple as that. This is where the AB=CD Secret Pattern comes in. The AB=CD Secret Pattern looks like the traditional Pattern but the devil is in the detail. Consider the following Pattern: Fig 1 In Fig 1 you enter when the high point 1 is taken out. Whilst you could enter at the purple line point you would probably enter at 1295 when the spike at Point 1 is taken out. However, the market drops down to Whilst not marked on this chart, at Point 3 there is another Pattern. You would probably enter at However, the market drops back down to Why does this reversal take place every time the high is taken out. Copyright

4 Fig 2 Fig 2 demonstrates another failing Pattern even better. You would go long at 1318 because the high point 1 is taken out. However, the market drops to retest Do you stay in or do you cut your losses. At this point at $10 a point you are $180 down. If your stop loss is at 1280 you may wait to see if it is taken out. If the stop is taken out that would be a $318 loss. However, the market goes back up to You now feel confident that your strategy is working. You are in the profit by $90. You can t adjust the stop loss to the new low of 1303 because you haven t locked any profit in. However, the market drops to You get stopped out at 1280 and have a loss of $318. Again you will see 2 highs have been retested with the market going down. Do not get me wrong. The charts clearly show that the Pattern does work, but my case is that there are serious flaws in it. You will: Have to wait for the high or low to be taken out Have to be prepared to accommodate a Hook Retest and Have to wait for the position to move into profit. Take Fig 3 in the Dow Jones Industrial Average: Copyright

5 Fig 3 In Fig 3 you will see that in the first Pattern to the left you would go long at Point 3. For those who day trade and went long when the candlestick broke 11300, marking a clear breakout, would have set a stop at However, your stop would have been taken out and at $10 a point you would have made a loss of $2240. For those who went long on the Pattern at the yellow line would have entered at with a stop loss at They could have taken advantage of Patterns occurring after the entry point. However, you still would have had to have waited for the high or low to be taken out, be prepared to accommodate Hook Retests and to wait for the position to move into profit. If you had entered the final Pattern to the right of the chart, you would have gone long at with a stop loss at Whilst the market breached you would not have trailed the stop loss because there was no profit locked in. However, the market dropped on 22 September 2006 to Do you stay in or get out? The Fibonacci Retracement is showing the market may retest If it does you will make a loss of $2380. You will therefore see the Pattern does provide profitable opportunities but you need to enter at the right time to ride the trend. Get in to late and there may not be enough movement in the trend to allow you to take profits out. What you need is a method to enter at Point 2, ride the trend up and exit at Point 3, with tight stop losses for maximum profit. This is where the AB=CD Secret Pattern comes in. Copyright

6 The AB=CD Secret Pattern The AB=CD Secret Pattern is an extremely powerful chart setup pattern which relies on Fibonacci ratio geometry giving the pattern a very high degree of accuracy. I do not intend to go into the basics of Fibonacci and refer you to for further information. The AB=CD Secret Pattern was originally identified by Larry Pasevento. Larry is regarded as one of the best traders in the world and is in fact referred to as the "Million Dollar Day Trader". Larry uses the sacred geometry of triangles to trade the markets. You will already know from that just about any swing pattern can be explained by the Fibonacci ratios of.618,.786, 1.0, 1.27 and So here is the basic AB=CD Secret Pattern. Fig 4 At first appearance it looks just like a Pattern. However, the devil is in its detail. The principal is that AB is an impulsive wave in the market. BC is a retracement of AB and will usually be a 61.8% (.618) retracement of AB but should not exceed a 78.6% (.718) retracement of AB. If it exceeds 78.6% the AB=BC Secret Pattern is negated. CD will then be the next wave and be equal to AB (1:1) or be a 1.27 or extension of AB. So when trading, you look for chart patterns which have performed the ABC formation and plot exit Point D which will be equal to AB or be a 1.27 or extension of AB. Do you see how you are beginning to predict the next market turn before it occurs. Copyright
7 Just consider the power of this formation. The market dropped from 1295 to 1260 forming the AB wave. The market then retraced to 1287 forming the BC wave. The BC was precisely.786 of the AB wave. The market then dropped from 1287 to In this case CD=AB and did not extend to 1.27 which would have been a 1.27 extension of AB. If you had entered at 1287 and set a stop loss at 1298 and limit order at the 1:1 point you would have taken 35 points out. That would have been a clear $350 profit. Here s another excellent point to the AB=CD Secret Pattern. Had you gone short at 1287 and set a stop loss at Even if the stop had been taken out and the complete AB=CD Secret Pattern negated your maximum loss would have been 12 points. That s a $120 loss at maximum. Do you see how the probability and risk/reward is staked in your favour? On the other hand had you traded the Pattern you would have gone short at point D. However, the market retraced back to 1295 and you would have made a loss of $350. Again the Pattern failed and the AB=CD Secret Pattern produces a profit. There are 2 ways to seek confirmation that this pattern is occurring: 1. The first involves applying Price and Time analysis. This in itself is a very large topic and I am only going to touch on the subject. The basis behind it is AB has a time distance of T1. In this particular trade that is 10 bars. If we know point C we can establish from that point where the milestone 1.0, 1.27 or may be hit. Usually T1=T2. This would be a 1:1 measured move. However T2 can also be a 1.27 or extension of T1. In other words, it can be 13 bars or 16 bars. This therefore gives you extra geometry where the exit milestone could be. (If this sounds complicated it will become clearer in the following examples). 2. Another confirmatory signal is to look at the bigger picture. Does Point D hit another Fibonacci retracement in the bigger time frame? So if you are a day trader what does the daily time frame show? Do the exit points hit the same Fibonacci points? Is there resistance and support at these bigger time frame points? What you are looking for here is confirmation that the probability is in your favour and the AB=CD Secret Pattern is holding true. Here are some long and short examples of the AB=CD Secret Pattern manifesting itself: Copyright

8 Daily Trading Fig 5 Fig 5 is the daily Gold. You can see how the ABC formation took place with a 78.6 retracement of the AB wave. The market then extended to Point C which was a 1.27 extension of the wave AB. Effectively you would have gone short at with a stop loss at Point C would have hit a price of 570. That would have been a profit of 92.5 points. Had you traded the Pattern you would have gone short at with a stop loss at 645. However the market reversed retesting your entry point. You will now have to wait for to be taken out and extended to go into profit. Again, the AB=CD Secret Pattern produces profit whilst the Pattern losses out. Copyright

9 Fig 6 Fig 6 is the daily chart for Google. In August 2006 the ABC formation occurred. The market formed wave AB and then retraced to Point C which was 78.6 of the wave AB. You would have entered on the close of the next candlestick at Your stop loss would have been set at 362. In this case whilst the market did not close at the 1:1 point it did test it. Above I set out that you can seek confirmation on Point C by looking at the bigger picture. On the right of the chart is.386. This was the.386 point on the larger Fibonacci retracement picture which clearly supported the AB=CD Secret Pattern. If you had exited at 388 you would have made a clear profit of 27 points. You will also see the wave AB is 4 bars and wave CD is 5 bars. There is clear 1:1 symmetry in the market. However, had you followed the traditional Pattern you would have gone at 387 with a stop loss at 368. However, the market reversed and retested 371. Subject to your emotion levels you either would have closed that position out at a loss or held the position open until Point D was taken out at 391. In this case the AB=CD Secret Pattern produces immediate profits whilst the Pattern does eventually produce profit subject to one holding out during the reversal period and allowing the position to turn into profit. Copyright


10 Fig 7 Fig 7 demonstrates a perfect AB=CD Secret Pattern. In this is one pattern which I actually traded for profit! Once the ABC formation occurred at a.786 retracement of the AB wave, the CD wave was a perfect 1:1 extension of the AB wave. Furthermore, the AB wave was 10 bars and the CD wave 11 bars. Again a perfect 1:1 formation. Even if you had gone short at and closed out at , that would have been 197 pips. Trading at $10 a pip would have been $1970 profit for about 10 days work. Fig 8 Copyright


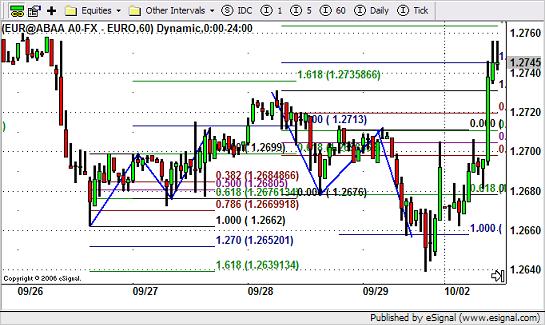
11 Fig 8 represents the /$ as at 9/10/2006. You will see the ABC formation occurred at a.786 retracement of the AB wave. The market closed at However, the AB wave occurred over 24 bars. We will need to wait to see if the CD closes at as shown on the chart. Fig 9 Fig 9 is the /$ as at 10/10/2006. You will see it is heading down to the convergence point D. We await to see whether this occurs for the same time frame as wave AB. Fig 10 Copyright

12 You will that the market as at 12/10/06 is at It may well be that it is testing Point B. I would probably exit my trade here or at least trail my stop loss as I would be in profit if I entered my short where I indicated above. Day Trading In terms of day trading I only trade the AB=CD Secret Pattern using a 60 minute chart. This is by no means a definitive guide to hourly trading. Whilst the AB=CD Secret Pattern still holds true for smaller time frames, for example, the 5 minute chart, it needless to say is more sensitive to price and time and will give you more swing pattern formations. Consider the following examples which by now will be self-explanatory in terms of their ABCD formations and how the formation does not always hold true. /$ Fig 11 Copyright


13 Fig 12 Fig 13 Copyright

14 /$ Fig 14 Fig 15 Copyright


15 Fig 16 S&P 500 Fig 17 Copyright

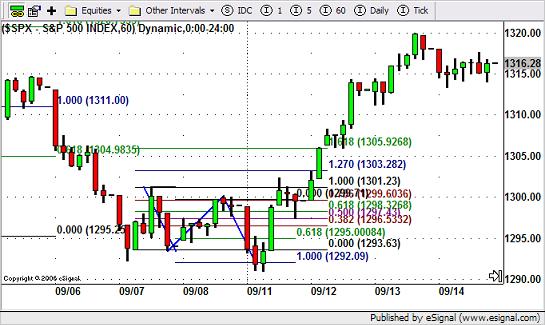
16 Fig 18 Fig 19 Copyright

17 Fig 20 Conclusion I hope you can now see how the AB=CD Secret Pattern represents an excellent low risk profit entry setup allowing you to trade reversals in the market before they occur. You are clearly trading against the crowd in that whilst many traders are waiting for the Pattern to occur to determine their entry into the market, you will already have entered and will be in the process of closing out. You are therefore subject to less manipulation from market makers. You will have seen that the AB=CD Secret Pattern can be traded whether you are day trading, swing trading or position trading. In fact it can be used to trade any market in the world. However consider this, if you enter at Point C on a 78.6% retracement (bearing in mind anything greater may negate the pattern), with a stop loss set at the high or low, your loss can only be 21.4% ( ) on any trade. Hence the low risk profit entry setup. You will also have seen with the correct price and time analysis you can determine your entry and exit with high levels of accuracy ensuring the risk/reward is always in your favour. I hope you are now going to go and apply the AB=CD Secret Pattern to actually trading the markets because in the words of one trader THIS S@#T REALLY WORKS! FREE BONUS VIDEO As a thank you for taking the time to read the AB=CD Secret Pattern I have put all the above information into a comprehensive video which runs through the whole process step by step. To access this FREE video click here. Copyright
Trading the Hidden Divergence. Presented by Sunil Mangwani
 Trading the Hidden Divergence Indicators in technical analysis. Indicators along with chart patterns, trend lines, resistance / support levels etc., are an essential part of technical analysis. But there
Geometry in M and W Patterns: Bryce Gilmore s XABCD Tables
 Geometry in M and W Patterns: Bryce Gilmore s XABCD Tables XABCD Tables: Source: Bryce Gilmore, Price Action Manual [c] 2007, Chapter 19 These tables are designed to immediately highlight the internal
Advanced Trading Systems Collection MACD DIVERGENCE FOREX TRADING SYSTEM
 MACD DIVERGENCE FOREX TRADING SYSTEM 1 This system will cover the MACD divergence. With this forex trading system you can trade any currency pair (I suggest EUR/USD and GBD/USD when you start), and you
This is the complete: Fibonacci Golden Zone Strategy Guide
 This is the complete: Fibonacci Golden Zone Strategy Guide In this strategy report, we are going to share with you a simple Fibonacci Trading Strategy that uses the golden ratio which is a special mathematical
Naked Trading - Double Top Chart Pattern Strategy
 Naked Trading - Double Top Chart Pattern Strategy If you really want to learn a profitable way to trade then look no further, the Double Top chart pattern strategy uses simple and sound trading principles
I prefer to use the CCI indicator to trade divergences and it has worked well for me over the past 10 years.
 Make 100 pips Trading Divergences. There are several ways to trade divergences and several indicators that can help you identify the divergence between price and the indicator itself. I prefer to use the
50 Pips A Day Forex Strategy. How To Build A Solid Trading System. By Laurentiu Damir. Copyright 2012 by Laurentiu Damir
 50 Pips A Day Forex Strategy How To Build A Solid Trading System By Laurentiu Damir Copyright 2012 by Laurentiu Damir All rights reserved. No part of this book may be reproduced or transmitted in any form
Bollinger Bands Forex Trading Strategy With 20 Period Moving Average
 Bollinger Bands Forex Trading Strategy With 20 Period Moving Average The bollinger bands forex trading strategy with 20 period moving average is a very simple forex strategy that works very well for all
When traders make trading decisions based on repeated price patterns that once formed,
 Trading Strategy / Gert.Nurme@iBrokers.ee Price Action Trading Strategy Introduction WHAT IS PRICE ACTION TRADING? When traders make trading decisions based on repeated price patterns that once formed,
The Engulfing Trader Copyright 2014
 Www.ForexWinners.Ru Prologue and Introduction This book is for all those that are just fed up with all the hype out there in the market. So called guru s selling expensive strategies and systems guaranteeing
Free signal generator for traders
 Free signal generator for traders Trader s Bulletin Pivot Point Trading Strategy 1. Just download the FREE tool 2. Key in a few numbers 3. And follow the simple techniques by Mark Rose To make money from
How I Trade Profitably Every Single Month without Fail
 How I Trade Profitably Every Single Month without Fail First of all, let me take some time to introduce myself to you. I am Koon Hwee (KH Lee) and I am a full time currency trader. I have a passion for
3 Price Action Signals to Compliment ANY Approach to ANY Market
 3 Price Action Signals to Compliment ANY Approach to ANY Market Introduction: It is important to start this report by being clear that these signals and tactics for using Price Action are meant to compliment
Trading to WIN Course
 Trading to WIN Course One Day at a Time [C] 2004 Bryce Gilmore NOW supplied in E-BOOK format via email... AUD$ 250 For a limited Time Only - We still have some printed and bound copies available reduced
THE TREND RIDING STRATEGY
 THE TREND RIDING STRATEGY IMPORTANT : As an added bonus for downloading this report, you also received additional free training videos. To access your bonuses, go to: http://www.sublimeforexchampions.com/
Naked Trading and Price Action
 presented by Thomas Wood MicroQuant SM Divergence Trading Workshop Day One Naked Trading and Price Action Risk Disclaimer Trading or investing carries a high level of risk, and is not suitable for all
SuperADX. Written on: October 11 th 2009
 SuperADX Written on: October 11 th 2009 Congratulations on your purchase. And I mean that! You are now in possession of a powerful trading tool. It is what I believe to be the most leading and most profitable
DAILY DAY TRADING PLAN
 DAILY DAY TRADING PLAN Gatherplace will be used to place all of your trades. You will be using the 5 minute chart for the trade setup and the 1 minute chart for your entry, stop and trailing stop.you will
Trade the Price Action By Laurentiu Damir. Copyright 2012 Laurentiu Damir
 Trade the Price Action By Laurentiu Damir Copyright 2012 Laurentiu Damir All rights reserved. No part of this book may be reproduced or transmitted in any form or by any means, electronic or mechanical,
Price Action - The Footprint of the Money Judy MacKeigan - Buffy
 Price Action - The Footprint of the Money Judy MacKeigan - Buffy "What is Price Action?" is a frequently asked question by aspiring traders. Traders who ask, feel it is a well kept secret when all they
The 5-0 Pattern. 50% BC Projection Defines the Pattern s Completion Point:
 The 5-0 Pattern Although I have been aware of the structure for quite some time, the 5-0 Pattern is a relatively new discovery within the Harmonic Trading approach that I have refined immensely over the
2010. Trading Concepts, Inc. All Rights Reserved. For More Information Please Visit
 E-Mini Volume Breakout System By Todd Mitchell For additional information, please go to http://www.eminisuccessformula.com Copyright 2010 by Trading Concepts, Inc. All Rights Reserved. U.S. Government
How I Trade Forex Using the Slope Direction Line
 How I Trade Forex Using the Slope Direction Line by Jeff Glenellis Copyright 2009, Simple4xSystem.net By now, you should already have both the Slope Direction Line (S.D.L.) and the Fibonacci Pivot (FiboPiv)
Risk Disclosure and Liability Disclaimer:
 Risk Disclosure and Liability Disclaimer: The author and the publisher of the information contained herein are not responsible for any actions that you undertake and will not be held accountable for any
Williams Percent Range
 Williams Percent Range (Williams %R or %R) By Marcille Grapa www.surefiretradingchallenge.com RISK DISCLOSURE STATEMENT / DISCLAIMER AGREEMENT Trading any financial market involves risk. This report and
MagicBreakout Forex Trading Strategy
 Tim Trush & Julie Lavrin introduce MagicBreakout Forex Trading Strategy Your guide to financial freedom. Tim Trush, Julie Lavrin, T&J Profit Club, 2007, All rights reserved www.magicbreakout.com Table
MT4 Awesomizer V3. Basics you should know:
 MT4 Awesomizer V3 Basics you should know: The big idea. Awesomizer was built for scalping on MT4. Features like sending the SL and TP with the trade, trailing stops, sensitive SL lines on the chart that
WELCOME
 www.facebook.com/fxdd www.twitter.com/fxdd WELCOME Part 1: Building the Forex Traders Foundation Greg Michalowski Email: greg@fxdd.com www.livestream.com/fxdd www.fxddnow.com Twitter: gregmikefx Disclaimer
Forex Advantage Blueprint
 Forex Advantage Blueprint Complimentary Report!! www.forexadvantageblueprint.com Copyright Protected www.forexadvantageblueprint.com - 1 - Limits of liability/disclaimer of Warranty The author and publishers
The Truth About Fibonacci. Trading
 The Truth About Fibonacci Trading 2 The Truth About Fibonacci Trading The truth about Fibonacci levels is that they are useful (like all trading indicators). They do not work as a standalone system of
Swing Trading Strategies that Work
 Swing Trading Strategies that Work Jesse Livermore, one of the greatest traders who ever lived once said that the big money is made in the big swings of the market. In this regard, Livermore successfully
Trading Patterns For Stocks And Commodities
 Trading Patterns For Stocks And Commodities It doesn t matter if you are a long-term investor, short swing trader or day trader, you are always looking for an advantageous spot to enter your position.
HOW TO PROTECT YOURSELF FROM RISKY FOREX SYSTEMS
 BestForexBrokers.com Identifying Flaws in Profitable Forex Systems HOW TO PROTECT YOURSELF FROM RISKY FOREX SYSTEMS JULY 2017 Disclaimer: BestForexBrokers.com and this report are not associated with myfxbook.com
What Came First... Fundamentals or the Technicals? By Jared Martinez
 What Came First... Fundamentals or the Technicals? By Jared Martinez I am honored to share my thoughts on our methodologies, focusing on the current technical movements and conditions of the FOREX Markets,
Compiled by Timon Rossolimos
 Compiled by Timon Rossolimos - 2 - The Seven Best Forex Indicators -All yours! Dear new Forex trader, Everything we do in life, we do for a reason. Why have you taken time out of your day to read this
McDowell s Special Market Report Using the TradersCoach.com Software Tools
 McDowell s Special Market Report Using the TradersCoach.com Software Tools JULY 2018: Welcome to this month s Market Report! This written report is going to forecast the Dow Jones Industrial Average (hereafter
Resistance to support
 1 2 2.3.3.1 Resistance to support In this example price is clearly consolidated and we can expect a breakout at some time in the future. This breakout could be short or it could be long. 3 2.3.3.1 Resistance
Icoachtrader Consulting Service WELCOME TO. Trading Boot Camp. Day 5
 Icoachtrader Consulting Service www.icoachtrader.weebly.com WELCOME TO Trading Boot Camp Day 5 David Ha Ngo Trading Coach Phone: 1.650.899.1088 Email: icoachtrader@gmail.com The information presented is
If you have traded forex long enough, you will notice that sometimes, price has an uncanny ability to reverse exactly at or around fibonacci levels.
 Fibonacci Forex Trading Strategy With Reversal Candlesticks The Fibonacci forex trading strategy with reversal candlesticks is simply about using fibonacci retracements in conjunction with reversal candlesticks.
So let s get into the meat of the matter. Here s how you are going to become the most successful and profitable Forex trader you know.
 Learn to Trade Forex and Make $250 Every Day *Don't Forget To Take a Look at My Advanced Strategies For Making Over $750 Dollars a Day With Forex -> Go To My Website Click Here The $250 Per Day System
Three skills to help you trade forex
 Three skills to help you trade forex AN INTRODUCTION TO TRADING CURRENCIES A FOREX.com educational guide FOREX.com is a trading name of GAIN Capital UK Limited, FCA No. 113942. Our services include products
Instruction (Manual) Document
 Document") Instruction (Manual) Document This part should be filled by author before your submission. 1. Information about Author Your Surname Your First Name Your Country Your Email Address Your ID on our website
Instruction (Manual) Document This part should be filled by author before your submission. 1. Information about Author Your Surname Your First Name Your Country Your Email Address Your ID on our website
TRADING ACADEMY MODULE-1 MECHANICS OF TRADING SECTION-8 STOP LOSSES. LEVEL- 1: CO M PLETE G UID E TO TRADING FO REX & CF Ds
 TRADING ACADEMY LEVEL- 1: CO M PLETE G UID E TO TRADING FO REX & CF Ds MODULE-1 MECHANICS OF TRADING SECTION-8 STOP LOSSES TRADING ACADEMY LIMITED MODULE-1: SETUP PHASE / THE MECHANICS OF TRADING 2 CONTENTS
Technical Analysis. Used alone won't make you rich. Here is why
 Technical Analysis. Used alone won't make you rich. Here is why Roman sadowski The lesson to take away from this part is: Don t rely too much on your technical indicators Keep it simple and move beyond
Software user manual for all our indicators including. Floor Traders Tools & TrendPro
 Software user manual for all our indicators including Floor Traders Tools & TrendPro All the software was designed and developed by Roy Kelly ARC Systems, Inc. 1712 Pioneer Ave Ste 1637 Cheyenne, WY 82001
Trading Guidelines. Why guidelines and not rules? Because there are no rules.
 Trading Guidelines Why guidelines and not rules? Because there are no rules. 1. Everything that you see is in a gray fog. Nothing is perfectly clear. Close is close enough. If something looks like a reliable
Advanced Trading Systems Collection. 10/21/50 EMA Forex SCALPING SYSTEM
 10/21/50 EMA Forex SCALPING SYSTEM 1 This is a fairly simple method to squeeze money out of the market with short terms trades. With this one we trade the five minute charts, and we rarely hold a trade
FOREX Risk & Money Management. By Low Jie Ji, Research Analyst 1/12/2013. NUS Students Investment Society NATIONAL UNIVERSITY OF SINGAPORE
 FOREX Risk & 1/12/2013 Money Management By Low Jie Ji, Research Analyst NUS Students Investment Society NATIONAL UNIVERSITY OF SINGAPORE Money Management Many traders like to focus on the profit aspect
Technical Analysis Basics. Identifying Tops
 Technical Analysis Basics. Identifying Tops June 2011 1 Sign Up Now to Upshots forex trade signals disclaimer The information provided in this report is for educational purposes only. It is not a recommendation
Welcome to the New York Forex Institute!
 Welcome to the New York Forex Institute! We are excited that you ve decided to take The New York Forex Institute s Professional Training & Certification Course. As you are well aware of, Forex Trading
INTERMEDIATE EDUCATION GUIDE
 INTERMEDIATE EDUCATION GUIDE CONTENTS Key Chart Patterns That Every Trader Needs To Know Continution Patterns Reversal Patterns Statistical Indicators Support And Resistance Fibonacci Retracement Moving
Before I address the harmonic patterns and harmonic ratios that exist in the market, I need to address the Fibonacci series and Fibonacci ratios.
 Full Trading Circle: The Complete Underground Trader System By Jea Yu Copyright 2010 by Jea Yu APPENDIX A HARMONIC PATTERN TRADING by Suri Duddella of Surinotes.com Financial markets exhibit the natural
Technical Analysis. Used alone won't make you rich. Here is why
 Technical Analysis. Used alone won't make you rich. Here is why Roman Sadowski The lesson to take away from this part is: Don t rely too much on your technical indicators Keep it simple and move beyond
EJ_4H Method Part III
 EJ_4H Method Part III Trailing price: Protecting your hard-earned money against reversals or even flurries is one of the most important parts of money management. Most of platforms have such feature that
Three Techniques for Spotting Market Twists and Turns. Riding the Roller
 Three Techniques for Spotting Market Twists and Turns Riding the Roller Coaster Learn to Spot the Twists and Turns Whether you re new to forex or you ve been trading a while, you know how the unexpected
I Always Come Back To This One Method
 I Always Come Back To This One Method I can attribute my largest and most consistent gains to this very method of trading, It always work and never fails although I ve been known to still screw it up once
- My 4 Favorite Trades - Essential Trades of a Professional Trader
 presented by Thomas Wood MicroQuant SM Divergence Trading Workshop Day One - My 4 Favorite Trades - Essential Trades of a Professional Trader Risk Disclaimer Trading or investing carries a high level of
INTRODUCTION 2 INSTALLATION AND CHART SETUP 3 BUY AND SELL ZONES 4 BBOX TICKSPEED INDICATOR 6 TRADING RULES AND CONDITIONS 7
 BLACK-BφX.COM INTRODUCTION 2 INSTALLATION AND CHART SETUP 3 BUY AND SELL ZONES 4 BBOX TICKSPEED INDICATOR 6 TRADING RULES AND CONDITIONS 7 BUY CONDITIONS 7 SELL CONDITIONS 9 IMPORTANT NOTES: 11 TAKE PROFIT
Doing the Right Thing
 Published by TFNN, Corp. ~ 601 Cleveland Street, Ste 618 Clearwater, FL 33755 ~ 1-877-518-9190 ~ http://www.tfnn.com ~ Copyright 2010 ~ All Rights Reserved 02-14-11 Doing the Right Thing Trading is a relatively
Copyright PriceAction5.com
 1 Copyright PriceAction5.com All rights reserved. Unauthorised resell or copying of this material is unlawful. No portion of this ebook may be copied or resold without written permission. PriceAction5.com
The Fish Hook Pattern
 The Fish Hook Pattern GOAL The Fish Hook Pattern is a trade entry method that is mentioned from time to time in Jim s Chartbook and on the Premium Alert Service. The idea behind the Fish Hook is that it
FOREX {BY- SUMIT} Contact me in facebook Sumit das
 FOREX LEARN THE CORE OF PRICE ACTION TRADING FOR CONSISTENT RESULT AND PROFIT WITH 3W SYSTEM {BY- SUMIT} Copy right 2016 Contact me in facebook Sumit das All Rights Reserved. No part of this publication
How To Read Charts Like A Pro Your guide to reading stock charts!
 How To Read Charts Like A Pro Your guide to reading stock charts! Courtesy of Swing-Trade-Stocks.com You may distribute this book FREELY or use it as part of a commercial package as long as this page and
Follow Price Action Trends By Laurentiu Damir Copyright 2012 Laurentiu Damir
 Follow Price Action Trends By Laurentiu Damir Copyright 2012 Laurentiu Damir All rights reserved. No part of this book may be reproduced or transmitted in any form or by any means, electronic or mechanical,
RISK DISCLOSURE STATEMENT / DISCLAIMER AGREEMENT
 RISK DISCLOSURE STATEMENT / DISCLAIMER AGREEMENT Trading any financial market involves risk. This report and all and any of its contents are neither a solicitation nor an offer to Buy/Sell any financial
1 P a g e. Executive Summary
 Executive Summary My call two weeks ago to revoke the major-3 top for the S&P500 based on OEW downtrend confirmations on several indices including the S&P500. was the correct thing today as I was then
Figure 3.6 Swing High
 Swing Highs and Lows A swing high is simply any turning point where rising price changes to falling price. I define a swing high (SH) as a price bar high, preceded by two lower highs (LH) and followed
SCALAR ANALYSIS (S.A.) IN FINANCIAL TECHNICAL TRADING. A View of the Markets in a Different Angle. By Ramoncito D. Ulep, CTA/CPO Investment Advisor
 IN FINANCIAL TECHNICAL TRADING. A View of the Markets in a Different Angle. By Ramoncito D. Ulep, CTA/CPO Investment Advisor") Page 1 of 13 SCALAR ANALYSIS (S.A.) IN FINANCIAL TECHNICAL TRADING A View of the Markets in a Different Angle By Ramoncito D. Ulep, CTA/CPO Investment Advisor FXA USA 40 Wall St. 28 th Floor New York,
Page 1 of 13 SCALAR ANALYSIS (S.A.) IN FINANCIAL TECHNICAL TRADING A View of the Markets in a Different Angle By Ramoncito D. Ulep, CTA/CPO Investment Advisor FXA USA 40 Wall St. 28 th Floor New York,
presented by Thomas Wood MicroQuant SM Divergence Trading Workshop Day One Black Gold
 presented by Thomas Wood MicroQuant SM Divergence Trading Workshop Day One Black Gold Risk Disclaimer Trading or investing carries a high level of risk, and is not suitable for all persons. Before deciding
Before we get to all the details, we are going to look at a couple of trades in the first
 CHAPTER 1 Let s Get Started Before we get to all the details, we are going to look at a couple of trades in the first two chapters. From them you will get a good idea where we are heading, and how we are
TOP 3 INDICATOR BOOT CAMP: PERCENT R
 BIGTRENDS.COM TOP 3 INDICATOR BOOT CAMP: PERCENT R PRICE HEADLEY, CFA, CMT Let s Get Started! Educate Understand the tools you have for trading. Learn what this indicator is and how you can profit from
FOREX PROFITABILITY CODE
 FOREX PROFITABILITY CODE Forex Secret Protocol Published by Old Tree Publishing CC Suite 509, Private Bag X503 Northway, 4065, KZN, ZA www.oldtreepublishing.com Copyright 2013 by Old Tree Publishing CC,
Forex Range Trading With Price Action Forex Trading System By Laurentiu Damir
 Forex Range Trading With Price Action Forex Trading System By Laurentiu Damir Copyright 2012 by Laurentiu Damir All rights reserved. No part of this book may be reproduced or transmitted in any form or
Divergence and Momentum Trading
 presented by Thomas Wood MicroQuant SM Divergence Trading Workshop Day One Divergence and Momentum Trading Risk Disclaimer Trading or investing carries a high level of risk, and is not suitable for all
The Best Gann Fan Trading Strategy
 The Best Gann Fan Trading Strategy The best Gann fan trading strategy is a complex support and resistance trading strategy that uses diagonal support and resistance levels. Unlike the traditional horizontal
USER GUIDE
 USER GUIDE http://www.superprofitscalper.com DISCLAIMER Please be aware of the loss, risk, personal or otherwise consequences of the use and application of this book s content. The author and the publisher
Introduction. About author
 Content Introduction...3 1. Going in the right direction...5 2. Pivot Points...10 3. Camarilla pivot points...27 4. Fibonacci trading...34 Fibonacci trading on higher timeframes...51 5. Pivots and Fibonacci...65
Chart Pattern Secrets
 Chart Pattern Secrets October 04, 2018 Next Alert: 10/09/18 The Trading System: Application of Trading Chart Patterns with Futures and Option Contracts Copyright 1997 All rights reserved. 1 2 3 9/20/18:
NIRVANA. WaveTrader 3 is Here! Breaking News: The Power of Fractals. New Mechanical Strategies are Yielding Stellar Results!
 The State Of NIRVANA Breaking News: WaveTrader 3 is Here! The Power of Fractals New Mechanical Strategies are Yielding Stellar Results! See Page 6 INSIDE The Wave Trading Method Seminar PLUS Special Bonus
HOW TO IMPROVE YOUR TRADING RESULTS STRAIGHT AWAY
 GUIDE ON HOW TO IMPROVE YOUR TRADING RESULTS STRAIGHT AWAY Learn an extremely important, yet simple tweak that can dramatically improve your performance IMPROVE YOUR RESULTS TODAY FOTISTRADINGACADEMY.COM
Chart Pattern Secrets
 Chart Pattern Secrets June 14, 2018 Next Alert: 06/19/18 The Trading System: Application of Trading Chart Patterns with Futures and Option Contracts Copyright 1997 All rights reserved. 1 2 3 4 5 5/15/18:
Thinking it s either going to Up or down on the price chart A supply zone or a demand zone
 1 Good peace, joy day.healing on moment at a time. We had a thought. We have all heard of a market. We have all heard of the stock market. All of a sudden when we say that, us humans say wow, that s about
COPYRIGHTED MATERIAL. Index. P1:a/b P2:c/d QC:e/f T1:g ind JWBK244-Miner August 14, :52 Printer: Yet to come
 Index A AA. See American Airlines ABC (simple) correction, 58 64 followed by new lows, 61 guidelines, 60 momentum reversal, 81 price targets, 100 ABC zigzag, 58 Alternate price projection (APP) external,
Tips for Traders 6/1/ :13:00 AM How to Catch a Trade in a Vertically-Trending Market
 Tips for Traders 6/1/2009 10:13:00 AM How to Catch a Trade in a Vertically-Trending Market One of the most exhilarating rides we can take as traders is when a profitable position we have on goes vertical.
6 TRADE SETUPS YOU CAN START USING RIGHT NOW. includes: Ryan's top charting patterns
 6 TRADE SETUPS YOU CAN START USING RIGHT NOW includes: Ryan's top charting patterns SharePlanner's Top Setups for TRADING LONG & SHORT Far too often we clutter our trading strategy with hundreds of different
Never Loss Trading Review
 Never Loss Trading Review By Larry Jacobs One of the speakers at the Traders World Online Expo #12, Thomas Barmann of NeverLossTrading.com gave an excellent presentation and I was impressed with it. If
No-BS Trading System
 No-BS Trading System Techniques The Professionals Don t Want To Be Revealed DISCLAIMER U.S. Government Required Disclaimer - Commodity Futures Trading Commission Futures and Options trading has large potential
Core CFD trading skills
 chapter 7 Core CFD trading skills In this chapter we examine the core skills that you need to develop to trade successfully. Mastering these core competencies is essential to mastering CFD trading. It
Data-Driven Trading. Market Adaptation. Stocks & Commodities V. 29:12 (34-39): Data-Driven Trading by Steve Palmquist
: Data-Driven Trading by Steve Palmquist") be up by the end of the year, and about a quarter thought the market would be down. The second question was, How many of you do not care whether the market is up or down by the end of the year? In the
be up by the end of the year, and about a quarter thought the market would be down. The second question was, How many of you do not care whether the market is up or down by the end of the year? In the
Forex Trading Strategy 10 pips by Rob Booker
 Forex Trading Strategy 10 pips by Rob Booker Contributed by Rob Booker Sun, 09 Dec 2007 04:58:53 MST Currency trading can be like running away from the bear. Trading forex offers more opportunity for fast
Penny Stock Guide. Copyright 2017 StocksUnder1.org, All Rights Reserved.
 Penny Stock Guide Disclaimer The information provided is not to be considered as a recommendation to buy certain stocks and is provided solely as an information resource to help traders make their own
The Stackable Carry Trade
 The Stackable Carry Trade Introduction: The Carry Trade is a relatively popular strategy among Forex traders. The concept is to pair high yielding interest currencies against low interest currencies in
The Boomerang. Introduction. NipThePips Trading Method
 The Boomerang NipThePips Trading Method Introduction This method is what I like to think a mixture of a breakout method, with a little of the classic martingale strategy mixed in. The aim is to go for
charts to also be in the overbought area before taking the trade. If I took the trade right away, you can see on the M1 chart stochastics that the
 When you get the signal, you first want to pull up the chart for that pair and time frame of the signal in the Web Analyzer. First, I check to see if the candles are near the outer edge of the Bollinger
Simple-N-Easy Forex. 7 Great Simple-N-Easy ways to find TURNING POINTS in the Forex Market
 7 Great Simple-N-Easy ways to find TURNING POINTS in the Forex Market Copyright 2014 Expert4x / Alex du Plooy - ALL RIGHTS RESERVED. This ebook may not be reproduced or transmitted in any form whatsoever,
 This material is protected under the Digital Millennium Copyright Act of 1998 and various international treaties. This material may not be replicated and redistributed. You may make one or more copies