The Dog Ate My Home. By: Anirban Basu Sage Policy Group, Inc. On Behalf of MCAA. May 3, 2012
|
|
|
- Egbert Carter
- 6 years ago
- Views:
Transcription
1 The Dog Ate My Home On Behalf of MCAA By: Anirban Basu Sage Policy Group, Inc. May 3, 2012
2 Penny wise, Euro foolish

3 Annual % Change Historic and Projected World Output Growth 2004 through 2013* 6.0% 5.0% 4.0% 4.9% 4.6% 5.2% 5.4% 5.3% 3.9% 3.5% 4.1% 3.0% 2.9% 2.0% 1.0% 0.0% -1.0% -2.0% -0.5% Source: International Monetary Fund * data are projections
4 Top 12 Stock Exchanges 2008 Growth Rank Exchange Index 2008 % Change 3 London SE FTSE % 1 NYSE Group DJI A -33.8% 12 Swiss Exchange Swiss Market -34.2% 9 TSX Group S&P TSX Composite -35.4% 2 Nasdaq NASDAQ Composite -39.6% 8 Bolsa De Medrid Madrid General -40.0% 6 Frankfurt SE DAX -40.2% 4 Tokyo SE Nikkei % 5 Euronext CAC % 11 Hong Kong Exchanges Hang Seng Index -47.9% 10 Borsa Italiana MIBTel -48.5% 7 Shanghai SE Shanghai Composite -65.4% Source: Yahoo! Finance
5 Top 12 Stock Exchanges 2009 Growth Rank Exchange Index 2009 % Change 7 Shanghai SE Shanghai Composite 77.2% 11 Hong Kong Exchanges Hang Seng Index 51.4% 2 Nasdaq NASDAQ Composite 43.7% 9 TSX Group S&P TSX Composite 31.2% 6 Frankfurt SE DAX 29.9% 1 NYSE Group DJI A 26.8% 8 Bolsa De Medrid Madrid General 26.7% 3 London SE FTSE % 5 Euronext CAC % 10 Borsa Italiana FTSE MIB 19.5% 12 Swiss Exchange Swiss Market 18.4% 4 Tokyo SE Nikkei % Source: Yahoo! Finance
6 Top 12 Stock Exchanges 2010 Growth Rank Exchange Index 2010 % Change 2 Nasdaq NASDAQ Composite 16.9% 6 Frankfurt SE DAX 16.1% 9 TSX Group S&P TSX Composite 14.4% 1 NYSE Group DJI A 11.0% 3 London SE FTSE % 11 Hong Kong Exchanges Hang Seng Index 5.3% 12 Swiss Exchange Swiss Market -1.7% 4 Tokyo SE Nikkei % 5 Euronext CAC % 10 Borsa Italiana FTSE MIB -13.2% 7 Shanghai SE Shanghai Composite -14.3% 8 Bolsa De Medrid Madrid General -19.2% Source: Yahoo! Finance
7 Top 12 Stock Exchanges 2011 YTD Growth through Third Quarter Rank Exchange Index % Change 1 NYSE Group DJI A -5.7% 2 Nasdaq NASDAQ Composite -9.0% 3 London SE FTSE % 9 TSX Group S&P TSX Composite -13.5% 8 Bolsa De Medrid Madrid General -14.0% 12 Swiss Exchange Swiss Market -14.1% 4 Tokyo SE Nikkei % 7 Shanghai SE Shanghai Composite -16.0% 6 Frankfurt SE DAX -20.4% 5 Euronext CAC % 11 Hong Kong Exchanges Hang Seng Index -23.6% 10 Borsa Italiana FTSE MIB -26.5% Source: Yahoo! Finance
8 Top 12 Stock Exchanges 2011 Growth Rank Exchange Index % Change 1 NYSE Group DJI A 5.5% 2 Nasdaq NASDAQ Composite -1.8% 3 London SE FTSE % 12 Swiss Exchange Swiss Market -7.8% 9 TSX Group S&P TSX Composite -9.2% 8 Bolsa De Medrid IGBM -14.6% 6 Frankfurt SE DAX -14.7% 5 Euronext CAC % 4 Tokyo SE Nikkei % 11 Hong Kong Exchanges Hang Seng Index -20.0% 7 Shanghai SE Shanghai Composite -21.7% 10 Borsa Italiana FTSE MIB -25.2% Source: Yahoo! Finance
9 All dressed up with no place to go
 105 Industrial")

10 Jan-01 Jul-01 Jan-02 Jul-02 Jan-03 Jul-03 Jan-04 Jul-04 Jan-05 Jul-05 Jan-06 Jul-06 Jan-07 Jul-07 Jan-08 Jul-08 Jan-09 Jul-09 Jan-10 Jul-10 Jan-11 Jul-11 Jan-12 Index (2007 = 100) 105 Industrial Production January 2001 through March Source: Federal Reserve The industrial production index measures the real output of the manufacturing, mining, and electric and gas utilities industries.
 Gross Domestic Product 1990Q1 through 2012Q1 8.0 6.0 4.0 2.0 0.0-2.0-4.0-6.0-8.0 2012Q1: +2.2% -10.")
11 1990Q1 1990Q4 1991Q3 1992Q2 1993Q1 1993Q4 1994Q3 1995Q2 1996Q1 1996Q4 1997Q3 1998Q2 1999Q1 1999Q4 2000Q3 2001Q2 2002Q1 2002Q4 2003Q3 2004Q2 2005Q1 2005Q4 2006Q3 2007Q2 2008Q1 2008Q4 2009Q3 2010Q2 2011Q1 2011Q4 Percent Change from Preceding Period (SAAR) Gross Domestic Product 1990Q1 through 2012Q Q1: +2.2% Source: Bureau of Economic Analysis
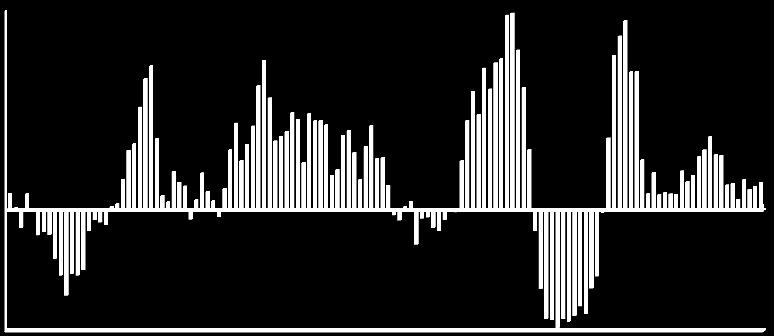
12 Thousands Net Change in U.S. Jobs, BLS January 2001 through March Between March 2011 and March 2012, the nation gained 1,899,000 jobs. 3/12: +120K -900 Jan-12 Sep-11 May-11 Jan-11 Sep-10 May-10 Jan-10 Sep-09 May-09 Jan-09 Sep-08 May-08 Jan-08 Sep-07 May-07 Jan-07 Sep-06 May-06 Jan-06 Sep-05 May-05 Jan-05 Sep-04 May-04 Jan-04 Sep-03 May-03 Jan-03 Sep-02 May-02 Jan-02 Sep-01 May-01 Jan-01 Source: Bureau of Labor Statistics
13 National Nonfarm Employment by Industry Sector Groups March 2011 v. March 2012 Professional and Business Services 597 Education & Health Services 464 Leisure & Hospitality Trade, Transportation, and Utilities Manufacturing 238 Mining and Logging 79 Construction 55 Financial Activities 38 Other Services Information Government All told 1,899K Jobs Gained Thousands, SA Source: Bureau of Labor Statistics
14 Issues with the Federal Budget The automatic sequestration mandated by the Budget Control Act of 2011 is set to begin in January Both defense and non-defense programs will be cut by $54.7 billion each year from 2013 through 2021 a total of approximately $109.3 billion per year or $984 billion through In addition, if Congress does not act by the end of the year, nearly 50 items in the tax code will expire. Among the most significant items are the Bush tax cuts and the payroll tax cut. Bush Tax Cuts: If tax cuts are not extended, approximately 60 percent of taxpayers will see an increase in their tax rate between 3 and 5 percentage points (e.g. a couple that makes $90,000/year will pay an extra $2,700 in federal income taxes). Expiring tax cuts also mean reductions to investment income. If the current rates expire, the tax rate for capital gains would increase from 15 percent to 20 percent and dividends would be taxed as normal income, instead of the current 15-percent rate. Payroll Tax Cut: If allowed to expire, roughly 160 million workers will see a 2 percentage point tax increase in payroll taxes, or an average of $714 or more/year for each worker. The Joint Committee on Taxation reports that the payroll tax cut will save workers $114 billion in 2012.

15 Monthly Net Change (thousands) National Construction Employment Monthly Net Change February 2000 March 2012 Feb-00 Aug-00 Feb-01 Aug-01 Feb-02 Aug-02 Feb-03 Aug-03 Feb-04 Aug-04 Feb-05 Aug-05 Feb-06 Aug-06 Feb-07 Aug-07 Feb-08 Aug-08 Feb-09 Aug-09 Feb-10 Aug-10 Feb-11 Aug-11 Feb Industry Sector Mar-12 Feb-12 Mar-11 1-net 12-net 12-% Construction 5,551 5,558 5, % Residential Building % Nonresidential Building % Heavy and Civil Engineering Construction % Specialty Trade Contractors 3, , , % Source: Bureau of Labor Statistics
16 Employment Growth, U.S. States (SA) March 2012 v. March 2011 Percent Change Rank State % Rank State % Rank State % 1 North Dakota 6.5% 18 West Virginia 1.3% 35 Hawaii 0.6% 2 Oklahoma 2.4% 19 California 1.3% 36 New Mexico 0.6% 3 Utah 2.4% 20 Indiana 1.3% 37 Illinois 0.6% 4 Texas 2.3% 21 Florida 1.2% 38 Nevada 0.4% 5 Louisiana 2.3% 22 Minnesota 1.2% 39 Arkansas 0.4% 6 Arizona 2.1% 23 Ohio 1.2% 40 Nebraska 0.4% 7 Colorado 2.0% 24 Virginia 1.0% 41 South Dakota 0.3% 8 Maryland 2.0% 25 New Jersey 1.0% 42 Delaware 0.3% 9 Kentucky 1.9% 26 North Carolina 1.0% 43 Maine 0.2% 10 District of Columbia 1.8% 27 Wyoming 1.0% 44 Missouri 0.2% 11 New York 1.8% 28 Massachusetts 0.9% 45 Oregon 0.1% 12 Tennessee 1.7% 29 Iowa 0.9% 46 New Hampshire 0.1% 13 Kansas 1.6% 30 Vermont 0.9% 47 Alabama 0.0% 14 Washington 1.6% 31 Georgia 0.8% 48 Mississippi -0.3% 15 Idaho 1.5% 32 Pennsylvania 0.8% 49 Montana -0.3% 16 Michigan 1.4% 33 Alaska 0.7% 50 Rhode Island -0.5% 17 South Carolina 1.3% 34 Connecticut 0.6% 51 Wisconsin -0.9% Source: Bureau of Labor Statistics U.S. Year-over-year Percent Change: 1.5%
17 Unemployment Rates, U.S. States (SA) March 2012 Rank State Rate Rank State Rate Rank State Rate 1 NORTH DAKOTA DELAWARE WASHINGTON NEBRASKA WEST VIRGINIA MICHIGAN SOUTH DAKOTA ALASKA NEW YORK VERMONT TEXAS ARIZONA IOWA LOUISIANA KENTUCKY NEW HAMPSHIRE MAINE OREGON WYOMING NEW MEXICO ILLINOIS OKLAHOMA ALABAMA SOUTH CAROLINA VIRGINIA ARKANSAS FLORIDA MINNESOTA MISSOURI GEORGIA UTAH OHIO MISSISSIPPI KANSAS PENNSYLVANIA NEW JERSEY MONTANA CONNECTICUT NORTH CAROLINA HAWAII COLORADO DISTRICT OF COLUMBIA MASSACHUSETTS IDAHO CALIFORNIA MARYLAND TENNESSEE RHODE ISLAND WISCONSIN INDIANA NEVADA 12.0 Source: Bureau of Labor Statistics U.S. Unemployment Rate: March 12= 8.2%
18 Unemployment Rates, Largest 20 Metros (NSA) February 2012 Rank MSA UR Rank MSA UR 1 Washington-Arlington-Alexandria, DC Philadelphia-Camden-Wilmington, VA-MD-WV PA-NJ-DE-MD Minneapolis-St. Paul-Bloomington, MN- Atlanta-Sandy Springs-Marietta, WI GA Boston-Cambridge-Quincy, MA-NH 6.6 Chicago-Joliet-Naperville, IL-IN- 12 WI San Antonio-New Braunfels, TX 6.8 Miami-Fort Lauderdale-Pompano 12 Beach, FL Dallas-Fort Worth-Arlington, TX 7.1 New York-Northern New Jersey- 15 Long Island, NY-NJ-PA Houston-Sugar Land-Baytown, TX 7.2 San Diego-Carlsbad-San Marcos, 15 CA Baltimore-Towson, MD 7.5 Tampa-St. Petersburg-Clearwater, 17 FL Phoenix-Mesa-Glendale, AZ Detroit-Warren-Livonia, MI Seattle-Tacoma-Bellevue, WA San Francisco-Oakland-Fremont, CA Source: Bureau of Labor Statistics Los Angeles-Long Beach-Santa Ana, CA Riverside-San Bernardino-Ontario, CA
19 Jan-99 Aug-99 Mar-00 Oct-00 May-01 Dec-01 Jul-02 Feb-03 Sep-03 Apr-04 Nov-04 Jun-05 Jan-06 Aug-06 Mar-07 Oct-07 May-08 Dec-08 Jul-09 Feb-10 Sep-10 Apr-11 Nov-11 Thousands, SAAR 2,700 U.S. Housing Starts January 1999 through March ,200 1,700 1, Source: Economy.com
20 Net Percentage of Domestic Respondents Supply and Demand for Commercial Real Estate Loans 1995Q2 through 2012Q1 100 Tightening Standards for Loans 80 Stronger Demand for Loans Source: Federal Reserve

21 Sales ($billions) U.S. Commercial Real Estate Investment Sales 2003 through 2011 $500 $450 $400 $350 $300 $250 $200 $150 $100 $50 $0 Retail Office Industrial Hotel Apartment 2011 Total Investment Sales: $216 billion; Up 55.1% from Source: Real Capital Analytics

22 Dec-07 Feb-08 Apr-08 Jun-08 Aug-08 Oct-08 Dec-08 Feb-09 Apr-09 Jun-09 Aug-09 Oct-09 Dec-09 Feb-10 Apr-10 Jun-10 Aug-10 Oct-10 Dec-10 Feb-11 Apr-11 Jun-11 Aug-11 Oct-11 Dec-11 Feb Architecture Billings Index December 2007 through March Source: The American Institute of Architects

23 Months of Backlog ABC s National Construction Backlog Indicator (CBI) Average 2009Q1 through 2011Q Q4 2011Q4: +9.9% Source: ABC


24 SAAR ($billions) Nonresidential Construction Put-in-Place June 2006 through March 2012 Jun-06 Aug-06 Oct-06 Dec-06 Feb-07 Apr-07 Jun-07 Aug-07 Oct-07 Dec-07 Feb-08 Apr-08 Jun-08 Aug-08 Oct-08 Dec-08 Feb-09 Apr-09 Jun-09 Aug-09 Oct-09 Dec-09 Feb-10 Apr-10 Jun-10 Aug-10 Oct-10 Dec-10 Feb-11 Apr-11 Jun-11 Aug-11 Oct-11 Dec-11 Feb Public Private Oct. 08: $719.0 billion Mar. 12: $556.9 billion -22.5% Source: U.S. Census Bureau

25 National Nonresidential Construction Spending by Subsector March 2012 v. March 2011 Manufacturing Power Commercial Public safety Health care Lodging Office Sewage and waste disposal Educational Highway and street Communication Amusement and recreation Transportation Religious Water supply Conservation and development month %Change Source: U.S. Census Bureau

26 Feb-01 Sep-01 Apr-02 Nov-02 Jun-03 Jan-04 Aug-04 Mar-05 Oct-05 May-06 Dec-06 Jul-07 Feb-08 Sep-08 Apr-09 Nov-09 Jun-10 Jan-11 Aug month % Change Inputs to Construction PPI February March % 10% 5% 0% -5% -10% Source: Bureau of Labor Statistics


27 Jan-01 Aug-01 Mar-02 Oct-02 May-03 Dec-03 Jul-04 Feb-05 Sep-05 Apr-06 Nov-06 Jun-07 Jan-08 Aug-08 Mar-09 Oct-09 May-10 Dec-10 Jul-11 Feb-12 Jan-01 Aug-01 Mar-02 Oct-02 May-03 Dec-03 Jul-04 Feb-05 Sep-05 Apr-06 Nov-06 Jun-07 Jan-08 Aug-08 Mar-09 Oct-09 May-10 Dec-10 Jul-11 Feb month % Change 12-month % Change Jan-01 Aug-01 Mar-02 Oct-02 May-03 Dec-03 Jul-04 Feb-05 Sep-05 Apr-06 Nov-06 Jun-07 Jan-08 Aug-08 Mar-09 Oct-09 May-10 Dec-10 Jul-11 Feb-12 Jan-01 Aug-01 Mar-02 Oct-02 May-03 Dec-03 Jul-04 Feb-05 Sep-05 Apr-06 Nov-06 Jun-07 Jan-08 Aug-08 Mar-09 Oct-09 May-10 Dec-10 Jul-11 Feb month % Change 12-month % Change Key Commodity Prices January March Iron & Steel PPI 40 Softwood Lumber PPI Concrete Products PPI NYMEX Crude Oil Source: BLS: EIA

28 Aug-07 Nov-07 Feb-08 May-08 Aug-08 Nov-08 Feb-09 May-09 Aug-09 Nov-09 Feb-10 May-10 Aug-10 Nov-10 Feb-11 May-11 Aug-11 Nov-11 Feb-12 One-month Percent Change Conference Board Leading Economic Indicators Index August 2007 through March % 1.0% 0.5% 0.0% -0.5% -1.0% March 2012 = 95.7 where 2004= % Source: Conference Board
29 It s difficult to forecast, particularly the future Economy hit a soft patch; 2013 could be very different depending on ; Recession no longer imminent; Black swan threats: (1) Iran (2) Israel/Iran (3) Europe; Many headwinds remain and the nascent recovery could easily falter; and Leading threats to the U.S. recovery are political, not economic.
30 Thank You You can always reach me at If you appreciate this type of information and would like regular updates, please see our newsletter service at Also, if you need us in a hurry, we are at ( SAGE) Please contact us when you require economic research & policy analysis.
The Dog Ate My Home. By: Anirban Basu Sage Policy Group, Inc. January 11, 2012
 The Dog Ate My Home By: Anirban Basu Sage Policy Group, Inc. January 11, 2012 Penny wise, Euro foolish Top 12 Stock Exchanges 2008 Growth Rank Exchange Index 2008 % Change 3 London SE FTSE 100-31.3% 1
I Will Survive. By: Anirban Basu Sage Policy Group, Inc. On Behalf of MACPA. April 29, 2011
 I Will Survive On Behalf of MACPA By: Anirban Basu Sage Policy Group, Inc. April 29, 2011 Joy to the World Annual % Change Historic and Projected World Output Growth 2004 through 2012* 6.0% 5.0% 5.3% 4.4%
Your 19 th Nervous Breakdown
 Your 19 th Nervous Breakdown On Behalf of FAMA/FEMSA By: Anirban Basu Sage Policy Group, Inc. October 6, 2011 Economics of Natural Disasters Economic Costs of Recent Disasters The earthquake and tsunami
Gorfine, Schiller, & Gardyn, P.A. Real Deal Seminar
 Gorfine, Schiller, & Gardyn, P.A. Real Deal Seminar The U.S. and Washington Economies: Current Performance and Near Term Outlook Stephen S. Fuller, PhD Dwight Schar Faculty Chair and University Professor
Transmission of material in this release is embargoed until 8:30 a.m. (EDT) Wednesday, October 31, 2012
 Wednesday, October 31, 2012") Transmission of material in this release is embargoed until 8:30 a.m. (EDT) Wednesday, October 31, USDL-12-2162 Technical information: Media contact: (202) 691-6199 NCSinfo@bls.gov www.bls.gov/ect (202)
Transmission of material in this release is embargoed until 8:30 a.m. (EDT) Wednesday, October 31, USDL-12-2162 Technical information: Media contact: (202) 691-6199 NCSinfo@bls.gov www.bls.gov/ect (202)
Real Deal The U.S. and Washington Area Economic Performance and Outlook
 Real Deal 2011 The U.S. and Washington Area Economic Performance and Outlook Stephen S. Fuller, PhD Dwight Schar Faculty Chair and University Professor Director, Center for Regional Analysis George Mason
Back to the Future Part II
 Back to the Future Part II On Behalf of The Greater Cumberland Committee By: Anirban Basu Sage Policy Group, Inc. September 4 th, 2014 Raging Bull (1980) Estimated Growth in Output by Select Global Areas
Going Up for the Rebound
 Going Up for the Rebound On Behalf of ICSC By: Anirban Basu Sage Policy Group, Inc. September 23, 2013 First Pitch Historic and Projected World Output Growth 2004 through 2014* Annual % Change 6.0% 5.0%
Back to the Future Part II
 Back to the Future Part II On Behalf of The Loudoun County Chamber of Commerce By: Anirban Basu Sage Policy Group, Inc. October 21 st, 2014 Raging Bull (1980) Estimated Growth in Output by Select Global
Back to the Future Part II
 Back to the Future Part II On Behalf of The Southeastern Construction Owners & Associates Roundtable, Inc. By: Anirban Basu Sage Policy Group, Inc. May 1 st, 2014 Raging Bull (1980) Annual % Change Historic
Back to the Future Part II
 Back to the Future Part II On Behalf of FEMSA/FAMA By: Anirban Basu Sage Policy Group, Inc. October 2 nd, 2014 Raging Bull (1980) Es2mated Growth in Output by Select Global Areas 2014 Projected* Advanced
CoreLogic Equity Report
 CoreLogic Equity Report REPORT NATIONAL OVERVIEW Equity Distribution Improves as Price Gains Extend from 2012 into 2013 850,000 Residential Properties Returned to Positive Equity During the First Quarter
Back to the Future Part II
 Back to the Future Part II On Behalf of Mid-Atlantic Society of Healthcare Materials Management By: Anirban Basu Sage Policy Group, Inc. January 24, 2014 Raging Bull (1980) Annual % Change Historic and
Back to the Future Part II
 Back to the Future Part II On Behalf of St. Mary s County By: Anirban Basu Sage Policy Group, Inc. August 19 th, 2014 Raging Bull (1980) Estimated Growth in Output by Select Global Areas 2013 Advanced
Brown Sugar: Deriving Satisfaction through Data Analysis
 Brown Sugar: Deriving Satisfaction through Data Analysis By: Anirban Basu Sage Policy Group, Inc. December 20 th, 2018 On Behalf of The Mid-Atlantic CIO Forum Disclaimer: Any resemblance between the presentation
The Pit and the Pendulum
 The Pit and the Pendulum On Behalf of Park City Chamber/Bureau By: Anirban Basu Sage Policy Group, Inc. February 12, 2015 Dawn of the Dead Real GDP Growth, 20 Fastest and Slowest Growing Countries Projected
Insufficient and Negative Equity
 Insufficient and Negative Equity Lack Of Equity Impedes The Real Estate Market Mark Fleming Chief Economist December, 2011 70% 60% 50% 40% 30% Negative Equity Highly Concentrated Negative Equity Share,
Mutual Fund Tax Information
 Mutual Fund Tax Information We have provided this information as a service to our shareholders. Thornburg Investment Management cannot and does not give tax or accounting advice. If you have further questions
Equity Report FOURTH QUARTER 2014
 Equity Report FOURTH QUARTER 2014 Negative equity continued to be a serious issue for the housing market and the U.S. economy at the end of 2014 with 5.4 million homeowners still underwater. We expect
Mutual Fund Tax Information
 2008 Mutual Fund Tax Information We have provided this information as a service to our shareholders. Thornburg Investment Management cannot and does not give tax or accounting advice. If you have further
Union Members in New York and New Jersey 2018
 For Release: Friday, March 29, 2019 19-528-NEW NEW YORK NEW JERSEY INFORMATION OFFICE: New York City, N.Y. Technical information: (646) 264-3600 BLSinfoNY@bls.gov www.bls.gov/regions/new-york-new-jersey
State Individual Income Taxes: Personal Exemptions/Credits, 2011
 Individual Income Taxes: Personal Exemptions/s, 2011 Elderly Handicapped Blind Deaf Disabled FEDERAL Exemption $3,700 $7,400 $3,700 $7,400 $0 $3,700 $0 $0 $0 $0 Alabama Exemption $1,500 $3,000 $1,500 $3,000
Checkpoint Payroll Sources All Payroll Sources
 Checkpoint Payroll Sources All Payroll Sources Alabama Alaska Announcements Arizona Arkansas California Colorado Connecticut Source Foreign Account Tax Compliance Act ( FATCA ) Under Chapter 4 of the Code
Equity Report THIRD QUARTER 2014
 Equity Report THIRD QUARTER 2014 Negative equity continued to decrease in the third quarter as did the level of homes mired in the foreclosure process. This should hopefully translate into less friction
CoreLogic National Foreclosure Report
 CoreLogic National Report s National Overview through The Inventory Is Down 3 Percent Month Over Month and the Rate Is Back to January 2009 Levels The Seriously Delinquent Rate Is Just Under 5 Percent
Income from U.S. Government Obligations
 Baird s ----------------------------------------------------------------------------------------------------------------------------- --------------- Enclosed is the 2017 Tax Form for your account with
Annual Costs Cost of Care. Home Health Care
 2017 Cost of Care Home Health Care USA National $18,304 $47,934 $114,400 3% $18,304 $49,192 $125,748 3% Alaska $33,176 $59,488 $73,216 1% $36,608 $63,492 $73,216 2% Alabama $29,744 $38,553 $52,624 1% $29,744
Get off of My Cloud 7/20/2018. Brown Sugar: Deriving Satisfaction through Data Analysis CONSUMER CONFIDENCE GLOBAL SNAPSHOT
 Brown Sugar: Deriving Satisfaction through Data Analysis By: Anirban Basu Sage Policy Group, Inc. July 16 th, 2018 On Behalf of Michigan Land Title Association Summer Convention Disclaimer: Any resemblance
American Jobs Act - Preventing Teacher Layoffs Estimated Jobs Impact by State
 American Jobs Act - Preventing Teacher Layoffs Estimated Jobs Impact by Funds Allocated Estimate of Jobs Supported for 1 School Year Alabama $ 451,477,775 7,000 Alaska $ 70,483,533 900 Arizona $ 625,502,087
Kentucky , ,349 55,446 95,337 91,006 2,427 1, ,349, ,306,236 5,176,360 2,867,000 1,462
 TABLE B MEMBERSHIP AND BENEFIT OPERATIONS OF STATE-ADMINISTERED EMPLOYEE RETIREMENT SYSTEMS, LAST MONTH OF FISCAL YEAR: MARCH 2003 Beneficiaries receiving periodic benefit payments Periodic benefit payments
STATE TAX WITHHOLDING GUIDELINES
 STATE TAX WITHHOLDING GUIDELINES ( Guardian Insurance & Annuity Company, Inc. and Guardian Life Insurance Company of America (hereafter collectively referred to as Company )) (Last Updated 11/2/215) state
ACORD Forms Updated in AMS R1
 ACORD Forms Updated in AMS360 2017 R1 The following forms will use the ACORD form viewer, also new in this release. Forms with an indicate they were added because of requests in the Product Enhancement
Undocumented Immigrants are:
 Immigrants are: Current vs. Full Legal Status for All Immigrants Appendix 1: Detailed State and Local Tax Contributions of Total Immigrant Population Current vs. Full Legal Status for All Immigrants
Brown Sugar: Deriving Satisfaction through Data Analysis
 Brown Sugar: Deriving Satisfaction through Data Analysis By: Anirban Basu Sage Policy Group, Inc. March 29 th, 2018 On Behalf of The 2018 Carroll County Economic Outlook Disclaimer: Any resemblance between
State Minimum Wage Chart (See below for Local/City Minimum Wage Chart)
") State Current Minimum Wage State Minimum Wage Chart (See below for Local/City Minimum Wage Chart) Maximum Tip Credit Allowed for Tipped Employees Federal $7.25 $5.12 $2.13 Minimum Cash Wage for Tipped
State Current Minimum Wage State Minimum Wage Chart (See below for Local/City Minimum Wage Chart) Maximum Tip Credit Allowed for Tipped Employees Federal $7.25 $5.12 $2.13 Minimum Cash Wage for Tipped
Housing Tax Expenditures and the Economy
 Housing Tax Expenditures and the Economy The GSEs, Housing, and the Economy January 24, 2011 Todd Sinai, The Wharton School Housing tax expenditures cost a lot Tax expenditure Mortgage interest deduction
Pay Frequency and Final Pay Provisions
 Pay Frequency and Final Pay Provisions State Pay Frequency Minimum Final Pay Resign Final Pay Terminated Alabama Bi-weekly or semi-monthly No Provision No Provision Alaska Semi-monthly or monthly Next
Minimum Wage per State
 per State Future and Notes ALABAMA NONE Federal minimum applies. BIRMINGHAM: July 2016 $ 8.50; July 2017: $10.10 ALASKA $8.75 ARIZONA $8.05 ARKANSAS $7.50 Nov. 4 2014 ballot measure approved to raise minimum
The Effect of the Federal Cigarette Tax Increase on State Revenue
 FISCAL April 2009 No. 166 FACT The Effect of the Federal Cigarette Tax Increase on State Revenue By Patrick Fleenor Today the federal cigarette tax will rise from 39 cents to $1.01 per pack. The proceeds
medicaid a n d t h e How will the Medicaid Expansion for Adults Impact Eligibility and Coverage? Key Findings in Brief
 on medicaid a n d t h e uninsured July 2012 How will the Medicaid Expansion for Adults Impact Eligibility and Coverage? Key Findings in Brief Effective January 2014, the ACA establishes a new minimum Medicaid
AIG Benefit Solutions Producer Licensing and Appointment Requirements by State
 3600 Route 66, Mail Stop 4J, Neptune, NJ 07754 AIG Benefit Solutions Producer Licensing and Appointment Requirements by State As an industry leader in the group insurance benefits market, AIG is firmly
Aetna Individual Direct Pay Commissions Schedule
 Aetna Individual Direct Pay Commissions Schedule Cards Issued Broker Rate Broker Tier Per Year 1st Yr 2nd Yr 3+ Yrs Levels 11-Jan 4.00% 4.00% 3.00% Bronze 24-Dec 6.00% 4.00% 3.00% Silver 25-49 8.00% 4.00%
CoreLogic National Foreclosure Report. August With Quarterly Shadow Inventory Supplement
 CoreLogic National Foreclosure Report With Quarterly Shadow Supplement Foreclosures National Overview Seriously Delinquent Mortgages Are at the Lowest Level Since November 2008 Approximately 2.1 Million
Federal Rates and Limits
 Federal s and Limits FICA Social Security (OASDI) Base $118,500 Medicare (HI) Base No Limit Social Security (OASDI) Percentage 6.20% Medicare (HI) Percentage Maximum Employee Social Security (OASDI) Withholding
Sales Tax Return Filing Thresholds by State
 Thanks to R&M Consulting for assistance in putting this together Sales Tax Return Filing Thresholds by State State Alabama Alaska Arizona Arkansas California Colorado Connecticut Delaware Filing Thresholds
Required Training Completion Date. Asset Protection Reciprocity
 Completion Alabama Alaska Arizona Arkansas California State Certification: must complete initial 16 hours (8 hrs of general LTC CE and 8 hrs of classroom-only CE specifically on the CA for LTC prior to
State Income Tax Tables
 ALABAMA 1 st $1,000... 2% Next 5,000... 4% Over 6,000... 5% ALASKA... 0% ARIZONA 1 1 st $10,000... 2.87% Next 15,000... 3.2% Next 25,000... 3.74% Next 100,000... 4.72% Over 150,000... 5.04% ARKANSAS 1
Issue Brief. Sources of Health Insurance and Characteristics of the Uninsured: Analysis of the March 1999 Current Population Survey
 January 2000 Jan. Sources of Health Insurance and Characteristics of the Uninsured: Analysis of the March 1999 Current Population Survey by Paul Fronstin, EBRI EBRI EMPLOYEE BENEFIT RESEARCH INSTITUTE
STATE EMPLOYMENT AND UNEMPLOYMENT JUNE 2018
 For release 10:00 a.m. (EDT) Friday, July 20, USDL-18-1183 Technical information: Employment: Unemployment: Media contact: (202) 691-6559 sminfo@bls.gov www.bls.gov/sae (202) 691-6392 lausinfo@bls.gov
NCSL Midwest States Fiscal Leaders Forum. March 10, 2017
 NCSL Midwest States Fiscal Leaders Forum March 10, 2017 Public Pensions: 50-State Overview David Draine, Senior Officer Public Sector Retirement Systems Project The Pew Charitable Trusts More than 40 active,
State Corporate Income Tax Collections Decline Sharply
 Corporate Income Tax Collections Decline Sharply Nicholas W. Jenny and Donald J. Boyd The Rockefeller Institute Fiscal News: Vol. 1, No. 3 July 26, 2001 According to a report from the Congressional Budget
Polling Question 1: What is the biggest factor hurting small businesses in California?
 Polling Question 1: What is the biggest factor hurting small businesses in California? 1. The loss of home equity and less ability to tap it 2. Tight lending conditions especially on credit cards 3. Labor
36 Million Without Health Insurance in 2014; Decreases in Uninsurance Between 2013 and 2014 Varied by State
 36 Million Without Health Insurance in 2014; Decreases in Uninsurance Between 2013 and 2014 Varied by State An estimated 36 million people in the United States had no health insurance in 2014, approximately
Age of Insured Discount
 A discount may apply based on the age of the insured. The age of each insured shall be calculated as the policyholder s age as of the last day of the calendar year. The age of the named insured in the
Confronting the UI Solvency Crisis
 Confronting the UI Solvency Crisis Andrew Stettner Deputy Director Serious UI Financing i Crisis i UI programs are set up to be self-financing. State funds are deposited in and guarded by the U.S. Treasury,
MEDICAID BUY-IN PROGRAMS
 MEDICAID BUY-IN PROGRAMS Under federal law, states have the option of creating Medicaid buy-in programs that enable employed individuals with disabilities who make more than what is allowed under Section
PAY STATEMENT REQUIREMENTS
 PAY MENT 2017 PAY MENT Alabama Alaska Arizona Arkansas California Colorado Connecticut Delaware District of Columbia Florida Georgia No generally applicable wage payment law for private employers. Rate
State, Local and Net Tuition Revenue Supporting General Operating Expenses of Higher Education, U.S., Fiscal Year 2010, Current (unadjusted) Dollars
 Dollars") State, Local and Net Tuition Revenue Supporting General Operating Expenses of Higher Education, U.S., Fiscal Year 2010, Current (unadjusted) Dollars Net Tuition $51.3 Billion 37% All State Support $73.7
State, Local and Net Tuition Revenue Supporting General Operating Expenses of Higher Education, U.S., Fiscal Year 2010, Current (unadjusted) Dollars Net Tuition $51.3 Billion 37% All State Support $73.7
STATE AND FEDERAL MINIMUM WAGES
 2017 STATE AND FEDERAL MINIMUM WAGES STATE AND FEDERAL MINIMUM WAGES The federal Fair Labor Standards Act (FLSA) establishes minimum wage and overtime requirements for most employers in the private sector
STATE EMPLOYMENT AND UNEMPLOYMENT OCTOBER 2018
 For release 10:00 a.m. (EST) Friday, November 16, USDL-18-1826 Technical information: Employment: Unemployment: Media contact: (202) 691-6559 sminfo@bls.gov www.bls.gov/sae (202) 691-6392 lausinfo@bls.gov
MINIMUM WAGE INCREASE GUIDE
 2017-2018 MINIMUM WAGE INCREASE GUIDE The Federal minimum wage has been $7.25 since 2009, but many states and localities have passed their own minimum wage laws. Employers must pay non-exempt employees
ACORD Forms in ebixasp (03/2004)
") ACORD Forms in ebixasp (03/2004) Form number Form Name Edition Date 1 Property Loss Notice 2002/1 2 Automobile Loss Notice 2002/1 3 General Liability Notice of Occurrence/Claim 2002/1 4 Workers Compensation
ACORD Forms in ebixasp (03/2004) Form number Form Name Edition Date 1 Property Loss Notice 2002/1 2 Automobile Loss Notice 2002/1 3 General Liability Notice of Occurrence/Claim 2002/1 4 Workers Compensation
The Florida Turnaround Story. Jesse Panuccio DEO Executive Director September 2, 2015
 The Florida Turnaround Story Jesse Panuccio DEO Executive Director September 2, 2015 1 2 Private-Sector Jobs Created December 2010 July 2015, Seasonally Adjusted 917,400 Private Sector Jobs Created 3 Port
2014 STATE AND FEDERAL MINIMUM WAGES HR COMPLIANCE CENTER
 2014 STATE AND FEDERAL MINIMUM WAGES HR COMPLIANCE CENTER The federal Fair Labor Standards Act (FLSA), which applies to most employers, establishes minimum wage and overtime requirements for the private
The Costs and Benefits of Half a Loaf: The Economic Effects of Recent Regulation of Debit Card Interchange Fees. Robert J. Shapiro
 The Costs and Benefits of Half a Loaf: The Economic Effects of Recent Regulation of Debit Card Interchange Fees Robert J. Shapiro October 1, 2013 The Costs and Benefits of Half a Loaf: The Economic Effects
Brown Sugar: Deriving Satisfaction through Data Analysis
 Brown Sugar: Deriving Satisfaction through Data Analysis By: Anirban Basu Sage Policy Group, Inc. April 18 th, 2018 WWEMA On Behalf of Washington Forum 45 th Disclaimer: Any resemblance between the presentation
MINIMUM WAGE INCREASE GUIDE
 2017-2018 MINIMUM WAGE INCREASE GUIDE The Federal minimum wage has been $7.25 since 2009, but many states and localities have passed their own minimum wage laws. Employers must pay non-exempt employees
MINIMUM WAGE WORKERS IN HAWAII 2013
 WEST INFORMATION OFFICE San Francisco, Calif. For release Wednesday, June 25, 2014 14-898-SAN Technical information: (415) 625-2282 BLSInfoSF@bls.gov www.bls.gov/ro9 Media contact: (415) 625-2270 MINIMUM
State Estate Taxes BECAUSE YOU ASKED ADVANCED MARKETS
 ADVANCED MARKETS State Estate Taxes In 2001, President George W. Bush signed the Economic Growth and Tax Reconciliation Act (EGTRRA) into law. This legislation began a phaseout of the federal estate tax,
2012 RUN Powered by ADP Tax Changes
 2012 RUN Powered by ADP Tax Changes Dear Valued ADP Client, Beginning with your first payroll with checks dated in 2012, you and your employees may notice changes in your paychecks due to updated 2012
The table below reflects state minimum wages in effect for 2014, as well as future increases. State Wage Tied to Federal Minimum Wage *
 State Minimum Wages The table below reflects state minimum wages in effect for 2014, as well as future increases. Summary: As of Jan. 1, 2014, 21 states and D.C. have minimum wages above the federal minimum
White Paper 2018 STATE AND FEDERAL MINIMUM WAGES
 White Paper STATE AND FEDERAL S White Paper STATE AND FEDERAL S The federal Fair Labor Standards Act (FLSA) establishes minimum wage and overtime requirements for most employers in the private sector and
Recourse for Employees Misclassified as Independent Contractors Department for Professional Employees, AFL-CIO
 Recourse for Employees Misclassified as Independent Contractors Department for Professional Employees, AFL-CIO State Relevant Agency Contact Information Online Resources Online Filing Alabama Department
A d j u s t e r C r e d i t C E I n f o r m a t i o n S T A T E. DRI Will Submit Credit For You To Your State Agency. (hours ethics included)
") A d j u s t e r C r e d i t C E I n f o r m a t i o n INSURANCE COVERAGE AND CLAIMS INSTITUTE APRIL 3 5, 2019 CHICAGO, IL Delaware Georgia Louisiana Mississippi New Hampshire North Carolina (hours ethics
A d j u s t e r C r e d i t C E I n f o r m a t i o n INSURANCE COVERAGE AND CLAIMS INSTITUTE APRIL 3 5, 2019 CHICAGO, IL Delaware Georgia Louisiana Mississippi New Hampshire North Carolina (hours ethics
National Foreclosure Report
 National Foreclosure Report AUGUST 20 3.2% In August, the foreclosure inventory was down 3.2 percent from July 20, representing 58 months of consecutive year-over-year declines. Foreclosure inventory fell
Minimum Wage Laws in the States - April 3, 2006
 1 of 15 Wage Laws in the States - April 3, 2006 Note: Where Federal and state law have different minimum wage rates, the higher standard applies. Wage and Overtime Standards Applicable to Nonsupervisory
Impacts of Prepayment Penalties and Balloon Loans on Foreclosure Starts, in Selected States: Supplemental Tables
 THE UNIVERSITY NORTH CAROLINA at CHAPEL HILL T H E F R A N K H A W K I N S K E N A N I N S T I T U T E DR. MICHAEL A. STEGMAN, DIRECTOR T 919-962-8201 OF PRIVATE ENTERPRISE CENTER FOR COMMUNITY CAPITALISM
CoreLogic National Foreclosure Report
 CoreLogic National Foreclosure Report June 2014 3.9% In June, the foreclosure inventory was down 3.9 percent from May 2014, representing 32 months of consecutive year-over-year declines. While 32 straight
Business Planning for the New Economic Era
 Business Planning for the New Economic Era A Quick Overview of the PayNet Database One of the largest databases of private financial obligations: o Over 21 million term debt contracts o Over $1.1 trillion
Motor Vehicle Sales/Use, Tax Reciprocity and Rate Chart-2005
 The following is a Motor Vehicle Sales/Use Tax Reciprocity and Rate Chart which you may find helpful in determining the Sales/Use Tax liability of your customers who either purchase vehicles outside of
Termination Final Pay Requirements
 State Involuntary Termination Voluntary Resignation Vacation Payout Requirement Alabama No specific regulations currently exist. No specific regulations currently exist. if the employer s policy provides
Nation s Uninsured Rate for Children Drops to Another Historic Low in 2016
 Nation s Rate for Children Drops to Another Historic Low in 2016 by Joan Alker and Olivia Pham The number of uninsured children nationwide dropped to another historic low in 2016 with approximately 250,000
Understanding Oregon s Throwback Rule for Apportioning Corporate Income
 Understanding Oregon s Throwback Rule for Apportioning Corporate Income Senate Interim Committee on Finance and Revenue January 12, 2018 2 Apportioning Corporate Income Apportionment is a method of dividing
Update: 50-State Survey of Retiree Health Care Liabilities Most recent data show changes to benefits, funding policies could help manage rising costs
 A fact sheet from Dec 2018 Update: 50-State Survey of Retiree Health Care Liabilities Most recent data show changes to benefits, funding policies could help manage rising costs Getty Images Overview States
NOTICE TO MEMBERS CANADIAN DERIVATIVES CORPORATION CANADIENNE DE. Trading by U.S. Residents
 NOTICE TO MEMBERS CANADIAN DERIVATIVES CORPORATION CANADIENNE DE CLEARING CORPORATION COMPENSATION DE PRODUITS DÉRIVÉS NOTICE TO MEMBERS No. 2002-013 January 28, 2002 Trading by U.S. Residents This is
Committee on Ways and Means Democrats
 DRAFT Committee on Ways and Means Democrats Representative Sandy Levin - Ranking Member Report November 7, 2013 Millions of Unemployed Americans Will Lose Benefits Unless Congress Acts Over 3 Million Will
STATE EMPLOYMENT AND UNEMPLOYMENT JANUARY 2019
 For release 10:00 a.m. (EDT) Monday, March 11, 2019 USDL-19-0398 Technical information: Employment: Unemployment: Media contact: (202) 691-6559 sminfo@bls.gov www.bls.gov/sae (202) 691-6392 lausinfo@bls.gov
The Economist Who Loved Me
 The Economist Who Loved Me On Behalf of Maryland Government Finance Officers Association Winter Conference By: Anirban Basu Sage Policy Group, Inc. January 29 th, 2016 The World is Not (Growing) Enough
S T A T E TURNING THE TABLES ON PLAINTIFFS IN TRUCKING LITIGATION APRIL 26 27, 2018 CHICAGO, IL. DRI Will Submit Credit For You To Your State Agency
 A d j u s t e r C r e d i t C E I n f o r m a t i o n TURNING THE TABLES ON PLAINTIFFS IN TRUCKING LITIGATION APRIL 26 27, 2018 CHICAGO, IL Delaware Georgia Louisiana Mississippi New Hampshire North Carolina
Barriers to Accessing Homeownership Down Payment, Credit, and Affordability November 2017 HOUSING FINANCE POLICY CENTER
 HOUSING FINANCE POLICY CENTER Barriers to Accessing Homeownership Down Payment, Credit, and Affordability November 2017 Laurie Goodman, Alanna McCargo, Edward Golding, Bing Bai, Bhargavi Ganesh, and Sarah
Q309 NATIONAL DELINQUENCY SURVEY FROM THE MORTGAGE BANKERS ASSOCIATION. Data as of September 30, 2009
 NATIONAL DELINQUENCY SURVEY FROM THE MORTGAGE BANKERS ASSOCIATION Q309 Data as of September 30, 2009 2009 Mortgage Bankers Association (MBA). All rights reserved, except as explicitly granted. Data are
CALCULATING THE SUPPLEMENTAL NUTRITION ASSISTANCE PROGRAM (SNAP) PROGRAM ACCESS INDEX: A STEP-BY-STEP GUIDE FOR 2016
 PROGRAM ACCESS INDEX: A STEP-BY-STEP GUIDE FOR 2016") USDA ~ United States Department of Agriculture Food and Nutrition Service February 2018 CALCULATING THE SUPPLEMENTAL NUTRITION ASSISTANCE PROGRAM (SNAP) PROGRAM ACCESS INDEX: A STEPBYSTEP GUIDE FOR 2016
USDA ~ United States Department of Agriculture Food and Nutrition Service February 2018 CALCULATING THE SUPPLEMENTAL NUTRITION ASSISTANCE PROGRAM (SNAP) PROGRAM ACCESS INDEX: A STEPBYSTEP GUIDE FOR 2016
Q Homeowner Confidence Survey Results. May 20, 2010
 Q1 2010 Homeowner Confidence Survey Results May 20, 2010 The Zillow Homeowner Confidence Survey is fielded quarterly to determine the confidence level of American homeowners when it comes to the value
A d j u s t e r C r e d i t C E I n f o r m a t i o n S T A T E. DRI Will Submit Credit For You To Your State Agency. (hours ethics included)
") A d j u s t e r C r e d i t C E I n f o r m a t i o n STRIKING BACK AGAINST THE REPTILE IN MEDICAL MALPRACTICE AND LONG TERM CARE CASES JUNE 13, 2018 CHICAGO, IL S T A T E Delaware Georgia Louisiana Mississippi
A d j u s t e r C r e d i t C E I n f o r m a t i o n STRIKING BACK AGAINST THE REPTILE IN MEDICAL MALPRACTICE AND LONG TERM CARE CASES JUNE 13, 2018 CHICAGO, IL S T A T E Delaware Georgia Louisiana Mississippi
State Postal Abbreviation Codes
 State Postal Areviation Codes State Areviation State Areviation Alaama AL Montana MT Alaska AK Neraska NE Arizona AZ Nevada NV Arkansas AR New Hampshire NH California CA New Jersey NJ Colorado CO New Mexico
A d j u s t e r C r e d i t C E I n f o r m a t i o n S T A T E. Pending. DRI Will Submit Credit For You To Your State Agency.
 A d j u s t e r C r e d i t C E I n f o r m a t i o n STRIKING BACK AGAINST THE REPTILE IN MEDICAL MALPRACTICE AND LONG TERM CARE CASES JUNE 13, 2018 CHICAGO, IL P O S T S E M I N A R A C T I O N Delaware
EMPLOYMENT COST INDEX MARCH 2011
 Transmission of material in this release is embargoed until 8:30 a.m. (EDT) Friday, April 29, USDL-11-0586 Technical information: Media contact: (202) 691-6199 NCSinfo@bls.gov www.bls.gov/ect (202) 691-5902
DFA INVESTMENT DIMENSIONS GROUP INC. DIMENSIONAL INVESTMENT GROUP INC. Institutional Class Shares January 2018
 DFA INVESTMENT DIMENSIONS GROUP INC. DIMENSIONAL INVESTMENT GROUP INC. Institutional Class Shares January 2018 Supplementary Tax Information 2017 The following supplementary information may be useful in
Q209 NATIONAL DELINQUENCY SURVEY FROM THE MORTGAGE BANKERS ASSOCIATION. Data as of June 30, 2009
 NATIONAL DELINQUENCY SURVEY FROM THE MORTGAGE BANKERS ASSOCIATION Q209 Data as of June 30, 2009 2009 Mortgage Bankers Association (MBA). All rights reserved, except as explicitly granted. Data are from
Federal Registry. NMLS Federal Registry Quarterly Report Quarter I
 Federal Registry NMLS Federal Registry Quarterly Report 2012 Quarter I Updated June 6, 2012 Conference of State Bank Supervisors 1129 20 th Street, NW, 9 th Floor Washington, D.C. 20036-4307 NMLS Federal