3rd quarter 2010 Oslo, 27 October 2010
|
|
|
- Samantha Chapman
- 5 years ago
- Views:
Transcription

1 3rd quarter 2010 Oslo, 27 October 2010
2 3RD QUARTER 2010 Agenda Highlights and key figures Olav Line Financial update Svein Hov Skjelle Markets and operations Olav Line Strategy for long-term value creation Olav Line Closing remarks Olav Line Q&A session 1 3Q 2010

3 3rd quarter 2010 HIGHLIGHTS AND KEY FIGURES
 Profit before tax NOK 140.7 million (NOK 241.")

4 HIGHLIGHTS AND KEY FIGURES Focus on long-term value creation Positive results from continued operations Profit before fair value adjustments and tax of NOK 86.1 million (155% up from 3Q 2009) Profit before tax NOK million (NOK million) Final agreement on sale of Norgani Hotels, separation to be completed in 4Q 2010 net loss in 3Q of NOK million Improved financial position; Net LTV reduced from 72.4% to 69.6%, will decrease to 67.4% after sale (63.4% if including vendor financing) Focusing on long term value creation Established financial framework and targets Process for insourcing of property management on track Plans for redevelopment of key properties established 3 3Q 2010
5 3rd quarter 2010 FINANCIAL UPDATE
6 FINANCIAL UPDATE Income statement NOK million 3Q Q 2009 YTD 2010 YTD Gross rental income Maintenance and property related cost Administrative and group expenses Operating result before value adjustment Net financial items excluding derivatives Profit before value adjustments Net gain on disposals Net gain/loss on value adjustments, investment properties Change in market value of financial derivatives Profit before income tax for continued operations Income tax for continued operations Profit for the period for continued operations Profit for discontinued operations Profit for the period Earnings per share (NOK), from continued operations Q 2010

7 FINANCIAL UPDATE Sale of Norgani Hotels AS Agreements Preliminary agreement in August 2010 Unconditional Sale and Purchase Agreement signed in October 2010 Closing of transaction on 4 November 2010 Financial effect Net result of NOK million from discontinued operations in 3Q 2010 Gross cash release of NOK million, of which NOK 600 million granted as vendor financing NOK 400 million for 5 years, NOK 200 million for 2 years Fixed interest of 5% p.a. Secured by first priority pledge of Norgani Hotels AS shares and guarantee from buyer NOK million used for repayment of OPAS acquisition facility NOK million immediate cash release for Norwegian Property at closing Option to acquire up to 9.9% of the shares in Norgani Hotels AS Option expires 31 December 2010 Acquisition price: Norwegian Property sales price plus expenses incurred by buyer Norwegian Property may sell the shares acquired with the option 6 3Q 2010
8 FINANCIAL UPDATE Historical fair value adjustments Fair value adjustment of 0.2% in 3Q Fifth consecutive quarter of positive fair value adjustment Accumulated positive adjustment of 1.4% % Q 2Q 3Q 4Q 1Q 2Q 3Q 4Q 1Q 2Q 3Q Q 2010
9 FINANCIAL UPDATE Portfolio valuation by area External valuation conducted by DTZ RealKapital and Akershus Eiendom Average market rent estimated to be 4.9% (2Q: 4.7%) higher than current payable rents (uplift potential) Positive fair value adjustment of NOK 28 million (+0.2%) Minor adjustments of assumptions Area Total space (m²) Vacancy (%) Duration (years) Valuation Gross rent per year Net yield 1) NOK mill. NOK/m² NOK mill. NOK/m² (%) CBD Skøyen Oslo Fornebu / Lysaker / Majorstuen Nydalen Tøyen / Gardermoen Stavanger Total office portfolio Q ) Based on gross rent and estimated operating expenses of 6%
10 FINANCIAL UPDATE Financial position Interest bearing debt and hedging as of 30 September 2010 NPRO NPRO after sale of Norgani Hotels AS Total interest bearing debt NOK mill Property value (gross of deferred tax at acquisition) NOK mill Loan to value % Net Loan to value 1) % Net Loan to value including vendor financing 2) % Cash and cash equivalents NOK mill Vendor financing NOK mill. 0 Total: Unused committed credit facilities (short and long term) NOK mill Average remaining duration, hedging years Average interest rate (including margin) % Average margin % Average remaining duration, borrowing years Hedging ratio % Q ) Gross interest bearing debt less cash divided by gross property value 2) Gross interest bearing debt less cash and vendor financing divided by gross property value
11 FINANCIAL UPDATE Managing debt and hedging portfolio Duration of debt Target refinancing during first half 2011 Balance of refinancing risk and current low margins Financial key ratios Average interest expense now 5.12% (5.33% at beginning of year) Net loan to value including vendor financing now 63.4% (76.4% at beginning of year) Maturity profile for loans 1) Net loan to value excl. vendor financing 2) Average interest rate 3) NOK Mill. % % Q 2Q 3Q 4Q 1Q 2Q 3Q 4Q 1Q 2Q 3Q Q 2Q 3Q 4Q 1Q 2Q 3Q 4Q 1Q 2Q 3Q > Q ) Maturities in 2010 relate to ordinary amortisations 2) Gross interest bearing debt less cash divided by gross property value 3) Comparable figures, excluding financing of Norgani Hotels AS historically
12 FINANCIAL UPDATE Balance sheet NOK million 3Q Q Investment properties 1) Investment properties held for sale Vendor financing Goodwill Market value financial derivatives (net) Cash and cash equivalents Equity Long term interest bearing debt Short term interest bearing debt Debt related to properties held for sale Deferred tax liability Net other debt Equity ratio 19.5% 20.8% 19.9% Net asset value per share (NOK) 2) Net asset value per share (NOK), EPRA 2) Q ) Net of deferred tax at acquisition 2) Number of shares as of 30 Sep 2009: Number of shares as of 30 Dec 2009: Number of shares as of 30 Sep 2010:
13 FINANCIAL UPDATE Cash flow NOK million 3Q Q 2009 YTD 2010 YTD Cash flow from operating activities Net financial items (excl. fair value adj. and currency gains/loss) Adjusted cash flow from operating activities Cash received from sale of assets Purchase of tangible assets and subsidiaries Cash flow from investment activities Net change in interest bearing debt Capital increases Other financing activities Adjusted cash flow from financing activities Net change in cash Net cash at end of period Held by discontinued operations Net cash at end of period, continued operations Q 2010
14 3rd quarter 2010 MARKETS AND OPERATIONS


15 MARKETS AND OPERATIONS Highlights 3Q 2010 Rental market has turned Positive uplift of 12.5% on the renegotiated contracts 13 contracts of NOK 19.1 million yearly value Vacancy increasing from 3.6% to 4.7% space in the last quarter Kolstadgata 1 accounts for 1.1% space of the portfolio Continued focus on renegotiating contracts expiring during Trend of positive value adjustment of office portfolio maintained 14 3Q 2010
16 MARKETS AND OPERATIONS Oslo office vacancy, new buildings and absorption m² % 13% FORECAST % 11% 7% 8% 8.5% 8% 7.5% 8.5% 400 5% 300 4% 4.5% Net absorbed space (demand) Net new space (supply) Vacant space Q ) Source: Akershus Eiendom - The Norwegia Co er ial Property Market, Autu
17 MARKETS AND OPERATIONS Oslo office rents 16 3Q 2010 Source: Akershus Eiendom - The Norwegia Co er ial Property Market, Autu
18 MARKETS AND OPERATIONS Yield spread still at a high level % bps bps -25 bps 55 bps bps bps bps NOK SWAP 10Y 4.00 NPRO net yield (offices) Pri e tra sa tio yields ¹) Q ) Source: Akershus Eiendom - The Norwegia Co er ial Property Market, Autu
19 MARKETS AND OPERATIONS Portfolio maturity positioned for value creation 5.3 years duration of leases (2Q: 5.3 years) Vacancy at 4.7% (2Q: 3.6%) Yearly rent average of NOK per m² (2Q: NOK per m²) 1) 97% of lease volume is CPI adjusted (cash flow inflation hedge) m² Q % Contract space maturing, last quarter (m²) Vacant space (m²) London City London West End Moscow Düsseldorf OSLO, Paris, Stockholm Berlin, Helsinki, Istanbul, Kiev, Lyon, Munich, Warsaw Rental Growth Slowing Rental Growth Accelerating Volume and average existing rent by year of lease maturity 2) Contract space maturing, per 3Q (m²) Average rent per m² (NOK) 4.7% 4.7% 14.5% 12.5% 14.1% 9.5% 2.3% 4.4% 2.0% 16.5% 4.3% 4.6% ) Entire portfolio, includes all types of spaces 2) Office space only Rents Falling Rents Bottoming Out Jones Lang LaSalle Office Property Clock Madrid Barcelona, Luxembourg Hamburg, Athens Budapest, Edinburgh, Rome Bucharest, Brussels, Frankfurt, Lisbon, Stuttgart Amsterdam, Copenhagen, Dublin, Prague Milan Geneva, St. Petersburg NOK/m²
20 3rd quarter 2010 STRATEGY FOR LONG-TERM VALUE CREATION

21 STRATEGY FOR LONG-TERM VALUE CREATION Sale of Norgani Hotels AS completes the separation process 20 3Q 2010


22 STRATEGY FOR LONG-TERM VALUE CREATION Fully integrated insourcing and focus on development Letting Focus on near and medium term renewals m² in the period 2010 to 2014 So far been mainly as-is, investments will be higher going forward Maximise long-term value creation Property management Development In process of establishing in-house organisation In process of building in-house organisation and management systems From 1 May 2011 NEAS will only manage the Stavanger-portfolio Development Focus on capturing value in existing portfolio Ongoing projects for a number of properties Transactions & financing Long term target of reducing financial risk and increase financial flexibility 21 3Q 2010


23 STRATEGY FOR LONG-TERM VALUE CREATION Where value creation potential is largest Oslo Aker Brygge Tingvalla Kaibygg I Verkstedhallene Terminalbygget Skøyen Drammensveien 134 Nedre Skøyenvei Majorstua Middelthunsgate 17 Stavanger Grenseveien 19/21 Forusbeen Q 2010

24 STRATEGY FOR LONG-TERM VALUE CREATION Aker Brygge Tingvalla m² new construction for multi-restaurant use Planned finished late summer Q 2010


25 STRATEGY FOR LONG-TERM VALUE CREATION Aker Brygge Kaibygg I Single tenant DnB NOR ASA Contract size: m² Lease expiry: Total building size: m² 24 3Q 2010
: 8 10 000 NOK/m² 25")
26 STRATEGY FOR LONG-TERM VALUE CREATION Aker Brygge Kaibygg I in Convert to multi-tenant New corporate lobbies Increase area efficiency by 25% Expected investment (office space): NOK/m² 25 3Q 2010


27 STRATEGY FOR LONG-TERM VALUE CREATION Aker Brygge Verkstedhallene Multi-tenant use Total size: m² (5 200 m² owned by others) 26 3Q 2010


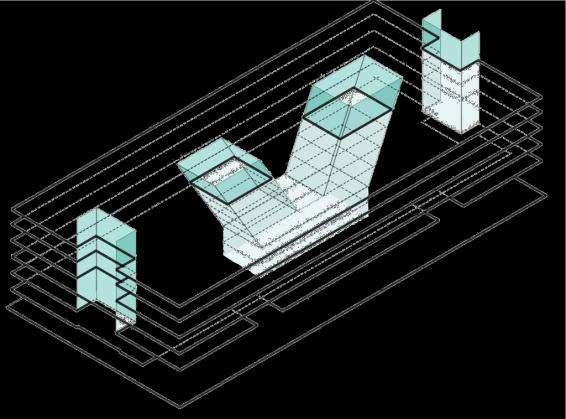
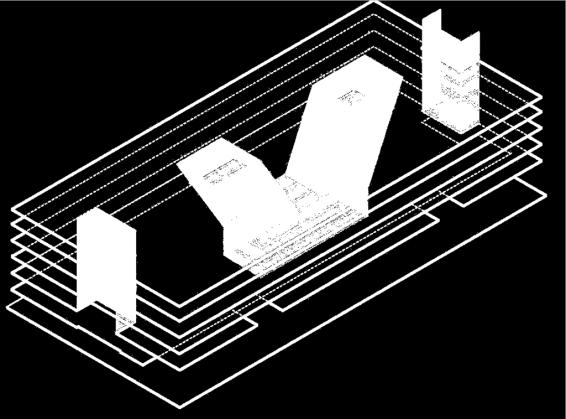
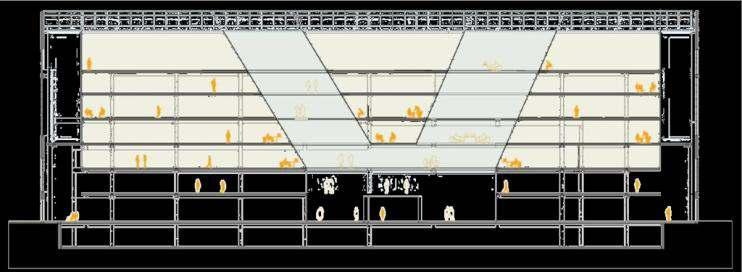
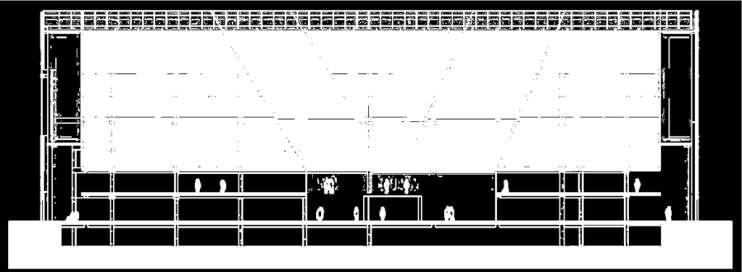


28 STRATEGY FOR LONG-TERM VALUE CREATION Aker Brygge Verkstedhallene in Larger tenants Maintain historic identity New Corporate lobbies Increase area efficiency by 200% Expected investment (office space): NOK/m² 27 3Q 2010

29 STRATEGY FOR LONG-TERM VALUE CREATION Aker Brygge Terminalbygget Multi-tenant Total size: m² Leases expire in Q 2010
: 10 15 000 NOK/m² 29 3Q 2010")
30 STRATEGY FOR LONG-TERM VALUE CREATION Aker Brygge Terminalbygget in Larger tenants New corporate lobbies Increase area efficiency by 25% Increase gross leasing area by 25% Expected investment (office space): NOK/m² 29 3Q 2010
: 21 000 m² 30 3Q")
31 STRATEGY FOR LONG-TERM VALUE CREATION Skøyen Drammensveien 134 Multi-tenant House 1-4 from mid-eighties, in need for refurbishment Total size (1-4): m² 30 3Q 2010


32 STRATEGY FOR LONG-TERM VALUE CREATION Skøyen Drammensveien 134 in New corporate lobby Multi-tenant New identity, state of the art architecture and design Energy class B Extension of floors tie all four buildings together Extension of height Extension of underground parking 31 3Q 2010

33 STRATEGY FOR LONG-TERM VALUE CREATION Skøyen Nedre Skøyen vei Si gle te a t: EDB Busi ess Part er ASA s head offi e Total size : m² Lease expiry: EDB and ERGO Group finalized its merger in October 2010 In need of new head office for employees 32 3Q 2010
.")
34 STRATEGY FOR LONG-TERM VALUE CREATION Skøyen Nedre Skøyen vei future In cooperation with. neighbour property. (Fram Eiendom). Extension of approximately m² In process with planning authorities 33 3Q 2010

35 STRATEGY FOR LONG-TERM VALUE CREATION Majorstua Middelthunsgate 17 Single tenant: Nordea Bank Nordea most likely relocating when contract expires Lease expiry: Total size: m² Expected investment (office space): NOK/m² 34 3Q 2010


36 STRATEGY FOR LONG-TERM VALUE CREATION Majorstua Middelthunsgate horizon gives possibility of re-regulation and higher utilisation 35 3Q 2010

37 STRATEGY FOR LONG-TERM VALUE CREATION Stavanger Grenseveien and Forusbeen HQ Forusbeen Grenseveien Co-locate Statoil cluster at Forus NPRO can offer Statoil work stations in proximity to their HQ 36 3Q 2010


38 STRATEGY FOR LONG-TERM VALUE CREATION Stavanger Grenseveien and Forusbeen Grenseveien Forusbeen NOW work stations 27.3 m² per employee REDEVELOP work stations 16 m² per employee 37 3Q 2010 NOW 735 work stations 24 m² per employee + = REDEVELOP work stations 16.5 m² per employee From work stations To work stations

39 STRATEGY FOR LONG-TERM VALUE CREATION Grenseveien at present 38 3Q 2010
40 STRATEGY FOR LONG-TERM VALUE CREATION Grenseveien future possibility 39 3Q 2010
41 STRATEGY FOR LONG-TERM VALUE CREATION Fully integrated insourcing and focus on development Letting Maximise long-term value creation Property management Development Transactions & financing 40 3Q 2010
 69.2% Net LTV September 2010 (pro forma after sale of Norgani Hotels AS) 67.")
42 STRATEGY FOR LONG-TERM VALUE CREATION Reducing financial risk Long term target of reducing LTV to 55 65% Net LTV December % Net LTV March % Net LTV June % Net LTV September 2010 (continued operations) 69.2% Net LTV September 2010 (pro forma after sale of Norgani Hotels AS) 67.4% Net LTV September 2010 (pro forma after sale including vendor financing) 63.4% Bank refinancing process initiated Target completion during first half year 2011 Balance between current low margins and renewal before expiry Will be facilitated by improved credit ratings DnB NOR Markets, 6 Sep Q 2010 Net LTV is gross interest bearing debt less cash divided by gross property values
43 STRATEGY FOR LONG-TERM VALUE CREATION Investment and financing strategy Investment strategy Focus on the most important office clusters with proximity to traffic junctions Mainly office space but potentially retail space in connection to offices High-quality tenants, diversified maturity profile and high degree of inflation adjustment Focus on key value drivers Letting Operation Development primarily redevelopment and not green field Transactions Return and financing strategy Long-term target of 12% pre-tax return on equity including operational expenses and development Long-term target of dividend payment of 30 50% of profit after tax before value adjustments Initial focus on improving financial situation and execute necessary investments, hence dividend might be somewhat lower than target for a period Board intends to propose a dividend payment of minimum NOK 0.10 on ordinary General Meeting in 2011, subject to completion of refinancing Target of LTV around 55 65% Target of a predictable cash flow requires a relatively high degree of interest rate hedging, range of 50 80% 42 3Q 2010
44 STRATEGY FOR LONG-TERM VALUE CREATION Framework for investments cash flow effects Investments will be value enhancing Start up projects based on new long term leases Return as required in financial framework, targeted return on equity of 12% Increasing gross letting area Payable taxes in this period will be limited due to tax carry forward losses and tax amortisations NPRO will actively pursue asset rotation NOK million Gross indicative investment prospects 2011 (75 150) Vendor financing cash effect 2012 ( ) ( ) 2014 ( ) 2015 ( ) Total ( ) Q 2010
45 3rd quarter 2010 CLOSING REMARKS

46 CLOSING REMARKS Focus on transforming Norwegian Property Stable and improving operations Market recovering Separation completed during 4Q 2010 Industrialisation ongoing Ready for roll out of in-house operations Focus on development potential Continual focus on improving financial flexibility 45 3Q 2010
47 3rd quarter 2010 Q&A SESSION
48 3rd quarter 2010 APPENDIX
49 APPENDIX Norwegian economy at a glance Government Pension Fund Global now worth NOK bn. ($520 bn. / 370 bn.) Guideline for usage allows for counter cyclical spending F 2011F 2012F Unemployment rate (%) Large public sector 4 Inflation YoY in Sep: 1.74% 2 0 Norway Sweden UK Euro area United States GPD per capita (USD) GDP growth (%) F 2011F 2012F Norway Sweden UK Euro area United States United States Euro area United Kingdom Sweden Norway FORECAST F 2011F 2012F 2013F 48 3Q ) Source: International Monetary Fund World e o o i outlook, O to er
 NOK mill. 1 008.")

 % 7.")
 Assuming 6.")
50 APPENDIX Overview and key figures Key figures as of 30 September 2010 Properties # 47 Portfolio size m² Average size per property m² Gross rent per year (run rate) NOK mill Operational expenses per year 1) NOK mill Net rent per year (run rate) NOK mill Average gross rent per m² per year NOK Gross market value NOK mill Average value per property NOK mill. 320 Average value per m² NOK Gross yield, actual % 6.7 Net yield, actual % 6.3 Gross yield, fully let at current market rent 2) % 7.2 Net yield, fully let at current market rent 2) % 6.7 Duration years 5.3 CPI adjustment per 1 Jan 2011 % 97.3 Vacancy % Q ) Assuming 6.0% operating expenses on property level 2) Total portfolio s arket re t has ee assessed y DTZ RealKapital a d Akershus Eiendom to be 4.9% (weighted average) above current contractual rents
51 APPENDIX Largest tenants Tenant Rent (NOK mill.) Duration (years) Share of total portfolio (%) Public sector participation Listed at group level - EDB Business Partner ASA Aker Solutions ASA DnB NOR ASA Nordea StatoilHydro ASA If Skadeforsikring Aker Offshore Partner AS Total E&P Norway AS Höegh Autoliners Management AS Get AS Telenor Eiendom Holding AS NetCom AS SAS Scandinavian Airlines Norge AS Skanska Norge AS Fokus Bank Atea ASA NAV Tieto Norway AS BW Offshore AS Simonsen Advokatfirma DA Økokrim TDC AS Uno-X Energi AS Schibsted Eiendom AS Bugge, Arentz-Hansen & Rasmussen Total 25 largest tenants / / 25 Total other tenants TOTAL ALL TENANTS Q 2010
52 APPENDIX Historical rental uplift 13 new lease agreements resulted in an uplift of 12.5% over existing rent level Estimated uplift potential of 4.9% according to external appraisers NOK mill. Expired contracts New contracts Uplift (%) Q1 Q2 Q3 Q4 Q1 Q2 Q3 Q4 Q1 Q2 Q3 Q4 Q1 Q2 Q % Q ) Entire portfolio, includes all types of spaces 2) Office space only


53 APPENDIX Exposure to prime locations in Oslo 3 properties Total size: m 2 Total value: NOK 2.5 bn. Gross rent: NOK 171 mill. Net yield: 6.4% Duration: 5.6 years Vacancy: 0.0% Lysaker 12 properties Total size: m 2 Total value: NOK 1.9 bn. Gross rent: NOK 130 mill. Net yield: 6.6% Duration: 6.3 years Vacancy: 3.4% Skøyen Majorstuen CBD 2 properties Total size: m 2 Total value: NOK 327 mill. Gross rent: NOK 25 mill. Net yield: 7.3% Duration: 9.3 years Vacancy: 20.7% 52 3Q 2010 Fornebu 11 properties Total size: m 2 Total value: NOK 2.9 bn. Gross rent: NOK 189 mill. Net yield: 6.2% Duration: 6.5 years Vacancy: 9.5% 11 properties Total size: m 2 Total value: NOK 5.4 bn. Gross rent: NOK 344 mill. Net yield: 5.9% Duration: 3.8 years Vacancy: 5.4%

54 APPENDIX CBD Drammensveien 60 Tenant: Skanska Norge AS Total size: m 2 Snekkeriet Tenant: Multi-tenant Total size: m 2 Administrasjonsbygget Tenant: Multi-tenant Total size: m 2 Støperiet Tenant: Sun Restauranter AS Total size: m 2 Ibsenkvartalet Tenant: Multi-tenant Total size: m 2 Stortingsgaten 6 Tenant: Fokus Bank AS Total size: m 2 Terminalbygget Tenant: BA-HR (multi-tenant) Total size: m 2 Dokkbygget Tenant: Multi-tenant Total size: 964 m 2 Verkstedhallene Tenant: Multi-tenant Total size: m 2 Kaibygg II Tenant: Multi-tenant Total size: m 2 Tingvalla Kaibygg I Tenant: DnB NOR Bank ASA Total size: m Q 2010
 Total size: 18 879 m 2 Dokkbygget Tenant: Multi-tenant Total size: 964 m 2 Verkstedhallene Tenant: Multi-tenant Total size: 27 961 m 2")
55 APPENDIX Aker Brygge Snekkeriet Tenant: Multi-tenant Total size: m 2 Støperiet Tenant: Sun Restauranter AS Total size: m 2 Administrasjonsbygget Tenant: Multi-tenant Total size: m 2 Storebrand KLP Terminalbygget Tenant: BA-HR (multi-tenant) Total size: m 2 Dokkbygget Tenant: Multi-tenant Total size: 964 m 2 Verkstedhallene Tenant: Multi-tenant Total size: m 2 Kaibygg II Tenant: Multi-tenant Total size: m 2 Tingvalla Kaibygg I Tenant: DnB NOR Bank ASA Total size: m Q 2010

56 APPENDIX Skøyen Hovfaret 11 Tenant: EDB Business Partner ASA Total size: m 2 Drammensveien 134 Tenant: Leif Höegh co. AS Total size: m 2 6 Tenant: Uno-X Energi AS Total size: m 2 P Nedre Skøyen vei Tenant: EDB Business Partner ASA Total size: m 2 Tenant: none Total size: m 2 2 Drammensveien 149 Tenant: BW Offshore AS Total size: m 2 Tenant: Uno-X Energi AS Total size: m Tenant: TietoEnator ASA Total size: m 2 5 Tenant: Atea AS Total size: m 2 Tenant: Statoil ASA Total size: m Q 2010

57 APPENDIX Nydalen Gjerdrums vei 14 Gjerdrums vei 16 + P Total size: 7120 m 2 Total size: m 2 Tenant: Multi-tenant Tenant: Multi-tenant Maridalsveien 323 Tenant: GET AS Total size: m 2 Gjerdrums vei 17 Tenant: Kilden Helse AS Total size: 803 m 2 Gjerdrums vei 8 Gullhaugveien 9-13 Tenant: Ocè Norge AS Total size: m 2 Tenant: Netcom AS Total size: m 2 Gjerdrums vei 10 D Tenant: Multi-tenant Total size: m 2 Gullhaug Torg 3 Nydalsveien Tenant: Schibsted Eiendom AS Total size: m 2 Total size: m 2 Tenant: Studentenes Hus AS Sandakerveien 130 Tenant: TDC AS Total size: m Q 2010

58 APPENDIX Stavanger Finnestadveien 44 Office: m² Total: m² Badehusgaten Office: m² Total: m² Maskinveien 32 Office: m² Total: m² Strandsvingen 10 Office: m² Total: m² Svanholmen 2 Office: m² Retail: m² Forusbeen 35 Office: m² Total: m² Grenseveien 21 Office: m² Total: m² Grenseveien 19 Office: m² Total: m² 57 3Q 2010
59 APPENDIX Largest shareholders Name Share (%) No. of shares Account type Nationality 1 CANICA AS NOR 2 AWILHELMSEN CAPITAL OMLØP NOR 3 SKANDINAVISKA ENSKIL A/C CLIENTS ACCOUNT NOM SWE 4 FOLKETRYGDFONDET JP MORGAN CHASE BANK NOR 5 BNP PARIBAS SECS SER S/A BP2S LUX/FIM/LUX NOM LUX 6 STATE STREET BANK AN A/C CLIENT OMNIBUS F NOM USA 7 BANK OF NEW YORK MEL S/A BNYM AS EMEA ASI NOM USA 8 STATE STREET BANK & A/C CLIENT FUND NUMB NOM USA 9 SKAGEN VEKST NOR 10 CITIBANK N.A. (LONDO A/C STICHTING PGGM D NOM NLD 11 BANK OF NEW YORK MEL S/A MELLON NOMINEE NOM USA 12 AWILHELMSEN CAPITAL NOR 13 SHB STOCKHOLM CLIENT C/O HANDELSBANKEN AS NOM SWE 14 Reka AS NOR 15 BANK OF NEW YORK MEL S/A ING GLOBAL REAL USA 16 TRONDHEIM KOMMUNALE NOR 17 VITAL FORSIKRING ASA OMLØPSMIDLER NOR 18 FRAM HOLDING AS NOR 19 JPMORGAN CHASE BANK NORDEA TREATY ACCOUN NOM GBR 20 JPMORGAN CHASE BANK NORDEA RE:NON-TREATY NOM GBR Total 20 largest shareholders / 20 NOR 58 3Q 2010 Shareholders as of 25 Oct 2010
60 Disclaimer The information included in this Presentation contains certain forward-looking statements that address activities, events or developments that Norwegian Property ASA ( the Company ) expects, projects, believes or anticipates will or may occur in the future. These statements are based on various assumptions made by the Company, which are beyond its control and are subject to certain additional risks and uncertainties. The Company is subject to a large number of risk factors including but not limited to economic and market conditions in the geographic areas and markets in which Norwegian Property is or will be operating, counterparty risk, interest rates, access to financing, fluctuations in currency exchange rates, and changes in governmental regulations. For a further description of other relevant risk factors we refer to Norwegian Property s Annual Report for As a result of these and other risk factors, actual events and our actual results may differ materially from those indicated in or implied by such forward-looking statements. The reservation is also made that inaccuracies or mistakes may occur in the information given above about current status of the Company or its business. Any reliance on the information above is at the risk of the reader, and Norwegian Property disclaims any and all liability in this respect. 59 3Q 2010
1 st quarter Oslo 5 May 2011
 1 st quarter 2011 Oslo 5 May 2011 1Q 2011 PRESENTATION Agenda Highlights Olav Line Financial update Svein Hov Skjelle Markets and operations Olav Line Closing remarks Olav Line Q&A session HIGHLIGHTS Positive
2 nd quarter Oslo 16 July 2012
 2 nd quarter 2012 Oslo 16 July 2012 ANNOUNCEMENT 16 JULY 2012 New agreements confirms good market activity Lysaker torg 35 Uno-X Energi enters new lease at Lysaker for approx. 2 700 square meters Five
1 st quarter Oslo 4 May 2012
 1 st quarter 2012 Oslo 4 May 2012 1Q 2012 PRESENTATION Agenda Highlights Olav Line Financial update Svein Hov Skjelle Markets and operations Olav Line Closing remarks Olav Line Q&A session HIGHLIGHTS 1Q
3 rd quarter Oslo 26 October 2012
 3 rd quarter 2012 Oslo 26 October 2012 3Q 2012 PRESENTATION Agenda Highlights Olav Line Financial update Svein Hov Skjelle Markets and operations Olav Line Closing remarks Olav Line Q&A session HIGHLIGHTS
3 rd quarter Oslo 27 October 2011
 3 rd quarter 2011 Oslo 27 October 2011 3Q 2011 PRESENTATION Agenda Highlights Olav Line Financial update Svein Hov Skjelle Markets and operations Olav Line Closing remarks Olav Line Q&A session HIGHLIGHTS
4 th quarter Oslo 29 February 2012
 4 th quarter 2011 Oslo 29 February 2012 ANNOUNCEMENT 29 FEBRUARY 2012 New long-term lease with solid tenant at Skøyen Long-term agreement with Statens Pensjonskasse *) to rent office space in Drammensveien
4 th quarter Oslo 15 February 2013
 4 th quarter 2012 Oslo 15 February 2013 4Q 2012 PRESENTATION Agenda Highlights Olav Line Financial update Svein Hov Skjelle Markets and operations Olav Line Closing remarks Olav Line Q&A session HIGHLIGHTS
2 nd quarter Oslo 12 June 2013
 2 nd quarter 2013 Oslo 12 June 2013 2Q 2013 PRESENTATION Agenda Highlights Olav Line Financial update Svein Hov Skjelle Markets and operations Olav Line Closing remarks Olav Line Q & A session HIGHLIGHTS
1 st quarter Oslo 3 May 2013
 1 st quarter 2013 Oslo 3 May 2013 1Q 2013 PRESENTATION Agenda Highlights Olav Line Financial update Svein Hov Skjelle Markets and operations Olav Line Redevelopment projects - status Olav Line Closing
1st quarter 2015 Oslo, 30 April 2015
 1st quarter 2015 Oslo, 30 April 2015 Agenda Highlights Financial update Markets and operations Closing remarks Olav Line Svein Hov Skjelle Olav Line Olav Line Q&A session 2 Revenue growth and increasing
2 nd quarter Oslo 23 August 2011
 2 nd quarter 2011 Oslo 23 August 2011 2Q 2011 PRESENTATION Agenda Highlights Olav Line Financial update Svein Hov Skjelle Markets and operations Olav Line Closing remarks Olav Line Q&A session HIGHLIGHTS
2nd quarter Oslo, 11 July 2014
 2nd quarter 2014 Oslo, 11 July 2014 Agenda Highlights Financial update Markets and operations Closing remarks Olav Line Svein Hov Skjelle Olav Line Olav Line Q&A session HIGHLIGHTS Letting and project
3rd quarter 2017 Oslo, 20 October 2017
 3rd quarter 2017 Oslo, 20 October 2017 Agenda Highlights Financial update Markets and operations Closing remarks Q&A session 2 Q3 in short: Revenues NOK 197,7 million Improving rental markets Earnings
3rd quarter Oslo, 24 October 2014
 3rd quarter 2014 Oslo, 24 October 2014 MILESTONE AKER BRYGGE OFFICIAL OPENING OF NEW SHOPPING STREET 23 OCTOBER 2014 SHOPPING STREET THROUGH STRANDEN 1, STRANDEN 3 AND STRANDEN 5 Indoor shopping street
2nd quarter 2016 Oslo, 12 July 2016
 2nd quarter 2016 Oslo, 12 July 2016 Agenda Highlights Financial update Markets and operations Closing remarks Q&A session 2 Q2 in short: Dividend, revenue growth and increasing Net Asset Value Revenue
2nd quarter 2017 Oslo, 12 July 2017
 2nd quarter 2017 Oslo, 12 July 2017 Agenda Highlights Financial update Markets and operations Closing remarks Q&A session 2 Q2 in short: Revenues NOK 196.5 million Earnings per share (EPS), NOK 0.47 Dividend
FIRST QUARTER Q 2013
 FIRST QUARTER 2013 1Q 2013 IMPORTANT EVENTS IN THE FIRST QUARTER OF 2013 POSITIVE RENTAL MARKET BUT CONVERSION PROJECTS TEMPORARILY IMPACT OPERATION Stable operation, temporary impact from conversion projects
3rd quarter 2018 Oslo, 25 October 2018
 3rd quarter 2018 Oslo, 25 October 2018 Agenda Highlights Markets and operations Financial update Closing remarks Q&A session 2 Q3 in short: Revenues NOK 202 million Earnings per share (EPS) NOK 0.23 Dividend
1st quarter 2018 Oslo, 4 May 2018
 1st quarter 2018 Oslo, 4 May 2018 Agenda Highlights Markets and operations Financial update Closing remarks Q&A session 2 Q1 in short: Revenues NOK 197.1 million Turnover growth for retail Aker Brygge
2nd quarter 2018 Oslo, 13 July 2018
 2nd quarter 2018 Oslo, 13 July 2018 Agenda Highlights Markets and operations Financial update Closing remarks Q&A session 2 Q2 in short: Revenues NOK 198.8 million Earnings per share (EPS) NOK 0.06 Dividend
FINANCIAL REPORT FOR THE SECOND QUARTER AND FIRST HALF OF Q 2012
 FINANCIAL REPORT FOR THE SECOND QUARTER AND FIRST HALF OF 2012 2Q 2012 IMPORTANT EVENTS IN THE SECOND QUARTER AND FIRST HALF OF 2012 CONVERSIONS TEMPORARILY AFFECT OPERATIONS, LETTING MARKET POSITIVE Stable
1st quarter 2017 Oslo, 5 May 2017
 1st quarter 2017 Oslo, 5 May 2017 Agenda Highlights Financial update Markets and operations Closing remarks Q&A session 2 Q1 in short: Revenues NOK 196.6 million Earnings per share (EPS), NOK 0.39 New
NORWEGIAN PROPERTY ASA REPORT FOR THE FOURTH QUARTER 2007
 REPORT FOR THE FOURTH QUARTER - 2007 NORWEGIAN PROPERTY ASA REPORT FOR THE FOURTH QUARTER 2007 HIGHLIGHTS FOR THE QUARTER Rental income was NOK 450.2 million in the fourth quarter of 2007 (NOK 202.5 million
INTERIM REPORT SECOND QUARTER AND FIRST HALF OF 2014
 INTERIM REPORT SECOND QUARTER AND FIRST HALF OF 2014 IMPORTANT EVENTS IN THE SECOND QUARTER OF 2014 GROWING RENTAL INCOME FROM PHASING IN LEASES Rental income up from first to second quarters A number
Presentation DNB Oslo, September 20, 2018
 Presentation DNB Oslo, September 20, 2018 Norwegian Property commercial property Prime long term focus Prime commercial properties in attractive locations Oslo CBD West Oslo Nydalen Focus going forward
INTERIM REPORT SECOND QUARTER AND FIRST HALF 2018
 INTERIM REPORT SECOND QUARTER AND FIRST HALF 2018 IMPORTANT EVENTS IN THE SECOND QUARTER OF 2018 Positive rental income trend for Aker Brygge properties Overall rental income came to NOK 198.8 million,
INTERIM REPORT FIRST QUARTER 2018
 INTERIM REPORT FIRST QUARTER 2018 HIGHLIGHTS IN THE FIRST QUARTER OF 2018 Positive rental income trend for Aker Brygge properties Overall rental income came to NOK 197.1 million, virtually unchanged from
PROPERTY ASA REPORT FOR THE FIRST QUARTER 2007
 REPORT FOR THE FIRST QUARTER - 2007 NORWEGIAN PROPERTY ASA REPORT FOR THE FIRST QUARTER 2007 HIGHLIGHTS FOR THE QUARTER Rental income was NOK 248.6 million and profit before tax was NOK 345.4 million in
PROPERTY ASA REPORT FOR THE SECOND QUARTER 2007
 REPORT FOR THE SECOND QUARTER - 2007 NORWEGIAN PROPERTY ASA REPORT FOR THE SECOND QUARTER 2007 HIGHLIGHTS FOR THE QUARTER Rental income was NOK 243.8 million and profit before tax was NOK 1 141.7 million
NORWEGIAN PROPERTY ASA REPORT FOR THE FIRST HALF YEAR 2008
 REPORT FOR THE FIRST HALF YEAR - 2008 NORWEGIAN PROPERTY ASA REPORT FOR THE FIRST HALF YEAR 2008 HIGHLIGHTS FOR THE QUARTER Net Asset Value per share post equity issue is NOK 39.51. Adjusted Net Asset
Results Q IMPORTANT NOTE: The Results Q do not yet include the asset transfer to FMS-WM as of Oct 1, 2010
 Results Q3 21 IMPORTANT NOTE: The Results Q3 21 do not yet include the asset transfer to FMS-WM as of Oct 1, 21 Investor Relations Presentation November 16, 21 HRE Group Overview Q3 21 pre-tax loss reduced
Bank of Greece 2 nd conference on real estate market. Property valuations during crisis: consequences and risks
 Bank of Greece 2 nd conference on real estate market Property valuations during crisis: consequences and risks Ioannis Ganos MRICS Chairman RICS Hellas Bluehouse Capital Agenda 1. European Economic Environment
PROPERTY ASA REPORT FOR THE FOURTH QUARTER 2006
 REPORT FOR THE FOURTH QUARTER - 2006 NORWEGIAN PROPERTY ASA REPORT FOR THE FOURTH QUARTER 2006 HIGHLIGHTS FOR THE QUARTER Rental income was NOK 202.5 million and profit before tax was NOK 522.4 million
Investment Market Germany. PROVADA 5 th June 2013
 Investment Market Germany PROVADA 5 th June 2013 In Europe, which country/region do you believe to be the most attractive for making investment purchases in 2013? 40 35 2012 2013 2012 (n=341) 2013 (n=361)
Outlook 2015: Europe & Germany
 Part of the M&G Group Outlook 215: Europe & Germany Research presentation 27 th November 214 European Economic Fundamentals Update & Outlook 2 Economic recovery broadening GDP growth by country Q3 214
Real Estate Investment Strategy
 Real Estate Investment Strategy 8th of July, 2015 Alessandro Bronda Head of Global Real Estate Investment Strategy Group Real Estate Zurich s real estate strategy Zurich has a systematic and structured
Interim Results Half Year July 2018
 Interim Results Half Year 2018 July 2018 NSI will be the leading specialist in the Dutch office market, with a strong and efficient platform that will drive returns through pro-active asset management,
Preliminary results th Quarter 2007
 Preliminary results 2007 4th Quarter 2007 15 February 2008 www.npro.no www.norwegianproperty.no Highlights 4th Quarter Stable financial performance in fourth Quarter Rental income of NOK 450.2 million
Will Rising Interest Rates Pummel Your Portfolio?
 Will Rising Interest Rates Pummel Your Portfolio? ULI Fall Meeting Chicago - November 2013 Dr. Richard Barkham, MRICS Global Research Director, Grosvenor Group Eileen Marrinan, CRE Director of Research,
ALLIANZ REAL ESTATE REAL ESTATE INVESTMENTS FROM A GLOBAL INVESTOR S PERSPECTIVE
 ALLIANZ REAL ESTATE REAL ESTATE INVESTMENTS FROM A GLOBAL INVESTOR S PERSPECTIVE Investors Forum 2018 Alexander Gebauer CEO Western Europe Brussels, January 18 th 2018 Vertigo, Luxembourg AGENDA 01 at
PROPERTY EU EUROPEAN LOGISTICS INVESTMENT BRIEFING
 PROPERTY EU EUROPEAN LOGISTICS INVESTMENT BRIEFING RICHARD HOLBERTON, SENIOR DIRECTOR, EMEA RESEARCH, CBRE FEBRUARY 19 TH 2015 AGENDA Economy Market Activity Forecasts Issues ECONOMY 2014 Some Alarms and
The Office Property Handbook 4.0 Investment & Financing Keys Spain 2019
 The Office Property Handbook 4.0 Investment & Financing Keys Spain 2019 February 2019 Financial Advisory I Real Estate 1 of 19 The spanish economy keeps growing and remains stable but a lower pace than
Economic Overview 1.9% 4.9% 1.8% 2.0% 0.5% 2018E 2.4% 1.0% 3.2% 4.1% 1.9%
 MarketBeat Q1 2018 Economic Overview 2018 GDP mainland growth is forecast to be 3.2%, up from 1.9% in 2017. Growth is domestically driven, with increased consumption and mainland investment the main sources.
NOT FOR RELEASE, PUBLICATION OR DISTRIBUTION IN OR INTO THE UNITED STATES, CANADA, JAPAN OR AUSTRALIA. Prospectus. Norwegian Property ASA
 NOT FOR RELEASE, PUBLICATION OR DISTRIBUTION IN OR INTO THE UNITED STATES, CANADA, JAPAN OR AUSTRALIA Prospectus Norwegian Property ASA (Organisation number: 988 622 036) www.npro.no Fully underwritten
Financial Year Kari Inkinen CEO
 Financial Year 2005 Kari Inkinen CEO Strategy Target: to increase business volume and profitability Possible development projects are approximately 300 000 m² Development target 50 meur/year Profitability
2017 HALF YEAR 25 JULY 2017
 2017 HALF YEAR RESULTS 25 JULY 2017 Strong financial results and robust balance sheet Driving performance through operational excellence and disciplined capital allocation High quality pipeline of growth
Shareholder information
 SHAREHOLDER INFORMATION Index 89 06: Shareholder information Share price development in 2009 NOK NOK 60 50 40 30 20 10 0 Jan. Feb. Mar. Apr. May Jun. Jul. Aug. Sept. Oct. Nov. Dec. Introduction p.90 Dividend
Australian capital is it really safer at home?
 HALF IMAGE PLACEMENT HOLDER (HORIZONTAL) Resize image to cover grey box Australian capital is it really safer at home? November 2015 FOR INSTITUTIONAL USE ONLY NOT FOR PUBLIC DISTRIBUTION Contents 8:28
History Shaping the Future: Presentation Title
 History Shaping the Future: Presentation Title Benchmarking and Performance Trends in the Hotel Sector for Strategic Decision Making Subtitle Elizabeth Randall Winkle Managing Director, STR Global Date
9M 2018 RESULTS 09 NOVEMBER 2018 TLG IMMOBILIEN AG 9M 2018 RESULTS
 TLG IMMOBILIEN AG 9M 208 RESULTS DISCLAIMER This presentation includes statements, estimates, opinions and projections with respect to anticipated future performance of TLG IMMOBILIEN ("Forward-Looking
Acta Holding ASA. Interim Report. 2nd quarter th August 2007.
 Acta Holding ASA. Interim Report. 2nd quarter 2007. 15th August 2007. Highlights 2nd quarter 2007 Acta invests in future growth Best second quarter with gross subscriptions of 6,729 million kroner, up
FY2017 Annual General Meeting 19 April 2018
 FY2017 Annual General Meeting 19 April 2018 Agenda Key Highlights About Tikehau Capital European Market Review Portfolio Overview Financial Highlights Conclusion 2 Key Highlights FY2017 Key Highlights
SpareBank 1 SR-Bank ASA 3rd quarter 2014
 SpareBank 1 SR-Bank ASA 3rd quarter 2014 Page 1 Disclaimer This presentation contains forward-looking statements that reflect management s current views with respect to certain future events and potential
Third Quarter 2011 CEO Sverre Hurum CFO Erik Stubø
 15 November 2011 Third Quarter 2011 CEO Sverre Hurum CFO Erik Stubø Disclaimer The information contained in the Presentation is for your use only. Recipients may not reproduce, redistribute or pass on,
Your Aquaculture Technology and Service Partner. Q Presentation Oslo - August 17 th, 2016 Trond Williksen, CEO Eirik Børve Monsen, CFO
 Q2 2016 Presentation Oslo - August 17 th, 2016 Trond Williksen, CEO Eirik Børve Monsen, CFO Agenda 1 Highlights 2 Financial performance 3 Outlook 4 Q&A Highlights Q2 2016 - by CEO Trond Williksen 3 Improved
Interim presentation Third quarter 2014
 Interim presentation Third quarter 2014 Sverre Hurum. CEO Erik Stubø. CFO 12 November 2014 Highlights in the third quarter Revenues and EBIT Reduced revenues from Statoil Operating revenues decreased 2.7
Q May 6, CEO Geir Olsen
 Q1 2010 May 6, 2010 CEO Geir Olsen Highlights Strong market picture in Q1 for OTC Market Services continues to perform well Clearing and Exchange with a weak start of the year Underlying EBITDA of NOK
INVESTOR PRESENTATION
 INVESTOR PRESENTATION Table of Contents Introduction to SEGRO 3 Market drivers 10 High quality development pipeline 15 Balance sheet and financing 21 Operating performance 26 Portfolio overview 30 APP
ELECTROMAGNETIC GEOSERVICES ASA FIRST QUARTER 2014 RESULTS. CEO, Roar Bekker CFO, Svein Knudsen 8 May 2014
 ELECTROMAGNETIC GEOSERVICES ASA FIRST QUARTER 2014 RESULTS CEO, Roar Bekker CFO, Svein Knudsen 8 May 2014 DISCLAIMER This quarterly presentation includes and is based, inter alia, on forward-looking information
MARKETBEAT Q NORWAY
 MARKETBEAT Q1 2017 NORWAY Cushman & Wakefield Realkapital assisted Realkapital Corporate Finance in the purchase 1 of Grønland 34, Drammen 2003 2004 2005 2006 2007 2008 2009 2010 2011 2012 2013 2014 2015
Global Real Estate Outlook
 Global Real Estate Outlook Jeremy Kelly Global Research David Green-Morgan Global Capital Markets Research 7 August 2014 Global Real Estate Market Outlook Jeremy Kelly Director, Global Research Jeremy.Kelly@eu.jll.com
Bank of Ireland Hotel Sector Briefing
 Bank of Ireland Hotel Sector Briefing 29 th November 2018 Sarah Duignan Director, Client Relationships sduignan@str.com 2018 STR, Inc. All Rights Reserved. Any reprint, use or republication of all or a
DnB NOR Markets August 22, CFO Kristian Johansen EDB Business Partner
 DnB NOR Markets August 22, 2007 CFO Kristian Johansen EDB Business Partner AGENDA EDB IN BRIEF IT-MARKET 1H 2007 EDB HIGHLIGHTS 1H 2007 KEY FIGUERS BUSINESS UNITS DRIVERS FOR PROFITABLE GROWTH OUTLOOK
Shareholder information
 SHAREHOLDER INFORMATION Index 107 07: Shareholder information Share price development in 2010 NOK 65 60 55 50 45 40 35 30 25 Jan. Feb. Mar. Apr. May Jun. Jul. Aug. Sept. Oct. Nov. Dec. Hydro Oslo Børs
NORTH BRIDGE NORDIC PROPERTY AS. STATUS REPORT 2nd QUARTER 2010
 NORTH BRIDGE NORDIC PROPERTY AS STATUS REPORT 2nd QUARTER 2010 NET ASSET VALUE AS OF 30.06.2010 Net asset value (NAV) of North Bridge Nordic Property AS (the Company/NBNP) is calculated at NOK 1,595 per
Schroder European Real Estate Investment Trust
 Schroder European Real Estate Investment Trust Investor update presentation Tony Smedley, Head of Continental European Real Estate Investment Andrew MacDonald, Head of Real Estate Finance July 2017 For
FOURTH QUARTER 2014 RESULTS. Oslo, 5 February 2015, CEO Bjarte Bruheim and CFO Svein Knudsen
 FOURTH QUARTER 2014 RESULTS. Oslo, 5 February 2015, CEO Bjarte Bruheim and CFO Svein Knudsen Disclaimer This quarterly presentation includes and is based, inter alia, on forward-looking information and
NORTH BRIDGE NORDIC PROPERTY AS STATUS REPORT 4TH QUARTER 2010
 NORTH BRIDGE NORDIC PROPERTY AS STATUS REPORT 4TH QUARTER 2010 PRELIMINARY NET ASSET VALUE AS AT 31.12.2010 Preliminary net asset value of the North Bridge Nordic Property AS share (Company/NBNP) is put
Schroder European Real Estate Investment Trust
 Schroder European Real Estate Investment Trust Interim results presentation Tony Smedley, Head of Continental European Real Estate Investment Andrew MacDonald, Head of Real Estate Finance 25 May 2017 Jeff
Interim accounts: 1st quarter EDB Business Partner ASA
 Interim accounts: 1st quarter 2002 EDB Business Partner ASA 1 Key figures for Q1 2002 Operating revenue NOK 1,125m (- 3%) EBITA NOK 9m (- NOK 95m) EBITA margin 0.8 % (- 8.2%p) EBITA margin (exc. gains/losses
Schroder European Real Estate Investment Trust
 Schroder European Real Estate Investment Trust Investor update presentation Tony Smedley, Head of Continental European Real Estate Investment Andrew MacDonald, Head of Real Estate Finance July 2017 Marketing
Interim Report 2 nd quarter 2007 Nordea Bank Norge Group
 Interim Report 2 nd quarter 2007 Nordea Bank Norge Group Nordea Bank Norge is part of the Nordea Group. Nordea s vision is to be perceived as the leading Nordic bank, acknowledged for its people, creating
1Q2018 Results Presentation 10 May2018
 1Q2018 Results Presentation 10 May2018 Agenda About IREIT Global Key Highlights Portfolio Summary European Market Review Looking Ahead Appendix : Overview of Tikehau Capital 2 About IREIT Global About
F&C Real Estate Equity Long / Short Fund Ray Lahaut & Marcus Phayre-Mudge
 F&C Real Estate Equity Long / Short Fund Ray Lahaut & Marcus Phayre-Mudge March 2013 www.fandc.com Contents The fund & team Investment process Current market conditions / outlook Summary Fund terms Case
P R E S E N T A T I O N H1/ A U G U S T
 P R E S E N T A T I O N H1/2014 0 5 A U G U S T 2 0 1 4 D I S CLAIMER The statements contained herein may include statements of future expectations and other forward-looking statements that are based on
Fourth quarter of 2010
 Fourth quarter of 2010 Main features of the fourth quarter of 2010 Operating revenue NOK 3,363 million, 2% organic growth EBITA before synergy costs NOK 171 million (NOK 283 million) Revenue growth and
HSE HR Circular 009/ th March, Subsistence Allowances Abroad
 Office of the National Director of Human Resources Health Service Executive Dr. Steevens Hospital Dublin 8 Tel: (01) 635 2319 Fax: (01) 635 2486 E-mail: nationalhr@hse.ie HSE HR Circular 009/2009 25 th
Supplemental Information Second-Quarter 2013 Earnings Call
 Supplemental Information Second-Quarter 2013 Earnings Call Market & Financial Overview Q2 Capital Markets & Leasing Markets Volumes Strong Q2 for Capital Markets Q2 2013 v. Q2 2012 Market Volumes Capital
Oslo Børs Holding ASA
 Oslo Børs Holding ASA 2nd Quarter 2007 14 August 2007 Overview Second quarter highlights Continuing high level of market activity Operating revenues: NOK 147.3 million (134.4) Operating profit: NOK 89.1
Oslo Børs VPS Holding ASA 4th Quarter 2008
 Oslo Børs VPS Holding ASA 4th Quarter 2008 27 January 2008 Overview Fourth quarter highlights Letter of intent for strategic co-operation with the London Stock Exchange Considers Central counterparty (CCP)
Third Quarter
 Third Quarter 2005 0 Financial highlights NOK million 3Q 05 3Q 04 YTD 05 YTD 04 Revenues 701 665 1987 1849 RVM Technology 299 303 827 922 Collection & Materials Handling 247 237 647 632 Recycling Technology
Strong performance for real estate assets
 Strong performance for real estate assets Annualized returns, United States, 212 Percent 2 18 16 14 1 year 1 year 12 1 8 6 4 2 REITs Equities Real property Govt bonds CPI T-bills Sources: CBRE, NCREIF.
Global. Real Estate Outlook. Jeremy Kelly Global Research. David Green-Morgan Global Capital Markets Research
 Global Real Estate Outlook Jeremy Kelly Global Research David Green-Morgan Global Capital Markets Research Ben Breslau Director of Research, Americas 7 th February 2013 Global Real Estate Outlook Road
EMGS ASA FIRST QUARTER PRESENTATION 2012
 EMGS ASA FIRST QUARTER PRESENTATION 2012 CEO, Roar Bekker CFO, Svein Knudsen Hotel Continental, 16 May 2012 DISCLAIMER This quarterly presentation includes and is based, inter alia, on forward-looking
European Property Investment Markets. Sorbonne Immo 13 Juin 2007
 European Property Investment Markets Sorbonne Immo 13 Juin 2007 European Direct Commercial Property in bn. Euro 250 Investment by sector Office Retail Logistics Others 200 150 100 50 0 2000 2001 2002 2003
Interim presentation. 4 th quarter 2012 Sverre Hurum, CEO Erik Stubø, CFO 27 February 2013
 Interim presentation 4 th quarter 2012 Sverre Hurum, CEO Erik Stubø, CFO 27 February 2013 1 Highlights in the fourth quarter Revenues and EBIT Operating revenues increased 8.7 percent to NOK 280.5 (y-
SpareBank 1 SR-Bank ASA. 3rd quarter st November Page 1
 SpareBank 1 SR-Bank ASA 3rd quarter 2012 1st November 2012 Page 1 Disclaimer This presentation contains forward-looking statements that reflect management s current views with respect to certain future
European Investment Bulletin
 European Investment Bulletin Spring 2009 Prime yield decompression per sector (yoy) Rents in decline in line with business sentiment 200 CBD offices Warehouses Shopping Centres European average prime office
Financial stability 2/11. Charts
 Financial stability /11 Charts External sources of risk to banking sector Vulnerability in banking sector Chart 1.1 Vulnerabilities in the Norwegian banking sector and external sources of risk to the banking
European Quarterly Outlook JULY 2011
 European Quarterly Outlook JULY 2011 EUROPE Executive Summary Key Themes Economic growth is improving steadily and interest rates are rising, although concerns about the outlook persist. Forecasts could
THIRD QUARTER 2015 RESULTS. Oslo, 5 November 2015 CEO Stig Eide Sivertsen
 THIRD QUARTER 2015 RESULTS. Oslo, 5 November 2015 CEO Stig Eide Sivertsen Disclaimer This quarterly presentation includes and is based, inter alia, on forward-looking information and statements that are
Agenda. About IREIT Global. Key Highlights. Portfolio Summary. Economy & Real Estate Review. Looking Ahead. Appendix : Overview of Tikehau Capital
 4Q 2017 and FY 2017 Results Presentation 14 February 2018 Agenda About IREIT Global Key Highlights Portfolio Summary Economy & Real Estate Review Looking Ahead Appendix : Overview of Tikehau Capital 2
Self Storage Group ASA Fourth quarter February 2018
 Self Storage Group ASA Fourth quarter 2017 15 February 2018 1 GROUP HIGHLIGHTS FOURTH QUARTER 2017 Revenues in Q4 2017 NOK 55.3 million, up from NOK 50.8 million in Q4 2016 Adjusted EBITDA in Q4 2017 of
VPS Holding ASA (The Norwegian Central Securities Depository) Report for the Second Quarter 2003
 Report for the Second Quarter 2003") VPS Holding ASA (The Norwegian Central Securities Depository) Report for the Second Quarter Profit and Loss Account 2002 2002 2002 Main figures in NOK 000 2nd. Qtr 2nd. Qtr 01.01.- 30.06. 01.01. 30.06.
VPS Holding ASA (The Norwegian Central Securities Depository) Report for the Second Quarter Profit and Loss Account 2002 2002 2002 Main figures in NOK 000 2nd. Qtr 2nd. Qtr 01.01.- 30.06. 01.01. 30.06.
Revenue growth of 15% compared to last year Q revenues up to NOK 251m from NOK 218m in Q3 2014
 Interim report Revenue growth of 15% compared to last year revenues up to NOK 251m from NOK 218m in Increased profitability Operating margin of 18% relative to 17% in EPS of NOK 0.08 compared to NOK 0.06
May Global Growth Strategy
 May 2012 Global Growth Strategy Jones Lang LaSalle Global Growth Strategy G1 G3 Build our local and regional leasing and capital markets businesses G5 Connections Capture the leading share of global capital
NOTICE OF EXTRAORDINARY GENERAL MEETING
 To the shareholders of EDB ErgoGroup ASA NOTICE OF EXTRAORDINARY GENERAL MEETING Notice is hereby given that an Extraordinary General Meeting of EDB ErgoGroup ASA (the Company ) will be held on 19 November
Q FINANCIAL RESULTS PRESENTATION Oslo, 12 May 2010
 Q1 2010 FINANCIAL RESULTS PRESENTATION Oslo, 12 May 2010 DISCLAIMER This document is being furnished for informational purposes only and does not constitute an offer to sell or the solicitation of an offer
INTERIM REPORT Q1 2015
 INTERIM REPORT Q1 2015 HIGHLIGHTS Robust earnings with solid underlying EBITDA in the quarter Strong order intake during the quarter Good project execution and cost control Successful Initial Public Offering
Self Storage Group ASA Third quarter November 2017
 Self Storage Group ASA Third quarter 2017 16 November 2017 1 GROUP HIGHLIGHTS THIRD QUARTER 2017 Revenues in Q3 2017 NOK 55.6 million, up from NOK 51.4 million in Q2 2017 Adjusted EBITDA in Q3 2017 of