INVESTOR PRESENTATION
|
|
|
- Sylvia Dickerson
- 5 years ago
- Views:
Transcription


1 INVESTOR PRESENTATION
2 Table of Contents Introduction to SEGRO 3 Market drivers 10 High quality development pipeline 15 Balance sheet and financing 21 Operating performance 26 Portfolio overview 30 APP acquisition 34 Data correct as at 7 November

3 Introduction to SEGRO A leading owner-manager and developer of modern big box and urban warehousing 8 billion of assets under management in the UK and nine Continental Europe countries A FTSE 100 Real Estate Investment Trust (REIT) 3


4 SEGRO invests in big box and urban warehouses across Europe Big Box warehouses Typically >10,000 sq m Used for national or regional distribution Located along major transport corridors and in key logistics hubs Usually let to a single customer Urban warehouses Typically 2,000 10,000 sq m Used for multiple purposes, including last mile delivery Located in or on the edge of major cities for access to customers and labour Can be let to a single customer or multiple customers Big box warehouses 39% Urban warehouses 54% Portfolio by type (valuation, SEGRO share) 4


5 Big box warehouses 5


6 Single-let urban warehouses 6


7 Multi-let urban warehouses 7
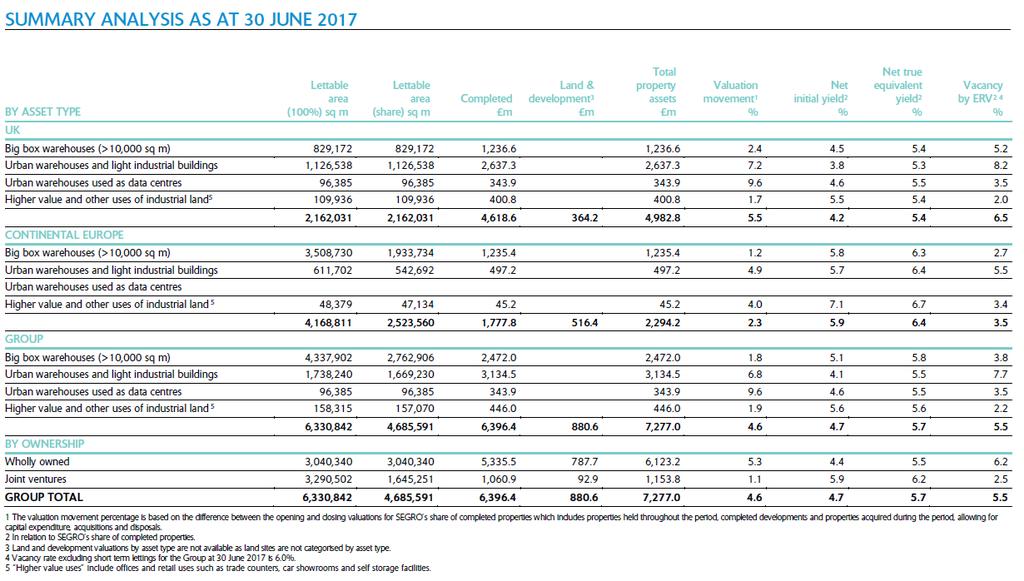
8 SEGRO portfolio at 30 June 2017 Portfolio by type: UK (valuation, SEGRO share) Other 9% Urban warehousing 64% Big box warehouses 27% Portfolio by location (valuation, SEGRO share) Portfolio by type: Cont Europe (valuation, SEGRO share) Other 3% Urban warehousing 28% Big box warehouses 69% Portfolio by location (valuation, AUM) Customer sectors (headline rent, SEGRO share) Services & Utilities 8% TMT 8% Wholesale & Retail Distribution 8% Food and general manufacturing 18% Other 8% Portfolio yield profile (yields, %) Transport & Logistics 22% Parcel delivery 11% Retail 17% Northern Europe 12% Greater London 39% Greater London 2.9bn Equivalent Yield Initial Yield Thames Valley 19% Thames Valley 1.4bn Greater London Slough TE Midlands Logistics Germany France Poland 8

9 Disciplined capital allocation central to SEGRO strategy Key elements of SEGRO strategy Disposal and investment activity since 1 January 2012, bn (to 30 September 2017) To be the pre-eminent owner-manager and developer of industrial and warehouse properties in Europe and a leading income-focused REIT Our Goals To deliver attractive shareholder returns through progressive dividends and NAV growth bn Dvpt capex ( 1.1bn) 2.0 Land ( 0.5bn) bn Disposals Asset acquisitions Development capex 9
10 MARKET DRIVERS
11 Favourable market conditions Economic growth outlook is supportive (GDP average annual growth rates ; source: OECD) UK logistics supply continues to fall short of demand (UK logistics take up and average availability; source: JLL) 4.0% 3.0% 2.0% 1.0% 0.0% 3.4% 3.4% 1.6% 2.0% 1.0% 1.4% 2.4% 1.3% 0.6% 0.9% Poland Germany France UK Italy Take-up / availability, m sq m Take-up for H and H H No. of years supply Historic ( ) Forecast ( ) Average availability Take-up No. of years' supply Online sales continue to gain market share (Online purchases as share of total retail sales; source: Centre for Retail Research) Supply of speculative development remains low (Speculative UK big box warehouse completions; source: JLL) UK Germany France Europe ave Poland Italy 0.0% 5.0% 10.0% 15.0% 20.0% Completions, m sq m In dvpt 11
12 European industrial and logistics supply dynamics Logistics space under construction 1 (m sq m) France logistics supply-demand dynamics 2 (m sq m) Take-up / availability, m sq m Take-up for H and H No. of years supply UK Germany France Belgium Neth. Poland Italy Spain Average availability H17 Pre-let Speculative Take-up Available space as multiple of annual take-up 1 Source: 1Q 2017, JLL 2 Source: CBRE 12
13 Prime logistics yields vs 10 year bond yields Warsaw: 6.0% Paris: 5.0% Dusseldorf: 4.8% London: 4.5% H17 UK 10yr bond: 1.3% Germany 10yr bond: 0.5% Source: CBRE, Bloomberg (data correct at 30 June 2017) 13


 Decline driven by alternative uses of")
14 Limited and falling supply of industrial land in London 46% decline in London s industrial floorspace since 1984 Industrial land expected to decline by a further 33% between 2015 and 2041 England London England London +2.5% % 8.5% 45.9% e 2041e Source: Deloitte/ONS Source: GLA (Land zoned for industrial use, thousand hectares) Decline driven by alternative uses of industrial land Olympic Village Westfield London Nine Elms Old Oak Common 14
15 HIGH QUALITY DEVELOPMENT PIPELINE AS AT 30 JUNE 2017


16 Current development pipeline: 46m of rent, 40 projects, 1m sq m of space Yoox pre-let, Milan Martorelles, Barcelona FedEx pre-let, Paris Amazon pre-let, Rome SEGRO Park Rainham, East London Premier Inn, Slough Trading Estate 16


17 Significant development opportunities within SEGRO s control 1 Current development pipeline 2 920,400 sq m of space Current book value 431m; 231m cost to complete 46m potential gross rent; 31m (68%) secured through pre-lets Projected 7.7% yield on total cost Near term development projects 243,000 sq m of space 146m potential capex 14m potential gross rent 63% rent related to potential pre-lets Projected 7.6% yield on total cost 3 Future development pipeline m sq m of space c 1.1bn potential capex 113m potential gross rent Projected c8% yield on total cost Land under option 750,000 sq m of space c 50m potential gross rent Expected blended yield of c7% on total cost, including land Capital deployment ahead of expectations at the time of 2016 equity placing and 2017 rights issue 1 Excludes near-term projects and potential developments on land held under option. 17
 Gross rent from development completions, m (as at 30 June 2017, including joint ventures at share) Amazon, Rome Logistics 60% 231m cost to complete 50.0 40.0 30.0 7.9 4.4 8.0 2.4 2.0 20.")
18 Current development pipeline Current development pipeline (as at 30 June 2017) Current development projects, asset type by ERV (30 June 2017) 920,400 sq m 46m ERV Urban warehouses 21% 31m rent secured (68%) Gross rent from development completions, m (as at 30 June 2017, including joint ventures at share) Amazon, Rome Logistics 60% 231m cost to complete % Yield on cost H H H H Pre-let Speculative 18
 146m of potential capex Poland 9% Italy/Spain 14% Germany 18% UK 41% Future pipeline (2.3m sq m 2 ) 1.")
19 Future development pipeline Development land bank (30 June 2017) Geographic split of land bank, by potential ERV 1 (30 June 2017) Near-term projects 243,000 sq m c 14m of rent (63% related to pre-lets) 146m of potential capex Poland 9% Italy/Spain 14% Germany 18% UK 41% Future pipeline (2.3m sq m 2 ) 1.1bn estimated development costs 2 113m of potential annual rent 2 8% estimated yield on TDC 1 10% estimated yield on new money 1 And land held under option 750,000 sq m 50m of potential annual rent All figures include joint ventures at share. 1 Future development pipeline including near-term projects but excluding land under option. 2 Excludes near-term projects and potential developments on land held under option. Estimated blended yield of 7% on total cost, incl land 19
20 Substantial opportunity to grow rental income Annualised gross cash passing rent 1, million (as at 30 June 2017) 126m potential from current activity 163m from land bank and land options Passing rent at 30 Jun 17 Rent in rent-free Reversion and vacant space Current development pipeline (68% let) Near-term development opportunities 2,3 (63% pre-lets) Future pipeline 2 Land held under option Total Potential 1 Including JVs at share 2 Near-term development opportunities include pre-let agreements subject to final conditions such as planning permission, and speculative developments subject to final approval, which are expected to commence within the next 12 months 3 Total rent potential of 127m from near-term development opportunities and Future pipeline 4 Estimated. Excludes rent from development projects identified for sale on completion and from projects identified as Near-term opportunities 20
21 BALANCE SHEET AND FINANCING 30 JUNE 2017
22 1.9bn of new financing raised to strengthen balance sheet further Rights Issue 216m cash consideration for APP 557m net proceeds 341m for future development capex LTV ratio and average cost of debt (incl share of JVs, M ) 60% 5.0% Private Placement Issue 650m of new debt 11yr ave duration, 1.9% ave coupon Repaid 200m % bonds early Repaid 320m APP 2.5% secured debt LTV ratio 40% 20% 4.0% 3.0% 2.0% 1.0% Average cost of debt Bond Tender 550m of bonds tendered Issued 750m new bonds Longer-dated bonds targeted Increased average debt duration by 3 years Reduced average cost of debt by 0.5% 0% 0.0% M 17 LTV ratio 1 Pro forma for bond tender Ave cost of debt 22
23 Robust financial position Balance sheet and gearing metrics (look-through basis), 31 December September 2017 Including joint ventures at share 30 Sept 2017 Pro Forma 30 June December 2016 Weighted average cost of debt 1 (%) Attractive marginal cost of Group bank borrowings of c1.4% (UK) and 1.1% (CE) 3 Average maturity of debt (years) Fixed rate debt as proportion of net debt (%) n/a Net borrowings ( bn) LTV ratio (%) FY 2017: 350m+ estimated development capex (and further c 50m of infrastructure capex) 1 Based on gross debt, excluding commitment fees and amortised costs 2 Pro forma for repayment of APP secured debt and drawing of US private placement debt 3 Marginal borrowing costs after commitment fee 23
24 Debt maturity profile at 30 September 2017 (pro forma), m Debt maturity by type and year, millions (as at 30 September 2017, pro forma for bond tender and issue in October 2017) SEGRO undrawn JV debt at share SEGRO Bank debt SEGRO bonds & PP notes
25 Euro currency exposure and hedging Balance sheet, m 30 June Assets 68% hedged 2,500 2,000 1,500 1,000 Other euro liabilities Euro currency swaps Euro debt 1.14: 1 as at 30 June 2017 assets 68% hedged by liabilities 741m ( 650m) of residual exposure 13% of Group NAV Illustrative NAV sensitivity vs 1.14: + 5% ( 1.20) = - c. 31m (-c.3.1p per share) - 5% ( 1.08) = + c. 34m (+c.3.4p per share) Euro gross assets Loan to Value (on look-through basis) at 1.14: 1 is 29%, sensitivity vs 1.14: +5% ( 1.20) LTV -0.6%-points Income Statement, m 6 months to 30 June Income 37% hedged Euro income Euro costs -5% ( 1.08) LTV +0.6%-points Average rate for 6 months to 30 June : 1 income 37% hedged by expenditure (including interest) Net income for the period 37m ( 32m) 35% of Group Illustrative annualised net income sensitivity versus 1.16: + 5% ( 1.22) = c 1.5m (c0.2p per share) - 5% ( 1.10) = +c1.7m (c0.2p per share) 1 Pro forma for repayment of APP secured debt (in July 2017) and drawing of US private placement (in August 2017). 25
26 OPERATING PERFORMANCE 9 MONTHS TO 30 SEPTEMBER 2017
 Strong financial results and robust balance sheet Driving performance through operational excellence and disciplined")
27 H Results Summary +3.2% Adj EPS (9.7p) +5.4% EPRA NAV (504p) +5.0% DPS (5.25p) +3.9% lfl net rental income growth 33% LTV ratio (PF at 30 Sept 17) Strong financial results and robust balance sheet Driving performance through operational excellence and disciplined capital allocation High quality pipeline of growth opportunities Optimistic outlook B+S, Frankfurt 27


 Sold APP portfolio Former Northfields industrial estate sold to residential developer Average yield of 5.2% (3.")
28 Driving performance: operational excellence and disciplined capital allocation Operating performance updated for the nine months to 30 September 2017 Leasing and Asset Management Developments Completed development 36m contracted headline rent, +3% from 9M % uplift on UK rent reviews and renewals 392,000 sq m new space completed: 17m of potential rent, 97% secured 20m new pre-lets signed Amazon, Munich Low vacancy rate of 4.1% 725,000 sq m under construction Acquired Disposals Acquisitions 248m of asset disposals Part consideration for APP 150m Non-strategic German and French assets 570m of asset acquisitions Incl 50% interest in APP portfolio APP portfolio topped-up NIY of 4.2% (5.2% excl Cargo Area) Sold APP portfolio Former Northfields industrial estate sold to residential developer Average yield of 5.2% (3.9% incl land) 48m of land acquisitions Primarily land for immediate development in Germany, Italy and Spain Nelson Trade Park 28
29 Growth from the existing portfolio Reversion capture 2.7m potential reversion from general UK rent reviews in H ( 13m in total) 6.2m (55%) of Heathrow Cargo Area 2019 peppercorn rent reversions secured or under negotiation ( 11m in total) Rapid leasing of speculative space (Letting status of development completions in , %) 100% 80% Further vacancy reduction c 5.5m (25%) of vacancy at 30 June 2017 is in five UK buildings 2 big box warehouses in Midlands 1 let by 30 Sept 3 urban warehouses in London 2 let by 30 Sept 60% 40% 20% Index-linked uplifts c40% of portfolio (c 140m of headline rent) contains indexation provisions Almost all Continental Europe leases c10% of UK leases (most with cap and collar) 0% M 2017 Speculative Pre-let Let at 30 Sept
30 PORTFOLIO OVERVIEW 30 JUNE 2017
31 Portfolio value change driven by improving yields and asset management 1 400m 350m 300m +4.6% UK +5.5% Slough Trading Estate +7.1% Park Royal +8.8% Heathrow +3.0% UK big box logistics % Continental Europe +2.3% SELP +1.1% SEGRO wholly-owned +4.1% 250m 200m +5.7% 150m 100m +5.2% +3.7% 50m 0m Total Greater London Thames Valley & National Logistics 2.3% +0.1% Northern Europe Southern Europe Central Europe ERV growth 0.8% 0.9% 0.9% 0.6% 0.6% 0.0% UK: 0.9% Continental Europe: 0.4% 1 Percentage change relates to completed properties, including JVs at share. 2 Includes big box warehouses part of the Greater London portfolio 31
32 32
33 33

34 APP ACQUISITION
 7.")
35 Gaining full control of attractive portfolio focused on Heathrow APP portfolio statistics (31 December 2016) Gross Asset Value - Standing assets - Development - Land Annualised rent - Passing - ERV Size Yield profile - Net initial - Topped-up NIY - Topped-up NIY excluding cargo centre - Equivalent yield 1,097m 1,068m 9m 20m 42m 67m 350,000 sq m 3.6% 4.2% 5.2% 5.5% Vacancy (by ERV) 7.5% WAULT - To break - To expiry 11.1 years 11.7 years 35
")
36 Heathrow Cargo Area Central Terminal Area Terminal 5 Terminal 4 Sandringham Road Zulu Cul-de-sac Shoreham Road (The Horseshoe) 36


37 Greater operational flexibility; opportunities to add value Asset management opportunities Near-term cash generation from rent-free expiry and void reduction Medium-term opportunity from capturing reversionary rents, particularly 11m from expiring leases on peppercorn rents in 2019 Future development potential Development underway at North Feltham Trading Estate 7,300 sq m of urban warehouses, 1.2m potential rent (c 7m cost to complete) Further opportunities from land owned or under option Significant longer-term potential from redevelopment of Heathrow Cargo Centre Heathrow Airport expansion Support from UK government for a third runway significantly increases likelihood of airport expansion in longer-term 87% of properties by value are in vicinity of Heathrow, including on-airport cargo facilities Expansion should drive demand for cargo facilities, as well as space required by airlines, industrial users and other airport service companies Rent, m APP annualised rent at 31 Dec Passing Rent free Vacancy Reversion ERV In line with SEGRO s strategy of building scale in its core markets, improving operational efficiency and delivering attractive returns 37
38 Forward-looking statements and Disclaimer This presentation may contain certain forward-looking statements with respect to SEGRO s expectations and plans, strategy, management s objectives, future performance, costs, revenues and other trend information. These statements and forecasts involve risk and uncertainty because they relate to events and depend upon circumstances that may occur in the future. There are a number of factors which could cause actual results or developments to differ materially from those expressed or implied by these forward looking statements and forecasts. The statements have been made with reference to forecast price changes, economic conditions and the current regulatory environment. Nothing in this presentation should be construed as a profit forecast. Past share performance cannot be relied on as a guide to future performance. The securities referred to in this presentation and which are to be offered in the rights issue also referred to herein (the Rights Issue ) will not be registered under the U.S. Securities Act of 1933, as amended (the "Securities Act") or under the securities laws of any state or other jurisdiction of the United States, and may not be offered, sold, taken up, exercised, resold, renounced, transferred or delivered, directly or indirectly, in or into the United States except pursuant to an exemption from, or in a transaction not subject to, the registration requirements of the Securities Act and in compliance with any applicable securities laws of any state or other jurisdiction of the United States. This presentation is for information purposes only. This presentation does not constitute an offer or invitation to underwrite, buy, subscribe, sell or issue or the solicitation of an offer to buy, sell, acquire, dispose or subscribe for securities or to take up entitlements in any jurisdiction. Nothing in this presentation should be interpreted as a term or condition of the Rights Issue. Any decision to purchase, otherwise acquire, subscribe for, sell or otherwise dispose of any securities must be made only on the basis of the information contained in and incorporated by reference into the prospectus to be published in connection with the Rights Issue. This presentation contains (or may contain) certain forward-looking statements with respect to certain of SEGRO plc s current expectations and projections about future performance, anticipated events or trends and other matters that are not historical facts. These forward-looking statements, which sometimes use words such as aim, anticipate, believe, intend, plan estimate, expect and words of similar meaning, include all matters that are not historical facts and reflect the directors beliefs and expectations and involve a number of risks, uncertainties and assumptions that could cause actual results and performance to differ materially from any expected future results or performance expressed or implied by the forward-looking statement. These statements are subject to unknown risks, uncertainties and other factors that could cause actual results to differ materially from those expressed or implied by such forward-looking statements. Statements contained in this presentation regarding past trends or activities should not be taken as a representation that such trends or activities will continue in the future. The information contained in this presentation is subject to change without notice and, except as required by applicable law, neither SEGRO plc, BofA Merrill Lynch, UBS, Barclays, BNP Paribas nor HSBC assume any responsibility or obligation to update publicly or review any of the forward-looking statements contained herein. You should not place undue reliance on forward-looking statements, which speak only as of the date of this presentation. Any indication in this presentation of the price at which securities have been bought or sold in the past cannot be relied upon as a guide to future performance. No statement in this presentation is or is intended to be a profit forecast or profit estimate or to imply that the earnings of SEGRO plc for the current or future financial years will necessarily match or exceed the historical or published earnings of SEGRO plc. The price of shares and the income from them may go down as well as up and investors may not get back the full amount invested on disposal of the shares. Past performance is no guide for future performance. This presentation is directed only at persons: (i) who are investment professionals as defined in Article 19(5) of the Financial Services and Markets Act 2000 (Financial Promotion) Order 2005, as amended (the Order ); (ii) who fall within Article 49(2)(a) to (d) of the Order; or (iii) to whom the presentation may otherwise lawfully be communicated (all such persons together being referred to as Relevant Persons ). The presentation is not intended to be distributed or passed on, directly or indirectly, to any other class of persons and may not be relied upon by such persons and is therefore not intended for private individuals. The presentation is only for Relevant Persons and must not be acted on, reviewed or relied on by persons who are not Relevant Persons. 38
39 Contact details Harry Stokes Head of Investor Relations and Research +44 (0) November
2017 HALF YEAR 25 JULY 2017
 2017 HALF YEAR RESULTS 25 JULY 2017 Strong financial results and robust balance sheet Driving performance through operational excellence and disciplined capital allocation High quality pipeline of growth
2018 HALF YEAR 26 JULY 2018
 2018 HALF YEAR RESULTS 26 JULY 2018 H1 2018 Another period of delivery Strong financial results and capital structure Disciplined capital allocation improving portfolio scale and quality, reducing risk
Bank and Bondholder presentation
 Bank and Bondholder presentation 19 September 2013 0 Geopost, Enfield Agenda Welcome and strategic overview (David Sleath, CEO) Operational and financial performance (Justin Read, Group Finance Director)
RESULTS FOR THE YEAR ENDED 31 DECEMBER SEGRO plc ( SEGRO / Company / Group ) today announces its results for the year ended 31 December 2017.
 today announces its results for the year ended 31 December 2017.") PRESS RELEASE 16 FEBRUARY 2018 RESULTS FOR THE YEAR ENDED 31 DECEMBER SEGRO plc ( SEGRO / Company / Group ) today announces its results for the year ended 31 December. SEGRO has delivered another strong
PRESS RELEASE 16 FEBRUARY 2018 RESULTS FOR THE YEAR ENDED 31 DECEMBER SEGRO plc ( SEGRO / Company / Group ) today announces its results for the year ended 31 December. SEGRO has delivered another strong
RESULTS FOR THE SIX MONTHS ENDED 30 JUNE 2018
 PRESS RELEASE 26 JULY 2018 RESULTS FOR THE SIX MONTHS ENDED 30 JUNE 2018 SEGRO plc ( SEGRO / Company / Group ) today announces its results for the six months ended 30 June 2018. SEGRO reports strong operating,
RESULTS FOR THE YEAR ENDED 31 DECEMBER SEGRO plc ( SEGRO / Company / Group ) announces its results for the year ended 31 December 2018.
 announces its results for the year ended 31 December 2018.") PRESS RELEASE 15 FEBRUARY 2019 RESULTS FOR THE YEAR ENDED 31 DECEMBER SEGRO plc ( SEGRO / Company / Group ) announces its results for the year ended 31 December. SEGRO announces a strong set of operating,
PRESS RELEASE 15 FEBRUARY 2019 RESULTS FOR THE YEAR ENDED 31 DECEMBER SEGRO plc ( SEGRO / Company / Group ) announces its results for the year ended 31 December. SEGRO announces a strong set of operating,
THIS ANNOUNCEMENT CONTAINS INSIDE INFORMATION FOR IMMEDIATE RELEASE.
 THIS ANNOUNCEMENT AND THE INFORMATION CONTAINED HEREIN ARE NOT FOR RELEASE, PUBLICATION OR DISTRIBUTION, DIRECTLY OR INDIRECTLY, IN WHOLE OR IN PART, IN, INTO OR FROM THE UNITED STATES, SOUTH AFRICA OR
LondonMetric Property Investor Presentation September
 LondonMetric Property Investor Presentation September 2018 www.londonmetric.com Agenda Overview & Strategy Property Finance & Outlook Appendices 2 Overview Our sector calls and income focus are delivering
FULL YEAR RESULTS Year Ended 31 March
 FULL YEAR RESULTS Year Ended 31 March 2018 www.londonmetric.com AGENDA Highlights & Strategy Financial performance Property & Investment Outlook Q&A 2 Key Highlights Our sector calls and income focus delivered
SEGRO PLC ANNUAL REPORT & ACCOUNTS 2017
 SEGRO PLC ANNUAL REPORT & ACCOUNTS SEGRO PLC ANNUAL REPORT & ACCOUNTS OVERVIEW IN THE RIGHT PLACE FOR THE FUTURE 01 AT A GLANCE 02 STRATEGIC REPORT BUSINESS REVIEW 04 CHIEF EXECUTIVE S STATEMENT 10 MARKET
Hansteen. Full Year Results to 31 December Tilburg, Netherlands
 Hansteen Full Year Results to 31 December 2016 Tilburg, Netherlands Contents Introduction Hansteen 2016 results Sale announcement Sale of German and Dutch Portfolio 2016 Annual Results 2016 Property Performance
Investment Market Germany. PROVADA 5 th June 2013
 Investment Market Germany PROVADA 5 th June 2013 In Europe, which country/region do you believe to be the most attractive for making investment purchases in 2013? 40 35 2012 2013 2012 (n=341) 2013 (n=361)
Hansteen. Half Year Results to 30 June Castrop-Rauxel, Germany
 Hansteen Half Year Results to 30 June 2016 Castrop-Rauxel, Germany Introduction Hansteen - Pan European Real Estate Investment Trust (REIT) Pan European REIT Five countries Regional teams in 15 offices
2009 Half-Year Results. 3 August 2009
 2009 Half-Year Results 3 August 2009 John Nelson, Chairman 2 Agenda Introduction John Richards Financial Results Simon Melliss France Christophe Clamageran UK David Atkins Summary and Conclusion John Richards
MAS REAL ESTATE INC. Results presentation. New Waverley, Edinburgh, UK. Year ended 30 June 2016
 MAS REAL ESTATE INC Results presentation Year ended 30 June 2016 New Waverley, Edinburgh, UK 1 TABLE OF CONTENTS i. Company profile ii. iii. iv. Strategic update Recurring and potential EPS Highlights
Regional REIT. Retail eligible bond 4.5% Regional markets have remained robust. Retail eligible bond offering. Launch of bond issue.
 Regional REIT Retail eligible bond 4.5% 2024 Launch of bond issue Real estate Despite continuing Brexit uncertainty and some slowing of UK economic growth regional property markets have remained robust
European Property Investment Markets. Sorbonne Immo 13 Juin 2007
 European Property Investment Markets Sorbonne Immo 13 Juin 2007 European Direct Commercial Property in bn. Euro 250 Investment by sector Office Retail Logistics Others 200 150 100 50 0 2000 2001 2002 2003
Financial results presentation For six months ended 30 September 2018
 Financial results presentation For six months ended 30 September 2018 Transition Plan to 31 March 2020 Targets Progress Sales and Purchases MLI to comprise 65% of total portfolio Manage timings of acquisitions
Investor presentation 9M 2012 results
 Investor presentation 9M 2012 results Key results: stabilising in Q3 Direct result p/s: 3.05 (-17.6% yoy) Q3: + 0.01 vs Q2 Revaluation portfolio: -4.75% Q3: -0.25% NAV p/s: 63.72 (-12.9% yoy) Q3: +0.4%
GPE Trading Update strong operational performance and proposed return of 306 million to shareholders following profitable property sales
 Press Release 25 January 2018 GPE Trading Update strong operational performance and proposed return of 306 million to shareholders following profitable property sales Great Portland Estates plc ( GPE )
Aberdeen Standard European Logistics Income PLC
 Aberdeen Standard European Logistics Income PLC A new investment trust to be listed on the premium segment of the London Stock Exchange offering a focused long term income strategy exploiting the demand-supply
Interim Results Half Year July 2018
 Interim Results Half Year 2018 July 2018 NSI will be the leading specialist in the Dutch office market, with a strong and efficient platform that will drive returns through pro-active asset management,
Investor presentation Q results
 Investor presentation Q1 2011 results Recent highlights Successful issue of US$ 300m senior notes (US private placement) Sale non-strategic assets in UK of 15.1m, 7% above latest valuation Sale of a further
Schroder European Real Estate Investment Trust
 Schroder European Real Estate Investment Trust Interim results presentation Tony Smedley, Head of Continental European Real Estate Investment Andrew MacDonald, Head of Real Estate Finance 25 May 2017 Jeff
Interest Rates, Cap Rates, and the Real Estate Cycle
 Interest Rates, Cap Rates, and the Real Estate Cycle Stephen Hester, Chief Executive We are real estate investors and create value by actively managing, financing and developing prime commercial property
Outlook 2015: Europe & Germany
 Part of the M&G Group Outlook 215: Europe & Germany Research presentation 27 th November 214 European Economic Fundamentals Update & Outlook 2 Economic recovery broadening GDP growth by country Q3 214
Agenda. About IREIT Global. Key Highlights. Portfolio Summary. Economy & Real Estate Review. Looking Ahead. Appendix : Overview of Tikehau Capital
 4Q 2017 and FY 2017 Results Presentation 14 February 2018 Agenda About IREIT Global Key Highlights Portfolio Summary Economy & Real Estate Review Looking Ahead Appendix : Overview of Tikehau Capital 2
9M 2018 RESULTS 09 NOVEMBER 2018 TLG IMMOBILIEN AG 9M 2018 RESULTS
 TLG IMMOBILIEN AG 9M 208 RESULTS DISCLAIMER This presentation includes statements, estimates, opinions and projections with respect to anticipated future performance of TLG IMMOBILIEN ("Forward-Looking
Schroder European Real Estate Investment Trust
 Schroder European Real Estate Investment Trust Investor update presentation Tony Smedley, Head of Continental European Real Estate Investment Andrew MacDonald, Head of Real Estate Finance July 2017 For
Circle Property. Lifting estimates again. Revaluation gains and strong rent growth. Upside potential from refurbished assets
 Circle Property Lifting estimates again Review of trading update Real estate Circle will publish results for the year to 31 March 2018 in June but recent updates show further strong momentum. Ongoing asset
Raven Russia Ltd Raven Russia Ltd. RAVEN RUSSIA. Results for the 12 months ending 31 December 2011
 RAVEN RUSSIA Results for the 12 months ending 31 December 2011 Disclaimer Certain financials, statements, beliefs and opinions in this document are forward-looking, and reflect the Company s or, as appropriate,
Investor presentation H results
 Investor presentation H1 2011 results Recent highlights New lettings in Belgian and US office portfolio. Occupancy rate improving Heads of terms agreed for hotel in Eilan-project: 20 yr fixed lease, operator
Agenda. About IREIT Global. Key Highlights. Portfolio Summary. Economy & Real Estate Review. Looking Ahead. Appendix : Overview of Tikehau Capital
 2Q 2017 and 1H 2017 Results Presentation 10 August 2017 Agenda About IREIT Global Key Highlights Portfolio Summary Economy & Real Estate Review Looking Ahead Appendix : Overview of Tikehau Capital 2 About
Credit Suisse Annual Real Estate Conference. Thursday, 6 April 2006
 Credit Suisse Annual Real Estate Conference Thursday, 6 April 2006 Agenda British Land at a Glance UK REITS UK Market Fundamentals Strategy & Positioning Activity in 2005/6 Out of Town Retail & London
Schroder European Real Estate Investment Trust
 Schroder European Real Estate Investment Trust Investor update presentation Tony Smedley, Head of Continental European Real Estate Investment Andrew MacDonald, Head of Real Estate Finance July 2017 Marketing
MAS REAL ESTATE INC RESULTS PRESENTATION YEAR ENDED 30 JUNE 2017
 MAS REAL ESTATE INC RESULTS PRESENTATION YEAR ENDED 30 JUNE 2017 CONTENTS Portfolio overview.... 3 Key metrics.... 4 Distribution targets.... 5 Acquisitions and disposals.... 7 New Waverley.... 8 Prime
3Q 2017 and 9M 2017 Results Presentation 9 November 2017
 3Q 2017 and 9M 2017 Results Presentation 9 November 2017 Agenda About IREIT Global Key Results Highlights Portfolio Summary Economy & Real Estate Review Looking Ahead Appendix : Overview of Tikehau Capital
Results HALF-YEAR. Presentation of 30 August 2011
 Results HALF-YEAR 2011 Presentation of 30 August 2011 1 Summary Affine Group Property portfolio Development of group companies Analysis of 1H11 accounts A robust financial model Affine on the stock market
Final Results Presentation. Year ended 30 June 2016
 Final Results Presentation Year ended 30 June 2016 Overview of TCS 378m portfolio 56 years dividend track record 51% founder Ziff family shareholding 57% of debt is long term fixed interest 2007 converted
ATRIUM COMPANY PRESENTATION
 ATRIUM COMPANY PRESENTATION THE LEADING OWNER & MANAGER OF CENTRAL EASTERN EUROPEAN SHOPPING CENTRES 1H2016 ATRIUM LEADING OWNER & MANAGER OF CEE SHOPPING CENTRES A UNIQUE INVESTMENT OPPORTUNITY Strong
CTT Correios de Portugal 9M17. Results Presentation. CTT Correios de Portugal, S.A. 31 October
 CTT Correios de Portugal Results Presentation CTT Correios de Portugal, S.A. 31 October 2017 1 Disclaimer DISCLAIMER This document has been prepared by CTT Correios de Portugal, S.A. (the Company or CTT
June Review and results
 June 2005 - Review and results Contents Business overview Financial highlights Debt structure Property statistics Operational highlights Share capital structure Pipeline 2005/6 2 Business overview Property
Real Estate Investment Strategy
 Real Estate Investment Strategy 8th of July, 2015 Alessandro Bronda Head of Global Real Estate Investment Strategy Group Real Estate Zurich s real estate strategy Zurich has a systematic and structured
Q1 Results Conference Call May 29, 2008
 Q1 Results 2008 Conference Call May 29, 2008 Agenda Operational Update Financial Highlights Outlook 2 Agenda Operational Update Financial Highlights Outlook 3 Portfolio Overview Deutsche Wohnen Group Residential
Q HIGHLIGHTS MEUR MEUR % MEUR MEUR 48.4 MEUR 94.8 MEUR % 1.87% +2.2% +1.9 PP +3.5% +73.8% + >100% +19.9% +81.
 Q1-2 2018 HIGHLIGHTS STRENGTHENED OPERATING PERFORMANCE Occupancy rate 94.7% Rental income MEUR 119.0 Rental income lfl MEUR 98.2 +1.9 PP +3.5% +2.2% KPIs SIGNIFICANTLY IMPROVED Results of AM MEUR 94.8
PALACE CAPITAL PLC (PCA.L)
") COMPANY NOTE Acquisition 07 August 2017 CORPORATE Current price 370.0p Sector Code Listing SHARE PERFORMANCE (K) 300 250 200 150 100 50 Real Estate Investment 0 Jul-15 Oct-15 Jan-16 Apr-16 Jul-16 Oct-16
COMPANY NOTE Acquisition 07 August 2017 CORPORATE Current price 370.0p Sector Code Listing SHARE PERFORMANCE (K) 300 250 200 150 100 50 Real Estate Investment 0 Jul-15 Oct-15 Jan-16 Apr-16 Jul-16 Oct-16
1Q2018 Results Presentation 10 May2018
 1Q2018 Results Presentation 10 May2018 Agenda About IREIT Global Key Highlights Portfolio Summary European Market Review Looking Ahead Appendix : Overview of Tikehau Capital 2 About IREIT Global About
ATRIUM COMPANY PRESENTATION
 ATRIUM COMPANY PRESENTATION THE LEADING OWNER & MANAGER OF CENTRAL EASTERN EUROPEAN SHOPPING CENTRES August 2017 ATRIUM LEADING OWNER & MANAGER OF CEE SHOPPING CENTRES Strong management team with a proven
Agenda. About IREIT Global. Key Highlights. Portfolio Summary. European Market Review. Looking Ahead. Appendix : Overview of Tikehau Capital
 4Q2018 and FY2018 Results Presentation 20 February 2019 Agenda About IREIT Global Key Highlights Portfolio Summary European Market Review Looking Ahead Appendix : Overview of Tikehau Capital 2 About IREIT
Half Year Results 2013
 Half Year Results 2013 1 Contents Overview Financials Portfolio Markets Summary Richard Tice Chief Executive Officer John Whiteley Chief Financial Officer 2 About CLS Top TSR performance since 2008 in
I N V E S TO R R O A D S H O W & F I N A N C I A L R E S U LT S
 I N V E S TO R R O A D S H O W & F I N A N C I A L R E S U LT S FOR THE SIX MONTHS ENDED 30 SEPTEMBER 2017 POSITIONED FOR GROWTH STENPROP'S OBJECTIVE To deliver sustainable and growing income by becoming
AIMS AMP CAPITAL INDUSTRIAL REIT
 AIMS AMP CAPITAL INDUSTRIAL REIT FY2014: Third Quarter ended 31 December 2013 Results Presentation 29 January 2014 Important notice Disclaimer This Presentation is focused on comparing actual results for
2011 first-half earnings
 2011 first-half earnings Bernard Michel Non-executive chairman Christophe Clamageran Chief executive officer Gilles Bonnier Chief financial officer Paris, July 27, 2011 H1 2011 snapshot in mn June 30,
Full year results to 31 December Morgan Sindall Group plc Constructing & Regenerating
 Full year results to 3 December 203 Morgan Sindall Group plc Constructing & Regenerating 8 February 204 Disclaimer Certain statements included or incorporated by reference in this presentation are forward-looking
Broadgate Financing PLC
 Broadgate Financing PLC 225,000,000 Class A1 Floating Rate Bonds due 2032 315,000,000 Class A2 4.949 per cent. Bonds due 2031 175,000,000 Class A3 4.851 per cent. Bonds due 2033 400,000,000 Class A4 4.821
CTT Correios de Portugal 1H17 Results Presentation
 CTT Correios de Portugal Results Presentation CTT Correios de Portugal, S.A. 31 July 2017 1 Disclaimer DISCLAIMER This document has been prepared by CTT Correios de Portugal, S.A. (the Company or CTT )
Mapletree Commercial Trust Results Announcement. For the period 27 April 2011 to 30 June 2011
 Mapletree Commercial Trust Results Announcement For the period 27 April 2011 to 30 June 2011 Disclaimer This presentation is for information only and does not constitute an invitation or offer to acquire,
FY2017 Annual General Meeting 19 April 2018
 FY2017 Annual General Meeting 19 April 2018 Agenda Key Highlights About Tikehau Capital European Market Review Portfolio Overview Financial Highlights Conclusion 2 Key Highlights FY2017 Key Highlights
Preliminary Results Presentation 2010!
 Preliminary Results Presentation 2010! Agenda! Introduction!Toby Courtauld!!Chief Executive! Financial Results!Timon Drakesmith, Finance Director! Market!Toby Courtauld, Chief Executive!! Valuation! Acquisitions
Agenda. Timon Drakesmith, Finance Director. Rights Issue Financial Results & Valuation. Robert Noel, Property Director
 Unlocking potential Agenda Key Messages Market Opportunity Rights Issue Financial Results & Valuation Toby Courtauld Chief Executive Timon Drakesmith, Finance Director Investment Management Occupational
CTT Correios de Portugal 1H17. Results Roadshows. CTT Correios de Portugal, S.A. September
 CTT Correios de Portugal Results Roadshows CTT Correios de Portugal, S.A. September 2017 1 Disclaimer DISCLAIMER This document has been prepared by CTT Correios de Portugal, S.A. (the Company or CTT )
CITYCON CAPITAL MARKETS DAY 16 MAY 2017, ISO OMENA CFO, EERO SIHVONEN
 STRONG FINANCING FUNDAMENTALS CITYCON CAPITAL MARKETS DAY 16 MAY 2017, ISO OMENA CFO, EERO SIHVONEN MAIN FINANCING TARGETS Loan to Value 40-45% 47.1% Average maturity of loan portfolio > 5 yrs 5.2 Debt
Aldermore Group PLC. Investor presentation. Full Year Results 2015
 Aldermore Group PLC Investor presentation Full Year Results 2015 A year on from IPO. 1 Delivered another excellent set of financial results 2 Generating attractive and sustainable returns 3 Strong balance
Investor Presentation February 2018
 Investor Presentation February 2018 Agenda About IREIT Global Overview of Tikehau Capital Financial Highlights Economy & Real Estate Review Outlook & Strategy 2 About IREIT Global About IREIT Global First
Not for distribution or release in the United States or to, or for the account or benefit of, US Persons
 3 December 2008 DEXUS Funds Management Limited ABN 24 060 920 783 AFSL: 238163 Level 9, 343 George Street Sydney NSW 2000 The Manager Australian Stock Exchange Limited 20 Bridge Street Sydney NSW 2000
INTERIM RESULTS to 30 June 2010 HANSTEEN HOLDINGS PLC
 INTERIM RESULTS to 30 June 2010 HANSTEEN HOLDINGS PLC Introduction FTSE 250, internally managed, management / shareholders truly aligned Portfolio 1.9 million sqm; 1,800 tenants, five countries Growing
Agenda. About IREIT Global. Key Highlights. Portfolio Summary. European Market Overview. Looking Ahead. Appendix : Overview of Tikehau Capital
 2Q2018 Results Presentation 8 August 2018 Agenda About IREIT Global Key Highlights Portfolio Summary European Market Overview Looking Ahead Appendix : Overview of Tikehau Capital 2 About IREIT Global About
January December 2011 Results
 January December 2011 Results 27 February 2012 Highlights 2011 ASSETS VALUATION As of December 2011, the total asset valuation (GAV) amounted to 4,286 million euro (-4.3% below Dec. 2010), based on market
PROPERTY EU EUROPEAN LOGISTICS INVESTMENT BRIEFING
 PROPERTY EU EUROPEAN LOGISTICS INVESTMENT BRIEFING RICHARD HOLBERTON, SENIOR DIRECTOR, EMEA RESEARCH, CBRE FEBRUARY 19 TH 2015 AGENDA Economy Market Activity Forecasts Issues ECONOMY 2014 Some Alarms and
Deutsche Wohnen SE.» 9M 2017 results. Conference Call, 14 November 2017
 Deutsche Wohnen SE» 9M 2017 results Conference Call, 14 November 2017 1 » Agenda 1 Highlights 9M 2017 2 Portfolio 3 Financials 4 Appendix 2 » Highlights 9M 2017 Strong operating business L-f-l rental growth
Regional REIT. Asset growth and refinancing completed. Further portfolio growth and diversification. Acquisition benefit offset by underlying revision
 Regional REIT Asset growth and refinancing completed Completion of acquisitions Real estate RGL s acquisition of two property portfolios, first announced in early December, for an aggregate consideration
Circle Property PLC (CRC.L) 230p 65m AIM Real Estate Regional offices
 230p 65m AIM Real Estate Regional offices") Circle Property PLC (CRC.L) 230p 65m AIM Real Estate Regional offices Net rent, m Net Assets, m EPS, p NAV, p Div, p Price to NAV, % Yield, % 2018A 5.5 65.0 9.0 230 5.6 0% 2.4% 2019E 6.8 73.1 9.5 258 6.3-10.8%
Circle Property PLC (CRC.L) 230p 65m AIM Real Estate Regional offices Net rent, m Net Assets, m EPS, p NAV, p Div, p Price to NAV, % Yield, % 2018A 5.5 65.0 9.0 230 5.6 0% 2.4% 2019E 6.8 73.1 9.5 258 6.3-10.8%
ANNUAL RESULTS FOR THE YEAR ENDED 31 AUGUST Presentation overview
 ANNUAL RESULTS Presentation overview Rebosis highlights Sisa Ngebulana New Frontier results Mike Riley Ascension results Kameel Keshav Rebosis results Sisa Ngebulana 02 1 Key Rebosis Highlights Distribution
Chairman s Review 11 Joint Chief Executives Review and Finance Report 24 Principal Risks and Uncertainties 25 Corporate and Social Responsibility
 ANNUAL REPORT 2 01 3 Contents Section 1 Strategic Report Highlights Chairman s Review 11 Joint Chief Executives Review and Finance Report 24 Principal Risks and Uncertainties 25 Corporate and Social Responsibility
Next Generation Real Estate. HY 2008 Figures. Colonia Real Estate AG HY 2008 Figures 15 th of August 2008 Cologne
 Next Generation Real Estate HY 2008 Figures Colonia Real Estate AG HY 2008 Figures 15 th of August 2008 Cologne Focused and Integrated Business Model Colonia Real Estate AG Investments Management Principal
CapitaCommercial Trust 3Q 2004 Results Presentation. 13 October 2004
 CapitaCommercial Trust 3Q 2004 Results Presentation 13 October 2004 Disclaimer This presentation is focused on comparing actual results versus forecast stated in the Introductory Document dated 16 March
Investor presentation. May 2009
 Investor presentation May 2009 1 Agenda Background Fundraising 3i s business and competitive strengths Key financials and valuations Pro forma balance sheet Summary 2 Background Analysis of 3i Strategically
European Market Outlook The Risks & the Opportunities Guy-young LAMÉ Associate Director Research Europe, Invesco Real Estate
 European Market Outlook The Risks & the Opportunities Guy-young LAMÉ Associate Director Research Europe, Invesco Real Estate This presentation is issued by Invesco Real Estate for Professional Clients
2018 half-year results presentation. 15 August 2018
 2018 half-year results presentation 15 August 2018 Forward-looking statements This presentation may include certain forward-looking statements, beliefs or opinions, including statements with respect to
DEXUS Property Group. Institutional placement 3 December m securities at $0.73 to $0.84 raising $286m - $329m
 DEXUS Property Group Institutional placement 3 December 2008 391.7m securities at $0.73 to $0.84 raising $286m - $329m DEXUS Funds Management Limited ABN 24 060 920 783 Australian Financial Services Licence
First World Hybrid Real Estate plc
 June 2017 Fund overview Steady expansion Key portfolio features Acquisition filter process Portfolio overview Performance & volatility Is UK property expensive or cheap? Against UK parameters Relative
PFI s strategy is to invest in quality industrial property in prime locations in order to deliver attractive returns with a low level of volatility
 PFI OVERVIEW Property for Industry (PFI) is an NZX listed property vehicle focused on industrial property PFI s strategy is to invest in quality industrial property in prime locations in order to deliver
European Investment Bulletin
 European Investment Bulletin Spring 2009 Prime yield decompression per sector (yoy) Rents in decline in line with business sentiment 200 CBD offices Warehouses Shopping Centres European average prime office
Interim results for the half year ended 31 March 2014
 Interim results for the half year ended 31 March 2014 16 May 2014 03.06.14.v3 Disclaimer This presentation contains certain forward-looking statements. Any statement in this presentation that is not a
INVESTOR PRESENTATION
 INVESTOR PRESENTATION February 2012 www.britishland.com INTRODUCTION British Land At a Glance One of Europe s leading REITS with 15.7bn property under management High quality 10.3bn UK retail and Central
Customer focus driving growth The Workspace Advantage. Full year results Investor and Analyst Presentation 7 June 2017
 Customer focus driving growth The Workspace Advantage Full year results Investor and Analyst Presentation 7 June 2017 1 AGENDA Workspace Jamie Hopkins Chief Executive Officer Performance Graham Clemett
LONDONMETRIC PROPERTY PLC ( LondonMetric or the Group or the Company ) THIRD QUARTER 2015 INTERIM MANAGEMENT STATEMENT
 THIRD QUARTER 2015 INTERIM MANAGEMENT STATEMENT") 26 January 2015 LONDONMETRIC PROPERTY PLC ( LondonMetric or the Group or the Company ) THIRD QUARTER 2015 INTERIM MANAGEMENT STATEMENT SIGNIFICANT ACTIVITY ENHANCES PORTFLIO METRICS FOR FUTURE INCOME AND
26 January 2015 LONDONMETRIC PROPERTY PLC ( LondonMetric or the Group or the Company ) THIRD QUARTER 2015 INTERIM MANAGEMENT STATEMENT SIGNIFICANT ACTIVITY ENHANCES PORTFLIO METRICS FOR FUTURE INCOME AND
Raven Russia Ltd Raven Russia Ltd. RAVEN RUSSIA. Results for the 12 months ending 31 December 2012
 RAVEN RUSSIA Results for the 12 months ending 31 December 2012 Disclaimer Certain financials, statements, beliefs and opinions in this document are forward-looking, and reflect the Company s or, as appropriate,
HIGHLIGHTS PROPERTY FOR INDUSTRY 2017 INTERIM RESULTS BRIEFING
 HIGHLIGHTS Internalisation of management on 30 June 2017 Increased guidance: distributable profit of between 7.70 and 7.90 cents per share, cash dividend of 7.45 cents per share Transition of the Penrose
Raven Russia Ltd. July 2010 Raven Russia Ltd. RAVEN RUSSIA. Trading Update as at 28 June 2010
 RAVEN RUSSIA Trading Update as at 28 June 2010 Disclaimer Certain financials, statements, beliefs and opinions in this document are forward-looking, and reflect the Company s or, as appropriate, the Company
For personal use only
 Growthpoint Properties Australia (ASX Code: GOZ) Growthpoint Properties Australia Trust ARSN 120 121 002 Growthpoint Properties Australia Limited ABN 33 124 093 901 AFSL 316409 For personal use only www.growthpoint.com.au
FY2012 Financial Results Presentation
 FY2012 Financial Results Presentation 21 January 2013 Knowing. Believing. Delivering ARA-CWT Trust Management (Cache) Limited Agenda Overview & FY12 Key Highlights 4QFY12 & FY12 Full Year Financial Performance
Important notice and disclaimer
 1 Important notice and disclaimer + This document has been prepared by Goodman Group (Goodman Limited (ABN 69 000 123 071), Goodman Funds Management Limited (ABN 48 067 796 641; AFSL Number 223621) as
Consolidated financial report
 Goodman European Partnership* and its controlled entities Consolidated financial report For the quarter ended 31 March 2017 (unaudited) * Legal entity: Goodman European Logistics Fund, FCP-FIS. GEP QUARTERLY
Rights Issue presentation. 19 February 2009
 Rights Issue presentation 19 February 2009 Disclaimer THIS DOCUMENT IS STRICTLY CONFIDENTIAL AND IS BEING PROVIDED TO YOU SOLELY FOR YOUR INFORMATION AND FOR USE AT A PRESENTATION TO BE HELD IN CONNECTION
Half year results to 30 June Morgan Sindall Group plc 2 August 2016
 Half year results to 30 June 2016 Morgan Sindall Group plc 2 August 2016 Agenda Introduction John Morgan HY 2016 Financial and Operational Review Steve Crummett Outlook and Prospects 2017 & beyond John
Assura Group. Results Presentation year ended 31 March Investing in the future of primary care property
 Assura Group Results Presentation year ended 31 March 2013 Investing in the future of primary care property Assura Group Introduction Graham Roberts Investing in the future of primary care property Assura
P R E S E N T A T I O N H1/ A U G U S T
 P R E S E N T A T I O N H1/2014 0 5 A U G U S T 2 0 1 4 D I S CLAIMER The statements contained herein may include statements of future expectations and other forward-looking statements that are based on
Aldermore Banking as it should be UK Challenger Bank Day
 Aldermore Banking as it should be UK Challenger Bank Day 09 June 2015 Banking as it should be SME focused bank Customer loans 1 22% Asset Finance Track record of accelerating profitability Invoice Finance
H Results July H Results - Lar España Real Estate. July 27 th,
 H1 2018 www.larespana.com Results July 2018 July 27 th, 2018 Agenda 01 02 03 04 05 H1 2018 Highlights Corporate Activity H1 2018 Financial Results Business Performance Closing Remarks 01 H1 2018 Highlights