3rd quarter Oslo, 24 October 2014
|
|
|
- Edmund McKenzie
- 6 years ago
- Views:
Transcription

1 3rd quarter 2014 Oslo, 24 October 2014


2 MILESTONE AKER BRYGGE OFFICIAL OPENING OF NEW SHOPPING STREET 23 OCTOBER 2014 SHOPPING STREET THROUGH STRANDEN 1, STRANDEN 3 AND STRANDEN 5 Indoor shopping street Stranden AKER BRYGGE OFFICIAL OPENING MAJOR OF OSLO OPENING THE NEW STREET
3 Agenda Highlights Financial update Markets and operations Closing remarks Olav Line Svein Hov Skjelle Olav Line Olav Line Q&A session
 Positive property value development Net increase in property values 0.6 per cent in Q3 NAV growth of NOK 0.38 per share in Q3 15 new rental contracts with total annual rent of NOK 21.")
4 HIGHLIGHTS Letting and project execution key priorities Revenue growth 11.5 % year on year * Revenues NOK million (Q3-13: NOK million) Earnings before value change NOK 40.3 (Q3-13: NOK 20.2 million) Positive property value development Net increase in property values 0.6 per cent in Q3 NAV growth of NOK 0.38 per share in Q3 15 new rental contracts with total annual rent of NOK 21.5 million in quarter. Key contracts: Sektor Gruppen AS sqm in Verkstedveien 1 **) Sales transactions closed Finnestadveien 44, NOK 733 million Maridalsveien 323, NOK 344 million STRANDEN 1 TERMINALBYGGET New large shareholder and change in board composition *) Adjusted for property disposals, Maridalsveien 323 and Finnestadveien 44 **) Verkstedveien 1, new name for redevelopment project Drammensveien 134 building 1-4 3
5 Agenda Highlights Financial update Markets and operations Closing remarks Olav Line Svein Hov Skjelle Olav Line Olav Line Q&A session
6 1Q Q Q Q Q Q Q Q Q Q Q Q Q Q Q Q Q Q Q Q Q Q Q Q Q Q Q Q 2014 NOK million % NOK per share FINANCIAL UPDATE Financial highlights Sold assets *) Quarterly rental income Profit before tax and value adj. Net LTV EPRA NAV Net asset value (NAV) *) Revenues related to disposed properties; Maridalsveien 323 and Finnestadveien 44
7 FINANCIAL UPDATE Income statement Q NOK million 1) 3Q Q 2013 Gross rental income Maintenance and property related cost Other property costs 2) Administrative and group expenses Operating result before value adjustments Change in market value of investment property Operating result Net financial items excluding derivatives Change in market value of financial derivatives Net financial items including derivatives Profit before income tax Income tax (not payable) Profit for the period Earnings per share (NOK) Profit before tax and value adjustments ) Finnestadveien 44 and Maridalsveien 323 sold during 3Q, included with revenues of NOK 8.2 million in Q3 2) Other property costs include marketing expenses and common cost related to vacant space (Q3: NOK 15.5 million)
8 FINANCIAL UPDATE Income statement 1Q - 3Q 2014 NOK million 1) YTD 2014 YTD 2013 Year 2013 Gross rental income Maintenance and property related cost Other property costs 2) Administrative and group expenses Operating result before value adjustments Change in market value of investment property Other gain/loss Operating result Net financial items excluding derivatives Change in market value of financial derivatives Net financial items including derivatives Profit before income tax Income tax (not payable) Profit for the period Earnings per share (NOK) Profit before tax and value adjustments ) Finnestadveien 44 and Maridalsveien 323 sold during 3Q, included with revenues of NOK 37.7 million YTD 2) Other property costs include marketing expenses and common cost related to vacant space (YTD 2014: NOK 43.1 million and Full Year 2013 NOK 56.9 million) 7
")
9 FINANCIAL UPDATE Increasing yield spread Swap rates continue drop 10 year swap now below 2.5 % Continued bond issues by real estated companies at reduced margins Strong competition in Nordic banking market 1) Source: Akershus Eiendom 8
10 Oslo 1) Based on rents as of 30 September 2014 and estimated property expenses of 6 per cent 2) Estimated fully let gross rent, average of Akershus Eiendom and DTZ Realkapital 3) Parking and storage is excluded from the calculation of space vacancy; forward starting leases are also excluded 4) Stranden 1, Stranden 3, Stranden 5 and Verkstedveien 1 (Drammensveien 134) FINANCIAL UPDATE Portfolio valuation by area Q External valuation conducted by DTZ RealKapital and Akershus Eiendom Positive fair value adjustment of NOK 89.8 million (0.6 per cent of portfolio value) NOK 100 million: positive effect from redevelopment projects NOK 56 million: negative effect form properties with short term contracts, primarily Stavanger NOK 45 million: positive effect on other properties, primarily from reduced discount factors. Area Total space (m²) Space 3) not generating revenue (%) Duration (years) NOK mill. Valuation NOK/m² Gross rent per year NOK mill. NOK/m² Net yield 1) (%) Gross market rent fully let 2) CBD Skøyen Nydalen Other Stavanger Running operations Redevelopment projects 4) Total office portfolio Q2 adjusted for disposal
11 FINANCIAL UPDATE Annual run rate potential fully let at market ,1 63,9 Of which NOK 161 million signed up but not started 600 Development portfolio - potential ,9 685,6 732,8 752,3 777,9 708,6 732,1 732,1 2Q-13 3Q-13 4Q-13 1Q-14 2Q-14 2Q-14 adj. for sale 1) Estimated fully let gross rent, average of Akershus Eiendom and DTZ Realkapital 3Q-14 Gross rent fully let at market 1) Running portfolie - potential Annual run rate - rental value end of quarter Stavanger, Forusbeen 35, Grenseveien 19 and 21; current rent NOK 71 million 9
12 FINANCIAL UPDATE Development projects DEVELOPMENT PROJECTS As of 30 September 2014 Gross space sqm Letting ratio Market rent, valuer estimated Remaining building cost Net yield on market rent Stranden % % Stranden % % Stranden % % Verkstedveien 1 (previously Drammensveien 134) *) % % Changes in third quarter: Increased letting ratios for all projects Minor changes to all market rent estimates for all ongoing projects Overall positive change in valuation of NOK 100 from redevelopment projects Remaining building cost for period estimated to ~ NOK million *) Drammensveien 134 (building 1-4) has been «renamed» by the municipality of Oslo. New name and adress is Verkstedveien 1. 11
13 FINANCIAL UPDATE Financial position Interest bearing debt and hedging Total interest bearing debt NOK million Property value NOK million Loan to value Per cent Net Loan to value 1) Per cent Cash and cash equivalents NOK million Unused committed credit facilities (short and long term) NOK million Average remaining duration, hedging Years Average interest rate (including margin) Per cent Average margin Per cent Average remaining duration, borrowing Years Hedging ratio Per cent

")

14 FINANCIAL UPDATE Financing Funding by source Bank financing Bank club 1, Nordea and SEB NOK 4.4 bn incl. NOK 0.6 bn revolving facility Maturity 2018 Bank club 2, DNB and Danske Bank NOK 4.4 bn incl. NOK 1.2 bn revolving facilities Original maturity June 2015 Extended to December 2016 (in Q4-2014) Commercial terms improved Bond issues diversification of debt 3Q-2013: NOK 500 mill., 3 years, 130 bp margin, LTV 65% Loan To Value 4Q-2013: NOK 455 mill., 4+ years, 150 bp margin, LTV 65% 2Q-2014: NOK 350 mill., 5 years, 130 bp margin, LTV 68% 4Q-2014: NOK 350 mill., 5 years, 98 bp margin, LTV 66% 16
15 FINANCIAL UPDATE Balance sheet NOK million Investment properties Property, plant and equipment Receivables Cash and cash equivalents Equity Deferred tax Long term interest bearing debt Short term interest bearing debt Market value financial derivatives (net) Net other debt Equity ratio (%) NAV per share, book value of equity (NOK) EPRA NAV per share (NOK) EPRA NNNAV per share (NOK)
16 FINANCIAL UPDATE Cash flow NOK million 3Q Q 2013 Year 2013 Cash flow from operating activities Cash received from sale of assets Purchase of tangible assets and subsidiaries Other investment activities Cash flow from investment activities Net change in interest bearing debt and other Paid dividend Net cash flow from financing activities Exchange rate effects Net change in cash Net cash at end of period
17 Shareholder structure Shareholding (%) # Name Share (%) Number of shares Account type Nationality 1 GEVERAN TRADING CO LTD ORD CYP 2 CANICA AS ORD NOR 3 FOLKETRYGDFONDET ORD NOR 65,7 % 34,3 % 4 THE BANK OF NEW YORK MELLON NOM NLD 5 STATE STREET BANK AND TRUST CO NOM USA 6 STATE STREET BANK & TRUST COMPANY NOM USA 7 THE BANK OF NEW YORK MELLON NOM USA Norwegian Foreign 8 BNP PARIBAS SEC. SERVICES S.C.A NOM LUX 9 STATE STREET BANK & TRUST CO NOM USA 10 STATE STREET BANK AND TRUST CO NOM USA 11 VERDIPAPIRFONDET DNB NORGE (IV) ORD NOR 12 VERDIPAPIRFONDET DNB NORGE SELEKTI ORD NOR 13 FONDSFINANS SPAR ORD NOR 14 KLP AKSJE NORGE INDEKS VPF ORD NOR 15 BNP PARIBAS SEC. SERVICES S.C.A NOM GBR 16 THE NORTHERN TRUST CO NOM GBR 17 ML PROFFESSIONAL CLEARING CORP NOM USA 18 J.P. MORGAN CHASE BANK N.A. LONDON NOM GBR 19 STATE STREET BANK & TRUST COMPANY NOM USA 20 EURO REAL ESTATE SECUR FD ORD LUX Total 20 largest shareholders /20 NOR No. of shareholders Norwegian Foreign As of 22 October
18 Agenda Highlights Financial update Markets and operations Closing remarks Olav Line Svein Hov Skjelle Olav Line Olav Line Q&A session

19 MARKETS AND OPERATIONS Market trends Rental market Oslo Space vacancy stable at 7 per cent Still limited new supply in period 2014 to 2016 Continued conversion of office to residental Tendencies to more selective market Stable to slowly increasing rents expected Rental market Stavanger Cautious rental market as oil-and offshore businesses gradually increase cost focus Several larger bids in market Transaction market still healthy Improved availability of financing Borrowing cost reduced as swap rates drop and borrowing margins continue to decrease Several large transactions involving international investors Listing of Entra Eiendom Yield compression :: STRANDEN, AKER BRYGGE:: Construction market Pressure in construction market easing
 Sektor Eiendom 1 840 sqm Total contract volume signed last 2.75 years: 189 contracts and NOK 450 million in annual rent (excluding storage, parking etc.")
20 MARKETS AND OPERATIONS Significant rental contracts in Q3 Aker Brygge Konstali Helsenor ~ sqm in Bryggegata 7-9 Retail ~ sqm with different retailers Drammensveien 134 (now Verkstedveien 1) Sektor Eiendom sqm Total contract volume signed last 2.75 years: 189 contracts and NOK 450 million in annual rent (excluding storage, parking etc.)
 Minor changes to «mix» offices and")
21 MARKETS AND OPERATIONS Redevelopment projects 70 % letting ratio Remaining office, sqm Remaining retail Letting ratio, space Stranden % Stranden % Stranden % PROJECTS AKER BRYGGE % Verkstedveien % TOTAL PROJECTS % :: AKER BRYGGE, OSLO: STRANDEN 1 COMPLETION Q :: *) Minor changes to «mix» offices and retail from last quarter


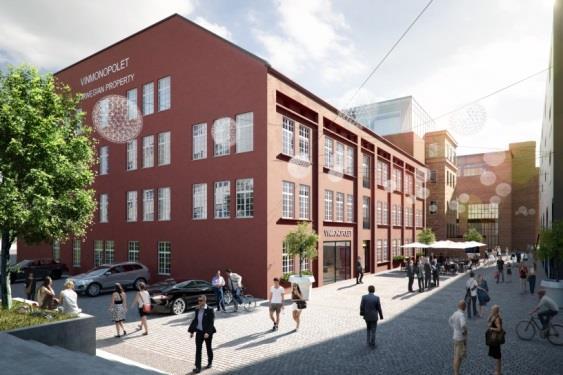
22 Retail Aker Brygge VINMONOPOLET MOVING TO AKER BRYGGE IN JANUARY 2015
23 MARKETS AND OPERATIONS Operational highlights Healthy rental market outlook and improved transaction market Total space vacancy (space not generating income) of 24.9 per cent, reduction from 26.0 per cent (adjusted for disposals) *) at the end of the previous quarter Vacant space not generating revenue in refurbishment projects accounts for about 13.4 per cent of total vacancy Ordinary vacancy accounting for 11.7 per cent; of which Badehusgaten is about 5.2 per cent of total :: AKER BRYGGE, OSLO: BRYGGEGATA 7-9 :: 15 new contracts, renewals or extensions with total annual value of NOK 21.5 million CDP (Carbon Disclosure Project) score improved Disclosure score 91 (improvement from 85) Performance band B (improvement from C) *) Adjusted for the sale of Finnestadveien 44 and Maridalsveien 323. Reported vacancy in Q was 23.9 per cent including these properties


: Q4-2014 / Q1-2015 Retail:")
 has been «renamed» by the municipality of Oslo.")
24 MARKETS AND OPERATIONS Status development projects Stranden 3 - Verkstedhallene Completion: Remaining retail gradually during Q Verkstedveien 1 *) Completion Q ::STRANDEN 3 AKER BRYGGE :: ::VERKSTEDVEIEN 1 SKØYEN :: Stranden 1 Completion Offices: Q / Q Retail: H ::STRANDEN 1 AKER BRYGGE :: Stranden 5 Completion Offices (remaining): Q / Q Retail: H ::STRANDEN 5 AKER BRYGGE:: *) Drammensveien 134 (building 1-4) has been «renamed» by the municipality of Oslo. New name and adress is Verkstedveien 1


25 MARKETS AND OPERATIONS Changes to portfolio Finnestadveien 44, Stavanger Disposal completed in August 2014 Buyers are subidiaries of W. P. Carey Inc. Property value NOK 733 million Gross rent at end Q2-2014: NOK 45.5 million Maridalsveien 323, Nydalen Disposal completed in September 2014 Buyers are subsidiaries of Ness Risan and Partners Property value NOK 344 million Gross rent at end Q2-2014: NOK 23.8 million :: FINNESTADVEIEN 44 :: Strategic assessment of remaining Stavanger portfolio ongoing Intensified focus on letting of vacant and potential vacant space :: MARIDALSVEIEN 323 ::
26 Agenda Highlights Financial updates Markets and operations Closing remarks Olav Line Svein Hov Skjelle Olav Line Olav Line Q&A session


27 CLOSING REMARKS Gradual completion of development projects Revenues gradually increasing during 2014 as projects are completed Market vacancy stable Yield compression Letting and good project execution are key priorities Increased focus on growth opportunities after redevelopments :: AKER BRYGGE BRYGGETORGET :: 26

28 Q&A For further details about our properties, news and investor information, please have a look at our website; 27
 Net volume by year of lease maturity 1) 1) Net")
29 APPENDIX Diversified portfolio maturity 6.1 years duration of leases Space vacancy at 24.9 per cent 97.8 per cent of lease rent is CPI adjusted (cash flow inflation hedged) Net volume by year of lease maturity 1) 1) Net volume, light space only 28
30 APPENDIX Debt maturity profile Q *) Majority of maturity in 2015 extended to December

31 APPENDIX Maturity profile interest hedges Q The effect of forward starting swaps with higher fixed interest rate replacing existing swaps with lower fixed interest rates is calculated to 94 bp. 30

 NOK mill.")


32 APPENDIX Overview and key figures Key figures as of 30 September 2014 Properties no 39 Portfolio size (ex. new space in redev. Projects) m² Average size per property m² Gross rent per year (run rate) NOK mill. 732 Operational expenses per year 1) NOK mill. 44 Net rent per year (run rate) NOK mill. 688 Average gross rent per m² per year NOK Gross market value NOK mill Average value per property NOK mill. 392 Average value per m² NOK Gross yield, actual % 4.8 Net yield, actual % 4.5 Gross yield at market rent fully let 2) % 7.0 Net yield at market rent fully let 2) % 6.5 Duration Years 6.1 CPI adjustment per 1 Jan 2014 % 97.8 Vacancy (space including strategic vacancy) %


33 APPENDIX Exposure to prime locations in Oslo 32

34 APPENDIX CBD 33

35 APPENDIX Skøyen 34

36 APPENDIX Nydalen 35


37 APPENDIX Stavanger 36
38 APPENDIX Property details Q /5 Property facts Rent facts Space split Property Offices Retail / restaurant Warehouse Indoor parking Other Total m2 Space vacancy OSLO/AKERSHUS m 2 m 2 m 2 m 2 m 2 m 2 % % Years CPI Duration per Sep 2014 Run rate per Sep 2014 NOK million CBD Bryggegata Dokkbygningen Drammensveien Fondbygget Kaibygning I (Stranden 5) Kaibygning II Støperiet Stortingsgata Terminalbygget (Stranden 1) Tingvallautstikkeren, uteareal og marina Verkstedhallene (Stranden 3) Total CBD In Q revision of space has been implemented for most properties Duration including forward starting leases 37
39 APPENDIX Property details Q /5 Property facts Rent facts Space split Property Offices Retail / restaurant Warehouse Indoor parking Other Total m2 Space vacancy OSLO/AKERSHUS m 2 m 2 m 2 m 2 m 2 m 2 % % Years CPI Duration per Sep 2014 Run rate per Sep 2014 NOK million Skøyen Drammensveien building Drammensveien 134 parking Drammensveien 134 outdoor Hovfaret Nedre Skøyen vei Nedre Skøyen vei Verkstedveien 1 (prev. Dr to 4) Verkstedveien 3 (prev. Dr building 5) Total Skøyen In Q revision of space has been implemented for most properties Duration including forward starting leases 38
40 APPENDIX Property details Q /5 Property facts Rent facts Space split Property Offices Retail / restaurant Warehouse Indoor parking Other Total m2 Space vacancy OSLO/AKERSHUS m 2 m 2 m 2 m 2 m 2 m 2 % % Years CPI Duration per Sep 2014 Run rate per Sep 2014 NOK million Nydalen Gjerdrums vei 10 D ,6 100,0 3,7 2,8 Gjerdrums vei 14, 16 and 16 P-house ,8 98,0 2,8 8,9 Gjerdrums vei ,8 100,0 8,1 0,7 Gjerdrums vei ,1 100,0 6,7 9,1 Gullhaug Torg ,4 100,0 7,6 8,2 Gullhaugveien ,7 100,0 5,3 45,3 Nydalsveien ,0 100,0 5,2 7,0 Nydalsveien ,0 100,0 10,8 3,9 Sandakerveien ,5 100,0 2,3 13,5 Total Nydalen ,6 99,8 5,2 99,4 In Q revision of space has been implemented for most properties Duration including forward starting leases 39
41 APPENDIX Property details Q /5 Property facts Rent facts Space split Property Offices Retail / restaurant Warehouse Indoor parking Other Total m2 Space vacancy OSLO/AKERSHUS m 2 m 2 m 2 m 2 m 2 m 2 % % Years CPI Duration per Sep 2014 Run rate per Sep 2014 NOK million Other Lysaker Torg Oslo Airport Gardermoen Snarøyveien 36 (prev. Aker Hus) Total Other TOTAL OSLO / AKERSHUS In Q revision of space has been implemented for most properties Duration including forward starting leases 40
42 APPENDIX Property details Q /5 Property facts Rent facts Space split Property Offices Retail / restaurant Warehouse Indoor parking Other Total m2 Space vacancy STAVANGER m 2 m 2 m 2 m 2 m 2 m 2 % % Years CPI Duration per Sep 2014 Run rate per Sep 2014 NOK million CBD Badehusgata Forus/Airport Forusbeen Grenseveien Grenseveien Maskinveien Strandsvingen Svanholmen Total Stavanger GROSS TOTAL Duration including forward starting leases 41
43 APPENDIX Largest tenants Tenant Duration (years) Rent (NOK mill.) Share of total portfolio (%) Sector Public sector participation Listed at group level Evry IT Aker Solutions Oil Service Statoil Energy and oil Höegh Autoliners Shipping Telenor Telecom SAS Travel Teliasonera Telecom Danske Bank Financials Skanska Construction Det norske oljeselskap Energy and oil GET Telecom Statlige og kommunale instanser Public services TDC Energy and oil Umoe Restaurant Group AS Restaurant DNO Energy and oil Total 15 largest tenants /25 13/15 Total other tenants Total all tenants
44 APPENDIX Largest shareholders as of 30 Sep 2014 # Name Share (%) Number of shares Account type Nationality 1 GEVERAN TRADING CO L ORD CYP 2 CANICA AS ORD NOR 3 FOLKETRYGDFONDET ORD NOR 4 The Bank of New York BNY MELLON A/C APG A NOM NLD 5 STATE STREET BANK & S/A SSB CLIENT OMNI NOM USA 6 Skandinaviska Enskil A/C CLIENTS ACCOUNT NOM SWE 7 STATE STREET BANK AN A/C CLIENT OMNIBUS F NOM USA 8 The Bank of New York BNY MELLON NOM USA 9 BNP Paribas Sec. Ser S/A BP2S LUX/FIM/LUX NOM LUX 10 STATE STREET BANK & A/C CLIENT FUND NUMB NOM USA 11 STATE STREET BANK AN A/C WEST NON-TREATY NOM USA 12 VERDIPAPIRFONDET DNB ORD NOR 13 VERDIPAPIRFONDET DNB ORD NOR 14 BNP Paribas Sec. Ser S/A TR PROPERTY INVE NOM GBR 15 Merrill Lynch Intern C/O MLI GEF NON TREA NOM GBR 16 FONDSFINANS SPAR ORD NOR 17 KLP AKSJE NORGE INDE ORD NOR 18 J.P. Morgan Chase Ba NORDEA TREATY ACCOUN NOM GBR 19 STATE STREET BANK & S/A SSB CLIENT OM NOM USA 20 J.P. Morgan Chase Ba NORDEA RE:NON-TREATY NOM GBR Total 20 largest shareholders /20 NOR 43
45 APPENDIX Appendices Definitions relating to development projects Startup Initiation of construction Completion When ready for tenants to move in Approval Timing of public approvals necessary to start project Building from Form of construction contract Space Space based on current project as estimated by OPAK Current letting ratio Space of rental contracts entered divided by total space Rent 2011, Q2 Rent generated by building in 2011-Q2 Market rent valuer estimate Market rent estimated by valuers (2014 value); include effects of revenue based rents and market adjustments of «existing» contracts Remaining building cost Remaining construction and building cost, VAT, riskassessment, management etc. Net yield on market rent Market rent estimated by valuers less ordinary property expenses of 6 per cent divided by current value of property, construction and building cost, VAT, risk assessment, financing expenses, value of acquired sections, termination of leases etc.
46 Disclaimer The information included in this Presentation contains certain forward-looking statements that address activities, events or developments that Norwegian Property ASA ( the Company ) expects, projects, believes or anticipates will or may occur in the future. These statements are based on various assumptions made by the Company, which are beyond its control and are subject to certain additional risks and uncertainties. The Company is subject to a large number of risk factors including but not limited to economic and market conditions in the geographic areas and markets in which Norwegian Property is or will be operating, counterparty risk, interest rates, access to financing, fluctuations in currency exchange rates, and changes in governmental regulations. For a further description of other relevant risk factors we refer to Norwegian Property s Annual Report for As a result of these and other risk factors, actual events and our actual results may differ materially from those indicated in or implied by such forward-looking statements. The reservation is also made that inaccuracies or mistakes may occur in the information given above about current status of the Company or its business. Any reliance on the information above is at the risk of the reader, and Norwegian Property disclaims any and all liability in this respect. 45
2nd quarter Oslo, 11 July 2014
 2nd quarter 2014 Oslo, 11 July 2014 Agenda Highlights Financial update Markets and operations Closing remarks Olav Line Svein Hov Skjelle Olav Line Olav Line Q&A session HIGHLIGHTS Letting and project
1st quarter 2015 Oslo, 30 April 2015
 1st quarter 2015 Oslo, 30 April 2015 Agenda Highlights Financial update Markets and operations Closing remarks Olav Line Svein Hov Skjelle Olav Line Olav Line Q&A session 2 Revenue growth and increasing
2nd quarter 2016 Oslo, 12 July 2016
 2nd quarter 2016 Oslo, 12 July 2016 Agenda Highlights Financial update Markets and operations Closing remarks Q&A session 2 Q2 in short: Dividend, revenue growth and increasing Net Asset Value Revenue
2 nd quarter Oslo 12 June 2013
 2 nd quarter 2013 Oslo 12 June 2013 2Q 2013 PRESENTATION Agenda Highlights Olav Line Financial update Svein Hov Skjelle Markets and operations Olav Line Closing remarks Olav Line Q & A session HIGHLIGHTS
3rd quarter 2017 Oslo, 20 October 2017
 3rd quarter 2017 Oslo, 20 October 2017 Agenda Highlights Financial update Markets and operations Closing remarks Q&A session 2 Q3 in short: Revenues NOK 197,7 million Improving rental markets Earnings
1 st quarter Oslo 3 May 2013
 1 st quarter 2013 Oslo 3 May 2013 1Q 2013 PRESENTATION Agenda Highlights Olav Line Financial update Svein Hov Skjelle Markets and operations Olav Line Redevelopment projects - status Olav Line Closing
2nd quarter 2017 Oslo, 12 July 2017
 2nd quarter 2017 Oslo, 12 July 2017 Agenda Highlights Financial update Markets and operations Closing remarks Q&A session 2 Q2 in short: Revenues NOK 196.5 million Earnings per share (EPS), NOK 0.47 Dividend
3 rd quarter Oslo 26 October 2012
 3 rd quarter 2012 Oslo 26 October 2012 3Q 2012 PRESENTATION Agenda Highlights Olav Line Financial update Svein Hov Skjelle Markets and operations Olav Line Closing remarks Olav Line Q&A session HIGHLIGHTS
2 nd quarter Oslo 16 July 2012
 2 nd quarter 2012 Oslo 16 July 2012 ANNOUNCEMENT 16 JULY 2012 New agreements confirms good market activity Lysaker torg 35 Uno-X Energi enters new lease at Lysaker for approx. 2 700 square meters Five
4 th quarter Oslo 15 February 2013
 4 th quarter 2012 Oslo 15 February 2013 4Q 2012 PRESENTATION Agenda Highlights Olav Line Financial update Svein Hov Skjelle Markets and operations Olav Line Closing remarks Olav Line Q&A session HIGHLIGHTS
1 st quarter Oslo 4 May 2012
 1 st quarter 2012 Oslo 4 May 2012 1Q 2012 PRESENTATION Agenda Highlights Olav Line Financial update Svein Hov Skjelle Markets and operations Olav Line Closing remarks Olav Line Q&A session HIGHLIGHTS 1Q
1st quarter 2018 Oslo, 4 May 2018
 1st quarter 2018 Oslo, 4 May 2018 Agenda Highlights Markets and operations Financial update Closing remarks Q&A session 2 Q1 in short: Revenues NOK 197.1 million Turnover growth for retail Aker Brygge
3rd quarter 2018 Oslo, 25 October 2018
 3rd quarter 2018 Oslo, 25 October 2018 Agenda Highlights Markets and operations Financial update Closing remarks Q&A session 2 Q3 in short: Revenues NOK 202 million Earnings per share (EPS) NOK 0.23 Dividend
2nd quarter 2018 Oslo, 13 July 2018
 2nd quarter 2018 Oslo, 13 July 2018 Agenda Highlights Markets and operations Financial update Closing remarks Q&A session 2 Q2 in short: Revenues NOK 198.8 million Earnings per share (EPS) NOK 0.06 Dividend
1st quarter 2017 Oslo, 5 May 2017
 1st quarter 2017 Oslo, 5 May 2017 Agenda Highlights Financial update Markets and operations Closing remarks Q&A session 2 Q1 in short: Revenues NOK 196.6 million Earnings per share (EPS), NOK 0.39 New
4 th quarter Oslo 29 February 2012
 4 th quarter 2011 Oslo 29 February 2012 ANNOUNCEMENT 29 FEBRUARY 2012 New long-term lease with solid tenant at Skøyen Long-term agreement with Statens Pensjonskasse *) to rent office space in Drammensveien
3 rd quarter Oslo 27 October 2011
 3 rd quarter 2011 Oslo 27 October 2011 3Q 2011 PRESENTATION Agenda Highlights Olav Line Financial update Svein Hov Skjelle Markets and operations Olav Line Closing remarks Olav Line Q&A session HIGHLIGHTS
FIRST QUARTER Q 2013
 FIRST QUARTER 2013 1Q 2013 IMPORTANT EVENTS IN THE FIRST QUARTER OF 2013 POSITIVE RENTAL MARKET BUT CONVERSION PROJECTS TEMPORARILY IMPACT OPERATION Stable operation, temporary impact from conversion projects
1 st quarter Oslo 5 May 2011
 1 st quarter 2011 Oslo 5 May 2011 1Q 2011 PRESENTATION Agenda Highlights Olav Line Financial update Svein Hov Skjelle Markets and operations Olav Line Closing remarks Olav Line Q&A session HIGHLIGHTS Positive
2 nd quarter Oslo 23 August 2011
 2 nd quarter 2011 Oslo 23 August 2011 2Q 2011 PRESENTATION Agenda Highlights Olav Line Financial update Svein Hov Skjelle Markets and operations Olav Line Closing remarks Olav Line Q&A session HIGHLIGHTS
INTERIM REPORT SECOND QUARTER AND FIRST HALF OF 2014
 INTERIM REPORT SECOND QUARTER AND FIRST HALF OF 2014 IMPORTANT EVENTS IN THE SECOND QUARTER OF 2014 GROWING RENTAL INCOME FROM PHASING IN LEASES Rental income up from first to second quarters A number
3rd quarter 2010 Oslo, 27 October 2010
 3rd quarter 2010 Oslo, 27 October 2010 3RD QUARTER 2010 Agenda Highlights and key figures Olav Line Financial update Svein Hov Skjelle Markets and operations Olav Line Strategy for long-term value creation
FINANCIAL REPORT FOR THE SECOND QUARTER AND FIRST HALF OF Q 2012
 FINANCIAL REPORT FOR THE SECOND QUARTER AND FIRST HALF OF 2012 2Q 2012 IMPORTANT EVENTS IN THE SECOND QUARTER AND FIRST HALF OF 2012 CONVERSIONS TEMPORARILY AFFECT OPERATIONS, LETTING MARKET POSITIVE Stable
INTERIM REPORT FIRST QUARTER 2018
 INTERIM REPORT FIRST QUARTER 2018 HIGHLIGHTS IN THE FIRST QUARTER OF 2018 Positive rental income trend for Aker Brygge properties Overall rental income came to NOK 197.1 million, virtually unchanged from
INTERIM REPORT SECOND QUARTER AND FIRST HALF 2018
 INTERIM REPORT SECOND QUARTER AND FIRST HALF 2018 IMPORTANT EVENTS IN THE SECOND QUARTER OF 2018 Positive rental income trend for Aker Brygge properties Overall rental income came to NOK 198.8 million,
Presentation DNB Oslo, September 20, 2018
 Presentation DNB Oslo, September 20, 2018 Norwegian Property commercial property Prime long term focus Prime commercial properties in attractive locations Oslo CBD West Oslo Nydalen Focus going forward
NORWEGIAN PROPERTY ASA REPORT FOR THE FOURTH QUARTER 2007
 REPORT FOR THE FOURTH QUARTER - 2007 NORWEGIAN PROPERTY ASA REPORT FOR THE FOURTH QUARTER 2007 HIGHLIGHTS FOR THE QUARTER Rental income was NOK 450.2 million in the fourth quarter of 2007 (NOK 202.5 million
PROPERTY ASA REPORT FOR THE FIRST QUARTER 2007
 REPORT FOR THE FIRST QUARTER - 2007 NORWEGIAN PROPERTY ASA REPORT FOR THE FIRST QUARTER 2007 HIGHLIGHTS FOR THE QUARTER Rental income was NOK 248.6 million and profit before tax was NOK 345.4 million in
PROPERTY ASA REPORT FOR THE SECOND QUARTER 2007
 REPORT FOR THE SECOND QUARTER - 2007 NORWEGIAN PROPERTY ASA REPORT FOR THE SECOND QUARTER 2007 HIGHLIGHTS FOR THE QUARTER Rental income was NOK 243.8 million and profit before tax was NOK 1 141.7 million
PROPERTY ASA REPORT FOR THE FOURTH QUARTER 2006
 REPORT FOR THE FOURTH QUARTER - 2006 NORWEGIAN PROPERTY ASA REPORT FOR THE FOURTH QUARTER 2006 HIGHLIGHTS FOR THE QUARTER Rental income was NOK 202.5 million and profit before tax was NOK 522.4 million
NORWEGIAN PROPERTY ASA REPORT FOR THE FIRST HALF YEAR 2008
 REPORT FOR THE FIRST HALF YEAR - 2008 NORWEGIAN PROPERTY ASA REPORT FOR THE FIRST HALF YEAR 2008 HIGHLIGHTS FOR THE QUARTER Net Asset Value per share post equity issue is NOK 39.51. Adjusted Net Asset
Economic Overview 1.9% 4.9% 1.8% 2.0% 0.5% 2018E 2.4% 1.0% 3.2% 4.1% 1.9%
 MarketBeat Q1 2018 Economic Overview 2018 GDP mainland growth is forecast to be 3.2%, up from 1.9% in 2017. Growth is domestically driven, with increased consumption and mainland investment the main sources.
Preliminary results th Quarter 2007
 Preliminary results 2007 4th Quarter 2007 15 February 2008 www.npro.no www.norwegianproperty.no Highlights 4th Quarter Stable financial performance in fourth Quarter Rental income of NOK 450.2 million
Equity per share (NOK) Equity ratio 43 % 40 % 41 % Non-current net asset value per share (NOK) (EPRA NNNAV) 2)
 Equity ratio 43 % 40 % 41 % Non-current net asset value per share (NOK) (EPRA NNNAV) 2)") REPORT FOR Q3 2017 KEY FIGURES Amounts in NOK million 30.09.17 30.09.16 31.12.16 Net rental income 1 822 1 688 2 243 Fair value adjustments in investment properties and interest rate derivatives 1) 2 045
REPORT FOR Q3 2017 KEY FIGURES Amounts in NOK million 30.09.17 30.09.16 31.12.16 Net rental income 1 822 1 688 2 243 Fair value adjustments in investment properties and interest rate derivatives 1) 2 045
All time high. DTZ Research INVESTMENT MARKET UPDATE. Norway Q Contents. Author. Contacts
 DTZ Research INVESTMENT MARKET UPDATE All time high Norway Q3 2015 Date 2 nd of July 2015 Contents Author 1. Summary 2. The Capital Market 3. Activity in Q1 4. Outlook Jørn Høistad Partner, Analysis &
NOT FOR RELEASE, PUBLICATION OR DISTRIBUTION IN OR INTO THE UNITED STATES, CANADA, JAPAN OR AUSTRALIA. Prospectus. Norwegian Property ASA
 NOT FOR RELEASE, PUBLICATION OR DISTRIBUTION IN OR INTO THE UNITED STATES, CANADA, JAPAN OR AUSTRALIA Prospectus Norwegian Property ASA (Organisation number: 988 622 036) www.npro.no Fully underwritten
Third Quarter 2011 CEO Sverre Hurum CFO Erik Stubø
 15 November 2011 Third Quarter 2011 CEO Sverre Hurum CFO Erik Stubø Disclaimer The information contained in the Presentation is for your use only. Recipients may not reproduce, redistribute or pass on,
Your Aquaculture Technology and Service Partner. Q Presentation Oslo - August 17 th, 2016 Trond Williksen, CEO Eirik Børve Monsen, CFO
 Q2 2016 Presentation Oslo - August 17 th, 2016 Trond Williksen, CEO Eirik Børve Monsen, CFO Agenda 1 Highlights 2 Financial performance 3 Outlook 4 Q&A Highlights Q2 2016 - by CEO Trond Williksen 3 Improved
Interim presentation Third quarter 2014
 Interim presentation Third quarter 2014 Sverre Hurum. CEO Erik Stubø. CFO 12 November 2014 Highlights in the third quarter Revenues and EBIT Reduced revenues from Statoil Operating revenues decreased 2.7
MARKETBEAT Q NORWAY
 MARKETBEAT Q1 2017 NORWAY Cushman & Wakefield Realkapital assisted Realkapital Corporate Finance in the purchase 1 of Grønland 34, Drammen 2003 2004 2005 2006 2007 2008 2009 2010 2011 2012 2013 2014 2015
Olav Thon Eiendomsselskap. Arne B. Sperre Executive Vice President Finance
 Olav Thon Eiendomsselskap Arne B. Sperre Executive Vice President Finance Oslo, September 20, 2018 Agenda Olav Thon Eiendomsselskap Investment strategy Business area and it s property portfolio Key financials
SpareBank 1 SR-Bank ASA 3rd quarter 2014
 SpareBank 1 SR-Bank ASA 3rd quarter 2014 Page 1 Disclaimer This presentation contains forward-looking statements that reflect management s current views with respect to certain future events and potential
Your Aquaculture Technology and Service Partner. Q Presentation Oslo - February 19 th, 2016 Trond Williksen, CEO Eirik Børve Monsen, CFO
 Q4 2015 Presentation Oslo - February 19 th, 2016 Trond Williksen, CEO Eirik Børve Monsen, CFO Agenda 1 Highlights 2 Financial performance 3 Outlook 4 Q&A Highlights Q4 2015 - by CEO Trond Williksen 3 MNOK
Q3 RESULTS DNB GROUP THIRD QUARTER Roadshow London, Edinburgh and Dublin
 Q3 RESULTS DNB GROUP THIRD QUARTER 2015 Roadshow London, Edinburgh and Dublin 22.10.2015 Third quarter 2015 Pre-tax operating profit before impairment in NOK billion 8.1 (7.6) Cost/income ratio in per
RomReal Limited. Investor presentation Third Quarter (Q3) 2017 results
 2017 results") RomReal Limited Investor presentation Third Quarter (Q3) 2017 results Harris Palaondas - IR Webcast 24 November 2017 This Presentation of the Q3 2017 results of RomReal Ltd (the Company ) has been prepared
RomReal Limited Investor presentation Third Quarter (Q3) 2017 results Harris Palaondas - IR Webcast 24 November 2017 This Presentation of the Q3 2017 results of RomReal Ltd (the Company ) has been prepared
SpareBank 1 SR-Bank ASA. 3rd quarter st November Page 1
 SpareBank 1 SR-Bank ASA 3rd quarter 2012 1st November 2012 Page 1 Disclaimer This presentation contains forward-looking statements that reflect management s current views with respect to certain future
Interim presentation. 4 th quarter 2012 Sverre Hurum, CEO Erik Stubø, CFO 27 February 2013
 Interim presentation 4 th quarter 2012 Sverre Hurum, CEO Erik Stubø, CFO 27 February 2013 1 Highlights in the fourth quarter Revenues and EBIT Operating revenues increased 8.7 percent to NOK 280.5 (y-
Equity per share (NOK) Equity ratio 42 % 39 % 41 % Non-current net asset value per share (NOK) 2)
 Equity ratio 42 % 39 % 41 % Non-current net asset value per share (NOK) 2)") REPORT FOR Q1 2017 KEY FIGURES Amounts in NOK million 31.03.17 31.03.16 31.12.16 Net rental income 608 560 2 243 Fair value adjustments in investment properties and interest rate derivatives 1) 612 143
REPORT FOR Q1 2017 KEY FIGURES Amounts in NOK million 31.03.17 31.03.16 31.12.16 Net rental income 608 560 2 243 Fair value adjustments in investment properties and interest rate derivatives 1) 612 143
INTERIM REPORT Kunnskapssenteret Sandvika
 INTERIM REPORT 01.04. - 30.06.2014 Kunnskapssenteret Sandvika Q2 2014 THIS IS ENTRA EIENDOM Entra is one of Norway's leading real estate companies, focusing on high quality, flexible office buildings with
interim report Fredrik Selmers vei 4, Oslo
 interim report 01.10. - 31.12.2013 Fredrik Selmers vei 4, Oslo 3 Q4 2013 THIS IS ENTRA Entra is one of Norway's leading real estate companies, focusing on high quality, flexible office buildings with good
Financial stability 2/11. Charts
 Financial stability /11 Charts External sources of risk to banking sector Vulnerability in banking sector Chart 1.1 Vulnerabilities in the Norwegian banking sector and external sources of risk to the banking
NORWAY MARKET REPORT H Accelerating success.
 NORWAY MARKET REPORT H1 2014 Accelerating success. Colliers International is handling the letting of Sjølyst Plass 4 for Sparebank 1 Liv Full steam ahead Colliers international AS have in 2014 seen a tremendous
Q May 6, CEO Geir Olsen
 Q1 2010 May 6, 2010 CEO Geir Olsen Highlights Strong market picture in Q1 for OTC Market Services continues to perform well Clearing and Exchange with a weak start of the year Underlying EBITDA of NOK
EKORNES ASA. 3rd QUARTER 2007
 EKORNES ASA 3rd QUARTER 2007 1 Ekornes Q3 - Headlines: Strong growth in important markets Central Europe: Q3 order influx up 17% and revenues up 8% in local currency USA: Q3 order influx up 22% and revenues
Market Report. 2. half-year Workplace Oo, Vitaminveien 4 Letting assignment on behalf of Skanska CDN
 Market Report 2. half-year 2016 Workplace Oo, Vitaminveien 4 Letting assignment on behalf of Skanska CDN Market report 2 2. half-year 2016 3 DNB Næringsmegling We are one of Norway s leading commercial
Entra ASA. Funding and risk management for real estate, April 2017
 Entra ASA Funding and risk management for real estate, April 2017 Agenda About Entra Management of financing mix in volatile and changing financial markets Green bond financing for real estate Financial
NORTH BRIDGE NORDIC PROPERTY AS STATUS REPORT 4TH QUARTER 2010
 NORTH BRIDGE NORDIC PROPERTY AS STATUS REPORT 4TH QUARTER 2010 PRELIMINARY NET ASSET VALUE AS AT 31.12.2010 Preliminary net asset value of the North Bridge Nordic Property AS share (Company/NBNP) is put
CEO, MARCEL KOKKEEL CFO, EXEC. VP EERO SIHVONEN AUDIOCAST PRESENTATION Q1/2016
 CEO, MARCEL KOKKEEL CFO, EXEC. VP EERO SIHVONEN AUDIOCAST PRESENTATION Q1/2016 SOLID QUARTERLY RESULTS SUPPORTED BY GOOD PERFORMANCE IN NORWAY HIGHLIGHTS Q1/2016 SOLID FINANCIAL RESULTS SUPPORTED BY GOOD
Summary per cent Yara International ASA Senior Unsecured Open Bond Issue 2014/2021 NO Joint Lead Managers 19.
 2.55 per cent Yara International ASA Senior Unsecured Open Bond Issue 2014/2021 NO0010727985 Joint Lead Managers 19.01 2015 Prepared according to Commission Regulation (EC) No 486/2012 article 1 (10) -
Shareholder information
 SHAREHOLDER INFORMATION Index 107 07: Shareholder information Share price development in 2010 NOK 65 60 55 50 45 40 35 30 25 Jan. Feb. Mar. Apr. May Jun. Jul. Aug. Sept. Oct. Nov. Dec. Hydro Oslo Børs
Your Aquaculture Technology and Service Partner. Q Presentation Oslo - May 11 th, 2016 Trond Williksen, CEO Eirik Børve Monsen, CFO
 Q1 2016 Presentation Oslo - May 11 th, 2016 Trond Williksen, CEO Eirik Børve Monsen, CFO Agenda 1 Highlights 2 Financial performance 3 Outlook 4 Q&A Highlights Q1 2016 - by CEO Trond Williksen 3 MNOK On
Q BAKKAFROST GROUP Oslo 10 May 2016
 2016 BAKKAFROST GROUP Oslo 10 May 2016 DISCLAIMER This presentation includes statements regarding future results, which are subject to risks and uncertainties. Consequently, actual results may differ significantly
INVESTOR REPORT 3RD QUARTER 2017 DNB SCANDINAVIAN PROPERTY FUND DA
 REIM INVESTOR REPORT 3RD QUARTER 2017 DNB SCANDINAVIAN PROPERTY FUND DA Øyrane Torg Contents 1. Summary...3 2. Market values and return... 4 3. Investment capacity and planned issues... 6 4. Market comments
Outlook for the Norwegian economy
 .9.9 Outlook for the Norwegian economy Governor Svein Gjedrem, Norges Bank, September 9 Indicator for world trade -month change. Per cent. January July 9 Manufacturing production Growth in past months.
2011 first-half earnings
 2011 first-half earnings Bernard Michel Non-executive chairman Christophe Clamageran Chief executive officer Gilles Bonnier Chief financial officer Paris, July 27, 2011 H1 2011 snapshot in mn June 30,
Investor Relations. Supplementary information Fourth Quarter 2014
 Investor Relations Supplementary information Fourth Quarter SpareBank 1 SMN 7467 Trondheim Chief Executive, CEO Finn Haugan For further information, please contact Kjell Fordal, Executive Director Finance
CITYCON CAPITAL MARKETS DAY 16 MAY 2017, ISO OMENA CFO, EERO SIHVONEN
 STRONG FINANCING FUNDAMENTALS CITYCON CAPITAL MARKETS DAY 16 MAY 2017, ISO OMENA CFO, EERO SIHVONEN MAIN FINANCING TARGETS Loan to Value 40-45% 47.1% Average maturity of loan portfolio > 5 yrs 5.2 Debt
Oslo Børs Holding ASA
 Oslo Børs Holding ASA 2nd Quarter 2007 14 August 2007 Overview Second quarter highlights Continuing high level of market activity Operating revenues: NOK 147.3 million (134.4) Operating profit: NOK 89.1
September 2016 Group Finance Manager, Chris Sørum
 September 2016 Group Finance Manager, Chris Sørum Highlights Q2 2016 Revenue of NOK 8,442 million, up 23.4% EBITDA* of NOK 215 million, up 36.9% Higher sales across all three lines of business Improved
PARETO BANK. Financial Results First Quarter 2015 SIDE 1
 PARETO BANK Financial Results First Quarter 2015 SIDE 1 SIDE 2 1 FINANCIAL STATEMENT 2 LENDING AND CREDIT RISK 3 FUNDING AND LIQUIDITY RISK FIRST QUARTER 2015 Profit after write-downs and tax MNOK 37.4
Sparebanken Sør Boligkreditt AS Q2 2017
 Sparebanken Sør Boligkreditt AS Q2 2017 Sparebanken Sør Business Sparebanken Sør is an independent financial group with activities within banking, securities and real estate Balance The sixth largest
Sparebanken Sør Boligkreditt AS Q3 2017
 Sparebanken Sør Boligkreditt AS Q3 2017 Sparebanken Sør Business Sparebanken Sør is an independent financial group with activities within banking, securities and real estate Balance The sixth largest
Summary published in connection to the admission to trading of shares in Telenor ASA on NASDAQ OMX Stockholm
 Summary published in connection to the admission to trading of shares in Telenor ASA on NASDAQ OMX Stockholm This report is entirely based on information available in Telenor ASA s (also referred to as
This is Aker Industrial Financial Funds Holdings Investments Aker ASA Driving value creation
 This is Aker Ownership Proud ownership Industrial Holdings Financial Investments Funds Aker ASA Driving value creation Trond Brandsrud, CFO of Aker ASA Pareto Oil & Offshore Conference Oslo, 31 August
Q BAKKAFROST GROUP New York 19 May 2016
 2016 BAKKAFROST GROUP New York 19 May 2016 DISCLAIMER This presentation includes statements regarding future results, which are subject to risks and uncertainties. Consequently, actual results may differ
2017 HALF YEAR 25 JULY 2017
 2017 HALF YEAR RESULTS 25 JULY 2017 Strong financial results and robust balance sheet Driving performance through operational excellence and disciplined capital allocation High quality pipeline of growth
Sandnes Sparebank. 4 th Quarter Results 2016 Oslo, 15 February 2016
 Sandnes Sparebank 4 th Quarter Results 2016 Oslo, 15 February 2016 Contents About Sandnes Sparebank Macro Economic Conditions Financial Highlights Loan Portfolio Overview Capital, Liquidity and Funding
Aker ASA Swedbank Nordic Energy Summit 2016
 Proud ownership Aker ASA Swedbank Nordic Energy Summit 2016 Frank O. Reite, Chief Financial Officer Oslo 17 March 2016 Aker: a high-yielding stock based on a solid financial position What we have A Deep
Investor Relations. Supplementary information Third Quarter 2015
 Investor Relations Supplementary information Third Quarter Chief Executive, CEO Finn Haugan For further information, please contact Kjell Fordal, Executive Director Finance kjell.fordal@smn.no +47 905
Investor Relations. Supplementary information Fourth Quarter 2016
 Investor Relations Supplementary information Fourth Quarter CEO Finn Haugan For further information, please contact Kjell Fordal, CFO kjell.fordal@smn.no +47 905 41 672 Address SpareBank 1 SMN, Postboks
Revenue growth of 15% compared to last year Q revenues up to NOK 251m from NOK 218m in Q3 2014
 Interim report Revenue growth of 15% compared to last year revenues up to NOK 251m from NOK 218m in Increased profitability Operating margin of 18% relative to 17% in EPS of NOK 0.08 compared to NOK 0.06
4Q16. Fornebu, February 9, 2017 Luis Araujo and Svein Stoknes Aker Solutions
 4Q16 Fornebu, February 9, 2017 Luis Araujo and Svein Stoknes Agenda Introduction Luis Araujo Chief Executive Officer Q&A Session Luis Araujo Svein Stoknes Financials Svein Stoknes Chief Financial Officer
Financial highlights Profit and loss statement
 Third Quarter 2007 Financial highlights Profit and loss statement Figures in NOK million 3Q 2007 3Q 2006 YTD 2007 YTD 2006 Revenues 861 1068 2542 2911 Collection Technology, Deposit Solutions 426 645 1228
The leading financial group in the southwest of Norway
 FOURTH QUARTER 2015 Disclaimer This presentation contains forward-looking statements that reflect management s current views with respect to certain future events and potential financial performance. Although
Investor Relations. Supplementary information Fourth Quarter 2017
 Investor Relations Supplementary information Fourth Quarter CEO Finn Haugan For further information, please contact Kjell Fordal, CFO kjell.fordal@smn.no +47 905 41 672 Address SpareBank 1 SMN, Postboks
4Q 2018 Fornebu, February 8, 2019 Luis Araujo and Svein Stoknes
 4Q 2018 Fornebu, February 8, 2019 Luis Araujo and Svein Stoknes Agenda 4Q 2018 Answers Questions Introduction Luis Araujo Chief Executive Officer Financials Svein Stoknes Chief Financial Officer Q&A Session
Second quarter 2004 (Unaudited)
") Investor Relations Supplementary Information for Investors and Analysts Second quarter 2004 (Unaudited) Chief Executive Officer Svein Aaser For further information, please contact Tom Grøndahl, Chief Financial
Investor Relations Supplementary Information for Investors and Analysts Second quarter 2004 (Unaudited) Chief Executive Officer Svein Aaser For further information, please contact Tom Grøndahl, Chief Financial
2018 HALF YEAR 26 JULY 2018
 2018 HALF YEAR RESULTS 26 JULY 2018 H1 2018 Another period of delivery Strong financial results and capital structure Disciplined capital allocation improving portfolio scale and quality, reducing risk
Next Generation Real Estate. HY 2008 Figures. Colonia Real Estate AG HY 2008 Figures 15 th of August 2008 Cologne
 Next Generation Real Estate HY 2008 Figures Colonia Real Estate AG HY 2008 Figures 15 th of August 2008 Cologne Focused and Integrated Business Model Colonia Real Estate AG Investments Management Principal
FOURTH QUARTER 2014 RESULTS. Oslo, 5 February 2015, CEO Bjarte Bruheim and CFO Svein Knudsen
 FOURTH QUARTER 2014 RESULTS. Oslo, 5 February 2015, CEO Bjarte Bruheim and CFO Svein Knudsen Disclaimer This quarterly presentation includes and is based, inter alia, on forward-looking information and
9M 2018 RESULTS 09 NOVEMBER 2018 TLG IMMOBILIEN AG 9M 2018 RESULTS
 TLG IMMOBILIEN AG 9M 208 RESULTS DISCLAIMER This presentation includes statements, estimates, opinions and projections with respect to anticipated future performance of TLG IMMOBILIEN ("Forward-Looking
Q Presentation. Oslo November 2 nd 2018 Hallvard Muri, CEO Simon Nyquist Martinsen, CFO
 Q3 218 Presentation Oslo November 2 nd 218 Hallvard Muri, CEO Simon Nyquist Martinsen, CFO Agenda Highlights Financial performance Outlook Q&A Highlights Q3 218 by CEO Hallvard Muri Order Intake development
Third quarter presentation 2012
 Proud ownership Third quarter presentation 2012 Agenda Highlights and Industrial Holdings Øyvind Eriksen President and CEO Financial Investments and Statement Trond Brandsrud CFO Q&A 2 Third quarter 2012
INVESTOR PRESENTATION
 INVESTOR PRESENTATION Table of Contents Introduction to SEGRO 3 Market drivers 10 High quality development pipeline 15 Balance sheet and financing 21 Operating performance 26 Portfolio overview 30 APP
Shareholder information
 SHAREHOLDER INFORMATION Index 89 06: Shareholder information Share price development in 2009 NOK NOK 60 50 40 30 20 10 0 Jan. Feb. Mar. Apr. May Jun. Jul. Aug. Sept. Oct. Nov. Dec. Introduction p.90 Dividend
Interim Report 2 nd quarter 2007 Nordea Bank Norge Group
 Interim Report 2 nd quarter 2007 Nordea Bank Norge Group Nordea Bank Norge is part of the Nordea Group. Nordea s vision is to be perceived as the leading Nordic bank, acknowledged for its people, creating
Ekornes ASA. 1 st QUARTER 2013
 Ekornes ASA 1 st QUARTER 2013 Ekornes Q1 Headlines: Operating revenue: Q1: NOK 688.8 Mill. (up 1.3% ). Operating margin (EBIT) Q1: 13.1% (12.1%). Compared to Q1 last year, no build of stocks finished goods.
NORTH BRIDGE NORDIC PROPERTY AS
 NORTH BRIDGE NORDIC PROPERTY AS STATUS REPORT FOR 2ND QUARTER 2013 www.northbridge.no SUMMARY North Bridge Nordic Property AS (the Company/NBNP) largest investment, Lund Business Park, has been put up
Aker s credit framework. Aker Companies Credit Markets Day Aker ASA Presentation. Low PERFORMANCE PERFORMANCE
 Proud ownership Aker Companies Credit Markets Day Aker ASA Presentation CFO Frank O. Reite & Treasurer Baard Snekkevik 21 November 216 Fornebu Aker s credit framework PERFORMANCE Grow PERFORMANCE upstream
Q BAKKAFROST GROUP Oslo February 24 th 2015
 Q4 2014 BAKKAFROST GROUP Oslo February 24 th 2015 DISCLAIMER This presentation includes statements regarding future results, which are subject to risks and uncertainties. Consequently, actual results may