FedEx Home Delivery Routes (Scottsdale)
|
|
|
- Bertha Gray
- 6 years ago
- Views:
Transcription
 Sales Price: $825,000 Gross Income: $656,000 Net Income: $224,000 (net profit after paying drivers & expenses) Financing: No seller financing available PSA")
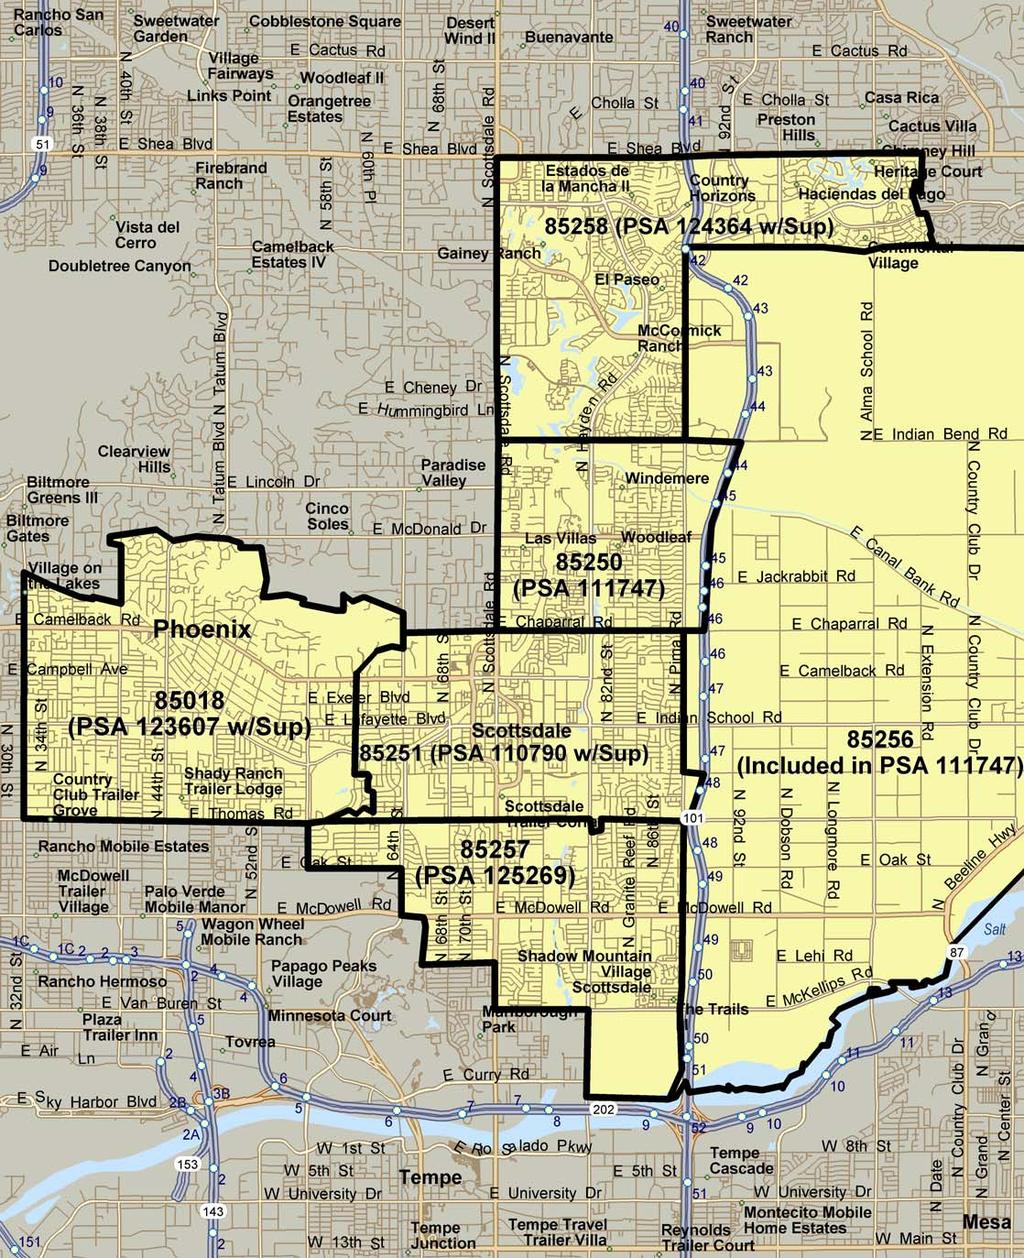
1 TROJAN TRANSPORT INC / GROUND FORCE INC N Scottsdale Rd, Ste 601 * Scottsdale, AZ * 480/ * gene@boiseau.com FedEx Home Delivery Routes (Scottsdale) Sales Price: $825,000 Gross Income: $656,000 Net Income: $224,000 (net profit after paying drivers & expenses) Financing: No seller financing available PSA s w/sup, , , w/sup & w/sup We are selling five Home Delivery Primary Service Areas (PSA s) in the desirable Scottsdale area. You will have the exclusive rights to all Home Delivery operations in zip codes 85018, 85250, 85251, & Please see attached map for specific boundaries. These routes have a high stop density and depart the station full each day. Currently five trucks depart the FedEx station in North Phoenix at N 7 th Ave, Phoenix, 85027, but their domicile location will change in October, 2015 to the Tempe station. The route boundaries will not be affected by the station move. The other three trucks currently dispatch from the FedEx station in Tempe at 1666 N McClintock Rd, Tempe 85281, and will not change. Effective October, 2015, all eight trucks and drivers will dispatch from the Tempe station. This is a simple, straight forward business that is profitable even in today's economy. It is not required that the new owner be a driver and experienced drivers are willing to stay with the routes permanently. If you prefer, drive one of the routes yourself and pay yourself a great salary, or have the drivers operate the routes for you and just manage the business. Current owner/contractor has other routes in the station so he will provide as much training as necessary to ensure a smooth transition. Reason for Sale: Contractor still keeping ten routes in Tempe, but will also expand his operation to another state. Absentee Owners and Investors Welcome! We have had lots of requests for information from potential buyers and investors that want to remain 100% absentee. Until now, we have discouraged this because FedEx likes to have a manager at the station daily. Our manager who currently runs the routes would like to stay on board and manage the routes for you. He can handle all aspects of running the routes with absolutely no involvement from you. If you have plans to someday manage the routes, he can mentor you in this process. We pay our managers $44K/year. Of course, if you decide to run the routes yourself, we will provide all the necessary training and guidance. Other Options Effective September, 2014, it is now required that a new contractor wishing to do business with FedEx must initially purchase three or more PSA s. There are a couple exceptions. First, if the selling contractor owns just one PSA, the purchasing contractor can purchase just the single route without having to buy two more. Second, if the selling contractor only owns two routes, the purchasing contractor can buy just the two without having to buy a third. In our case, we hold ownership of just two PSA s ( & ) under a separate entity. Therefore, we can sell them as a pair. If you would like to start route ownership with less than three routes, this will be one of only a few opportunities available! In turn, we will also sell just the remaining three routes as a set. Sale details below:
2 PSA s , & Zip Codes: 85018, 85250, & Included in sale: Three Routes, Five Trucks, Five Drivers Sales Price: $545,000 Gross Income: $428,000 Net Income: $151,000 (net profit after paying drivers & expenses) Financing: No seller financing available PSA s & Zip Codes: & Included in sale: Two Routes, Three Trucks, Three Drivers Sales Price: $295,000 Gross Income: $220,000 Net Income: $62,000 (net profit after paying drivers & expenses) Financing: No seller financing available
3
4 GROUND FORCE INC N Scottsdale Rd, Ste 601 * Scottsdale, AZ * 480/ * gene@boiseau.com Condition: Very Good FedEx Truck ID #: , , , , , , , Description: Well maintained by private fleet mechanic. Fully shelved. Truck # Make/Model VIN Miles Workhorse P-500 5B5KP42Y K Workhorse P-500 5B5KP42Y *1K GMC P3500, P-500 1GDKP32YXV K Chevrolet Express 1GCHG39U K Chevrolet Express 1GCHG39U K Dodge Sprinter WD0PD K Dodge Sprinter WD2YD K Dodge Sprinter WD2PD K *New engine installed 4/15/15 P-500 Step Van (3) Chevy Cargo Van (2) P 1000 Step Van Sprinter Vans (3) Confidential & Proprietary Information * Ground Force Inc
5 Primary Service Areas w/sup, , , w/ Sup & w/sup Sales Price: $825,000 Zip Codes 85018, 85250, 85251, & Five Home Delivery Routes (PSAs) with three Supplemental Routes, Eight Trucks, Eight Drivers Income Statement April 2014 March 2015 Jan 14 Feb 14 Mar 14 Apr 14 May 14 Jun 14 Jul 14 Aug 14 Sep 14 Oct 14 Nov 14 Dec 14 YTD Revenue 5 Weeks 4 Weeks 4 Weeks 4 Weeks 5 Weeks 4 Weeks 4 Weeks 5 Weeks 4 Weeks 5 Weeks 4 Weeks 4 Weeks Shipping Income PSA $ 12,701 $ 8,971 $ 9,007 $ 7,610 $ 6,582 $ 5,232 $ 4,684 $ 6,256 $ 4,956 $ 9,228 $ 8,863 $ 15,320 $ 99,410 Shipping Income PSA $ 9,101 $ 5,492 $ 5,667 $ 6,859 $ 11,111 $ 7,359 $ 7,143 $ 9,333 $ 7,876 $ 7,483 $ 5,623 $ 10,808 $ 93,855 Shipping Income PSA $ 12,483 $ 6,801 $ 6,486 $ 6,368 $ 7,701 $ 5,773 $ 5,613 $ 7,536 $ 6,148 $ 7,735 $ 6,404 $ 10,916 $ 89,964 Shipping Income PSA $ 10,822 $ 5,690 $ 5,586 $ 8,407 $ 8,368 $ 5,203 $ 5,155 $ 7,033 $ 5,851 $ 7,790 $ 7,042 $ 19,692 $ 96,639 PSA Add Back PSA $ 4,800 $ 4,800 $ 4,800 $ 1,200 $ 6,000 $ 4,800 $ 4,800 $ 6,000 $ 4,800 $ 6,000 $ 3,600 $ $ 51,600 Shipping Income PSA $ 16,594 $ 13,622 $ 11,289 $ 9,346 $ 6,775 $ 5,338 $ 4,739 $ 11,524 $ 10,269 $ 13,080 $ 7,935 $ 5,262 $ 115,773 PSA Add Back PSA $ $ $ $ 1,200 $ 6,000 $ 4,800 $ 4,800 $ 1,200 $ $ $ 4,800 $ 4,800 $ 27,600 Fuel Reimbursement PSA $ 161 $ 114 $ 194 $ 149 $ 114 $ 137 $ 150 $ 139 $ 102 $ 231 $ 245 $ 222 $ 1,958 Fuel Reimbursement PSA $ 178 $ 106 $ 117 $ 344 $ 440 $ 324 $ 316 $ 417 $ 340 $ 298 $ 219 $ 388 $ 3,487 Fuel Reimbursement PSA $ 300 $ 134 $ 144 $ 167 $ 310 $ 237 $ 233 $ 307 $ 269 $ 298 $ 269 $ 389 $ 3,057 Fuel Reimbursement PSA $ 234 $ 98 $ 106 $ 173 $ 291 $ 196 $ 199 $ 256 $ 199 $ 249 $ 263 $ 786 $ 3,050 Fuel Reimbursement PSA $ 392 $ 376 $ 272 $ 207 $ 178 $ 170 $ 143 $ 475 $ 476 $ 555 $ 303 $ 164 $ 3,711 ECCS Bonus for five HD PSA's $ 3,000 $ 3,000 $ 3,000 $ 3,000 $ 3,000 $ 3,000 $ 3,000 $ 3,000 $ 3,000 $ 3,000 $ 3,000 $ 3,000 $ 36,000 SCS Bonus for five PSA's $ $ $ 7,550 $ $ $ 7,550 $ $ $ 7,550 $ $ $ 7,550 $ 30,200 Total Income $ 70,766 $ 49,204 $ 54,218 $ 45,030 $ 56,870 $ 50,119 $ 40,975 $ 53,476 $ 51,836 $ 55,947 $ 48,566 $ 79,297 $ 656,304 Expenses Bank Charges $ 12 $ 12 $ 12 $ 12 $ 12 $ 12 $ 12 $ 12 $ 12 $ 12 $ 12 $ 12 $ 144 Employee Expense $ 20 $ 20 $ 20 $ 20 $ 20 $ 20 $ 20 $ 20 $ 20 $ 20 $ 20 $ 20 $ 240 Fuel Expense $ 2,842 $ 2,273 $ 2,273 $ 2,273 $ 2,842 $ 2,273 $ 2,273 $ 2,842 $ 2,273 $ 2,842 $ 2,273 $ 3,073 $ 30,353 HD NTL & Physical Damage $ 534 $ 427 $ 427 $ 427 $ 534 $ 427 $ 427 $ 534 $ 427 $ 534 $ 427 $ 427 $ 5,553 Legal & Professional Fees $ 35 $ 500 $ 35 $ 35 $ 35 $ 35 $ 35 $ 35 $ 35 $ 35 $ 35 $ 35 $ 885 Office Expenses $ 25 $ 25 $ 25 $ 25 $ 25 $ 25 $ 25 $ 25 $ 25 $ 25 $ 25 $ 25 $ 300 Driver Payroll Expense $ 27,625 $ 22,100 $ 22,100 $ 22,100 $ 27,625 $ 22,100 $ 22,100 $ 27,625 $ 22,100 $ 27,625 $ 22,100 $ 32,100 $ 297,300 Payroll Taxes (9.9% of payroll) $ 2,735 $ 2,188 $ 2,188 $ 2,188 $ 2,735 $ 2,188 $ 2,188 $ 2,735 $ 2,188 $ 2,735 $ 2,188 $ 3,178 $ 29,433 Workers Comp (11.5% of payroll) $ 3,177 $ 2,542 $ 2,542 $ 2,542 $ 3,177 $ 2,542 $ 2,542 $ 3,177 $ 2,542 $ 3,177 $ 2,542 $ 3,692 $ 34,190 Scanner Rental $ 594 $ 476 $ 476 $ 476 $ 594 $ 476 $ 476 $ 594 $ 476 $ 594 $ 476 $ 714 $ 6,420 Uniform Expense $ 30 $ 30 $ 30 $ 30 $ 30 $ 30 $ 30 $ 30 $ 30 $ 30 $ 30 $ 30 $ 360 Vehicle Maintenance $ 2,308 $ 1,846 $ 1,846 $ 1,846 $ 2,308 $ 1,846 $ 1,846 $ 2,308 $ 1,846 $ 2,308 $ 1,846 $ 1,846 $ 24,000 Temporary Truck Rental $ $ $ $ $ $ $ $ $ $ $ $ 3,600 $ 3,600 Total Operating Expenses $ 39,936 $ 32,439 $ 31,974 $ 31,974 $ 39,936 $ 31,974 $ 31,974 $ 39,936 $ 31,974 $ 39,936 $ 31,974 $ 48,752 $ 432,777 Net Income $ 30,830 $ 16,765 $ 22,244 $ 13,056 $ 16,934 $ 18,145 $ 9,001 $ 13,540 $ 19,862 $ 16,011 $ 16,592 $ 30,545 $ 223,527 *1. Shipping Income Actual settlement numbers used for the last rolling twelve months. *2. We just moved a supplemental route from adjacent route not included in this sale and added it to PSA effective WE 4/17/15. We have conservatively estimated incremental revenue at $1100/week. *3. We recently purchased PSA Previous contractor ran route without its supplemental route for 23 weeks. We have permanently added back supplemental route and adjusted revenue by $1100/week. *4. Fuel reimbursement Actual settlement numbers used for the last rolling twelve months. *5. ECCS is based on new settlement agreement for each Home Delivery route $600/month per PSA. *6. SCS based on settlment contract for five $7550 per quarter. *7. Fuel expense based on 8 trucks at 12 miles a gallon times 2480 miles a $2.75/gallon $568.33/week. $200/week added for temporary vehicles for four weeks in December. *8. HD NTL Insurance is $5.83 per vehicle per week. Physical Damage Insurance is 3.91% annual rate of vehcile stated value ($10,000 x 8 trucks = $80,000 x 3.91%). Combined = $106.79/week *9. Legal & Professional fees = $35/month for accounting software and annual tax return for +/ $500 *10. Payroll expense = eight drivers: $625/week, $700/week, $725/week, $750/week (Total = $5525/week). Four seasonal driver's salaries of $625/week added for four weeks in December *11. Full time manager $44K/year. Not included in income statement as not a required expense. *12. Employer contribution of payroll taxes = +/ 9.9% (Soc Sec Tax = 12.4% + Medicare Tax = 2.9%/2 = 7.65% employer contribution % for Fed & State Unemployment Tax) *13. Current workers comp rate is 11.92% with an annual discount that drops it to 11.5% *14. Scanner rental = $14.86 per week per driver. Four extra scanner rentals for four weeks added in December *15. Vehicle maintenance for Home Delivery vehicles +/ $3000/year per vehicle.
6 Primary Service Areas , w/ Sup & w/sup Sales Price: $545,000 Zip Codes 85018, & Three Home Delivery Routes (PSAs) with two Supplemental Routes, Five Trucks, Five Drivers Income Statement April 2014 March 2015 Jan 14 Feb 14 Mar 14 Apr 14 May 14 Jun 14 Jul 14 Aug 14 Sep 14 Oct 14 Nov 14 Dec 14 YTD Revenue 5 Weeks 4 Weeks 4 Weeks 4 Weeks 5 Weeks 4 Weeks 4 Weeks 5 Weeks 4 Weeks 5 Weeks 4 Weeks 4 Weeks Shipping Income PSA $ 12,483 $ 6,801 $ 6,486 $ 6,368 $ 7,701 $ 5,773 $ 5,613 $ 7,536 $ 6,148 $ 7,735 $ 6,404 $ 10,916 $ 89,964 Shipping Income PSA $ 10,822 $ 5,690 $ 5,586 $ 8,407 $ 8,368 $ 5,203 $ 5,155 $ 7,033 $ 5,851 $ 7,790 $ 7,042 $ 19,692 $ 96,639 PSA Add Back PSA $ 4,800 $ 4,800 $ 4,800 $ 1,200 $ 6,000 $ 4,800 $ 4,800 $ 6,000 $ 4,800 $ 6,000 $ 3,600 $ $ 51,600 Shipping Income PSA $ 16,594 $ 13,622 $ 11,289 $ 9,346 $ 6,775 $ 5,338 $ 4,739 $ 11,524 $ 10,269 $ 13,080 $ 7,935 $ 5,262 $ 115,773 PSA Add Back PSA $ $ $ $ 1,200 $ 6,000 $ 4,800 $ 4,800 $ 1,200 $ $ $ 4,800 $ 4,800 $ 27,600 Fuel Reimbursement PSA $ 300 $ 134 $ 144 $ 167 $ 310 $ 237 $ 233 $ 307 $ 269 $ 298 $ 269 $ 389 $ 3,057 Fuel Reimbursement PSA $ 234 $ 98 $ 106 $ 173 $ 291 $ 196 $ 199 $ 256 $ 199 $ 249 $ 263 $ 786 $ 3,050 Fuel Reimbursement PSA $ 392 $ 376 $ 272 $ 207 $ 178 $ 170 $ 143 $ 475 $ 476 $ 555 $ 303 $ 164 $ 3,711 ECCS Bonus for three HD PSA's $ 1,800 $ 1,800 $ 1,800 $ 1,800 $ 1,800 $ 1,800 $ 1,800 $ 1,800 $ 1,800 $ 1,800 $ 1,800 $ 1,800 $ 21,600 SCS Bonus for five PSA's $ $ $ 3,650 $ $ $ 3,650 $ $ $ 3,650 $ $ $ 3,650 $ 14,600 Total Income $ 47,425 $ 33,321 $ 34,133 $ 28,868 $ 37,423 $ 31,967 $ 27,482 $ 36,131 $ 33,462 $ 37,507 $ 32,416 $ 47,459 $ 427,594 Expenses Bank Charges $ 12 $ 12 $ 12 $ 12 $ 12 $ 12 $ 12 $ 12 $ 12 $ 12 $ 12 $ 12 $ 144 Employee Expense $ 20 $ 20 $ 20 $ 20 $ 20 $ 20 $ 20 $ 20 $ 20 $ 20 $ 20 $ 20 $ 240 Fuel Expense $ 2,103 $ 1,682 $ 1,682 $ 1,682 $ 2,103 $ 1,682 $ 1,682 $ 2,103 $ 1,682 $ 2,103 $ 1,682 $ 2,282 $ 22,467 HD NTL & Physical Damage $ 334 $ 267 $ 267 $ 267 $ 334 $ 267 $ 267 $ 334 $ 267 $ 334 $ 267 $ 267 $ 3,471 Legal & Professional Fees $ 35 $ 500 $ 35 $ 35 $ 35 $ 35 $ 35 $ 35 $ 35 $ 35 $ 35 $ 35 $ 885 Office Expenses $ 25 $ 25 $ 25 $ 25 $ 25 $ 25 $ 25 $ 25 $ 25 $ 25 $ 25 $ 25 $ 300 Driver Payroll Expense $ 17,250 $ 13,800 $ 13,800 $ 13,800 $ 17,250 $ 13,800 $ 13,800 $ 17,250 $ 13,800 $ 17,250 $ 13,800 $ 21,300 $ 186,900 Payroll Taxes (9.9% of payroll) $ 1,708 $ 1,366 $ 1,366 $ 1,366 $ 1,708 $ 1,366 $ 1,366 $ 1,708 $ 1,366 $ 1,708 $ 1,366 $ 2,109 $ 18,503 Workers Comp (11.5% of payroll) $ 1,984 $ 1,587 $ 1,587 $ 1,587 $ 1,984 $ 1,587 $ 1,587 $ 1,984 $ 1,587 $ 1,984 $ 1,587 $ 2,450 $ 21,494 Scanner Rental $ 372 $ 297 $ 297 $ 297 $ 372 $ 297 $ 297 $ 372 $ 297 $ 372 $ 297 $ 476 $ 4,042 Uniform Expense $ 30 $ 30 $ 30 $ 30 $ 30 $ 30 $ 30 $ 30 $ 30 $ 30 $ 30 $ 30 $ 360 Vehicle Maintenance $ 1,442 $ 1,154 $ 1,154 $ 1,154 $ 1,442 $ 1,154 $ 1,154 $ 1,442 $ 1,154 $ 1,442 $ 1,154 $ 1,154 $ 15,000 Temporary Truck Rental $ $ $ $ $ $ $ $ $ $ $ $ 2,400 $ 2,400 Total Operating Expenses $ 25,314 $ 20,740 $ 20,275 $ 20,275 $ 25,314 $ 20,275 $ 20,275 $ 25,314 $ 20,275 $ 25,314 $ 20,275 $ 32,559 $ 276,206 Net Income $ 22,111 $ 12,581 $ 13,858 $ 8,593 $ 12,109 $ 11,692 $ 7,207 $ 10,817 $ 13,187 $ 12,193 $ 12,141 $ 14,900 $ 151,388 *1. Shipping Income Actual settlement numbers used for the last rolling twelve months. *2. We just moved a supplemental route from adjacent route not included in this sale and added it to PSA effective WE 4/17/15. We have conservatively estimated incremental revenue at $1100/week. *3. We recently purchased PSA Previous contractor ran route without its supplemental route for 23 weeks. We have permanently added back supplemental route and adjusted revenue by $1100/week. *4. Fuel reimbursement Actual settlement numbers used for the last rolling twelve months. *5. ECCS is based on new settlement agreement for each Home Delivery route $600/month per PSA. *6. SCS based on settlment contract for three $3650 per quarter. *7. Fuel expense based on 5 trucks at 12 miles a gallon times 1835 miles a $2.75/gallon $420.52/week. $150/week added for temporary vehicles for four weeks in December. *8. HD NTL Insurance is $5.83 per vehicle per week. Physical Damage Insurance is 3.91% annual rate of vehcile stated value ($10,000 x 5 trucks = $50,000 x 3.91%). Combined = $66.75/week *9. Legal & Professional fees = $35/month for accounting software and annual tax return for +/ $500 *10. Payroll expense = five drivers: $625/week, $725/week, $750/week ($3450/week). Three seasonal driver's salaries of $625/week added for four weeks in December *11. Full time manager $44K/year. Not included in income statement as not a required expense. *12. Employer contribution of payroll taxes = +/ 9.9% (Soc Sec Tax = 12.4% + Medicare Tax = 2.9%/2 = 7.65% employer contribution % for Fed & State Unemployment Tax) *13. Current workers comp rate is 11.92% with an annual discount that drops it to 11.5% *14. Scanner rental = $14.86 per week per driver. Three extra scanner rentals for four weeks added in December *15. Vehicle maintenance for Home Delivery vehicles +/ $3000/year per vehicle. *16. Two temporary rental vehicles added for four weeks in December to handle seasonal volume.
7 Primary Service Areas w/sup & Sales Price: $295,000 Zip Codes & Two Home Delivery Routes (PSAs) with one Supplemental Route, Three Trucks, Three Drivers Income Statement April 2014 March 2015 Jan 14 Feb 14 Mar 14 Apr 14 May 14 Jun 14 Jul 14 Aug 14 Sep 14 Oct 14 Nov 14 Dec 14 YTD Revenue 5 Weeks 4 Weeks 4 Weeks 4 Weeks 5 Weeks 4 Weeks 4 Weeks 5 Weeks 4 Weeks 5 Weeks 4 Weeks 4 Weeks Shipping Income PSA $ 12,701 $ 8,971 $ 9,007 $ 7,610 $ 6,582 $ 5,232 $ 4,684 $ 6,256 $ 4,956 $ 9,228 $ 8,863 $ 15,320 $ 99,410 Shipping Income PSA $ 9,101 $ 5,492 $ 5,667 $ 6,859 $ 11,111 $ 7,359 $ 7,143 $ 9,333 $ 7,876 $ 7,483 $ 5,623 $ 10,808 $ 93,855 Fuel Reimbursement PSA $ 161 $ 114 $ 194 $ 149 $ 114 $ 137 $ 150 $ 139 $ 102 $ 231 $ 245 $ 222 $ 1,958 Fuel Reimbursement PSA $ 178 $ 106 $ 117 $ 344 $ 440 $ 324 $ 316 $ 417 $ 340 $ 298 $ 219 $ 388 $ 3,487 ECCS Bonus for two HD PSA's $ 1,200 $ 1,200 $ 1,200 $ 1,200 $ 1,200 $ 1,200 $ 1,200 $ 1,200 $ 1,200 $ 1,200 $ 1,200 $ 1,200 $ 14,400 SCS Bonus for two PSA's $ $ $ 1,700 $ $ $ 1,700 $ $ $ 1,700 $ $ $ 1,700 $ 6,800 Total Income $ 23,341 $ 15,883 $ 17,885 $ 16,162 $ 19,447 $ 15,952 $ 13,493 $ 17,345 $ 16,174 $ 18,440 $ 16,150 $ 29,638 $ 219,910 Expenses Bank Charges $ 12 $ 12 $ 12 $ 12 $ 12 $ 12 $ 12 $ 12 $ 12 $ 12 $ 12 $ 12 $ 144 Employee Expense $ 20 $ 20 $ 20 $ 20 $ 20 $ 20 $ 20 $ 20 $ 20 $ 20 $ 20 $ 20 $ 240 Fuel Expense $ 739 $ 591 $ 591 $ 591 $ 739 $ 591 $ 591 $ 739 $ 591 $ 739 $ 591 $ 791 $ 7,886 HD NTL & Physical Damage $ 200 $ 160 $ 160 $ 160 $ 200 $ 160 $ 160 $ 200 $ 160 $ 200 $ 160 $ 160 $ 2,083 Legal & Professional Fees $ 35 $ 500 $ 35 $ 35 $ 35 $ 35 $ 35 $ 35 $ 35 $ 35 $ 35 $ 35 $ 885 Office Expenses $ 25 $ 25 $ 25 $ 25 $ 25 $ 25 $ 25 $ 25 $ 25 $ 25 $ 25 $ 25 $ 300 Driver Payroll Expense $ 10,375 $ 8,300 $ 8,300 $ 8,300 $ 10,375 $ 8,300 $ 8,300 $ 10,375 $ 8,300 $ 10,375 $ 8,300 $ 10,800 $ 110,400 Payroll Taxes (9.9% of payroll) $ 1,027 $ 822 $ 822 $ 822 $ 1,027 $ 822 $ 822 $ 1,027 $ 822 $ 1,027 $ 822 $ 1,069 $ 10,930 Workers Comp (11.5% of payroll) $ 1,193 $ 955 $ 955 $ 955 $ 1,193 $ 955 $ 955 $ 1,193 $ 955 $ 1,193 $ 955 $ 1,242 $ 12,696 Scanner Rental $ 223 $ 178 $ 178 $ 178 $ 223 $ 178 $ 178 $ 223 $ 178 $ 223 $ 178 $ 238 $ 2,378 Uniform Expense $ 20 $ 20 $ 20 $ 20 $ 20 $ 20 $ 20 $ 20 $ 20 $ 20 $ 20 $ 20 $ 240 Vehicle Maintenance $ 865 $ 692 $ 692 $ 692 $ 865 $ 692 $ 692 $ 865 $ 692 $ 865 $ 692 $ 692 $ 9,000 Temporary Truck Rental $ $ $ $ $ $ $ $ $ $ $ $ 1,200 $ 1,200 Total Operating Expenses $ 14,735 $ 12,275 $ 11,810 $ 11,810 $ 14,735 $ 11,810 $ 11,810 $ 14,735 $ 11,810 $ 14,735 $ 11,810 $ 16,304 $ 158,381 Net Income $ 8,606 $ 3,608 $ 6,075 $ 4,352 $ 4,712 $ 4,142 $ 1,683 $ 2,610 $ 4,364 $ 3,705 $ 4,340 $ 13,334 $ 61,529 *1. Shipping Income Actual settlement numbers used for the last rolling twelve months. *2. We just moved a supplemental route from adjacent route not included in this sale and added it to PSA effective WE 4/17/15. We have conservatively estimated incremental revenue at $1100/week. *3. We recently purchased PSA Previous contractor ran route without its supplemental route for 23 weeks. We have permanently added back supplemental route and adjusted revenue by $1100/week. *4. Fuel reimbursement Actual settlement numbers used for the last rolling twelve months. *5. ECCS is based on new settlement agreement for each Home Delivery route $600/month per PSA. *6. SCS based on settlment contract for two $1700 per quarter. *7. Fuel expense based on 3 trucks at 12 miles a gallon times 645 miles a $2.75/gallon $147.81/week. $50/week added for temporary vehicle for four weeks in December. *8. HD NTL Insurance is $5.83 per vehicle per week. Physical Damage Insurance is 3.91% annual rate of vehcile stated value ($10,000 x 3 trucks = $30,000 x 3.91%). Combined = $40.05/week *9. Legal & Professional fees = $35/month for accounting software and annual tax return for +/ $500 *10. Payroll expense = three drivers: $625/week, $700/week, $750/week (Total = $2075/week). One seasonal driver salary of $625/week added for four weeks in December *11. Full time manager $44K/year. Not included in income statement as not a required expense. *12. Employer contribution of payroll taxes = +/ 9.9% (Soc Sec Tax = 12.4% + Medicare Tax = 2.9%/2 = 7.65% employer contribution % for Fed & State Unemployment Tax) *13. Current workers comp rate is 11.92% with an annual discount that drops it to 11.5% *14. Scanner rental = $14.86 per week per driver. One extra scanner rental for four weeks added in December *15. Vehicle maintenance for Home Delivery vehicles +/ $3000/year per vehicle. *16. One temporary rental vehicle added for four weeks in December to handle seasonal volume.
SmallBizU WORKSHEET 1: REQUIRED START-UP FUNDS. Online elearning Classroom. Item Required Amount ($) Fixed Assets. 1 -Buildings $ 2 -Land $
 Fixed Assets. 1 -Buildings $ 2 -Land $") WORKSHEET 1: REQUIRED START-UP FUNDS Item Required Amount () Fixed Assets 1 -Buildings 2 -Land 3 -Initial Inventory 4 -Equipment 5 -Furniture and Fixtures 6 -Vehicles 7 Total Fixed Assets Working Capital
WORKSHEET 1: REQUIRED START-UP FUNDS Item Required Amount () Fixed Assets 1 -Buildings 2 -Land 3 -Initial Inventory 4 -Equipment 5 -Furniture and Fixtures 6 -Vehicles 7 Total Fixed Assets Working Capital
XML Publisher Balance Sheet Vision Operations (USA) Feb-02
 Feb-02") Page:1 Apr-01 May-01 Jun-01 Jul-01 ASSETS Current Assets Cash and Short Term Investments 15,862,304 51,998,607 9,198,226 Accounts Receivable - Net of Allowance 2,560,786
Page:1 Apr-01 May-01 Jun-01 Jul-01 ASSETS Current Assets Cash and Short Term Investments 15,862,304 51,998,607 9,198,226 Accounts Receivable - Net of Allowance 2,560,786
Tax Return Questionnaire Tax Year
 Tax Return Questionnaire - 2018 Tax Year - Page 1 of 18 Print this form out, take some time to fill it out, and bring it with you when you come to the office. This will save you time and money and help
Tax Return Questionnaire Tax Year
 Print this form out, take some time to fill it out, and bring it with you when you come to the office. This will save you time and money, and help us help you more effectively. Tax Return Questionnaire
Business & Financial Services December 2017
 Business & Financial Services December 217 Completed Procurement Transactions by Month 2 4 175 15 125 1 75 5 2 1 Business Days to Complete 25 Jan Feb Mar Apr May Jun Jul Aug Sep Oct Nov Dec 217 Procurement
Tax Year Dear Client:
 Tax Year 2016 Dear Client: This letter is to confirm our understanding of the terms and objectives of our tax services engagement and to clarify the nature and limitations of the tax services to be provided.
METRO. Fiscal Year 2012 Monthly Board Report. December 2011 (First Quarter Fiscal Year-to-Date)
") METRO Fiscal Year 2012 Monthly Board Report Revenue Expense Ridership Performance (First Quarter Fiscal Year-to-Date) 1/27/2012 Table of Contents Section A Section B Section C Section D Section E Section
METRO Fiscal Year 2012 Monthly Board Report Revenue Expense Ridership Performance (First Quarter Fiscal Year-to-Date) 1/27/2012 Table of Contents Section A Section B Section C Section D Section E Section
Review of Registered Charites Compliance Rates with Annual Reporting Requirements 2016
 Review of Registered Charites Compliance Rates with Annual Reporting Requirements 2016 October 2017 The Charities Regulator, in accordance with the provisions of section 14 of the Charities Act 2009, carried
Board of Directors October 2018 and YTD Financial Report
 Board of Directors October 2018 and YTD Financial Report Consolidated Financial Results Operating Margin October ($30,262) $129,301 ($159,563) Year-to-date $292,283 $931,358 ($639,076) Excess of Revenue
Division of Bond Finance Interest Rate Calculations. Revenue Estimating Conference Interest Rates Used for Appropriations, including PECO Bond Rates
 Division of Bond Finance Interest Rate Calculations Revenue Estimating Conference Interest Rates Used for Appropriations, including PECO Bond Rates November 16, 2018 Division of Bond Finance Calculation
Financial Report - FY 2017 Year to Date May 31, 2017
 Financial Report - FY 2017 Year to Date July 19, 2017 1 Major Highlights Revenue Sales tax remittances received through YTD April 2017 are 4.2% higher than YTD April 2016 Plaza Saltillo lease income budgeted
Economic Activity Index ( GDB-EAI ) For the month of May 2013 G O V E R N M E N T D E V E L O P M E N T B A N K F O R P U E R T O R I C O
 For the month of May 2013 G O V E R N M E N T D E V E L O P M E N T B A N K F O R P U E R T O R I C O") Economic Activity Index ( GDB-EAI ) For the month of May 2013 General Commentary May 2013 GDB-EAI for the month of May registered a 3.4% year-over-year ( YOY ) reduction May 2013 EAI was 126.7, a 3.4%
Economic Activity Index ( GDB-EAI ) For the month of May 2013 General Commentary May 2013 GDB-EAI for the month of May registered a 3.4% year-over-year ( YOY ) reduction May 2013 EAI was 126.7, a 3.4%
Economic and Revenue Update
 Economic and Revenue Update A Briefing for the Money Committees Aubrey L. Layne, Jr. Secretary of Finance Commonwealth of Virginia www.finance.virginia.gov January 2018 Topics for Discussion National and
Spheria Australian Smaller Companies Fund
 29-Jun-18 $ 2.7686 $ 2.7603 $ 2.7520 28-Jun-18 $ 2.7764 $ 2.7681 $ 2.7598 27-Jun-18 $ 2.7804 $ 2.7721 $ 2.7638 26-Jun-18 $ 2.7857 $ 2.7774 $ 2.7690 25-Jun-18 $ 2.7931 $ 2.7848 $ 2.7764 22-Jun-18 $ 2.7771
Executive Summary. July 17, 2015
 Executive Summary July 17, 2015 The Revenue Estimating Conference adopted interest rates for use in the state budgeting process. The adopted interest rates take into consideration current benchmark rates
METRO. Fiscal Year 2013 Monthly Board Report. November 2012
 METRO Fiscal Year 2013 Monthly Board Report Revenue Expense Ridership Performance 12/13/2012 Table of Contents Section A Section B Section C Section D Section E Section F Section G Section H Section I
Key IRS Interest Rates After PPA
 Key IRS Interest After PPA (updated upon release of figures in IRS Notice usually by the end of the first full business week of the month) Below are Tables I, II, and III showing official interest rates
METRO. Fiscal Year 2012 Monthly Board Report. September 2012 (Fourth Quarter Fiscal Year-to-Date)
") METRO Fiscal Year 2012 Monthly Board Report Revenue Expense Ridership Performance (Fourth Quarter Fiscal Year-to-Date) This report is based on a preliminary closing of the year-end financials for FY2012
METRO Fiscal Year 2012 Monthly Board Report Revenue Expense Ridership Performance (Fourth Quarter Fiscal Year-to-Date) This report is based on a preliminary closing of the year-end financials for FY2012
Key IRS Interest Rates After PPA
 Key IRS Rates - After PPA - thru 2011 Page 1 of 10 Key IRS Interest Rates After PPA (updated upon release of figures in IRS Notice usually by the end of the first full business week of the month) Below
Performance Report October 2018
 Structured Investments Indicative Report October 2018 This report illustrates the indicative performance of all Structured Investment Strategies from inception to 31 October 2018 Matured Investment Strategies
CLIENT INFORMATION SHEET ROSSMAN TAX SERVICE TAX YEAR 2018
 CLIENT INFORMATION SHEET ROSSMAN TAX SERVICE TAX YEAR 2018 PLEASE COMPLETE ALL PAGES OF THIS FORM RETURNS WILL T BE PREPARED WITHOUT A COMPLETED INFO SHEET PERSONAL INFORMATION- YOUR LAST NAME MUST BE
(Internet version) Financial & Statistical Report November 2018
 Financial & Statistical Report November 2018") (Internet version) Financial & Statistical Report November 2018 12/17/2018 Statement of Operations For the Period Ended November 30, 2018 (in millions) Current Month Year-to-Date Operating Revenue $ 31.4
(Internet version) Financial & Statistical Report November 2018 12/17/2018 Statement of Operations For the Period Ended November 30, 2018 (in millions) Current Month Year-to-Date Operating Revenue $ 31.4
QUARTERLY FINANCIAL REPORT June 30, 2017
 California Independent System Operator QUARTERLY FINANCIAL REPORT June 30, 2017 250 Outcropping Way Folsom, CA 95630 (916) 351-4000 CALIFORNIA INDEPENDENT SYSTEM OPERATOR CORPORATION QUARTERLY FINANCIAL
(Internet version) Financial & Statistical Report September 2017
 Financial & Statistical Report September 2017") (Internet version) Financial & Statistical Report September 2017 10/23/2017 Statement of Operations For the Period Ended September 30, 2017 (in millions) Current Month Year-to-Date Operating Revenue &
(Internet version) Financial & Statistical Report September 2017 10/23/2017 Statement of Operations For the Period Ended September 30, 2017 (in millions) Current Month Year-to-Date Operating Revenue &
(Internet version) Financial & Statistical Report December 2017
 Financial & Statistical Report December 2017") (Internet version) Financial & Statistical Report December 2017 01/22/2018 Statement of Operations For the Period Ended December 31, 2017 (in millions) Current Month Year-to-Date Operating Revenue & Patronage
(Internet version) Financial & Statistical Report December 2017 01/22/2018 Statement of Operations For the Period Ended December 31, 2017 (in millions) Current Month Year-to-Date Operating Revenue & Patronage
(Internet version) Financial & Statistical Report December 2016
 Financial & Statistical Report December 2016") (Internet version) Financial & Statistical Report December 2016 1/23/2017 Statement of Operations For the Period Ended December 31, 2016 (in millions) Current Month Year-to-Date Operating Revenue & Patronage
(Internet version) Financial & Statistical Report December 2016 1/23/2017 Statement of Operations For the Period Ended December 31, 2016 (in millions) Current Month Year-to-Date Operating Revenue & Patronage
METRO. Fiscal Year 2013 Monthly Board Report. December 2012 (First Quarter Fiscal Year-to-Date)
") METRO Fiscal Year 2013 Monthly Board Report Revenue Expense Ridership Performance (First Quarter Fiscal Year-to-Date) 1/14/2013 Table of Contents Section A Section B Section C Section D Section E Section
METRO Fiscal Year 2013 Monthly Board Report Revenue Expense Ridership Performance (First Quarter Fiscal Year-to-Date) 1/14/2013 Table of Contents Section A Section B Section C Section D Section E Section
Credit Suisse 5 th Annual Industrials Conference November 29, 2017
 Credit Suisse 5 th Annual Industrials Conference November 29, 2017 Cindy C. Earhart Executive Vice President and Chief Financial Officer 1 / Norfolk Southern Corporation Forward-Looking Statements Certain
NEAZ Members: Cherokee County
 1 NEAZ Members: Cherokee County 2 NEAZ Members: DeKalb County 3 NEAZ Members: Etowah County 4 NEAZ Members: Marshall County 5 NEAZ Members: Cherokee County April 27, 2011 6 NEAZ Members: DeKalb County
U.S. Consumer Sentiment Jan 2011 Jan 2012
 2012 Economic Update Information provided by Jacksonville State University Center for Economic Development and College of Commerce and Business Administration U.S. Consumer Sentiment Jan 2011 Jan 2012
Factor Leave Accruals. Accruing Vacation and Sick Leave
 Factor Leave Accruals Accruing Vacation and Sick Leave Factor Leave Accruals As part of the transition of non-exempt employees to biweekly pay, the UC Office of the President also requires standardization
METRO MONTHLY BOARD REPORT
 METRO Revenue Expenses Service Performance Fiscal Year FY2011 Table of Contents Section A Section B Section C Section D Section E Section F Section G Section H Summary Sales Tax Revenue Fare Revenue Operating
Business Cycle Index July 2010
 Business Cycle Index July 2010 Bureau of Trade and Economic Indices, Ministry of Commerce, Tel. 0 2507 5805, Fax. 0 2507 5806, www.price.moc.go.th Thailand economic still expansion. Medium-run Leading
HIPIOWA - IOWA COMPREHENSIVE HEALTH ASSOCIATION Unaudited Balance Sheet As of July 31
 Unaudited Balance Sheet As of July 31 Total Enrollment: 407 Assets: Cash $ 9,541,661 $ 1,237,950 Invested Cash 781,689 8,630,624 Premiums Receivable 16,445 299,134 Prepaid 32,930 34,403 Assessments Receivable
Welcome to MTSUIP! If you have any questions during my presentation, please ask.
 UI 101 Welcome! Welcome to MTSUIP! If you have any questions during my presentation, please ask. So, you re New Don t worry, we are here to help! Highlights Coverage Options - MTSUIP vs. State Benefits
HIPIOWA - IOWA COMPREHENSIVE HEALTH ASSOCIATION Unaudited Balance Sheet As of January 31
 Unaudited Balance Sheet As of January 31 Total Enrollment: 371 Assets: Cash $ 1,408,868 $ 1,375,117 Invested Cash 4,664,286 4,136,167 Premiums Receivable 94,152 91,261 Prepaid 32,270 33,421 Assessments
Profit Is Important But Cash Flow Is Critical!
 Profit Is Important But Cash Flow Is Critical! Did you know cash flow puts more contractors out of business than any other single thing.except improper labor pricing! It s true. You can be priced absolutely
Operating Budget. Third Quarter Financial Report (July 2005 March 2006)
") Third Quarter Financial Report (July 2005 March 2006) INDEX A. Executive Summary...page 2 B. Revenue and Expense Analysis...page 3 C. Budget Variance Reports...page 14 D. Ridership and Performance Measures...page
Third Quarter Financial Report (July 2005 March 2006) INDEX A. Executive Summary...page 2 B. Revenue and Expense Analysis...page 3 C. Budget Variance Reports...page 14 D. Ridership and Performance Measures...page
QUARTERLY FINANCIAL REPORT December 31, 2017
 California Independent System Operator QUARTERLY FINANCIAL REPORT December 31, 2017 Preliminary and Unaudited 250 Outcropping Way Folsom, CA 95630 (916) 351-4000 CALIFORNIA INDEPENDENT SYSTEM OPERATOR
METRO. Monthly Board Report. June 2006
 METRO Monthly Board Report Operating Capital Service Performance June 26 7/17/26 June 26 MONTHLY BOARD REPORT INDEX Section A Section B Section C Section D Section E Section F Section G Operating Budget
QUARTERLY FINANCIAL REPORT March 31, 2018
 California Independent System Operator QUARTERLY FINANCIAL REPORT March 31, 2018 250 Outcropping Way Folsom, CA 95630 (916) 351-4000 CALIFORNIA INDEPENDENT SYSTEM OPERATOR CORPORATION QUARTERLY FINANCIAL
Financial & Business Highlights For the Year Ended June 30, 2017
 Financial & Business Highlights For the Year Ended June, 17 17 16 15 14 13 12 Profit and Loss Account Operating Revenue 858 590 648 415 172 174 Investment gains net 5 162 909 825 322 516 Other 262 146
General Fund Revenue
 Millions Percent of Kathy Steinert, Director of Fiscal Services Phone: 541.923.8927 145 SE Salmon Ave Redmond, OR 97756 kathy.steinert@redmond.k12.or.us Date: May 23, 2014 To: Redmond School District Board
Status of the Unemployment Trust Fund and Related Issues. Commission on Unemployment Compensation. Ellen Marie Hess, Commissioner.
 Status of the Unemployment Trust Fund and Related Issues Commission on Unemployment Compensation August 8, 2018 Ellen Marie Hess, Commissioner 2 Trust Fund Data Standard Forecast (Millions of Dollars)
Income inequality and mobility in Australia over the last decade
 Income inequality and mobility in Australia over the last decade Roger Wilkins Meeting of National Economic Research Organisations, OECD Headquarters, 18 June 2012 1993-94 1994-95 1995-96 1996-97 1997-98
Sedona Fire District. Monthly Financial Report. Monthly Financial Report September Attached are the following for your information and review:
 Sedona Fire District Monthly Financial Report Monthly Financial Report September 2018 Attached are the following for your information and review: 1. Sheet as of September 30, 2018. 2. Summary of Reconciled
Big Walnut Local School District
 Big Walnut Local School District Monthly Financial Report for the month ended September 30, 2013 Prepared By: Felicia Drummey Treasurer BIG WALNUT LOCAL SCHOOL DISTRICT SUMMARY OF YEAR TO DATE FINANCIAL
THE B E A CH TO WN S O F P ALM B EA CH
 THE B E A CH TO WN S O F P ALM B EA CH C OU N T Y F LO R I D A August www.luxuryhomemarketing.com PALM BEACH TOWNS SINGLE-FAMILY HOMES LUXURY INVENTORY VS. SALES JULY Sales Luxury Benchmark Price : 7,
METRO. Fiscal Year 2013 Monthly Board Report. January 2013
 METRO Fiscal Year 2013 Monthly Board Report Revenue Expense Ridership Performance 2/14/2013 Table of Contents Section A Section B Section C Section D Section E Section F Section G Section H Section I Section
1.2 The purpose of the Finance Committee is to assist the Board in fulfilling its oversight responsibilities related to:
 Category: BOARD PROCESS Title: Terms of Reference for the Finance Committee Reference Number: AB-331 Last Approved: February 22, 2018 Last Reviewed: February 22, 2018 1. PURPOSE 1.1 Primary responsibility
Monthly Labour Force Survey Statistics December 2018
 800 Monthly Labour Force Survey Statistics CALGARY CMA Table 282-0135 Labour force survey estimates (LFS), by census metropolitan area based on 2011 census boundaries, 3-month moving average, seasonally
Monthly Labour Force Survey Statistics November 2018
 800 Monthly Labour Force Survey Statistics CALGARY CMA Table 282-0135 Labour force survey estimates (LFS), by census metropolitan area based on 2011 census boundaries, 3-month moving average, seasonally
Consumer confidence and economic climate indicators continue to increase
 %/3mma Business and Consumer Surveys July 2017 28 July 2017 Consumer confidence and economic climate indicators continue to increase The Consumer confidence indicator increased in July, resuming the positive
2018 Financial Management Classes
 2018 Financial Management Classes MONEY MANAGEMENT CLASS/BANKING OPERATONS (1ST & 3RD FRIDAY) INVESTING BASICS (2ND FRIDAY) CREDIT MANAGEMENT BLENDED RETIREMENT SYSTEM/THRIFT SAVINGS PLAN (4TH FRIDAY)
Consumer confidence and economic climate indicators increase
 %/3mma Business and Consumer Surveys March 2017 March, 30 th 2017 Consumer confidence and economic climate indicators increase The Consumer confidence indicator increased between September and March, resuming
Key West Cruise Ship Data - Passenger Counts Number of Passenger Arrivals
 Key West Cruise Ship Data - Passenger Counts Number of Passenger Arrivals (Source: City of Key West Port Operations Office) Month 2000 2001 2002 2003 2004 2005 2006 2007 2008 2009 2010 2011 2012 2013 2014
New Jersey Employer Certification
 New Jersey Employer Certification Oxford Health Insurance, Inc. or Oxford Health Plans (NJ), Inc. ( Oxford ) Mailing Address: Oxford Group Enrollment, P.O. Box 29142, Hot Springs, AR 71903-9142 800-385-9088
WESTWOOD LUTHERAN CHURCH Summary Financial Statement YEAR TO DATE - February 28, Over(Under) Budget WECC Fund Actual Budget
 Budget WECC Fund Actual Budget") WESTWOOD LUTHERAN CHURCH Summary Financial Statement YEAR TO DATE - February 28, 2018 General Fund Actual A B C D E F WECC Fund Actual Revenue Revenue - Faith Giving 1 $ 213 $ 234 $ (22) - Tuition $ 226
WESTWOOD LUTHERAN CHURCH Summary Financial Statement YEAR TO DATE - February 28, 2018 General Fund Actual A B C D E F WECC Fund Actual Revenue Revenue - Faith Giving 1 $ 213 $ 234 $ (22) - Tuition $ 226
Test Yourself / Final Exam
 Test Yourself / Final Exam 1. Explain the risk/reward parameters of an option seller? 2. Describe the risk/reward characteristics of an option buyer? 3. What is an option? 4. What is the definition of
Revenue SFY 2016 Budget * Beginning
 Revenue SFY 2016 Budget * Beginning SFY 2016 Total SFY 2017 Total 201517 Total Revenue Source Balance Jul15 Aug15 Sep15 Oct15 Nov15 Dec15 Jan16 Feb16 Mar16 Apr16 May16 Jun16 State 17T 2,359,833 2,359,833
11 May Report.xls Office of Budget & Fiscal Planning
 Education and General Fund Actual Revenues and s by Month MTD YTD Change Revenue Jul Aug Sep Oct Nov Dec Jan Feb Mar Apr May Jun Per 14 Total over FY06 Enrollment Fees $ 8,211 $ 219 $ 41,952 ($ 818) $
TERMS OF REFERENCE FOR THE INVESTMENT COMMITTEE
 I. PURPOSE The purpose of the Investment Committee (the Committee ) is to recommend to the Board the investment policy, including the asset mix policy and the appropriate benchmark for both ICBC and any
Using projections to manage your programs
 Using projections to manage your programs To project total provider reimbursements To do what ifs based on caseloads or other metrics To project amounts of admin & support available for spending Based
Mortgage Trends Update
 Mortgage Trends Update UK Finance: Mortgage Trends Update December 218 of first-time reaches 12-year high in 218 Key data highlights: There were 37, new first-time buyer mortgages completed in 218, some
ACCOUNT NUMBER EMPLOYER S MUNICIPAL INCOME TAX WITHHOLDING FORMS Forms EQR (Monthly and Quarterly Statement) Form PW3 (Annual Reconciliation)
 Form PW3 (Annual Reconciliation)") City of Pickerington Income Tax Department 100 Lockville Road Pickerington, Ohio 43147-1321 Telephone (614) 837-4116 Fax (614) 833-2201 Website: www.pickerington.net 2007 EMPLOYER S MUNICIPAL INCOME TAX
City of Pickerington Income Tax Department 100 Lockville Road Pickerington, Ohio 43147-1321 Telephone (614) 837-4116 Fax (614) 833-2201 Website: www.pickerington.net 2007 EMPLOYER S MUNICIPAL INCOME TAX
February Economic Activity Index ( GDB-EAI )
") February 2014 Economic Activity Index ( GDB-EAI ) General Commentary February 2014 In February 2014, the GDB-EAI registered a 2.4% year-over-year (y-o-y) reduction (the lowest since May 2013), after showing
February 2014 Economic Activity Index ( GDB-EAI ) General Commentary February 2014 In February 2014, the GDB-EAI registered a 2.4% year-over-year (y-o-y) reduction (the lowest since May 2013), after showing
Data current as of: April 4, % 10.0% 8.0% 6.0% 4.0% 2.0% 250, , , ,000 50, , , , , ,000
 Forecast current as of: January 213 Economic Indicators U.S. unemployment decreased to 7.7% in February from 7.9% last month, as nonfarm payroll employment increased by 236,. In the previous 3 months,
Mitchell Electric Charitable Fund PO Box 409 Camilla, GA (229) or FAX:
 or FAX:") Mitchell Electric Charitable Fund PO Box 409 Camilla, GA 31730 (229) 336-5221 or 1-800-479-6034 FAX: 229-336-7088 For Office use only: Agency / Organization Application All attached sheets, including financial
Mitchell Electric Charitable Fund PO Box 409 Camilla, GA 31730 (229) 336-5221 or 1-800-479-6034 FAX: 229-336-7088 For Office use only: Agency / Organization Application All attached sheets, including financial
IMPORTANT TAX INFORMATION
 CITY OF ASHTABULA INCOME TAX DEPARTMENT (440) 992-7104 Fax (440) 992-7556 Hours Monday Friday 8:30 AM 4:00 PM www.cityofashtabula.com IMPORTANT TAX INFORMATION EMPLOYER MUNICIPAL INCOME TAX WITHHOLDING
FOR RELEASE: MONDAY, MARCH 21 AT 4 PM
 Interviews with 1,012 adult Americans conducted by telephone by Opinion Research Corporation on March 18-20, 2011. The margin of sampling error for results based on the total sample is plus or minus 3
Isle Of Wight half year business confidence report
 half year business confidence report half year report contents new company registrations closed companies (dissolved) net company growth uk company share director age director gender naming trends sic
Nonfarm Payroll Employment
 PRESIDENT'S REPORT TO THE BOARD OF DIRECTORS, FEDERAL RESERVE BANK OF BOSTON Current Economic Developments - June 10, 2004 Data released since your last Directors' meeting show the economy continues to
Sedona Fire District. Monthly Financial Report. Monthly Financial Report October Attached are the following for your information and review:
 Sedona Fire District Monthly Financial Report Monthly Financial Report October 2018 Attached are the following for your information and review: 1. Sheet as of October 31, 2018. 2. Summary of Reconciled
HOLLY DRIVE LEADERSHIP ACADEMY CASHFLOW PROJECTIONS FISCAL YEAR
 FISCAL YEAR 201920 2020 2020 PRIOR YEAR P2 P1 P2 201920 201920 Jul19 Aug19 Sep19 Oct19 Nov19 Dec19 Jan20 Feb20 Mar20 Apr20 May20 Jun20 Accrual Actuals INCOME 80118096 Local Control Funding Formula Sources
FDD FIRM STORAGE SERVICE NORTHERN NATURAL GAS COMPANY
 FDD FIRM STORAGE SERVICE NORTHERN NATURAL GAS COMPANY FIRM STORAGE SERVICE OPTIONS Northern s firm storage service is provided pursuant to the FDD Rate Schedule located in Northern s FERC Gas Tariff. The
Cost Estimation of a Manufacturing Company
 Cost Estimation of a Manufacturing Company Name: Business: Date: Economics of One Unit: Manufacturing Company (Only complete if you are making a product, such as a bracelet or beauty product) Economics
Consumer Price Index (Base year 2014) Consumer Price Index
 Consumer Price Index") Consumer Price Index December 2017 (Base year 2014) Consumer Price Index 1 Release Date: January 2018 Detailed by: Expenditure groups Household welfare levels Household type Regions Briefing This publication
Consumer Price Index December 2017 (Base year 2014) Consumer Price Index 1 Release Date: January 2018 Detailed by: Expenditure groups Household welfare levels Household type Regions Briefing This publication
Cash & Liquidity The chart below highlights CTA s cash position at March 2017 compared to March 2016.
 To: Chicago Transit Authority Board From: Jeremy Fine, Chief Financial Officer Re: Financial Results for March 2017 Date: May 10, 2017 I. Summary CTA s financial results are $0.6 million favorable to budget
Department of Agricultural and Resource Economics
 D 34 Department of Agricultural and Resource Economics BASIS ESTIMATES FOR FEEDER CATTLE AND FED CATTLE February 2018 Andrew P. Griffith, Assistant Professor Becky Bowling, UT Extension Specialist Table
Consumer Price Index (Base year 2014) Consumer Price Index
 Consumer Price Index") Consumer Price Index December 2016 (Base year 2014) Consumer Price Index 1 Release Date: January 2017 Detailed by: Expenditure groups Household welfare levels Household type Regions Briefing This publication
Consumer Price Index December 2016 (Base year 2014) Consumer Price Index 1 Release Date: January 2017 Detailed by: Expenditure groups Household welfare levels Household type Regions Briefing This publication
Cash & Liquidity The chart below highlights CTA s cash position at December 2017 compared to December 2016.
 To: Chicago Transit Authority Board From: Jeremy Fine, Chief Financial Officer Re: Financial Results for December 2017 Date: February 14, 2018 I. Summary CTA s financial results are $4.7 million favorable
Regional overview Gisborne
 Regional overview Purchasing intentions - additional income-related rent subsidy (IRRS) places Area District 1 2 3 4+ TOTAL 3 35 5 7 total 3 35 5 7 7 8 9 1 11 Purchasing intentions - change within the
PERSONAL TAX INFORMATION WORKSHEET
 PERSONAL TAX INFORMATION WORKSHEET Please check the appropriate box: Date Received: I need my taxes done early for my child s financial aid. Most of the information needed to complete this form can be
Cromwell Fire District Financial Statements March 31, 2019
 Financial Statements March 31, 2019 Table of Contents Executive Overview 1-4 General Fund Budget Report - Summary Budget Report - Detail EMS Billing Report Projected Fund Balance Water Division Enterprise
February 8, 2012 Robert Johnson Director of Economic Analysis
 Positive Surprises in Store for 2012? Macro Overview February 8, 2012 Robert Johnson Director of Economic Analysis 1 U.S. Economic Data 2011: Soft, but no recession, Growth Accelerated Through the Year
2016 Spring Conference And Training Seminar. Cash Planning and Forecasting
 Cash Planning and Forecasting A different world! Cash forecasting starts with expectations about future flows Uses history to identify beginning balances.and to understand patterns of how things interact
Cash & Liquidity The chart below highlights CTA s cash position at September 2017 compared to September 2016.
 To: Chicago Transit Authority Board From: Jeremy Fine, Chief Financial Officer Re: Financial Results for September 2017 Date: November 15, 2017 I. Summary CTA s financial results are $7.7 million favorable
Exam 1 Problem Solving Questions Review
 Exam 1 Problem Solving Questions Review SECTION 1 The following data were obtained from a recent quarterly report for Dell Computer (in millions): Net revenue $8,028 Cost of revenue $6,580 Inventories:
Foundations of Investing
 www.edwardjones.com Member SIPC Foundations of Investing 1 5 HOW CAN I STAY ON TRACK? 4 HOW DO I GET THERE? 1 WHERE AM I TODAY? MY FINANCIAL NEEDS 3 CAN I GET THERE? 2 WHERE WOULD I LIKE TO BE? 2 Develop
Algo Trading System RTM
 Year Return 2016 15,17% 2015 29,57% 2014 18,57% 2013 15,64% 2012 13,97% 2011 55,41% 2010 50,98% 2009 48,29% Algo Trading System RTM 89000 79000 69000 59000 49000 39000 29000 19000 9000 2-Jan-09 2-Jan-10
February 2016 Financial Report
 2016 February 2016 Financial Report Capital Metropolitan Transportation Authority 4/13/2016 Table of Contents SUMMARY REPORT Budgetary Performance - Revenue 2 - Sales Tax Revenue 5 - Operating Expenses
Power Accountants Association Annual Meeting Potential Impacts from Oct 2015 Rate Change
 Power Accountants Association Annual Meeting Potential Impacts from Oct 2015 Rate Change Material Provided by: Chris Mitchell Chris Mitchell Management Consultants (CMMC) mail@chrismitchellmc.com 5/14/2015
Cash & Liquidity The chart below highlights CTA s cash position at August 2018 compared to August 2017.
 To: Chicago Transit Authority Board From: Jeremy Fine, Chief Financial Officer Re: Financial Results for August 2018 Date: October 10, 2018 I. Summary CTA s financial results are favorable to budget for
Futures and Options Live Cattle Feeder Cattle. Tim Petry Livestock Marketing Economist NDSU Extension
 Futures and Options Live Cattle Feeder Cattle Tim Petry Livestock Marketing Economist NDSU Extension www.ndsu.edu/livestockeconomcs FutOpt-Jan2019 Price Risk Management Tools Cash forward contract Video
METRO. Fiscal Year Monthly Performance Report. Revenue Expense Ridership Performance. November 2018 (Third Quarter Fiscal Year-to Date)
") METRO Fiscal Year 2019 Monthly Performance Report Revenue Expense Ridership Performance (Third Quarter Fiscal Year-to Date) 12/12/2018 Table of Contents Section A Section B Section C Section D Section
METRO Fiscal Year 2019 Monthly Performance Report Revenue Expense Ridership Performance (Third Quarter Fiscal Year-to Date) 12/12/2018 Table of Contents Section A Section B Section C Section D Section
SBWMA DRAFT REPORT REVIEWING THE 2019 SOUTH BAY RECYCLING COMPENSATION APPLICATION
 SBWMA DRAFT REPORT REVIEWING THE 2019 SOUTH BAY RECYCLING COMPENSATION APPLICATION August 15, 2018 AGENDA ITEM: 5B EXHIBIT A - p1 TABLE OF CONTENTS SUMMARY SECTION 1. Overview of SBR Compensation Adjustment
PHOENIX ENERGY MARKETING CONSULTANTS INC. HISTORICAL NATURAL GAS & CRUDE OIL PRICES UPDATED TO July, 2018
 Jan-01 $12.9112 $10.4754 $9.7870 $1.5032 $29.2595 $275.39 $43.78 $159.32 $25.33 Feb-01 $10.4670 $7.8378 $6.9397 $1.5218 $29.6447 $279.78 $44.48 $165.68 $26.34 Mar-01 $7.6303 $7.3271 $5.0903 $1.5585 $27.2714
Regional overview Hawke's Bay
 Regional overview Purchasing intentions - additional income-related rent subsidy (IRRS) places Area Hastings Central 1 2 3 4+ TOTAL 5 5 25 125 3 3 1 7 total 8 8 35 195 7 8 9 1 11 Purchasing intentions
June Economic Activity Index ( GDB-EAI )
") June 2014 Economic Activity Index ( GDB-EAI ) General Commentary June 2014 In June 2014, the GDB-EAI registered a 1.0% year-over-year (y-o-y) reduction, after showing a 1.1% y-o-y decrease in June 2014.
June 2014 Economic Activity Index ( GDB-EAI ) General Commentary June 2014 In June 2014, the GDB-EAI registered a 1.0% year-over-year (y-o-y) reduction, after showing a 1.1% y-o-y decrease in June 2014.
C I T Y O F B O I S E
 C I T Y O F B O I S E D E P A R T M E N T O F F I N A N C E A N D A D M I N I S T R A T I O N Office of Budget Development & Monitoring Economic Brief Shannon Cade, Financial Analyst & Brent Davis, Budget