City Council Work Session Handouts. May 22, 2017
|
|
|
- Bathsheba Green
- 5 years ago
- Views:
Transcription
1 City Council Work Session Handouts May 22, 2017 I. Review and Discuss Zoning File II. III. Review and Discuss the City of Richardson Summer 2017 City Council Meeting Calendar and Budget Calendar Review and Discuss the Second Quarter Financial Report

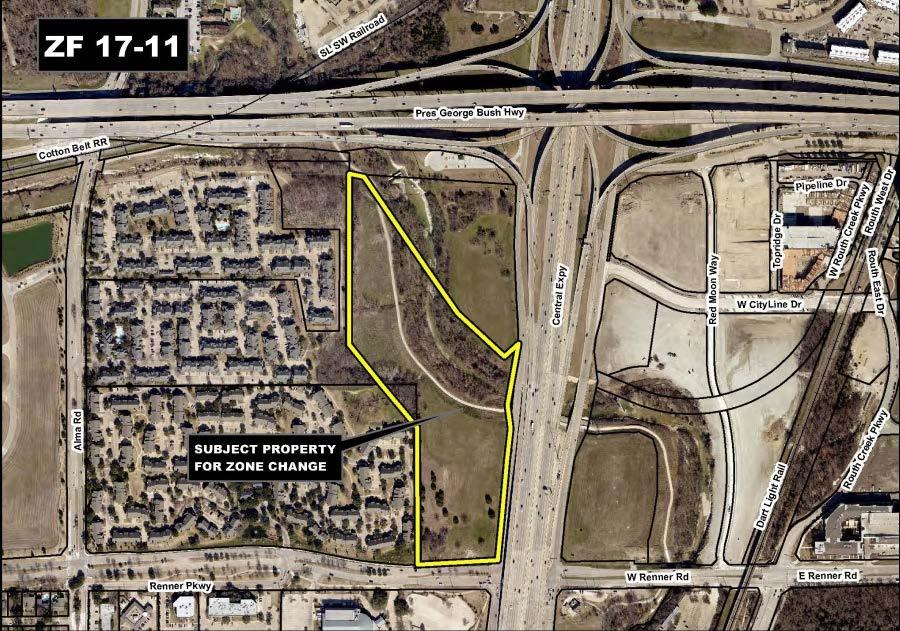
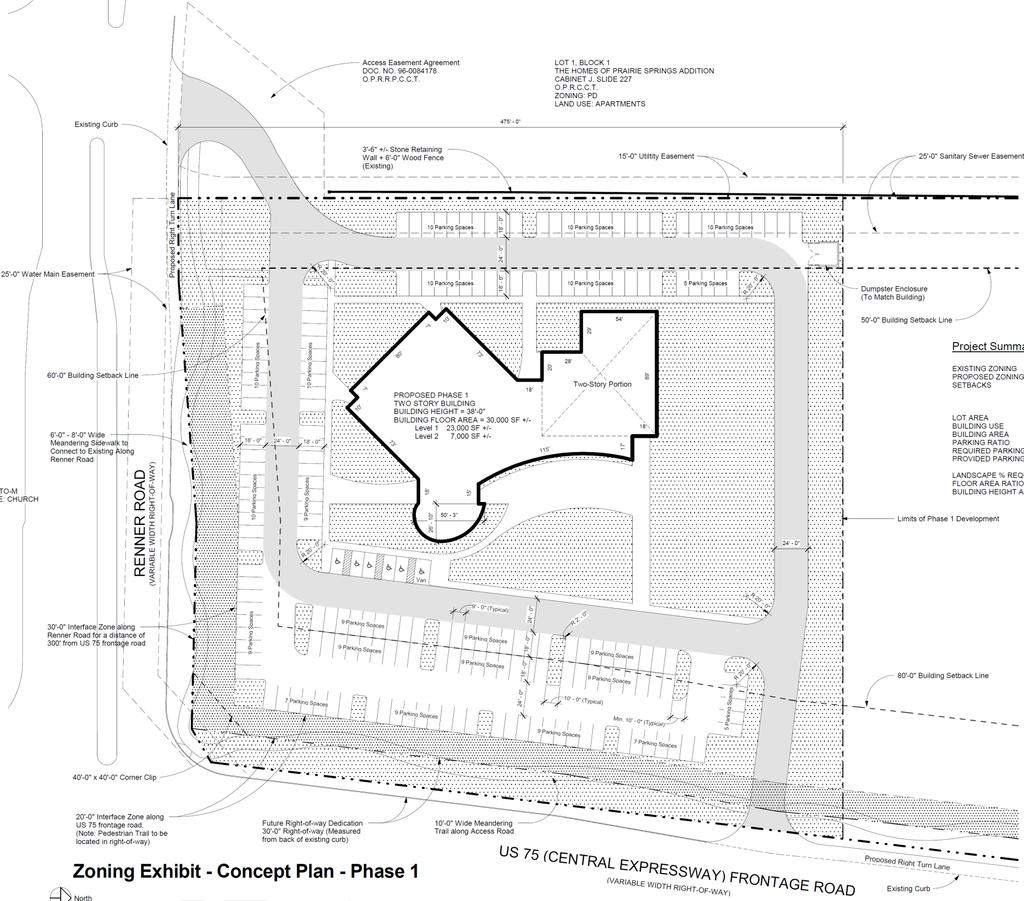
2 Agenda Item 6 Zoning File (Planned Development)
3

4
5 Subject Property

6 Cotton Belt
7
8
9

10 Summer 2017 City Council Meeting Calendar and Budget Calendar May 22,
11 Introduction The Mayor and City Manager routinely evaluate City Council s Meeting Schedule to ensure: All posting/calendaring legal requirements are in order Timeliness of planned briefings Attendance is not problematic for individual members of Council As we enter into the summer season, we wanted to review and recommend a few minor changes to the schedule that was adopted in December 2016 as well as review the proposed Budget Calendar It is important to note that a meeting may be called at anytime if needed in accordance with Charter and Open Meetings Act 2
12 2017 Current Meeting Schedule All City Council Meetings are subject to revision by City Council within the scope of the City Charter and the Texas Open Meetings Act. Date Type of Meeting Cancelled Date Type of Meeting Cancelled January 2, 2017 City Holiday No Meeting/Holiday July 3, 2017 Worksession No Meeting/Holiday January 9, 2017 WS & Regular Call Election July 10, 2017 WS & Regular January 16, 2017 City Holiday No Meeting/Holiday July 17, 2017 Worksession January 23, 2017 WS & Regular July 18-19, 2017 Budget Workshop January 30, 2017 Worksession No Meeting/5th Monday July 24, 2017 WS & Regular February 6, 2017 Worksession July 31, 2017 Worksession No Meeting/5th Monday February 13, 2017 Special Meeting Community Revitalization Awards August 7, 2017 WS & Regular Set Public Hearings Tax Rate/Budget February 20, 2017 WS & Regular President's Day August 14, 2017 Worksession City Manager Budget Presentation February 27, 2017 WS & Regular August 21, 2017 WS & Regular Public Hearing Tax Rate (1st) March 6, 2017 Worksession No Meeting/PISD Spring Break August 28, 2017 WS & Regular Public Hearing T ax Rate (2nd) & Budget March 13, 2017 WS & Regular No Meeting/RISD Spring Break September 4, 2017 City Holiday No Meeting/Holiday March 20, 2017 Worksession September 11, 2017 WS & Regular Budget Adoption March 27, 2017 WS & Regular September 18, 2017 Worksession April 3, 2017 Worksession September 25, 2017 WS & Regular April 10, 2017 WS & Regular October 2, 2017 Worksession April 17, 2017 Worksession October 9, 2017 WS & Regular April 24, 2017 WS & Regular October 16, 2017 Worksession May 1, 2017 Worksession October 23, 2017 WS & Regular No Meeting May 8, 2017 WS & Regular October 30, 2017 WS & Regular May 15, 2017 Worksession Canvass Date November 6, 2017 Worksession May 22, 2017 WS & Regular November 13, 2017 WS & Regular May 29, 2017 City Holiday No Meeting/Holiday November 20, 2017 Worksession No Meeting/Holiday June 5, 2017 Worksession November 27, 2017 WS & Regular No Meeting/Holiday June 12, 2017 WS & Regular December 4, 2017 Worksession June 19, 2017 Worksession December 11, 2017 WS & Regular June 26, 2017 WS & Regular No Meeting/Summer Break December 18, 2017 Worksession No Meeting/Holiday December 25, 2017 City Holiday No Meeting/Holiday NOTES: Jan 9 Recommended date to Order Election due to Filing Period begins Jan18 (Deadline to order is Feb 17) May 6 is Election Day (Uniform Election Day changed from 2nd Saturday in May to 1st Saturday in May) Jun 10 is potential Runoff Date if needed 39 Total Meetings (Including Buget Retreat) 3
13 Proposed Changes Summer 2017 Cancel the July 17 th Worksession meeting to allow for a Budget Workshop to occur that evening Change the Budget Workshop dates from Tuesday, July 18 th - Wednesday, July 19 th to Monday, July 17 th Tuesday, July 18 th 4
14 2017 Proposed Meeting Schedule All City Council Meetings are subject to revision by City Council within the scope of the City Charter and the Texas Open Meetings Act. Date Type of Meeting Cancelled Date Type of Meeting Cancelled January 2, 2017 City Holiday No Meeting/Holiday July 3, 2017 Worksession No Meeting/Holiday January 9, 2017 WS & Regular Call Election July 10, 2017 WS & Regular January 16, 2017 City Holiday No Meeting/Holiday July 17, 2017 Worksession No Meeting/Budget WS scheduled January 23, 2017 WS & Regular July 17-18, 2017 Budget Workshop January 30, 2017 Worksession No Meeting/5th Monday July 24, 2017 WS & Regular February 6, 2017 Worksession July 31, 2017 Worksession No Meeting/5th Monday February 13, 2017 Special Meeting Community Revitalization Awards August 7, 2017 WS & Regular Set Public Hearings Tax Rate/Budget February 20, 2017 WS & Regular President's Day August 14, 2017 Worksession City Manager Budget Presentation February 27, 2017 WS & Regular August 21, 2017 WS & Regular Public Hearing Tax Rate (1st) March 6, 2017 Worksession No Meeting/PISD Spring Break August 28, 2017 WS & Regular Public Hearing T ax Rate (2nd) & Budget March 13, 2017 WS & Regular No Meeting/RISD Spring Break September 4, 2017 City Holiday No Meeting/Holiday March 20, 2017 Worksession September 11, 2017 WS & Regular Budget Adoption March 27, 2017 WS & Regular September 18, 2017 Worksession April 3, 2017 Worksession September 25, 2017 WS & Regular April 10, 2017 WS & Regular October 2, 2017 Worksession April 17, 2017 Worksession October 9, 2017 WS & Regular April 24, 2017 WS & Regular October 16, 2017 Worksession May 1, 2017 Worksession October 23, 2017 WS & Regular No Meeting May 8, 2017 WS & Regular October 30, 2017 WS & Regular May 15, 2017 Worksession Canvass Date November 6, 2017 Worksession May 22, 2017 WS & Regular November 13, 2017 WS & Regular May 29, 2017 City Holiday No Meeting/Holiday November 20, 2017 Worksession No Meeting/Holiday June 5, 2017 Worksession November 27, 2017 WS & Regular No Meeting/Holiday June 12, 2017 WS & Regular December 4, 2017 Worksession June 19, 2017 Worksession December 11, 2017 WS & Regular June 26, 2017 WS & Regular No Meeting/Summer Break December 18, 2017 Worksession No Meeting/Holiday December 25, 2017 City Holiday No Meeting/Holiday NOTES: Jan 9 Recommended date to Order Election due to Filing Period begins Jan18 (Deadline to order is Feb 17) May 6 is Election Day (Uniform Election Day changed from 2nd Saturday in May to 1st Saturday in May) Jun 10 is potential Runoff Date if needed 39 Total Meetings (Including Buget Retreat) 5
15 Budget Calendar Guidelines The annual budget calendar is designed to: Comply with the requirements of State Law and the City Charter Schedule time at June and July City Council meetings for advance, in-depth briefings of important topics referred to as deep dives Allow time for the public to review and comment on the proposed budget prior to budget adoption 6
16 Fiscal Year Budget Calendar Timeline March March Early May Fri. May 5, 2017 May 15 June 2, 2017 Mon. July 17 Tues. July 18, 2017 Fri. July 25, 2017 Mon. August 7, 2017 Fri. August 11, 2017 Mon. August 14, 2017 Mon. August 21, 2017 Mon. August 28, 2017 Mon. September 11, 2017 Focus Budget Goals discussed Departments work on proposed budget with City Manager s Office and Budget Office Departmental requests due to Budget Office Departmental budget meetings City Council Budget Workshops Certified tax rolls received Discuss tax rate, set public hearings on tax rate and take record vote on tax rate City Manager files proposed budget City Manager presents Budget to the City Council 1 st Public Hearing on the Proposed Budget 2 nd Public Hearing on the Proposed Budget, Charter required Public Hearing Budget Adoption 7
17 Upcoming Budget Briefings June 5 th : Overview of Preliminary Tax Values NTMWD Presentation and Water/Wastewater Maintenance Strategies Streets/Alley/Screening Walls Maintenance Strategies June 12 th : Aquatics Maintenance Strategies June 19 th : Bridges Maintenance Strategies Traffic Signs/Markings Maintenance Strategies Drainage Fund Overview Facilities Maintenance Strategies July 10 th : Proposed Fee Changes 8
18 Next Steps Accept City Council feedback and suggestions Communicate the updated City Council meeting calendar to the public 9

19 Discussion/Comments 10

20 Second Quarter Report May 22,
21 Overview Fund by Fund Review of the second quarter of Fiscal Year General Fund Water and Sewer Fund Solid Waste Services Fund Golf Fund Hotel/Motel Tax Fund 2
22 General Fund 3
23 Revenues Total revenues of $82.4M are $5.3M, or 6.9% above Fiscal Year YTD actual collections 100% YTD Revenues as a Percentage of Budget 75% 50% 25% 0% Prop. Tax Fran.Fees Sales Taxes Lic/Perm. Muni Ct Library Interest Civic Center Rec & Leisure Other Rev. G&A FY17 FY16 4
24 Property Tax Property Tax collections of $47.7M are $4.0M over last year s actual collections, with 97.5% collected this year compared to 97.7% last year. This increase is primarily the result of the growth in the tax base. 5

25 Sales Tax Sales and Other Business Tax collections of $15.9M represent 47.5% of the budget, or $1.3M above last year The Second Quarter ends with Sales Tax $1.3M above last years actual, $1.7M over budget, and $1.9M over last years base-tobase collections 6
26 Sales Tax Not part of this report, both the April and May 2017 remittances have been received After 7 months of collection, Fiscal Year is $1.2M over last years actual, $1.9M above the original budget, and $1.9M above base-to-base 7
27 Sales Tax FY FY Significant Significant State State Actual Actual Actual Actual Base Actual Base Actual Base Audit Base Audit to to to to to to Actual Adjustments Actual Budget Actual Adjustments Actual Actual $ Actual % Budget $ Budget % Base Actual $ Base Actual % NOV $ 3,121,512 $ 121,274 $ 3,242,786 $ 3,128,119 $ 3,000,957 $ 193,133 $ 3,194,090 $ (48,696) -1.50% $ 65, % $ (120,555) -3.86% DEC 2,532, ,315 3,130,964 2,703,995 2,765,735-2,765,735 (365,229) % 61, % 233, % JAN 2,146,672-2,146,672 2,180,000 2,402,076-2,402, , % 222, % 255, % FEB 3,262, ,386 3,427,332 3,475,664 4,018, ,689 4,243, , % 768, % 755, % MAR 2,181, ,764 2,372,764 2,452,211 2,992,747 2,992, , % 540, % 811, % APR 2,297,333-2,297,333 2,337,731 2,364,320 2,364,320 66, % 26, % 66, % MAY 3,211, ,212 3,501,924 3,160,764 3,150, ,088 3,335,881 (166,043) -4.74% 175, % (60,919) -1.90% Cumulative 18,753,824 1,365,951 20,119,775 19,438,483 20,694, ,910 21,298,701 1,178, % 1,860, % 1,940, % JUN 2,242,704-2,242,704 2,523, % 0.00% 0.00% JUL 2,725,633-2,725,633 2,437, % 0.00% 0.00% AUG 3,208,510 (363,167) 2,845,343 3,080, % 0.00% 0.00% SEP 2,412,880-2,412,880 2,649, % 0.00% 0.00% OCT 2,542, ,838 2,754,280 2,798, % 0.00% 0.00% TOTAL 31,885,993 1,214,622 33,100,615 32,928,179 20,694, ,910 21,298,701 To reach a Base to Base sales tax receipts comparison, significant audit adjustments are removed. Base sales tax receipts through May 2017 are 10.4% above Base sales tax receipts for November May of last year. Original FY Budget projected a 3.0% increase from year-end base estimate. 8
28 Franchise Fees YTD Franchise Fees of $6.3M represent 39.2% of the original budget, up slightly from last years collections of $6.0M or 38.2% last year The natural gas franchise fee is out pacing last year collection as a result of higher natural gas prices and increased Winter usage Communications and cable franchise fees are down slightly, while electric franchise fees are up slightly 9
29 License & Permits License and Permits of $2.3M represent 78.2% of the budgeted $2.9M compared to the $2.4M or 53.8% of last year s actual of $4.6M This year includes multi-family developments at City Line and at Routh Creek 10
30 Recreation and Leisure Recreation and Leisure revenues of $1.6M represent 37.4% of the budgeted $4.3M compared to the $1.4M or 34.2% of last year s actual of $4.1M Strong performance across all categories 11
31 Remaining Revenues Remaining revenue collections of $8.6M represent 48.1% of the original budget compared to $8.8M, or 49.3% last year 12
32 Expenditures YTD Expenditures for Fiscal Year of $60.3M represent 48.9% of the budgeted expenditures, up slightly from the 45.4% of expenditures last year YTD Expenditures less transfers of $57.9M or 48.9% are about equal with the pace of expenditures last year The Professional Services category is currently $485K over last year and is mainly the result of the timing of some of the payments made 13
33 Expenditures (continued) The Contracts category is currently $1.4M over last year and is also the result of the timing of payments For the Second Quarter, all remaining categories are within expected spending parameters for the year 14
34 Water and Sewer Fund 15
35 Revenues Revenues for the Water and Sewer Fund are $31.1M, or 43.3% of the budget compared to $30.2M, or 47.2% last year Water Sales of $18.1M represent 40.4% of the budget compared to $17.9M or 46.6% last year Sewer Sales of $12.4M represent 48.3% of the budget compared to $11.7M or 48.4% last year 16
36 Rainfall The following graph compares rainfall YTD of 16.4 compared to last years 39.1 and the 5-year average
37 Water Sales The following table compares commercial usage, in 1,000 gallon increments, by month for both this year and last 18
38 Water Sales The following table compares Residential usage, in 1,000 gallon increments, by month for both this year and last 19
39 Water Sales When measured against expected revenue targets water sales are ($1.4M) below budget 20
40 Water Sales This chart is not part of the Second Quarter Report and shown here as illustration of the impact of outdoor irrigation. When we include April usage, the previous deficit is been reduced by half to ($756K) below budget targets. 21
41 Revenues Remaining revenues of $680K represent 43.3% of the budget compared to $711K or 46.0% Late Fee revenues of $429K represent 46.9% of the budgeted $916K compared to the $467K or 52.9% of last year s actual of $884K 22
42 Expenditures Total Expenditures and Transfers for the Water and Sewer Fund of $34.6M represent 48.5% of the budgeted $70.5M compared to last years 50.8% YTD Maintenance expenditures are $2.4M over last year and represent the increased costs from our wholesale service providers. This increase was planned and budgeted for All other expenditure categories are within established parameters for their category 23
43 Solid Waste Services 24
44 Revenues Total YTD revenues of $7.2M represent 49.1% of the $14.7M budgeted Residential collections of $3.0M are $359K over last year while commercial collection fees of $3.9 M are $174K over the prior year The remaining revenue categories combine for $326K, down slightly from the same time last year 25
45 Expenditures YTD expenditures are 51.1% or $7.5M of the budget compared with 53.3% or $7.2M for last year Professional Services expenditures are $91K over last year and represents a change in the recycling contract. This increase was planned and budgeted for All expenditure categories are performing within established parameters 26
46 Golf Fund 27
47 Revenues Total Revenues of $916K represent 39.0% of the budgeted $2.4M Rounds played of 30,889 are 1,558, or 5.3% above last year. Rounds played have recovered nicely after a decline in December and January as a result of bad weather. 8,000 7,000 6,000 5,000 4,000 3,000 2,000 1,000 - Rounds Played To Date Oct. Nov. Dec. Jan. Feb. Mar. Apr May Jun July Aug. Sept
48 Revenues Green Fees of $621K are $37K over last year actuals but ($63K) below FY17 budget targets for the year Cart Fees of $250K are $81K over last year and exceeding budget targets for the year by $16K Remaining revenues of $45K are ($6K) below last year but within expected targets for the second quarter 29
49 Expenditures Total Expenditures and Transfers of $1.1M represent 48.9% of the budgeted $2.2M All expenditure categories are within established second quarter parameters 30
50 Hotel/Motel Tax Fund 31
51 Revenues Total revenues of $3.1M represent 43.7% of expected revenues Tax Revenues of $1.6M are even with last year s YTD actual collection of $1.7M Eisemann Center Revenues of $516K are down slightly from last year but even with expected second quarter targets Eisemann Center Presents revenue of $750K represents 66.1% of original budget Remaining revenues are performing as expected 32
52 Expenditures Total Expenditures and Transfers for the Hotel/Motel Tax Fund of $3.5M represent 50.2% of the budget All expenditures are performing as expected 33
53 Questions 34
City Council Work Session Handouts. February 12, I. Review and Discuss Sign Control Board Case #18-01, Berkner High School
 City Council Work Session Handouts February 12, 2018 I. Review and Discuss Sign Control Board Case #18-01, Berkner High School II. III. IV. Review and Discuss the 2016-2017 Comprehensive Annual Financial
Comprehensive Monthly Financial Report July 2013
 Comprehensive Monthly Financial Report July 2013 MONTHLY FINANCIAL REPORT PERFORMANCE AT A GLANCE ALL FUNDS SUMMARY GENERAL FUND REV VS EXP PROPERTY TAXES SALES TAXES FRANCHISE FEES UTILITY FUND REV VS
Power Accountants Association Annual Meeting Potential Impacts from Oct 2015 Rate Change
 Power Accountants Association Annual Meeting Potential Impacts from Oct 2015 Rate Change Material Provided by: Chris Mitchell Chris Mitchell Management Consultants (CMMC) mail@chrismitchellmc.com 5/14/2015
FY20 BUDGET TIMETABLE
 FY20 BUDGET TIMETABLE (Revised - 3/21/19- see last page for listing of revisions made to original timetable) Date Day Time Meeting Activity Jan 8 Tue 9:30 a.m. BCC Mtg BCC Regular Meeting Jan 15 Tue 9:30
FY19 BUDGET TIMETABLE
 FY19 BUDGET TIMETABLE (Revised - 8/08/18 - see last page for listing of revisions made to original timetable) Date Day Time Meeting Activity 2018 Jan 9 Tue 9:30 a.m. BCC Mtg BCC Regular Meeting Jan 16
a b c d (c-b) Sept 30, 2015 Cash Balance
 Sept 30, 2015 Cash Balance") Staff Report To: From: Mayor John Muhlfeld and City Councilors Dana Smith, Finance Director Date: October 29, 2017 Re: 1st Quarter Financial Report for Fiscal Year 2018 This quarterly financial report
Staff Report To: From: Mayor John Muhlfeld and City Councilors Dana Smith, Finance Director Date: October 29, 2017 Re: 1st Quarter Financial Report for Fiscal Year 2018 This quarterly financial report
City of Justin NOVEMBER
 City of Justin MONTHLY FINANCIAL REPORT NOVEMBER - 2018 1 Revenues: Sales tax revenue is up 14.5% from this time prior year and November s sales tax collections increased 2.4% from November 2017. The City
BOARD OF TRUSTEES YEARLY CALENDAR
 BOARD OF TRUSTEES YEARLY CALENDAR 2017-2018 July Wednesday July 1 July 10 Beginning of Fiscal Year Review handbooks Supt Formative Evaluation Set date for Goal Setting Session Annual adoption - Student
Quarterly Financial Report. Reporting financial results for the first quarter ended September 30, 2014
 Quarterly Financial Report Reporting financial results for the first quarter ended September 30, 2014 Woodburn Finance Department 10/27/2014 Executive Summary The Finance Department is pleased to offer
GENERAL FUND AT A GLANCE Category Budget YTD Actual % % Year Passed Resources 8.33% Uses 8.33% $0 $1,330,750
 City of Edmond Monthly Financial Report FY 2008/2009 Through the Month Ended Unaudited - Intended for Management Purposes Only The following is a summary of the City's financial results for operating funds.
City of Richardson, Texas. FY Proposed Budget
 City of Richardson, Texas FY 2010-2011 Proposed Budget City of Richardson, Texas Combined Fund Summaries 2 Combined Budget Combined Budget 2009-2010 Estimated 2010-2011 Budget Est./Bud. % Beginning Fund
ICE LIBOR Holiday Calendar 2019
 ICE LIBOR Holiday Calendar Date Day Holiday GBP CHF JPY 01-Jan- Tuesday New Year's Day O O O O O 21-Jan- Monday Martin Luther King's Birthday () P No O/N P P P 18-Feb- Monday President's Day () P No O/N
Mar 31, 2018 Cash Balance
 Staff Report To: Mayor Muhlfeld and City Councilors From: Dana Smith, Finance Director Date: April 28, 2018 Re: 3rd Quarter Financial Report for Fiscal Year 2018 This quarterly financial report provides
Budget Initial Public Forum FY Town of Chapel Hill 405 Martin Luther King Jr. Blvd.
 Budget Initial Public Forum FY2018 19 Agenda Forum Topics Budget Process Budget Status Purpose of the Public Forum Forum Topics Budget Process Budget Status present background information on budget topics
Capital Overview. Capital projects also include purchase of infrastructure, plant, and equipment that meet the following thresholds:
 Capital Overview The capital budget consists of capital projects, which are a set of activities that maintain or improve a city asset, often referred to as infrastructure-from buildings, to park trails,
GENERAL FUND AT A GLANCE Category Budget YTD Actual % % Year Passed Resources 50.00% Uses 50.00% $0 $1,928,600
 City of Edmond Monthly Financial Report FY 2007/2008 Through the Month Ended Unaudited - Intended for Management Purposes Only The following is a summary of the City's financial results for operating funds.
City of Joliet 2014 Revenue Review. October 2013
 City of Joliet 2014 Revenue Review October 2013 General Fund 2014 Est. Revenues = $163.6 M Licenses, Permits, Fees Gaming Taxes 5% 12% Sales Taxes 27% Income Taxes 9% Charges for Services 14% Other Taxes
Economic Activity Index ( GDB-EAI ) For the month of May 2013 G O V E R N M E N T D E V E L O P M E N T B A N K F O R P U E R T O R I C O
 For the month of May 2013 G O V E R N M E N T D E V E L O P M E N T B A N K F O R P U E R T O R I C O") Economic Activity Index ( GDB-EAI ) For the month of May 2013 General Commentary May 2013 GDB-EAI for the month of May registered a 3.4% year-over-year ( YOY ) reduction May 2013 EAI was 126.7, a 3.4%
Economic Activity Index ( GDB-EAI ) For the month of May 2013 General Commentary May 2013 GDB-EAI for the month of May registered a 3.4% year-over-year ( YOY ) reduction May 2013 EAI was 126.7, a 3.4%
Water and Sewer Fund. Maintenance ""'\. 61.2% \ Professional Services. I l 1 1.9% Fund Balance
 Water and Sewer Fund The Water and Sewer Fund, an enterprise fund and the City's second largest operating fund, provides for the administration, operation and maintenance of the City's water and wastewater
Cash & Liquidity The chart below highlights CTA s cash position at March 2018 compared to March 2017.
 To: Chicago Transit Authority Board From: Jeremy Fine, Chief Financial Officer Re: Financial Results for March 2018 Date: May 9, 2018 I. Summary CTA s financial results are $0.9 million favorable to budget
11 May Report.xls Office of Budget & Fiscal Planning
 Education and General Fund Actual Revenues and s by Month MTD YTD Change Revenue Jul Aug Sep Oct Nov Dec Jan Feb Mar Apr May Jun Per 14 Total over FY06 Enrollment Fees $ 8,211 $ 219 $ 41,952 ($ 818) $
FOR RELEASE: MONDAY, MARCH 21 AT 4 PM
 Interviews with 1,012 adult Americans conducted by telephone by Opinion Research Corporation on March 18-20, 2011. The margin of sampling error for results based on the total sample is plus or minus 3
September 2014 Monthly Financial Report PREPARED BY
 September 2014 Monthly Financial Report PREPARED BY Financial Accounting & Reporting Division City of Phoenix Monthly Financial Report September 2014 Table of Contents by Programs Page Performance Status
Big Walnut Local School District
 Big Walnut Local School District Monthly Financial Report for the month ended September 30, 2013 Prepared By: Felicia Drummey Treasurer BIG WALNUT LOCAL SCHOOL DISTRICT SUMMARY OF YEAR TO DATE FINANCIAL
Executive Summary. July 17, 2015
 Executive Summary July 17, 2015 The Revenue Estimating Conference adopted interest rates for use in the state budgeting process. The adopted interest rates take into consideration current benchmark rates
QUARTERLY FINANCIAL REPORT
 QUARTERLY FINANCIAL REPORT Page Key Trends... 2 Executive Summary... 3 Economic Indicators... 4 General Fund... 8 Public Safety & Justice... 10 Land Use, Housing & Transportation... 11 Health & Human Services...
Budget Year A Guide to San Francisco's Budget Process
 Budget Year 2010-11 A Guide to San Francisco's Budget Process Prepared by City and County of San Francisco Controller's Office April 15, 2010 A Guide to San Francisco's Budget Process City & County of
Economic and Revenue Update
 Economic and Revenue Update A Briefing for the Money Committees Aubrey L. Layne, Jr. Secretary of Finance Commonwealth of Virginia www.finance.virginia.gov January 2018 Topics for Discussion National and
Council MONTHLY REPORT
 Council MONTHLY REPORT DEPARTMENT: Finance MONTH: December 2017 REVE NUE General Fund sales tax receipts received in November, reported in January are up 14.31% over the same month in 2016. Decreases from
DETROIT LAKES CITY COUNCIL SPECIAL MEETING AGENDA TUESDAY, June 19, 2018
 DETROIT LAKES CITY COUNCIL SPECIAL MEETING AGENDA TUESDAY, June 19, 2018 The items on my desk as of Wednesday, June 13, 2018, to be presented for discussion and action at the Special Meeting of the City
2011 Budget Initial Stakeholder Call
 2011 Budget Initial Stakeholder Call Michael Epstein Director of Financial Planning June 23, 2010 Agenda TOPIC PRESENTER Introduction Steve Berberich Budget principles & strategic initiatives Steve Berberich
Management Comments. February 12, 2015
 Management Comments February 12, 2015 Average Bill, Not Average Cost of Service Court Rich: according to this Exhibit 6, 62.4 percent of the people in E-23 are paying less than the average cost of service,
Budget Initial Public Forum FY16-17 February 22, Town of Chapel Hill 405 Martin Luther King Jr. Blvd.
 Budget Initial Public Forum FY16-17 February 22, 2016 Agenda Forum Topics Budget Process Budget Status Forum Topics Budget Process Budget Status Purpose of the Public Forum present background information
January 2015 Monthly Financial Report PREPARED BY
 January 2015 Monthly Financial Report PREPARED BY Financial Accounting & Reporting Division City of Phoenix Monthly Financial Report January 2015 Table of Contents by Programs Page Performance Status
Mechanics of Cash Flow Forecasting
 Texas Association Of State Senior College & University Business Officers July 13, 2015 Mechanics of Cash Flow Forecasting Susan K. Anderson, CEO Anderson Financial Management, L.L.C. 130 Pecan Creek Drive
FDD FIRM STORAGE SERVICE NORTHERN NATURAL GAS COMPANY
 FDD FIRM STORAGE SERVICE NORTHERN NATURAL GAS COMPANY FIRM STORAGE SERVICE OPTIONS Northern s firm storage service is provided pursuant to the FDD Rate Schedule located in Northern s FERC Gas Tariff. The
$180 $160 $140 $120 $100 $80 $60 $40 $20 $ Single Fam -New Apts -New
 2012 REVENUE FORECAST Presented by Brian Henshaw September 26, 2011 1 Economic Conditions Housing starts Federal & State deficits Sovereign-debt crisis Bankruptcies Unemployment Stock Market volatility
XML Publisher Balance Sheet Vision Operations (USA) Feb-02
 Feb-02") Page:1 Apr-01 May-01 Jun-01 Jul-01 ASSETS Current Assets Cash and Short Term Investments 15,862,304 51,998,607 9,198,226 Accounts Receivable - Net of Allowance 2,560,786
Page:1 Apr-01 May-01 Jun-01 Jul-01 ASSETS Current Assets Cash and Short Term Investments 15,862,304 51,998,607 9,198,226 Accounts Receivable - Net of Allowance 2,560,786
Review of Registered Charites Compliance Rates with Annual Reporting Requirements 2016
 Review of Registered Charites Compliance Rates with Annual Reporting Requirements 2016 October 2017 The Charities Regulator, in accordance with the provisions of section 14 of the Charities Act 2009, carried
MARCH M T W T F S S
 0 0 JANUARY 0 0 0 FEBRUARY 0 0 MARCH 0 0 0 JANUARY 0 0 0 FEBRUARY 0 0 MARCH 0 0 0 APRIL 0 0 0 JULY 0 0 0 MAY 0 0 0 AUGUST 0 0 0 JUNE 0 0 0 SEPTEMBER 0 0 0 APRIL 0 0 0 JULY 0 0 0 MAY 0 0 0 AUGUST 0 0 0
Cash & Liquidity The chart below highlights CTA s cash position at January 2018 compared to January 2017.
 To: Chicago Transit Authority Board From: Jeremy Fine, Chief Financial Officer Re: Financial Results for January 2018 Date: March 14, 2018 I. Summary CTA s financial results are $1.7 million unfavorable
FY Budget Outlook. City Council Briefing December 3, 2014
 FY 2015-16 Budget Outlook City Council Briefing December 3, 2014 Purpose of Briefing Recap FY 2014-15 adopted budget Discuss early considerations for FY 2015-16 budget Review changes in budget development
2018 Financial Management Classes
 2018 Financial Management Classes MONEY MANAGEMENT CLASS/BANKING OPERATONS (1ST & 3RD FRIDAY) INVESTING BASICS (2ND FRIDAY) CREDIT MANAGEMENT BLENDED RETIREMENT SYSTEM/THRIFT SAVINGS PLAN (4TH FRIDAY)
Second Quarter 2016 Earnings Presentation. July 29, 2016
 Second Quarter 2016 Earnings Presentation July 29, 2016 Agenda Strategic Review Financial Review Questions and Answers Edward Tilly Chief Executive Officer Alan Dean Executive Vice President, CFO and Treasurer
June Economic Activity Index ( GDB-EAI )
") June 2014 Economic Activity Index ( GDB-EAI ) General Commentary June 2014 In June 2014, the GDB-EAI registered a 1.0% year-over-year (y-o-y) reduction, after showing a 1.1% y-o-y decrease in June 2014.
June 2014 Economic Activity Index ( GDB-EAI ) General Commentary June 2014 In June 2014, the GDB-EAI registered a 1.0% year-over-year (y-o-y) reduction, after showing a 1.1% y-o-y decrease in June 2014.
2009 Reassessment As Impacted by Senate Bill 711
 Saint Louis County 2009 Reassessment As Impacted by Senate Bill 711 Impacts of SB711 on the 2009 Reassessment Plan The County must notify property owners of changes in the projected tax liability resulting
Financial Report - FY 2017 Year to Date May 31, 2017
 Financial Report - FY 2017 Year to Date July 19, 2017 1 Major Highlights Revenue Sales tax remittances received through YTD April 2017 are 4.2% higher than YTD April 2016 Plaza Saltillo lease income budgeted
Financial Report for the Month of SEPTEMBER
 WILLOUGHBY, OH Financial Report for the Month of SEPTEMBER Month Ended SEPTEMBER 30, 2013 BOARD OF EDUCATION Mrs. Margaret Warner, President SUPERINTENDENT Mr. Steve Thompson Mrs. Sharon Scott, Vice President
UMass Lowell A Strategic Plan for the Next Decade. Committee on Financial Planning & Budget Review Organizational Meeting
 UMass Lowell 2020 A Strategic Plan for the Next Decade Committee on Financial Planning & Budget Review Organizational Meeting March 6, 2009 Agenda Summary of Committee Charge Budget Planning Context Overview
Exam 1 Problem Solving Questions Review
 Exam 1 Problem Solving Questions Review SECTION 1 The following data were obtained from a recent quarterly report for Dell Computer (in millions): Net revenue $8,028 Cost of revenue $6,580 Inventories:
CITY OF EAST POINT SUMMARY OF REVENUES & EXPENDITURES FOR THE PERIOD ENDING
 SUMMARY OF S & EXPENDITURES FOR THE PERIOD ENDING Sept 30th 2017 Sep17 FY 2018 FY 2018 % of YTD ACTUAL BUDGET VARIANCE Budget FUND 100 General Fund Taxation $ 3,415,289 $ 26,103,235 $ (22,687,946) 13%
Wells Branch Municipal Utility District. Accounting Report. July 17, 2018
 Wells Branch Municipal Utility District Accounting Report July 17, 2018 Financial Highlights: The operating fund has cash and investments of approximately $11.7 million; the debt service fund cash/investment
STAFF REPORT Corporate Services
 1 Corporate Services STAFF REPORT Corporate Services Title: Core Consumer Price Index Update Report Number: CORP2018-071 Author: Kim Reger & Brad Witzel Meeting Type: Finance & Strategic Planning Committee
QUESTION 2. QUESTION 3 Which one of the following is most indicative of a flexible short-term financial policy?
 QUESTION 1 Compute the cash cycle based on the following information: Average Collection Period = 47 Accounts Payable Period = 40 Average Age of Inventory = 55 QUESTION 2 Jan 41,700 July 39,182 Feb 18,921
Employment Data (establishment)
") Table 1: Major Indicators of Labor Market Activity for New Jersey Seasonally Adjusted (thousands) Benchmark Labor Force Data (resident) Current Month Previous Month One Year Ago Net Change Net Change May
Table 1: Major Indicators of Labor Market Activity for New Jersey Seasonally Adjusted (thousands) Benchmark Labor Force Data (resident) Current Month Previous Month One Year Ago Net Change Net Change May
FISCAL YEAR END st QUARTER REVIEW
 FISCAL YEAR END 2016.5 1st QUARTER REVIEW At the end of September 2016, we reached the mid-year point for this 6-month budget year ending December 31, 2016, prompting a thorough review of the budget. The
ENSTAR Natural Gas Company 8/15/2014 Alaska Pipeline Company Gas Cost Adjustment Calculation 2014 Q4
 ENSTAR Natural Gas Company 8/15/2014 Alaska Pipeline Company Gas Cost Adjustment Calculation 2014 Q4 Contract Current Base Index Current Reimbursed Price Base Price Index Index Ratio Calculated Price Net
Fiscal Year 2018 Project 1 Annual Budget
 Fiscal Year 2018 Project 1 Annual Budget Table of Contents Table Page Summary 3 Summary of Costs Table 1 4 Treasury Related Expenses Table 2 5 Summary of Full Time Equivalent Table 3 6 Positions Cost-to-Cash
CITY OF BOYNTON BEACH FY ADOPTED SUMMARY BUDGET
 CITY OF BOYNTON BEACH, FLORIDA CITY OF BOYNTON BEACH FY 2017-2018 ADOPTED SUMMARY BUDGET P a g e 1 46 Boynton Beach Mayor and City Commission Commissioner Joe Casello, Commissioner Christina Romelus, Vice
2017 UTILITY RATE STUDY WORK SESSION #2: BACKGROUND, EDUCATIONAL/INFORMATIONAL
 2017 UTILITY RATE STUDY WORK SESSION #2: BACKGROUND, EDUCATIONAL/INFORMATIONAL Receive a presentation from Lewis Young Robertson & Burningham regarding the 2017 Utility Rate Study The purpose of the Council
Economic and Travel Indicator
 Economic and Travel Indicator If you have any questions, please contact: September 218 Economic and Labor Market Information Division 82-828-422 Labor.Lmi@vermont.gov Released November 13, 218 VERMONT
City Council Budget Work Session. City of McKinney August 4, 2017
 City Council Budget Work Session City of McKinney August 4, 2017 Agenda Budget Process & FY18 Overview Property Tax General Fund Revenues & Expenditures Capital Improvements Program Debt Service Water
FINANCIAL MANAGEMENT STRATEGY REPORT ON OUTCOMES FOR THE YEAR ENDED MARCH 31, 2016
 FINANCIAL MANAGEMENT STRATEGY REPORT ON OUTCOMES FOR THE YEAR ENDED MARCH 31, 2016 Manitoba Finance General Inquiries: Room 109, Legislative Building Winnipeg, Manitoba R3C 0V8 Phone: 204-945-5343 Fax:
Spheria Australian Smaller Companies Fund
 29-Jun-18 $ 2.7686 $ 2.7603 $ 2.7520 28-Jun-18 $ 2.7764 $ 2.7681 $ 2.7598 27-Jun-18 $ 2.7804 $ 2.7721 $ 2.7638 26-Jun-18 $ 2.7857 $ 2.7774 $ 2.7690 25-Jun-18 $ 2.7931 $ 2.7848 $ 2.7764 22-Jun-18 $ 2.7771
HUD NSP-1 Reporting Apr 2010 Grantee Report - New Mexico State Program
 HUD NSP-1 Reporting Apr 2010 Grantee Report - State Program State Program NSP-1 Grant Amount is $19,600,000 $9,355,381 (47.7%) has been committed $4,010,874 (20.5%) has been expended Grant Number HUD Region
PJM SERTP Planning Process Overview
 PJM SERTP Planning Process Overview Order 1000 Biennial Regional Transmission Plan Review Meeting Presentation 1 of 2 May 8 th, 2018 Georgia Power Corporate Headquarters Atlanta, GA PJM SERTP Interregional
Wells Branch Municipal Utility District. Accounting Report. February 20, 2018
 Wells Branch Municipal Utility District Accounting Report February 20, 2018 Financial Highlights: The operating fund has cash and investments of approximately $10.7 million; the debt service fund cash/investment
Financial & Business Highlights For the Year Ended June 30, 2017
 Financial & Business Highlights For the Year Ended June, 17 17 16 15 14 13 12 Profit and Loss Account Operating Revenue 858 590 648 415 172 174 Investment gains net 5 162 909 825 322 516 Other 262 146
Jan Feb Mar Apr May Jun Jul Aug Sep Oct Nov Dec. Unemployment Rate published by the Texas Workforce Commission for September 2014
 McKinney at a Glance A monthly report prepared by the McKinney Planning Department City of McKinney Planning Department 221 N. Tennessee St. McKinney, TX 7569 Phone: 972.547.7475 Fax: 972.547.264 Hours:
Wells Branch Municipal Utility District. Accounting Report. December 19, 2017
 Wells Branch Municipal Utility District Accounting Report December 19, 2017 Financial Highlights: The operating fund has cash and investments of approximately $8.9 million; the debt service fund cash/investment
During the 5:00 pm workshop Monday, department heads and I will present a quarterly update on our strategic plan initiatives.
 October 21, 2011 To: From: Subject: Mayor Bemrich and City Council David Fierke, City Manager Strategic Plan Update ACTION: For Discussion Monday, October 24, 2011 During the 5:00 pm workshop Monday, department
FY Proposed Budget and Plan of Municipal Services. August 12 th, Presented by Robert Camareno, Interim City Manager
 FY 2013-14 Proposed Budget and Plan of Municipal Services August 12 th, 2013 Presented by Robert Camareno, Interim City Manager 1 City Council Policy Direction Budget developed following City Council policy
Tooele County. Financial Recovery Plan 3rd Quarter 2014 Update
 Tooele County Financial Recovery Plan 3rd Quarter 2014 Update Original Projection 14,000,000 Tooele County Cash 2009-2015 12,000,000 10,000,000 8,000,000 6,000,000 4,000,000 2,000,000 - Ahead of Projection
Big Walnut Local School District
 Big Walnut Local School District Monthly Financial Report for the month ended September 30, 2012 Prepared By: Felicia Drummey Treasurer BIG WALNUT LOCAL SCHOOL DISTRICT SUMMARY OF YEAR-TO-DATE FINANCIAL
MARCH M T W T F S S
 0 00 JANUARY 0 0 0 FEBRUARY 0 0 MARCH 0 0 0 JANUARY 0 0 0 FEBRUARY 0 0 MARCH 0 0 0 APRIL 0 0 0 MAY 0 0 0 JUNE 0 0 0 APRIL 0 0 0 MAY 0 0 0 JUNE 0 0 0 JULY 0 0 0 AUGUST 0 0 0 SEPTEMBER 0 0 0 JULY 0 0 0 AUGUST
SHAKER HEIGHTS BOARD OF EDUCATION SHAKER HEIGHTS, OHIO. May 5, Members, Shaker Heights Board of Education
 SHAKER HEIGHTS BOARD OF EDUCATION SHAKER HEIGHTS, OHIO TO: FROM: SUBJECT: Members, Shaker Heights Board of Education Bryan C. Christman, Treasurer Financial and Miscellaneous Briefs I. GENERAL FUND (As
ONTARIO-MICHIGAN BORDER TRANSPORTATION PARTNERSHIP Planning/Need and Feasibility Study. 1. Work Accomplished This Period (4 Weeks)
") ONTARIO-MICHIGAN BORDER TRANSPORTATION PARTNERSHIP Planning/Need and Feasibility Study MONTHLY PROGRESS REPORT #19 Period Ending September 30, 2003 1. Work Accomplished This Period (4 Weeks) Strategic
ONTARIO-MICHIGAN BORDER TRANSPORTATION PARTNERSHIP Planning/Need and Feasibility Study MONTHLY PROGRESS REPORT #19 Period Ending September 30, 2003 1. Work Accomplished This Period (4 Weeks) Strategic
Cash & Liquidity The chart below highlights CTA s cash position at March 2017 compared to March 2016.
 To: Chicago Transit Authority Board From: Jeremy Fine, Chief Financial Officer Re: Financial Results for March 2017 Date: May 10, 2017 I. Summary CTA s financial results are $0.6 million favorable to budget
Table 1: Major Indicators of Labor Market Activity for New Jersey Seasonally Adjusted 2016 Benchmark Labor Force Data (resident)
") Table 1: Major Indicators of Labor Market Activity for New Jersey Seasonally Adjusted Benchmark Labor Force Data (resident) Current Month Previous Month One Year Ago Net Change Net Change Dec. 17 (P) Nov.
Table 1: Major Indicators of Labor Market Activity for New Jersey Seasonally Adjusted Benchmark Labor Force Data (resident) Current Month Previous Month One Year Ago Net Change Net Change Dec. 17 (P) Nov.
Lindab Group presentation Q3 2010
 lindab group presentation Lindab Group presentation Q3 2010 David Brodetsky, CEO Nils-Johan Andersson, CFO Agenda Highlights Group Business Areas Strategy Trends and outlook Q & A 2 Lindab Group Highlights
Review of Membership Developments
 RIPE Network Coordination Centre Review of Membership Developments 7 October 2009/ GM / Lisbon http://www.ripe.net 1 Applications development RIPE Network Coordination Centre 140 120 100 80 60 2007 2008
Recommended by City Manager A.C. Gonzalez
 Recommended by City Manager A.C. Gonzalez Proposed budget is fiscally responsible, strategically begins restoring services, and positions City to continue growth FY 2014-15 budget is balanced and totals
SHAKER HEIGHTS BOARD OF EDUCATION SHAKER HEIGHTS, OHIO. April 12, Members, Shaker Heights Board of Education
 SHAKER HEIGHTS BOARD OF EDUCATION SHAKER HEIGHTS, OHIO TO: FROM: SUBJECT: Members, Shaker Heights Board of Education Bryan C. Christman, Treasurer Financial and Miscellaneous Briefs I. GENERAL FUND (As
Performance Report October 2018
 Structured Investments Indicative Report October 2018 This report illustrates the indicative performance of all Structured Investment Strategies from inception to 31 October 2018 Matured Investment Strategies
Study Workshops are designed to be both educational and to seek broad direction from the Board
 Study Workshops are designed to be both educational and to seek broad direction from the Board Workshop #1 Financial Forecast & Cost of Service Water, recycled water, & sewer services Revenue requirement
QUARTERLY FINANCIAL REPORT
 QUARTERLY FINANCIAL REPORT Page Key Trends Summary...2 Executive Summary...3 Economic Indicators...4 General Fund...8 Public Safety & Justice...10 Land Use, Housing & Transportation...11 Health & Human
Common stock prices 1. New York Stock Exchange indexes (Dec. 31,1965=50)2. Transportation. Utility 3. Finance
2. Transportation. Utility 3. Finance") Digitized for FRASER http://fraser.stlouisfed.org/ Federal Reserve Bank of St. Louis 000 97 98 99 I90 9 9 9 9 9 9 97 98 99 970 97 97 ""..".'..'.."... 97 97 97 97 977 978 979 980 98 98 98 98 98 98 987 988
Digitized for FRASER http://fraser.stlouisfed.org/ Federal Reserve Bank of St. Louis 000 97 98 99 I90 9 9 9 9 9 9 97 98 99 970 97 97 ""..".'..'.."... 97 97 97 97 977 978 979 980 98 98 98 98 98 98 987 988
PARADISE IRRIGATION DISTRICT
 PARADISE IRRIGATION DISTRICT 6332 Clark Rel I P.O. Box 2409 I Paradise, California 95967 I 530.$77.4971 I Fax 530.$76.04$3 1. Cash position At 5/31/2017 the Districts total cash position was $2,337,027.46.
Southern Sanitation Exhibit A Rate Structure for City of Lauderdale Lakes Effective October 1, 2016
 Residential: 1.0% Curbside Service Collection $ 8.22 $ 0.12 n/a $ 8.34 $ 0.12 Disposal $ 5.62 n/a $ 0.06 $ 5.68 $ 0.06 Franchise Fee 12% $ 3.29 $ 0.02 $ 0.01 $ 3.32 $ 0.03 Subtotal $ 17.13 $ 0.14 $ 0.07
CITY OF RICHMOND MONTHLY FINANCE REPORT AS OF APRIL 30, 2017
 CITY OF RICHMOND MONTHLY FINANCE REPORT AS OF APRIL 30, 2017 CITY OF RICHMOND DEPARTMENT OF FINANCE TABLE OF CONTENTS Letter of Transmittal I General Fund - Budgetary Comparison Schedule - Revenues 1
Current Employment Statistics
 Current Employment Statistics October 2017 If you have any questions or seek additional information, please contact: Vermont Department of Labor Economic and Labor Market Information Division 802-828-4202
Cash & Liquidity The chart below highlights CTA s cash position at July 2016 compared to July 2015.
 To: Chicago Transit Authority Board From: Jeremy Fine, Chief Financial Officer Re: Financial Results for July 2016 Date: September 14, 2016 I. Summary CTA s financial results are $0.4 million favorable
Division of Bond Finance Interest Rate Calculations. Revenue Estimating Conference Interest Rates Used for Appropriations, including PECO Bond Rates
 Division of Bond Finance Interest Rate Calculations Revenue Estimating Conference Interest Rates Used for Appropriations, including PECO Bond Rates November 16, 2018 Division of Bond Finance Calculation
State of Ohio Workforce. 2 nd Quarter
 To Strengthen Ohio s Families through the Delivery of Integrated Solutions to Temporary Challenges State of Ohio Workforce 2 nd Quarter 2 0 1 2 Quarterly Report on the State of Ohio s Workforce Reference
U.S. Natural Gas Storage Charts
 U.S. Natural Gas Storage Charts BMO Capital Markets Commodity Products Group November 26, 214 Total U.S. Natural Gas in Storage 5, Total Stocks This Week 3432 4, 3, 2, 1, Reported On: November 26, 214
Cash & Liquidity The chart below highlights CTA s cash position at June 2018 compared to June 2017.
 To: Chicago Transit Authority Board From: Jeremy Fine, Chief Financial Officer Re: Financial Results for June 2018 Date: August 15, 2018 I. Summary CTA s financial results are unfavorable to budget for
2019 Budget Overview. Presentation to Budget Committee December 11, 2018
 2019 Budget Overview Presentation to Budget Committee December 11, 2018 Introductory Comments Mike Murray Chief Administrative Officer 2019 Budget Challenges Base Budget pressures Infrastructure funding
Week of Monday Tuesday Wednesday Thursday Friday
 Aug 29 Multiplication 3-digit by 2-digit Division 4-digit by 2-digit Add and subtract 2-digit Sept 5 No School Labor Day Holiday Multiplication 3-digit by 2-digit Division 4-digit by 2-digit Add and subtract
CENTRAL DIVISION MONTHLY STATISTICS FOR
 CENTRAL DIVISION MONTHLY STATISTICS FOR December 1st - 31st, 24 CENTRAL OKANAGAN DIVISION STAT - O - GRAM December 24 QUICK SUMMARY TOTAL SALES RESIDENTIAL TOTAL VOLUME SALES LISTINGS Listings # of Units
Current Employment Statistics
 Current Employment Statistics December 2017 If you have any questions or seek additional information, please contact: Vermont Department of Labor Economic and Labor Market Information Division 802-828-4202