Cash & Liquidity The chart below highlights CTA s cash position at January 2018 compared to January 2017.
|
|
|
- Virginia Lawrence
- 5 years ago
- Views:
Transcription

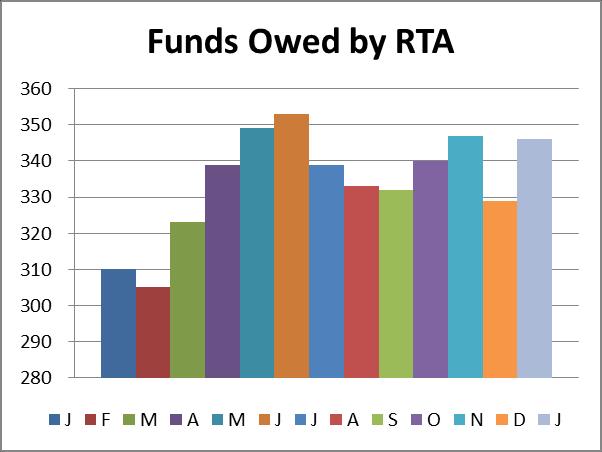
1 To: Chicago Transit Authority Board From: Jeremy Fine, Chief Financial Officer Re: Financial Results for January 2018 Date: March 14, 2018 I. Summary CTA s financial results are $1.7 million unfavorable to budget for January due a combination of lower reduced fare revenues and higher materials and fuel expenses. Ridership for the month was 36.6 million and was 0.4 million less than budget. Ridership was 0.9 million or 2.5% less than January Low gas prices, cold weather and competition from rideshare services such as Uber and Lyft contributed to the loss. II. Cash & Liquidity The chart below highlights CTA s cash position at January 2018 compared to January January January Increase (Decrease) Unrestricted Cash $ 175,822 $ 197,437 $ (21,615) Damage Reserve 79, ,371 $ (23,723) Funds Owed by RTA 346, ,025 $ 11,293 Trust Portfolio Assets 503, ,949 $ (99,906) Total Cash and Receivables $ 1,104,831 $ 1,238,782 $ (133,951) CTA s total cash/receivables balance was equal to $1.1 billion. Unrestricted cash was $21.6 million lower than the prior year due to timing of cash receipts and invoice payments. The Damage Reserve fund was $23.7 million lower than last year due to an increase in settlement payments throughout Funds owed by the RTA were approximately $346.3 million which was $11.3 million more than the prior year. CTA continues to work closely with the RTA to monitor their receivable balance owed; Trust Portfolio Assets represents bond proceeds held in Trust for funding capital projects and making required debt service payments and therefore goes down when payments are made. 1
2 III. Revenue Fare & Pass Revenue $ 45,231 $ 209 $ 2,057 $ 45,231 $ 209 $ 2,057 Fare and pass revenue for January was $0.2 million favorable to budget and $2.1 million favorable to prior year primarily due to the fare change implemented on January 7, The average fare for the month was $1.24 and was $0.02 higher than budget and $0.09 higher than the prior year. Reduced Fare Subsidy $ 1,180 $ (1,180) $ - $ 1,180 $ (1,180) $ - Reduced Fare Subsidy was less than budget by $1.2 million based on the reduction in expected reimbursements from the State. Advertising, Charter, Concession $ 3,201 $ (9) $ 385 $ 3,201 $ (9) $ 385 Advertising, Charter and Concessions Revenue was slightly lower than budget for the month. The $0.4 million increase over prior year was mainly due to higher vehicle and platform advertising revenue. Investment income $ 126 $ (7) $ (84) $ 126 $ (7) $ (84) Investment income was slightly unfavorable to budget and was approximately $0.1 million less than prior year due to lower cash balances available for investment. 2
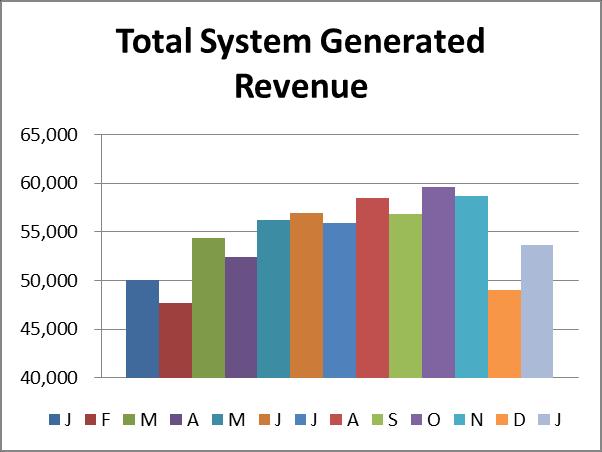
3 Other Revenue $ 3,852 $ (206) $ 1,234 $ 3,852 $ (206) $ 1,234 Other Revenue was $0.2 million unfavorable to budget primarily due to lower non-capital grant revenue. The $1.2 million increase over prior year was primarily due to the new ridehailing fee revenue from the City of Chicago. Total System Generated Revenue $ 53,590 $ (1,193) $ 3,592 $ 53,590 $ (1,193) $ 3,592 Total System-Generated Revenue was $1.2 million less than budget primarily due to lower reduced fare revenue but was higher than prior year by $3.6 million primarily due to an increase in fares and new ride hailing fee revenue. IV. Expenses Labor $ 89,645 $ 416 $ (1,763) $ 89,645 $ 416 $ (1,763) Labor expense was $0.4 million favorable to budget for the month due to managing vacant positions. Slightly higher fringe benefits in 2018 contributed to higher expenses compared to Also, January 2018 had harsher weather compared to last January, resulting in higher overtime. Material $ 8,250 $ (602) $ (836) $ 8,250 $ (602) $ (836) Material expense was $0.6 million unfavorable to budget for the month. Material expense was $0.8 million unfavorable to prior year, primarily due to higher vehicle part usage due to buses coming out of warranty and additional costs related to 2018 weather conditions. 3
4 Fuel $ 3,484 $ (560) $ (857) $ 3,484 $ (560) $ (857) Fuel for Revenue Equipment expense was $0.6 million unfavorable to budget due to the supplier fully replenishing the tanks in January, resulting in more gallons delivered than normal. This factor, plus a fuel price increase, accounts for the $0.9 million unfavorable variance to prior year. Power $ 2,844 $ 88 $ (243) $ 2,844 $ 88 $ (243) The Electric Power for Revenue Equipment expense was $0.1 million favorable to budget for the month. Expenses were $0.2 million unfavorable to prior year, primarily due to the harsher weather this January. Provision for Injuries & Damages $ - $ - $ 792 $ - $ - $ 792 The Provision for Injuries & Damages expense is budgeted quarterly in 2018 and was budgeted monthly in Purchase of Security Services $ 1,403 $ 81 $ (27) $ 1,403 $ 81 $ (27) Purchase of Security Services was $0.1 million favorable to budget for the month but slightly higher than prior year due to timing of invoices. 4
5 Other Expenses $ 25,340 $ 32 $ 674 $ 25,340 $ 32 $ 674 The favorable variance to budget and prior year was mainly due to the timing of contractual services invoices and non-capital grant expense. The other expense category includes the pension obligation bond expense, utilities, maintenance contracts, services, and other expenses. Total Operating Expenses $ 130,966 $ (545) $ (2,260) $ 130,966 $ (545) $ (2,260) Operating Expenses were $0.5 million unfavorable to budget for the month due to higher materials usage and the timing of fuel costs. The unfavorable variance to prior year was due primarily to higher labor and materials expenses. V. Recovery Ratio Recovery Ratio 49.89% (1.25) 49.89% (1.25) Recovery Ratio, which measures the percentage of operating expenses CTA funds from internally generated revenues, was 49.89% for the month. This was unfavorable to budget by 1.25 percentage points for the month but is on target to meet the RTA required recovery ratio. 5
6 VI. Ridership Bus 19, (378) 19, (378) Rail 14,187 (356) (440) 14,187 (356) (440) Rail to Rail Transfers 3,170 (115) (104) 3,170 (115) (104) Total 36,550 (425) (922) 36,550 (425) (922) Ridership for the month of January was 36.6 million and was lower than budget and prior year by 0.4 million and 0.9 million, respectively. Calendar adjusted ridership was down 4.7% from prior year due to low gas prices. More details on ridership can be found in the January Ridership Report. 6

7 Cash & Liquidity 7


8 Cash & Liquidity Cont'd Revenue 8

9 Revenue Cont d 9

10 Revenue Cont d 10

11 Expenses 11


12 Expenses Cont d 12

13 Expenses Cont d 13
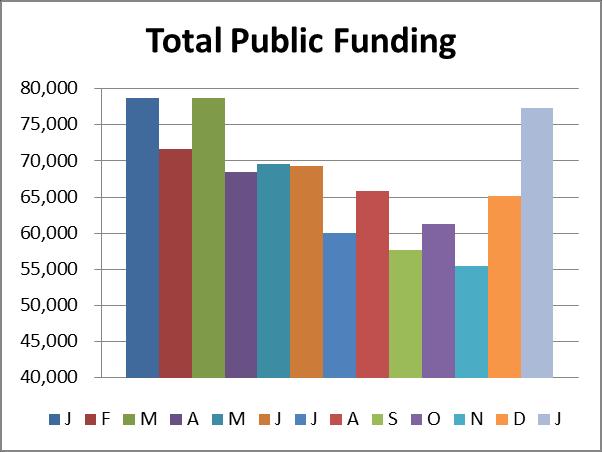
14 Cash Jan-17 Feb-17 Mar-17 Apr-17 May-17 Jun-17 Jul-17 Aug-17 Sep-17 Oct-17 Nov-17 Dec-17 Jan-18 Unrestricted Cash Damage Reserve Funds Owed by RTA Trust Portfolio Assets Revenue Jan-17 Feb-17 Mar-17 Apr-17 May-17 Jun-17 Jul-17 Aug-17 Sep-17 Oct-17 Nov-17 Dec-17 Jan-18 Fare & Pass Revenue 43,174 41,278 47,650 44,171 48,863 49,629 49,009 50,666 48,281 49,847 45,668 41,259 45,231 Reduced Fare Subsidy 1,180 1,180 1,180 1,180 1,180 1,625 1,180 1,180 1,180 1,180 1,180 1,180 1,180 Advertising, Charter, Concession 2,816 2,807 2,803 2,914 2,963 2,845 2,697 2,691 2,867 2,997 2,907 3,073 3,201 Investment Income Statutory Required Contribution ,000 3, Other Revenue 2,618 2,248 2,499 3,875 2,981 2,624 2,758 3,727 4,274 3,349 5,675 2,791 3,852 Total System Generated Revenue 49,999 47,703 54,365 52,368 56,217 56,924 55,875 58,494 56,825 59,599 58,642 49,007 53,590 Total Public Funding 78,707 71,699 78,690 68,519 69,633 69,346 60,058 65,831 57,662 61,316 55,512 65,165 77,376 Expenses Jan-17 Feb-17 Mar-17 Apr-17 May-17 Jun-17 Jul-17 Aug-17 Sep-17 Oct-17 Nov-17 Dec-17 Jan-18 Labor 87,882 82,845 94,055 82,989 88,664 89,514 83,306 91,014 82,542 88,972 83,796 84,287 89,645 Material 7,415 6,985 8,173 7,137 7,597 6,933 6,521 7,336 7,096 7,259 6,874 7,456 8,250 Fuel 2,627 2,335 2,548 2,103 2,239 2,350 2,222 2,530 2,472 2,403 2,316 2,611 3,484 Power 2,601 2,684 1,881 1,907 2,014 2,252 2,650 2,622 2,298 1,993 2,140 2,328 2,844 Provision Injuries & Damages Purchase of Security Services 1,376 1,276 1,321 1,373 1,386 1,382 1,461 1,510 1,510 1,508 1,508 1,430 1,403 Other Expenses 26,014 22,484 24,283 24,586 23,950 23,839 19,773 19,311 18,570 18,778 17,518 16,059 25,340 Total Operating Expenses 128, , , , , , , , , , , , ,966
Cash & Liquidity The chart below highlights CTA s cash position at March 2018 compared to March 2017.
 To: Chicago Transit Authority Board From: Jeremy Fine, Chief Financial Officer Re: Financial Results for March 2018 Date: May 9, 2018 I. Summary CTA s financial results are $0.9 million favorable to budget
Cash & Liquidity The chart below highlights CTA s cash position at June 2018 compared to June 2017.
 To: Chicago Transit Authority Board From: Jeremy Fine, Chief Financial Officer Re: Financial Results for June 2018 Date: August 15, 2018 I. Summary CTA s financial results are unfavorable to budget for
Cash & Liquidity The chart below highlights CTA s cash position at March 2017 compared to March 2016.
 To: Chicago Transit Authority Board From: Jeremy Fine, Chief Financial Officer Re: Financial Results for March 2017 Date: May 10, 2017 I. Summary CTA s financial results are $0.6 million favorable to budget
Cash & Liquidity The chart below highlights CTA s cash position at December 2017 compared to December 2016.
 To: Chicago Transit Authority Board From: Jeremy Fine, Chief Financial Officer Re: Financial Results for December 2017 Date: February 14, 2018 I. Summary CTA s financial results are $4.7 million favorable
Cash & Liquidity The chart below highlights CTA s cash position at September 2017 compared to September 2016.
 To: Chicago Transit Authority Board From: Jeremy Fine, Chief Financial Officer Re: Financial Results for September 2017 Date: November 15, 2017 I. Summary CTA s financial results are $7.7 million favorable
The year to date is less than budget and prior year by 15.4 million and 11.6 million, respectively.
 To: Chicago Transit Authority Board From: Jeremy Fine, Chief Financial Officer Re: Financial Results for September 2016 Date: November 16, 2016 I. Summary CTA s financial results are $0.3 million unfavorable
Cash & Liquidity The chart below highlights CTA s cash position at August 2018 compared to August 2017.
 To: Chicago Transit Authority Board From: Jeremy Fine, Chief Financial Officer Re: Financial Results for August 2018 Date: October 10, 2018 I. Summary CTA s financial results are favorable to budget for
Cash & Liquidity The chart below highlights CTA s cash position at February 2017 compared to February 2016.
 To: Chicago Transit Authority Board From: Jeremy Fine, Chief Financial Officer Re: Financial Results for February 2017 Date: April 5, 2017 I. Summary CTA s financial results are $0.3 million favorable
Cash & Liquidity The chart below highlights CTA s cash position at July 2016 compared to July 2015.
 To: Chicago Transit Authority Board From: Jeremy Fine, Chief Financial Officer Re: Financial Results for July 2016 Date: September 14, 2016 I. Summary CTA s financial results are $0.4 million favorable
Cash & Liquidity The chart below highlights CTA s cash position at February 2016 compared to February 2015.
 To: Chicago Transit Authority Board From: Jeremy Fine, Chief Financial Officer Re: Financial Results for February 2016 Date: April 6, 2016 I. Summary CTA s financial results are $2.7 million favorable
Cash & Liquidity The chart below highlights CTA s cash position at January 2016 compared to January 2015.
 To: Chicago Transit Authority Board From: Tom McKone, Acting Chief Financial Officer Re: Financial Results for January 2016 Date: March 9, 2016 I. Summary CTA s financial results are $0.8 million unfavorable
Cash & Liquidity The chart below highlights CTA s cash position at February 2015 compared to February 2014.
 To: Chicago Transit Authority Board From: Ron DeNard, Chief Financial Officer Re: Financial Results for February 2015 Date: April 15, 2015 I. Summary CTA s financial results are favorable for the month
Cash & Liquidity The chart below highlights CTA s cash position at June 2014 compared to June 2013.
 To: Chicago Transit Authority Board From: Ron DeNard, Chief Financial Officer Re: Financial Results for June 2014 Date: August 13, 2014 I. Summary CTA s financial results are $4.0 million favorable for
CTA s financial results are unfavorable by $0.5 million and $1.2 million for the month and year.
 To: Chicago Transit Authority Board From: Ron DeNard, Chief Financial Officer Re: Financial Results for May 2015 Date: July 13, 2015 I. Summary CTA s financial results are unfavorable by $0.5 million and
Cash & Liquidity The chart below highlights CTA s cash position at November 2014 compared to November 2013.
 To: Chicago Transit Authority Board From: Ronald E. DeNard, Chief Financial Officer Re: Financial Results for November 2014 Date: January 12, 2015 I. Summary CTA s financial results are $1.9 million unfavorable
Ridership for the month is 39.4 million and is on par with budget. Ridership is 1.4 million or 3.6% higher than January 2014.
 To: Chicago Transit Authority Board From: Ron DeNard, Chief Financial Officer Re: Financial Results for January 2015 Date: March 6, 2015 I. Summary CTA s financial results are $2.0 million favorable for
Cash & Liquidity The chart below highlights CTA s cash position at May 2014 compared to May 2013.
 To: Chicago Transit Authority Board From: Ron DeNard, Chief Financial Officer Re: Financial Results for May 2014 Date: July 16, 2014 I. Summary CTA s financial results are $5.6 million favorable for May
Cash & Liquidity The chart below highlights CTA s cash position at July 2015 compared to July 2014.
 To: Chicago Transit Authority Board From: Tom McKone, Acting CFO Re: Financial Results for July 2015 Date: September 4, 2015 I. Summary CTA s financial results are favorable by $1.9 million for the month
Financial Report - FY 2017 Year to Date May 31, 2017
 Financial Report - FY 2017 Year to Date July 19, 2017 1 Major Highlights Revenue Sales tax remittances received through YTD April 2017 are 4.2% higher than YTD April 2016 Plaza Saltillo lease income budgeted
Operating Budget Stability
 Operating Budget Stability March Financial Update Report to Agenda Executive Summary March Performance Against FY16 Budget March Performance Against Same Period Last Year Appendix Financial Detail: March
METRO. Monthly Board Report. June 2006
 METRO Monthly Board Report Operating Capital Service Performance June 26 7/17/26 June 26 MONTHLY BOARD REPORT INDEX Section A Section B Section C Section D Section E Section F Section G Operating Budget
METRO. Fiscal Year 2012 Monthly Board Report. September 2012 (Fourth Quarter Fiscal Year-to-Date)
") METRO Fiscal Year 2012 Monthly Board Report Revenue Expense Ridership Performance (Fourth Quarter Fiscal Year-to-Date) This report is based on a preliminary closing of the year-end financials for FY2012
METRO Fiscal Year 2012 Monthly Board Report Revenue Expense Ridership Performance (Fourth Quarter Fiscal Year-to-Date) This report is based on a preliminary closing of the year-end financials for FY2012
Budget Process Overview and Cost Allocation Methodology
 Budget Process Overview and Cost Allocation Methodology 1 Cost Allocation Agreement Guiding Principles Operate a consolidated regional public transportation system within and between the Participating
METRO MONTHLY BOARD REPORT
 METRO Revenue Expenses Service Performance Fiscal Year FY2011 Table of Contents Section A Section B Section C Section D Section E Section F Section G Section H Summary Sales Tax Revenue Fare Revenue Operating
METRO. Fiscal Year 2013 Monthly Board Report. December 2012 (First Quarter Fiscal Year-to-Date)
") METRO Fiscal Year 2013 Monthly Board Report Revenue Expense Ridership Performance (First Quarter Fiscal Year-to-Date) 1/14/2013 Table of Contents Section A Section B Section C Section D Section E Section
METRO Fiscal Year 2013 Monthly Board Report Revenue Expense Ridership Performance (First Quarter Fiscal Year-to-Date) 1/14/2013 Table of Contents Section A Section B Section C Section D Section E Section
METRO. Fiscal Year 2012 Monthly Board Report. December 2011 (First Quarter Fiscal Year-to-Date)
") METRO Fiscal Year 2012 Monthly Board Report Revenue Expense Ridership Performance (First Quarter Fiscal Year-to-Date) 1/27/2012 Table of Contents Section A Section B Section C Section D Section E Section
METRO Fiscal Year 2012 Monthly Board Report Revenue Expense Ridership Performance (First Quarter Fiscal Year-to-Date) 1/27/2012 Table of Contents Section A Section B Section C Section D Section E Section
FY2014 Operating Budget Performance Report
 Finance & Administration Committee Information Item IV-C September 11, 2014 FY2014 Operating Budget Performance Report Washington Metropolitan Area Transit Authority Board Action/Information Summary Action
BUDGETWATCH October 2018 Flash Report
 October 2018 Flash Report Overall Latest Condition (reporting on operations through September and subsidies through October): Passenger Revenues were slightly below the Forecast in September, marginally
WESTWOOD LUTHERAN CHURCH Summary Financial Statement YEAR TO DATE - February 28, Over(Under) Budget WECC Fund Actual Budget
 Budget WECC Fund Actual Budget") WESTWOOD LUTHERAN CHURCH Summary Financial Statement YEAR TO DATE - February 28, 2018 General Fund Actual A B C D E F WECC Fund Actual Revenue Revenue - Faith Giving 1 $ 213 $ 234 $ (22) - Tuition $ 226
WESTWOOD LUTHERAN CHURCH Summary Financial Statement YEAR TO DATE - February 28, 2018 General Fund Actual A B C D E F WECC Fund Actual Revenue Revenue - Faith Giving 1 $ 213 $ 234 $ (22) - Tuition $ 226
METRO. Fiscal Year 2013 Monthly Board Report. November 2012
 METRO Fiscal Year 2013 Monthly Board Report Revenue Expense Ridership Performance 12/13/2012 Table of Contents Section A Section B Section C Section D Section E Section F Section G Section H Section I
XML Publisher Balance Sheet Vision Operations (USA) Feb-02
 Feb-02") Page:1 Apr-01 May-01 Jun-01 Jul-01 ASSETS Current Assets Cash and Short Term Investments 15,862,304 51,998,607 9,198,226 Accounts Receivable - Net of Allowance 2,560,786
Page:1 Apr-01 May-01 Jun-01 Jul-01 ASSETS Current Assets Cash and Short Term Investments 15,862,304 51,998,607 9,198,226 Accounts Receivable - Net of Allowance 2,560,786
METRO. Fiscal Year 2013 Monthly Board Report. January 2013
 METRO Fiscal Year 2013 Monthly Board Report Revenue Expense Ridership Performance 2/14/2013 Table of Contents Section A Section B Section C Section D Section E Section F Section G Section H Section I Section
BUDGETWATCH September 2018 Flash Report
 September 2018 Flash Report (Forecast figures in this report refer to the 2018 Forecast) Overall Latest Condition (reporting on operations through August and subsidies through September): For reporting
Operating Budget. Third Quarter Financial Report (July 2005 March 2006)
") Third Quarter Financial Report (July 2005 March 2006) INDEX A. Executive Summary...page 2 B. Revenue and Expense Analysis...page 3 C. Budget Variance Reports...page 14 D. Ridership and Performance Measures...page
Third Quarter Financial Report (July 2005 March 2006) INDEX A. Executive Summary...page 2 B. Revenue and Expense Analysis...page 3 C. Budget Variance Reports...page 14 D. Ridership and Performance Measures...page
METRO. Fiscal Year 2014 Monthly Board Report. May 2014
 METRO Fiscal Year 2014 Monthly Board Report Revenue Expense Ridership Performance 7/11/2014 Table of Contents Section A Section B Section C Section D Section E Section F Section G Section H Section I Section
Big Walnut Local School District
 Big Walnut Local School District Monthly Financial Report for the month ended September 30, 2013 Prepared By: Felicia Drummey Treasurer BIG WALNUT LOCAL SCHOOL DISTRICT SUMMARY OF YEAR TO DATE FINANCIAL
Spheria Australian Smaller Companies Fund
 29-Jun-18 $ 2.7686 $ 2.7603 $ 2.7520 28-Jun-18 $ 2.7764 $ 2.7681 $ 2.7598 27-Jun-18 $ 2.7804 $ 2.7721 $ 2.7638 26-Jun-18 $ 2.7857 $ 2.7774 $ 2.7690 25-Jun-18 $ 2.7931 $ 2.7848 $ 2.7764 22-Jun-18 $ 2.7771
Big Walnut Local School District
 Big Walnut Local School District Monthly Financial Report for the month ended September 30, 2012 Prepared By: Felicia Drummey Treasurer BIG WALNUT LOCAL SCHOOL DISTRICT SUMMARY OF YEAR-TO-DATE FINANCIAL
Operating Budget. Second Quarter Financial Report
 Second Quarter Financial Report INDEX A. Executive Summary... A-1 B. Revenue and Expense Analysis... B-1 C. Budget Variance Reports... C-1 D. Ridership and Performance Measures... D-1 Board Budget Committee
Financial Management Report... 3
 November 13, 2013 Table of Contents Financial Management Report... 3 OPERATING FUNDS STATEMENT OF REVENUES & EXPENSES... 3 METROPOLITAN COUNCIL INVESTMENT PERFORMANCE SHORT-TERM PORTFOLIO... 4 METROPOLITAN
BUDGETWATCH April 2015 Flash Report
 BUDGETWATCH April 2015 Flash Report Summary of March Budgetwatch (reporting on operations through February and subsidies through March): Overall, results through March were favorable mainly as a result
METRO. Fiscal Year 2015 Monthly Board Report. February 2015
 METRO Fiscal Year 2015 Monthly Board Report Revenue Expense Ridership Performance 4/2/2015 Table of Contents Section A Section B Section C Section D Section E Section F Section G Section H Section I Section
MONTHLY FINANCIAL STATUS OCTOBER 2018
 (Millions) MONTHLY FINANCIAL STATUS To: Dave Genova, General Manager and CEO ACTION DISCUSSION INFO From: Heather McKillop, CFO and AGM Administration x Date: December 11, VS. BUDGET YTD VS. BUDGET OCTOBER
Cost Estimation of a Manufacturing Company
 Cost Estimation of a Manufacturing Company Name: Business: Date: Economics of One Unit: Manufacturing Company (Only complete if you are making a product, such as a bracelet or beauty product) Economics
February 2016 Financial Report
 2016 February 2016 Financial Report Capital Metropolitan Transportation Authority 4/13/2016 Table of Contents SUMMARY REPORT Budgetary Performance - Revenue 2 - Sales Tax Revenue 5 - Operating Expenses
2019 Tax Budget Office of Management & Budget July 17, Greater Cleveland Regional Transit Authority
 Greater Cleveland Regional Transit Authority 2019 Tax Budget Office of Management & Budget July 17, 2018 Operating Budget Calendar o May o Jun o Jul Prepare 5 Yr. Financial Forecast Finalize 5 Yr Financial
MONTHLY FINANCIAL STATUS JUNE 2018
 (Millions) MONTHLY FINANCIAL STATUS To: Dave Genova, General Manager and CEO ACTION DISCUSSION INFO From: Heather McKillop, CFO and AGM Administration x Date: July 10, VS. BUDGET YTD VS. BUDGET JUNE VS.
Review of Registered Charites Compliance Rates with Annual Reporting Requirements 2016
 Review of Registered Charites Compliance Rates with Annual Reporting Requirements 2016 October 2017 The Charities Regulator, in accordance with the provisions of section 14 of the Charities Act 2009, carried
Management Reports. June for PREPARED BY POWERED BY
 Management Reports for June 217 PREPARED BY POWERED BY Contents 1. Management Reports Cashflow Forecast Actual vs Budget P&L Forecast Where Did Our Money Go? Net Worth 2. Understanding your Reports 3.
MONTHLY FINANCIAL STATUS JANUARY 2019
 (Millions) MONTHLY FINANCIAL STATUS To: Dave Genova, General Manager and CEO ACTION DISCUSSION INFO From: Heather McKillop, CFO and AGM Administration x Date: March 12, 2019 VS. BUDGET YTD 2019 VS. BUDGET
HART Financial Snapshot. HART Finance and Audit Committee January 23, 2017
 HART Financial Snapshot HART Finance and Audit Committee January 23, 2017 1 Requested January 3, 2017 Cash flow management overview Fund balance update including year end fund balance reported in the past
MONTHLY FINANCIAL STATUS AUGUST 2018
 (Millions) MONTHLY FINANCIAL STATUS To: Dave Genova, General Manager and CEO ACTION DISCUSSION INFO From: Heather McKillop, CFO and AGM Administration x Date: October 9, VS. BUDGET YTD VS. BUDGET AUGUST
METRO. Fiscal Year Monthly Performance Report. Revenue Expense Ridership Performance. November 2018 (Third Quarter Fiscal Year-to Date)
") METRO Fiscal Year 2019 Monthly Performance Report Revenue Expense Ridership Performance (Third Quarter Fiscal Year-to Date) 12/12/2018 Table of Contents Section A Section B Section C Section D Section
METRO Fiscal Year 2019 Monthly Performance Report Revenue Expense Ridership Performance (Third Quarter Fiscal Year-to Date) 12/12/2018 Table of Contents Section A Section B Section C Section D Section
Executive Summary. July 17, 2015
 Executive Summary July 17, 2015 The Revenue Estimating Conference adopted interest rates for use in the state budgeting process. The adopted interest rates take into consideration current benchmark rates
BUDGETWATCH September 2014 Flash Report
 BUDGETWATCH September 2014 Flash Report (Forecast figures in this report, except the Summary of June Budgetwatch, refer to the 2014 Forecast) Summary of June Budgetwatch (reporting on operations through
QUESTION 2. QUESTION 3 Which one of the following is most indicative of a flexible short-term financial policy?
 QUESTION 1 Compute the cash cycle based on the following information: Average Collection Period = 47 Accounts Payable Period = 40 Average Age of Inventory = 55 QUESTION 2 Jan 41,700 July 39,182 Feb 18,921
MONTHLY FINANCIAL STATUS MAY 2018
 (Millions) MONTHLY FINANCIAL STATUS To: Dave Genova, General Manager and CEO ACTION DISCUSSION INFO From: Heather McKillop, CFO and AGM Administration x Date: July 10, VS. BUDGET YTD VS. BUDGET MAY VS.
BUDGETWATCH March 2016 Flash Report
 March 2016 Flash Report Summary of February Budgetwatch (reporting on operations through January and subsidies through February): Overall results through February were slightly favorable. Net operating
MONTHLY FINANCIAL STATUS APRIL 2018
 (Millions) MONTHLY FINANCIAL STATUS To: Dave Genova, General Manager and CEO ACTION DISCUSSION INFO From: Heather McKillop, CFO and AGM Administration x Date: June 19, VS. BUDGET YTD VS. BUDGET APRIL VS.
METRO. Fiscal Year Monthly Performance Report. Revenue Expense Ridership Performance. February 2018 (First Quarter Fiscal Year-to Date)
") METRO Fiscal Year 2018 Monthly Performance Report Revenue Expense Ridership Performance (First Quarter Fiscal Year-to Date) 3/12/2018 Table of Contents Section A Section B Section C Section D Section E
METRO Fiscal Year 2018 Monthly Performance Report Revenue Expense Ridership Performance (First Quarter Fiscal Year-to Date) 3/12/2018 Table of Contents Section A Section B Section C Section D Section E
BUDGETWATCH May 2018 Flash Report
 May 2018 Flash Report Overall Latest Condition (reporting on operations through April and subsidies through May): Passenger revenues were $15.1 million unfavorable in April, increasing the unfavorable
Financial & Business Highlights For the Year Ended June 30, 2017
 Financial & Business Highlights For the Year Ended June, 17 17 16 15 14 13 12 Profit and Loss Account Operating Revenue 858 590 648 415 172 174 Investment gains net 5 162 909 825 322 516 Other 262 146
PRESS RELEASE. Securities issued by Hungarian residents and breakdown by holding sectors. October 2018
 PRESS RELEASE 10 December 2018 Securities issued by Hungarian residents and breakdown by holding sectors October 2018 According to securities statistics, the amount outstanding of equity securities and
Accountant s Compilation Report
 Tel: 817-738-2400 Fax: 817-738-1995 www.bdo.com 6050 Southwest Blvd, Suite 300 Fort Worth, TX 76109 Accountant s Compilation Report Joseph Portugal Town Administrator Town of Westover Hills, Texas Management
Capital Metropolitan Transportation Authority Monthly Financial Report For Period Ending November 30, 2013
 Capital Metropolitan Transportation Authority Monthly Financial Report For Period Ending November 30, 2013 Table of Contents SUMMARY REPORT Financial Performance -Sales Tax Revenue 3 -Other Revenue 4 -Operating
Business & Financial Services December 2017
 Business & Financial Services December 217 Completed Procurement Transactions by Month 2 4 175 15 125 1 75 5 2 1 Business Days to Complete 25 Jan Feb Mar Apr May Jun Jul Aug Sep Oct Nov Dec 217 Procurement
BUDGETWATCH March 2018 Flash Report
 March 2018 Flash Report Overall Latest Condition (reporting on operations through February and subsidies through March): Passenger revenues were $6 million unfavorable in February, increasing the unfavorable
BUDGETWATCH March 2019 Flash Report
 March 2019 Flash Report Overall Latest Condition (reporting on operations through February and subsidies through March): Overall, YTD preliminary net results were favorable mainly reflecting lower operating
REVENUE & RIDERSHIP REPORT OCTOBER 2017
 REVENUE & RIDERSHIP REPORT OCTOBER 2017 Monthly passenger revenue 3.5% above last year and 1.4% below budget Monthly ridership 3.4% below budget and 6.3% below last year Year-to-date revenue 3.5% and ridership
Jul Aug Sept Oct Nov Dec Jan Feb Mar Apr May Jun
 REVENUE AND RIDERSHIP 4th Quarter FY2014 REVENUE (in Millions) $90M $85M $80M $75M $70M $65M $60M $55M $50M 79 77 74 74 72 70 FY2013 Actual FY2014 Budget FY2014 Actual 79 85 78 78 77 67 66 70 59 67 65
METRO. Fiscal Year 2017 Monthly Performance Report. Revenue Expense Ridership Performance. October 2016
 METRO Fiscal Year 2017 Monthly Performance Report Revenue Expense Ridership Performance 11/18/2016 Table of Contents Section A Section B Section C Section D Section E Section F Section G Section H Section
TERMS OF REFERENCE FOR THE INVESTMENT COMMITTEE
 I. PURPOSE The purpose of the Investment Committee (the Committee ) is to recommend to the Board the investment policy, including the asset mix policy and the appropriate benchmark for both ICBC and any
FUEL PRICE RISK MANAGEMENT POLICY REPORT "FUEL HEDGE"
 FUEL PRICE RISK MANAGEMENT POLICY REPORT "FUEL HEDGE" Sep-18 FUEL PRICE RISK MANAGEMENT POLICY REPORT Sep-18 (Office of Management and Budget 09/30/2018) The Fuel Price Risk Management Policy approved
FUEL PRICE RISK MANAGEMENT POLICY REPORT "FUEL HEDGE"
 FUEL PRICE RISK MANAGEMENT POLICY REPORT "FUEL HEDGE" December 2018 FUEL PRICE RISK MANAGEMENT POLICY REPORT December 2018 The Fuel Price Risk Management Policy approved by the Board on February 16, 2006
Capital Metropolitan Transportation Authority Monthly Performance & Financial Report For Period Ending October 31, 2012 Soft Close
 Capital Metropolitan Transportation Authority Monthly Performance & Financial Report For Period Ending October 31, 2012 Soft Close Table of Contents SUMMARY REPORT Financial Performance -Sales Tax 3 -Other
VIIl. Agency Financial Plans and 12-Month Allocations
 VIIl. Agency Financial Plans and 12-Month Allocations New York City Transit MTA NEW YORK CITY TRANSIT FEBRUARY FINANCIAL PLAN FOR 2006-2009 2005 FINAL ESTIMATE AND ADOPTED BUDGET FOR 2006 In accordance
BUDGETWATCH May 2017 Flash Report
 May 2017 Flash Report Summary of April Budgetwatch (reporting on operations through March and subsidies through April): Overall, results were favorable for the month, and remained favorable YTD. Passenger
August 31, 2016 Financial Report
 August 31, 2016 Financial Report Capital Metropolitan Transportation Authority 10/14/2016 Table of Contents SUMMARY REPORTS Budgetary Performance - Revenue 2 - Sales Tax Revenue 6 - Operating Expenses
Board of Directors October 2018 and YTD Financial Report
 Board of Directors October 2018 and YTD Financial Report Consolidated Financial Results Operating Margin October ($30,262) $129,301 ($159,563) Year-to-date $292,283 $931,358 ($639,076) Excess of Revenue
PRESS RELEASE. Securities issued by Hungarian residents and breakdown by holding sectors. January 2019
 7 March 2019 PRESS RELEASE Securities issued by Hungarian residents and breakdown by holding sectors January 2019 According to securities statistics, the amount outstanding of equity securities and debt
PRESS RELEASE. Securities issued by Hungarian residents and breakdown by holding sectors. April 2016
 10 June 2016 PRESS RELEASE Securities issued by Hungarian residents and breakdown by holding sectors April 2016 According to securities statistics data, the amount outstanding of equity securities and
GENERAL FUND AT A GLANCE Category Budget YTD Actual % % Year Passed Resources 8.33% Uses 8.33% $0 $1,330,750
 City of Edmond Monthly Financial Report FY 2008/2009 Through the Month Ended Unaudited - Intended for Management Purposes Only The following is a summary of the City's financial results for operating funds.
April 30, 2016 Financial Report
 2016 April 30, 2016 Financial Report Capital Metropolitan Transportation Authority 6/15/2016 Table of Contents SUMMARY REPORT Budgetary Performance - Revenue 2 - Sales Tax Revenue 6 - Operating Expenses
PHOENIX ENERGY MARKETING CONSULTANTS INC. HISTORICAL NATURAL GAS & CRUDE OIL PRICES UPDATED TO July, 2018
 Jan-01 $12.9112 $10.4754 $9.7870 $1.5032 $29.2595 $275.39 $43.78 $159.32 $25.33 Feb-01 $10.4670 $7.8378 $6.9397 $1.5218 $29.6447 $279.78 $44.48 $165.68 $26.34 Mar-01 $7.6303 $7.3271 $5.0903 $1.5585 $27.2714
MEMORANDUM TO: FROM: Kathy Fisher, Budget Manager ( ) SUBJECT: Budget Variance Report 1 st Quarter DATE: April 20, 2017
 SUBJECT: Budget Variance Report 1 st Quarter DATE: April 20, 2017") MEMORANDUM F&A 5/1/ Page 1 of 6 TO: Finance and Administration Committee FROM: Kathy Fisher, Budget Manager (612-726-8158) SUBJECT: Budget Variance Report 1 st Quarter DATE: April 20, The 1 st Quarter
MEMORANDUM F&A 5/1/ Page 1 of 6 TO: Finance and Administration Committee FROM: Kathy Fisher, Budget Manager (612-726-8158) SUBJECT: Budget Variance Report 1 st Quarter DATE: April 20, The 1 st Quarter
Common stock prices 1. New York Stock Exchange indexes (Dec. 31,1965=50)2. Transportation. Utility 3. Finance
2. Transportation. Utility 3. Finance") Digitized for FRASER http://fraser.stlouisfed.org/ Federal Reserve Bank of St. Louis 000 97 98 99 I90 9 9 9 9 9 9 97 98 99 970 97 97 ""..".'..'.."... 97 97 97 97 977 978 979 980 98 98 98 98 98 98 987 988
Digitized for FRASER http://fraser.stlouisfed.org/ Federal Reserve Bank of St. Louis 000 97 98 99 I90 9 9 9 9 9 9 97 98 99 970 97 97 ""..".'..'.."... 97 97 97 97 977 978 979 980 98 98 98 98 98 98 987 988
Factor Leave Accruals. Accruing Vacation and Sick Leave
 Factor Leave Accruals Accruing Vacation and Sick Leave Factor Leave Accruals As part of the transition of non-exempt employees to biweekly pay, the UC Office of the President also requires standardization
BUDGETWATCH January 2015 Special 2014 Year-End Flash
 BUDGETWATCH January 2015 Special 2014 Year-End Flash Overall: January Budgetwatch is a flash look focusing on some very preliminary 2014 actual revenue results compared with the Final Estimate that was
QUARTERLY FINANCIAL REPORT June 30, 2017
 California Independent System Operator QUARTERLY FINANCIAL REPORT June 30, 2017 250 Outcropping Way Folsom, CA 95630 (916) 351-4000 CALIFORNIA INDEPENDENT SYSTEM OPERATOR CORPORATION QUARTERLY FINANCIAL
Water Operations Current Month - November 2018
 November 2018 Water Operations Current Month - November 2018 $8.0 Net Operating Revenue (Net of Bad Debt) $8.1 $8.6 $8.0 2.0 1.5 Volumes Billions of Gallons Sold 1.8 1.7 1.6 $6.0 1.0 $4.0 $2.0 0.5 Actual
CONTENTS COMMENTARY CHARTS TABLES GLOSSARY. Section 1: Headline Inflation Section 2: Core Inflation
 COMMENTARY CONTENTS Section 1: Headline Inflation Section 2: Core Inflation CHARTS 1. National Rates of Inflation, January 2010 April 2013 2. Monthly Changes in the Cost-of-Living Index, January 2010 April
Fiscal Year 2018 Project 1 Annual Budget
 Fiscal Year 2018 Project 1 Annual Budget Table of Contents Table Page Summary 3 Summary of Costs Table 1 4 Treasury Related Expenses Table 2 5 Summary of Full Time Equivalent Table 3 6 Positions Cost-to-Cash
Economic Activity Index ( GDB-EAI ) For the month of May 2013 G O V E R N M E N T D E V E L O P M E N T B A N K F O R P U E R T O R I C O
 For the month of May 2013 G O V E R N M E N T D E V E L O P M E N T B A N K F O R P U E R T O R I C O") Economic Activity Index ( GDB-EAI ) For the month of May 2013 General Commentary May 2013 GDB-EAI for the month of May registered a 3.4% year-over-year ( YOY ) reduction May 2013 EAI was 126.7, a 3.4%
Economic Activity Index ( GDB-EAI ) For the month of May 2013 General Commentary May 2013 GDB-EAI for the month of May registered a 3.4% year-over-year ( YOY ) reduction May 2013 EAI was 126.7, a 3.4%
OTHER DEPOSITS FINANCIAL INSTITUTIONS DEPOSIT BARKAT SAVING ACCOUNT
 WEIGHTAGES JAN FEB MAR APR MAY JUN JUL AUG SEPT OCT NOV DEC ANNOUNCEMENT DATE 19.Dez.14 27.Jän.15 24.Feb.15 26.Mär.15 27.Apr.15 26.Mai.15 25.Jun.15 28.Jul.15 26.Aug.15 23.Sep.15 27.Okt.15 25.Nov.15 MUDARIB
HUD NSP-1 Reporting Apr 2010 Grantee Report - New Mexico State Program
 HUD NSP-1 Reporting Apr 2010 Grantee Report - State Program State Program NSP-1 Grant Amount is $19,600,000 $9,355,381 (47.7%) has been committed $4,010,874 (20.5%) has been expended Grant Number HUD Region
Budget Manager Meeting. February 20, 2018
 Budget Manager Meeting February 20, 2018 Meeting Agenda DISCUSSION DRAFT NOT FOR DISTRIBUTION Budget Office Current Year Forecast Process Endowment Payout Control Charts FY19 Target Meetings Delphi Project
General Fund Revenue
 Millions Percent of Kathy Steinert, Director of Fiscal Services Phone: 541.923.8927 145 SE Salmon Ave Redmond, OR 97756 kathy.steinert@redmond.k12.or.us Date: May 23, 2014 To: Redmond School District Board
MIAMI PARKING AUTHORITY
 Revenue & Expenses Summary For the Five Months Ending February 28, 2019 Page 1 Adopted FY 2018 Actual Actual Actual Budget Actual Versus FY 2018 Versus 2019 Budget Year-To-Date $ $ $ $ % $ % Operating
Unrestricted Cash / Board Designated Cash & Investments December 2014
 Unrestricted Cash / Board Designated Cash & Investments December 2014 25.0 20.0 21.0 20.8 18.9 19.9 15.0 10.0 11.5 12.8 11.6 9.1 10.4 9.8 11.1 10.2 9.8 17.0 16.8 15.4 14.7 14.2 14.1 13.6 13.0 12.0 10.2
Performance Report October 2018
 Structured Investments Indicative Report October 2018 This report illustrates the indicative performance of all Structured Investment Strategies from inception to 31 October 2018 Matured Investment Strategies