The year to date is less than budget and prior year by 15.4 million and 11.6 million, respectively.
|
|
|
- Natalie Adams
- 6 years ago
- Views:
Transcription

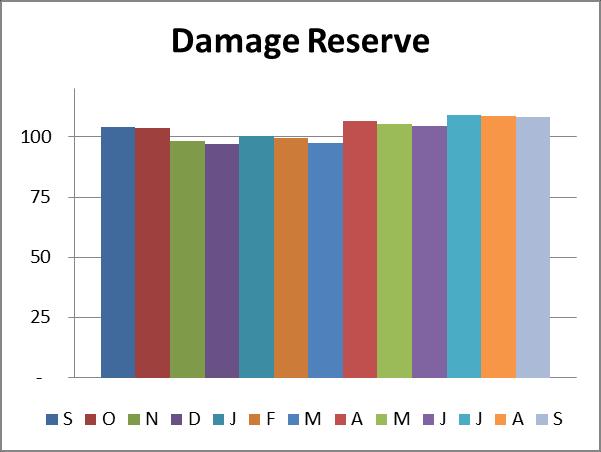
1 To: Chicago Transit Authority Board From: Jeremy Fine, Chief Financial Officer Re: Financial Results for September 2016 Date: November 16, 2016 I. Summary CTA s financial results are $0.3 million unfavorable for September primarily due to lower than anticipated fare and pass revenue. The year to date is $2.6 million favorable to budget primarily due to lower operating expenses. Ridership for the month was 43.5 million and was 2.5 million less than budget. Ridership was 2.0 million or 4.4% less than September 2015 due to low gas prices, which were down $0.35 (13%) compared to last year. Bus reroutes related to the Adams Bridge construction project and competition from rideshare services such as Uber and Lyft also pushed ridership down. The year to date is less than budget and prior year by 15.4 million and 11.6 million, respectively. II. Cash & Liquidity The chart below highlights CTA s cash position at September 2016 compared to September September September Increase (Decrease) Unrestricted Cash $ $ $ 6.9 Damage Reserve $ 4.1 Funds Owed by RTA $ 48.2 Trust Portfolio Assets $ (93.7) Total Cash and Receivables $ 1,014.2 $ 1,048.7 $ (34.5) CTA s total cash/receivables balance was equal to $1.0 billion. Unrestricted cash was $6.9 million more than the prior year due to timing of cash receipts and invoice payments. The Damage Reserve is sufficiently funded and was $4.1 million higher than last year due to a transfer based on budgeted levels. Funds owed by the RTA were approximately $323.1 million which was $48.2 million more than the prior year. CTA continues to work closely with the RTA to monitor their receivable balance owed; Trust Portfolio Assets represents bond proceeds held 1
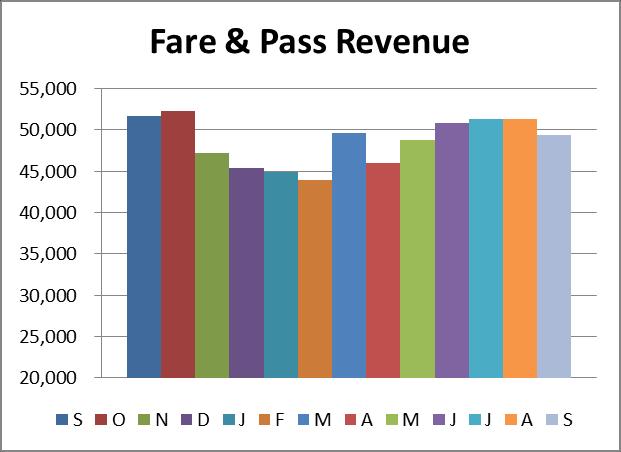
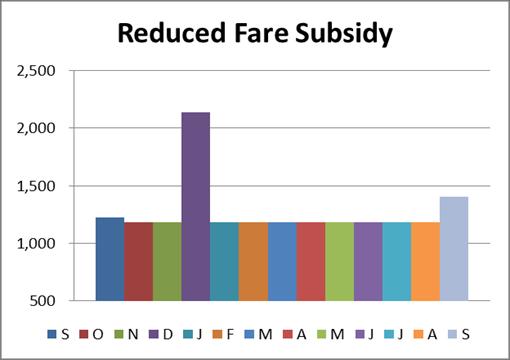
2 in Trust for funding capital projects and making required debt service payments and therefore goes down when payments are made. III. Revenue Fare & Pass Revenue $ 49,431 $ (2,009) $ (2,305) $ 436,197 $ (9,277) $ (6,037) Fare and pass revenue for September was $2.0 million unfavorable to budget and $2.3 million unfavorable to prior year. Lower U-Pass and 7-Day Pass revenues contributed to the unfavorable variance to budget and prior year. The average fare for the month was $1.14 and was $0.02 higher than budget and relatively flat compared to the prior year. Year-to-date fare and pass revenue was $9.3 million lower than budget and $6.0 million lower compared to prior year. The unfavorable variance to budget and prior year is mainly due to lower than anticipated bus pay-per-use and 7-Day Pass revenues. The average fare for the year was $1.16 per ride and was $0.02 more than budget. Reduced Fare Subsidy $ 1,404 $ (956) $ 180 $ 10,845 $ (10,397) $ 1,180 Reduced Fare Subsidy was less than budget for the month and year-to-date by $1.0 million and $10.4 million based on expected reimbursements from the State. Advertising, Charter, Concession $ 2,686 $ 13 $ (40) $ 24,198 $ 680 $ 2,019 Advertising, Charter and Concessions Revenue was slightly higher than budget for the month due to higher concessions revenue and was $0.7 million more than budget year-todate due to higher vehicle and platform advertising and concessions revenue. The increase over prior year-to-date was also mainly due to higher vehicle and platform advertising. 2
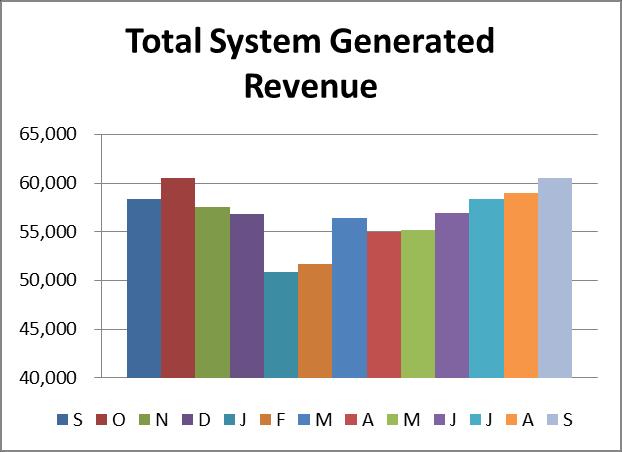
3 Investment income $ 165 $ 91 $ 32 $ 1,385 $ 723 $ 208 Investment income was higher than budget for the month primarily due to a higher yielding portfolio and a better investment strategy through security selection. The year-to-date was favorable to budget due to higher short-term market rates. Other Revenue $ 6,873 $ 4,111 $ 4,339 $ 31,308 $ 11,124 $ 6,610 Other Revenue was favorable to prior year and budget due to higher non-capital grant revenue. The year to date was favorable to budget and prior year primarily due to higher non-capital grant revenue and the sale of surplus property. Total System Generated Revenue $ 60,559 $ 1,250 $ 2,206 $ 503,933 $ (7,147) $ 3,979 Total System-Generated Revenue was $1.3 million more than budget due to higher noncapital grant revenue. The year-to-date was $7.1 million less than budget due to lower reduced fare subsidy and fare and pass revenue. It was $2.2 million more than September 2015 due to higher non-capital grant revenue. The year-to-date system-generated revenue was $4.0 million more than prior year due to higher advertising and non-capital grant revenue in addition to the sale of surplus property. IV. Expenses Labor $ 85,558 $ (295) $ (1,645) $ 769,546 $ (397) $ (29,063) Labor expense was $0.3 million unfavorable to budget for the month due to higher overtime than anticipated. Contractual wage increases that took effect in July 2015 and slightly higher fringe benefits in 2016 contributed to higher expenses compared to prior 2015 year-to-date. 3
4 Material $ 7,248 $ (305) $ 206 $ 62,785 $ 135 $ 1 Material expense was unfavorable to budget for the month, primarily due to slightly higher spending on vehicle parts. The year to date was $0.1 million favorable to budget due to lower spending on rail vehicle parts that were covered by warranties. Fuel $ 2,726 $ 465 $ 1,408 $ 24,480 $ 3,316 $ 13,529 Fuel for Revenue Equipment expense was $0.5 million favorable to budget in September, primarily due to lower consumption and prices. Fuel expense was $1.4 million and $13.5 million favorable compared to prior September and to 2015 year-to-date, respectively, mainly due to a significant reduction in the price of diesel fuel, lower usage and an increase in fuel efficiency. Power $ 2,347 $ 16 $ 188 $ 21,914 $ 1,840 $ 161 The Electric Power for Revenue Equipment expense was relatively flat compared to budget for the month. Year-to-date, expenses were $1.8 million under budget, primarily due to favorable prices. Provision for Injuries & Damages $ 3,375 $ (1,000) $ (3,375) $ 8,125 $ (1,000) $ (8,125) The Provision for Injuries & Damages expense was $8.1 million higher than 2015 year-todate due to timing. 4
5 Purchase of Security Services $ 1,211 $ 13 $ (11) $ 10,472 $ 551 $ 270 Purchase of Security Services was slightly favorable to budget for the month and favorable year to date by $0.6 million due to timing of invoices. Other Expenses $ 24,060 $ (485) $ (3,533) $ 201,330 $ 5,284 $ (4,408) Other Expenses were unfavorable to budget by $0.5 million due to higher non-capital grant expense and the timing of contractual expenses. The unfavorable variance to prior year was mainly due to new debt service and timing of invoices. Of the total monthly other expenses, the pension obligation bond expense is $9 million; the remaining expenses are for utilities, maintenance contracts, services, and other expenses. Total Operating Expenses $ 126,525 $ (1,589) $ (6,762) $ 1,098,652 $ 9,730 $ (27,636) Operating Expenses were $1.6 million unfavorable to budget for the month due to higher non-capital grant expense and higher than planned provision for injuries and damages. The unfavorable variance to prior year-to-date was due primarily to higher labor expense. V. Recovery Ratio Recovery Ratio 56.81% % (0.18) Recovery Ratio, which measures the percentage of operating expenses CTA funds from internally generated revenues, was 56.81% for the month. For the year-to-date the recovery ratio is 54.85% and 0.35 percentage points higher than the required recovery ratio. 5
6 VI. Ridership Bus 22,703 (1,361) (1,184) 195,680 (11,263) (10,562) Rail 17,097 (974) (676) 147,348 (3,449) (850) Rail to Rail Transfers 3,703 (198) (150) 32,633 (721) (209) Total 43,502 (2,533) (2,010) 375,662 (15,433) (11,621) Ridership for the month of September was 43.5 million and was lower than budget and prior year by 2.5 million and 2.0 million, respectively. Calendar adjusted ridership was down 4.5% from prior year due to low gas prices. Ridership was 2.0 million or 4.4% less than September 2015 due to low gas prices, which were down $0.35 (13%) compared to last year. Bus reroutes related to the Adams Bridge construction project and competition from rideshare services such as Uber and Lyft also pushed ridership down. More details on ridership can be found in the September Ridership Report. 6
7 Cash 7

8 Cash Cont d Revenue 8

9 Revenue Cont d 9

10 Revenue Cont d 10
11 Expenses 11

12 Expenses Cont d 12

13 Expenses Cont d 13
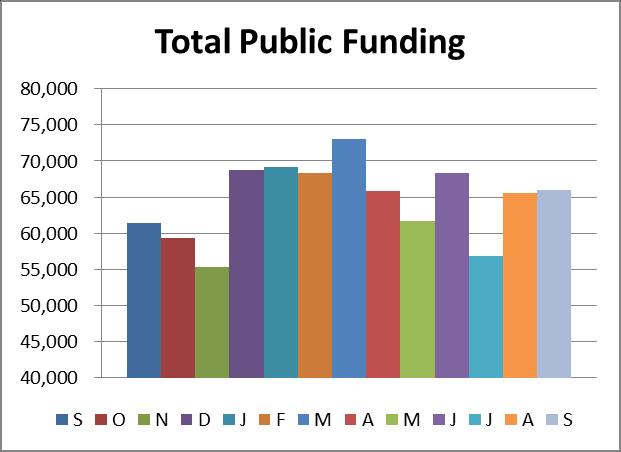
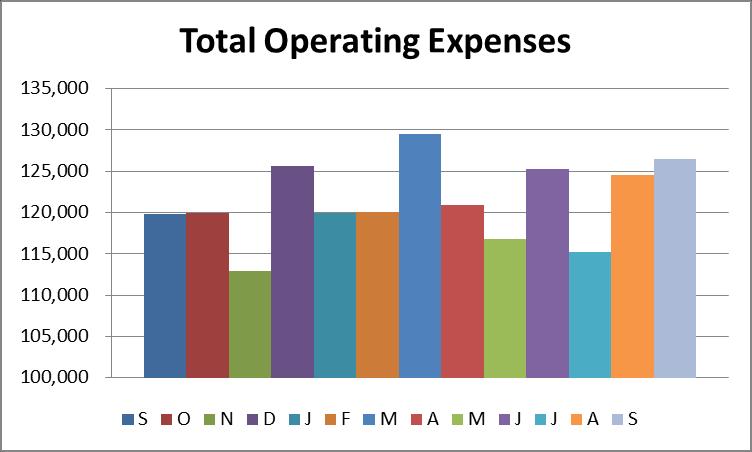
14 Cash Sep-15 Oct-15 Nov-15 Dec-15 Jan-16 Feb-16 Mar-16 Apr-16 May-16 Jun-16 Jul-16 Aug-16 Sep-16 Unrestricted Cash Damage Reserve Funds Owed by RTA Trust Portfolio Assets Revenue Sep-15 Oct-15 Nov-15 Dec-15 Jan-16 Feb-16 Mar-16 Apr-16 May-16 Jun-16 Jul-16 Aug-16 Sep-16 Fare & Pass Revenue 51, , , , , , , , , , , , ,431.0 Reduced Fare Subsidy 1, , , , , , , , , , , , ,404.0 Advertising, Charter, Concession 2, , , , , , , , , , , , ,686.0 Investment Income (222.0) Statutory Required Contribution - 2, , Other Revenue 2, , , , , , , , , , , , ,873.0 Total System Generated Revenue 58, , , , , , , , , , , , ,559.0 Total Public Funding 61, , , , , , , , , , , , ,967.0 Expenses Sep-15 Oct-15 Nov-15 Dec-15 Jan-16 Feb-16 Mar-16 Apr-16 May-16 Jun-16 Jul-16 Aug-16 Sep-16 Labor 83, , , , , , , , , , , , ,558.0 Material 7, , , , , , , , , , , , ,248.0 Fuel 4, , , , , , , , , , , , ,726.0 Power 2, , , , , , , , , , , , ,347.0 Provision Injuries & Damages , , , ,375.0 Purchase of Security Services 1, , , , , , , , , , , ,211.0 Other Expenses 20, , , , , , , , , , , , ,060.0 Total Operating Expenses 119, , , , , , , , , , , , ,525.0
Cash & Liquidity The chart below highlights CTA s cash position at September 2017 compared to September 2016.
 To: Chicago Transit Authority Board From: Jeremy Fine, Chief Financial Officer Re: Financial Results for September 2017 Date: November 15, 2017 I. Summary CTA s financial results are $7.7 million favorable
Cash & Liquidity The chart below highlights CTA s cash position at February 2017 compared to February 2016.
 To: Chicago Transit Authority Board From: Jeremy Fine, Chief Financial Officer Re: Financial Results for February 2017 Date: April 5, 2017 I. Summary CTA s financial results are $0.3 million favorable
Cash & Liquidity The chart below highlights CTA s cash position at December 2017 compared to December 2016.
 To: Chicago Transit Authority Board From: Jeremy Fine, Chief Financial Officer Re: Financial Results for December 2017 Date: February 14, 2018 I. Summary CTA s financial results are $4.7 million favorable
Cash & Liquidity The chart below highlights CTA s cash position at March 2017 compared to March 2016.
 To: Chicago Transit Authority Board From: Jeremy Fine, Chief Financial Officer Re: Financial Results for March 2017 Date: May 10, 2017 I. Summary CTA s financial results are $0.6 million favorable to budget
Cash & Liquidity The chart below highlights CTA s cash position at June 2018 compared to June 2017.
 To: Chicago Transit Authority Board From: Jeremy Fine, Chief Financial Officer Re: Financial Results for June 2018 Date: August 15, 2018 I. Summary CTA s financial results are unfavorable to budget for
Cash & Liquidity The chart below highlights CTA s cash position at March 2018 compared to March 2017.
 To: Chicago Transit Authority Board From: Jeremy Fine, Chief Financial Officer Re: Financial Results for March 2018 Date: May 9, 2018 I. Summary CTA s financial results are $0.9 million favorable to budget
Cash & Liquidity The chart below highlights CTA s cash position at January 2018 compared to January 2017.
 To: Chicago Transit Authority Board From: Jeremy Fine, Chief Financial Officer Re: Financial Results for January 2018 Date: March 14, 2018 I. Summary CTA s financial results are $1.7 million unfavorable
Cash & Liquidity The chart below highlights CTA s cash position at August 2018 compared to August 2017.
 To: Chicago Transit Authority Board From: Jeremy Fine, Chief Financial Officer Re: Financial Results for August 2018 Date: October 10, 2018 I. Summary CTA s financial results are favorable to budget for
Cash & Liquidity The chart below highlights CTA s cash position at July 2016 compared to July 2015.
 To: Chicago Transit Authority Board From: Jeremy Fine, Chief Financial Officer Re: Financial Results for July 2016 Date: September 14, 2016 I. Summary CTA s financial results are $0.4 million favorable
Cash & Liquidity The chart below highlights CTA s cash position at February 2016 compared to February 2015.
 To: Chicago Transit Authority Board From: Jeremy Fine, Chief Financial Officer Re: Financial Results for February 2016 Date: April 6, 2016 I. Summary CTA s financial results are $2.7 million favorable
Cash & Liquidity The chart below highlights CTA s cash position at January 2016 compared to January 2015.
 To: Chicago Transit Authority Board From: Tom McKone, Acting Chief Financial Officer Re: Financial Results for January 2016 Date: March 9, 2016 I. Summary CTA s financial results are $0.8 million unfavorable
Cash & Liquidity The chart below highlights CTA s cash position at February 2015 compared to February 2014.
 To: Chicago Transit Authority Board From: Ron DeNard, Chief Financial Officer Re: Financial Results for February 2015 Date: April 15, 2015 I. Summary CTA s financial results are favorable for the month
CTA s financial results are unfavorable by $0.5 million and $1.2 million for the month and year.
 To: Chicago Transit Authority Board From: Ron DeNard, Chief Financial Officer Re: Financial Results for May 2015 Date: July 13, 2015 I. Summary CTA s financial results are unfavorable by $0.5 million and
Ridership for the month is 39.4 million and is on par with budget. Ridership is 1.4 million or 3.6% higher than January 2014.
 To: Chicago Transit Authority Board From: Ron DeNard, Chief Financial Officer Re: Financial Results for January 2015 Date: March 6, 2015 I. Summary CTA s financial results are $2.0 million favorable for
Cash & Liquidity The chart below highlights CTA s cash position at November 2014 compared to November 2013.
 To: Chicago Transit Authority Board From: Ronald E. DeNard, Chief Financial Officer Re: Financial Results for November 2014 Date: January 12, 2015 I. Summary CTA s financial results are $1.9 million unfavorable
Cash & Liquidity The chart below highlights CTA s cash position at July 2015 compared to July 2014.
 To: Chicago Transit Authority Board From: Tom McKone, Acting CFO Re: Financial Results for July 2015 Date: September 4, 2015 I. Summary CTA s financial results are favorable by $1.9 million for the month
Cash & Liquidity The chart below highlights CTA s cash position at June 2014 compared to June 2013.
 To: Chicago Transit Authority Board From: Ron DeNard, Chief Financial Officer Re: Financial Results for June 2014 Date: August 13, 2014 I. Summary CTA s financial results are $4.0 million favorable for
Cash & Liquidity The chart below highlights CTA s cash position at May 2014 compared to May 2013.
 To: Chicago Transit Authority Board From: Ron DeNard, Chief Financial Officer Re: Financial Results for May 2014 Date: July 16, 2014 I. Summary CTA s financial results are $5.6 million favorable for May
Financial Report - FY 2017 Year to Date May 31, 2017
 Financial Report - FY 2017 Year to Date July 19, 2017 1 Major Highlights Revenue Sales tax remittances received through YTD April 2017 are 4.2% higher than YTD April 2016 Plaza Saltillo lease income budgeted
METRO MONTHLY BOARD REPORT
 METRO Revenue Expenses Service Performance Fiscal Year FY2011 Table of Contents Section A Section B Section C Section D Section E Section F Section G Section H Summary Sales Tax Revenue Fare Revenue Operating
Operating Budget Stability
 Operating Budget Stability March Financial Update Report to Agenda Executive Summary March Performance Against FY16 Budget March Performance Against Same Period Last Year Appendix Financial Detail: March
FY2014 Operating Budget Performance Report
 Finance & Administration Committee Information Item IV-C September 11, 2014 FY2014 Operating Budget Performance Report Washington Metropolitan Area Transit Authority Board Action/Information Summary Action
METRO. Fiscal Year 2012 Monthly Board Report. September 2012 (Fourth Quarter Fiscal Year-to-Date)
") METRO Fiscal Year 2012 Monthly Board Report Revenue Expense Ridership Performance (Fourth Quarter Fiscal Year-to-Date) This report is based on a preliminary closing of the year-end financials for FY2012
METRO Fiscal Year 2012 Monthly Board Report Revenue Expense Ridership Performance (Fourth Quarter Fiscal Year-to-Date) This report is based on a preliminary closing of the year-end financials for FY2012
Budget Process Overview and Cost Allocation Methodology
 Budget Process Overview and Cost Allocation Methodology 1 Cost Allocation Agreement Guiding Principles Operate a consolidated regional public transportation system within and between the Participating
METRO. Fiscal Year 2013 Monthly Board Report. December 2012 (First Quarter Fiscal Year-to-Date)
") METRO Fiscal Year 2013 Monthly Board Report Revenue Expense Ridership Performance (First Quarter Fiscal Year-to-Date) 1/14/2013 Table of Contents Section A Section B Section C Section D Section E Section
METRO Fiscal Year 2013 Monthly Board Report Revenue Expense Ridership Performance (First Quarter Fiscal Year-to-Date) 1/14/2013 Table of Contents Section A Section B Section C Section D Section E Section
METRO. Monthly Board Report. June 2006
 METRO Monthly Board Report Operating Capital Service Performance June 26 7/17/26 June 26 MONTHLY BOARD REPORT INDEX Section A Section B Section C Section D Section E Section F Section G Operating Budget
METRO. Fiscal Year 2012 Monthly Board Report. December 2011 (First Quarter Fiscal Year-to-Date)
") METRO Fiscal Year 2012 Monthly Board Report Revenue Expense Ridership Performance (First Quarter Fiscal Year-to-Date) 1/27/2012 Table of Contents Section A Section B Section C Section D Section E Section
METRO Fiscal Year 2012 Monthly Board Report Revenue Expense Ridership Performance (First Quarter Fiscal Year-to-Date) 1/27/2012 Table of Contents Section A Section B Section C Section D Section E Section
METRO. Fiscal Year 2013 Monthly Board Report. November 2012
 METRO Fiscal Year 2013 Monthly Board Report Revenue Expense Ridership Performance 12/13/2012 Table of Contents Section A Section B Section C Section D Section E Section F Section G Section H Section I
WESTWOOD LUTHERAN CHURCH Summary Financial Statement YEAR TO DATE - February 28, Over(Under) Budget WECC Fund Actual Budget
 Budget WECC Fund Actual Budget") WESTWOOD LUTHERAN CHURCH Summary Financial Statement YEAR TO DATE - February 28, 2018 General Fund Actual A B C D E F WECC Fund Actual Revenue Revenue - Faith Giving 1 $ 213 $ 234 $ (22) - Tuition $ 226
WESTWOOD LUTHERAN CHURCH Summary Financial Statement YEAR TO DATE - February 28, 2018 General Fund Actual A B C D E F WECC Fund Actual Revenue Revenue - Faith Giving 1 $ 213 $ 234 $ (22) - Tuition $ 226
Operating Budget. Third Quarter Financial Report (July 2005 March 2006)
") Third Quarter Financial Report (July 2005 March 2006) INDEX A. Executive Summary...page 2 B. Revenue and Expense Analysis...page 3 C. Budget Variance Reports...page 14 D. Ridership and Performance Measures...page
Third Quarter Financial Report (July 2005 March 2006) INDEX A. Executive Summary...page 2 B. Revenue and Expense Analysis...page 3 C. Budget Variance Reports...page 14 D. Ridership and Performance Measures...page
XML Publisher Balance Sheet Vision Operations (USA) Feb-02
 Feb-02") Page:1 Apr-01 May-01 Jun-01 Jul-01 ASSETS Current Assets Cash and Short Term Investments 15,862,304 51,998,607 9,198,226 Accounts Receivable - Net of Allowance 2,560,786
Page:1 Apr-01 May-01 Jun-01 Jul-01 ASSETS Current Assets Cash and Short Term Investments 15,862,304 51,998,607 9,198,226 Accounts Receivable - Net of Allowance 2,560,786
2019 Tax Budget Office of Management & Budget July 17, Greater Cleveland Regional Transit Authority
 Greater Cleveland Regional Transit Authority 2019 Tax Budget Office of Management & Budget July 17, 2018 Operating Budget Calendar o May o Jun o Jul Prepare 5 Yr. Financial Forecast Finalize 5 Yr Financial
METRO. Fiscal Year 2015 Monthly Board Report. February 2015
 METRO Fiscal Year 2015 Monthly Board Report Revenue Expense Ridership Performance 4/2/2015 Table of Contents Section A Section B Section C Section D Section E Section F Section G Section H Section I Section
METRO. Fiscal Year 2013 Monthly Board Report. January 2013
 METRO Fiscal Year 2013 Monthly Board Report Revenue Expense Ridership Performance 2/14/2013 Table of Contents Section A Section B Section C Section D Section E Section F Section G Section H Section I Section
METRO. Fiscal Year 2014 Monthly Board Report. May 2014
 METRO Fiscal Year 2014 Monthly Board Report Revenue Expense Ridership Performance 7/11/2014 Table of Contents Section A Section B Section C Section D Section E Section F Section G Section H Section I Section
Operating Budget. Second Quarter Financial Report
 Second Quarter Financial Report INDEX A. Executive Summary... A-1 B. Revenue and Expense Analysis... B-1 C. Budget Variance Reports... C-1 D. Ridership and Performance Measures... D-1 Board Budget Committee
Big Walnut Local School District
 Big Walnut Local School District Monthly Financial Report for the month ended September 30, 2013 Prepared By: Felicia Drummey Treasurer BIG WALNUT LOCAL SCHOOL DISTRICT SUMMARY OF YEAR TO DATE FINANCIAL
Spheria Australian Smaller Companies Fund
 29-Jun-18 $ 2.7686 $ 2.7603 $ 2.7520 28-Jun-18 $ 2.7764 $ 2.7681 $ 2.7598 27-Jun-18 $ 2.7804 $ 2.7721 $ 2.7638 26-Jun-18 $ 2.7857 $ 2.7774 $ 2.7690 25-Jun-18 $ 2.7931 $ 2.7848 $ 2.7764 22-Jun-18 $ 2.7771
BUDGETWATCH October 2018 Flash Report
 October 2018 Flash Report Overall Latest Condition (reporting on operations through September and subsidies through October): Passenger Revenues were slightly below the Forecast in September, marginally
February 2016 Financial Report
 2016 February 2016 Financial Report Capital Metropolitan Transportation Authority 4/13/2016 Table of Contents SUMMARY REPORT Budgetary Performance - Revenue 2 - Sales Tax Revenue 5 - Operating Expenses
Big Walnut Local School District
 Big Walnut Local School District Monthly Financial Report for the month ended September 30, 2012 Prepared By: Felicia Drummey Treasurer BIG WALNUT LOCAL SCHOOL DISTRICT SUMMARY OF YEAR-TO-DATE FINANCIAL
HIPIOWA - IOWA COMPREHENSIVE HEALTH ASSOCIATION Unaudited Balance Sheet As of July 31
 Unaudited Balance Sheet As of July 31 Total Enrollment: 407 Assets: Cash $ 9,541,661 $ 1,237,950 Invested Cash 781,689 8,630,624 Premiums Receivable 16,445 299,134 Prepaid 32,930 34,403 Assessments Receivable
BUDGETWATCH September 2014 Flash Report
 BUDGETWATCH September 2014 Flash Report (Forecast figures in this report, except the Summary of June Budgetwatch, refer to the 2014 Forecast) Summary of June Budgetwatch (reporting on operations through
METRO. Fiscal Year 2017 Monthly Performance Report. Revenue Expense Ridership Performance. October 2016
 METRO Fiscal Year 2017 Monthly Performance Report Revenue Expense Ridership Performance 11/18/2016 Table of Contents Section A Section B Section C Section D Section E Section F Section G Section H Section
METRO. Fiscal Year Monthly Performance Report. Revenue Expense Ridership Performance. November 2018 (Third Quarter Fiscal Year-to Date)
") METRO Fiscal Year 2019 Monthly Performance Report Revenue Expense Ridership Performance (Third Quarter Fiscal Year-to Date) 12/12/2018 Table of Contents Section A Section B Section C Section D Section
METRO Fiscal Year 2019 Monthly Performance Report Revenue Expense Ridership Performance (Third Quarter Fiscal Year-to Date) 12/12/2018 Table of Contents Section A Section B Section C Section D Section
BUDGETWATCH May 2018 Flash Report
 May 2018 Flash Report Overall Latest Condition (reporting on operations through April and subsidies through May): Passenger revenues were $15.1 million unfavorable in April, increasing the unfavorable
BUDGETWATCH April 2015 Flash Report
 BUDGETWATCH April 2015 Flash Report Summary of March Budgetwatch (reporting on operations through February and subsidies through March): Overall, results through March were favorable mainly as a result
Cost Estimation of a Manufacturing Company
 Cost Estimation of a Manufacturing Company Name: Business: Date: Economics of One Unit: Manufacturing Company (Only complete if you are making a product, such as a bracelet or beauty product) Economics
BUDGETWATCH September 2018 Flash Report
 September 2018 Flash Report (Forecast figures in this report refer to the 2018 Forecast) Overall Latest Condition (reporting on operations through August and subsidies through September): For reporting
Capital Metropolitan Transportation Authority Monthly Financial Report For Period Ending November 30, 2013
 Capital Metropolitan Transportation Authority Monthly Financial Report For Period Ending November 30, 2013 Table of Contents SUMMARY REPORT Financial Performance -Sales Tax Revenue 3 -Other Revenue 4 -Operating
MONTHLY FINANCIAL STATUS JANUARY 2019
 (Millions) MONTHLY FINANCIAL STATUS To: Dave Genova, General Manager and CEO ACTION DISCUSSION INFO From: Heather McKillop, CFO and AGM Administration x Date: March 12, 2019 VS. BUDGET YTD 2019 VS. BUDGET
MONTHLY FINANCIAL STATUS JUNE 2018
 (Millions) MONTHLY FINANCIAL STATUS To: Dave Genova, General Manager and CEO ACTION DISCUSSION INFO From: Heather McKillop, CFO and AGM Administration x Date: July 10, VS. BUDGET YTD VS. BUDGET JUNE VS.
Review of Registered Charites Compliance Rates with Annual Reporting Requirements 2016
 Review of Registered Charites Compliance Rates with Annual Reporting Requirements 2016 October 2017 The Charities Regulator, in accordance with the provisions of section 14 of the Charities Act 2009, carried
BUDGETWATCH March 2018 Flash Report
 March 2018 Flash Report Overall Latest Condition (reporting on operations through February and subsidies through March): Passenger revenues were $6 million unfavorable in February, increasing the unfavorable
Washington State Health Insurance Pool Treasurer s Report December 2017 Financial Review
 Washington State Health Insurance Pool Treasurer s Report December 2017 Financial Review 1. 2017 Interim III Assessment Required An assessment of $8.5 M is required to adequately fund the pool until the
FUEL PRICE RISK MANAGEMENT POLICY REPORT "FUEL HEDGE"
 FUEL PRICE RISK MANAGEMENT POLICY REPORT "FUEL HEDGE" Sep-18 FUEL PRICE RISK MANAGEMENT POLICY REPORT Sep-18 (Office of Management and Budget 09/30/2018) The Fuel Price Risk Management Policy approved
MEMORANDUM TO: FROM: Kathy Fisher, Budget Manager ( ) SUBJECT: Budget Variance Report 1 st Quarter DATE: April 20, 2017
 SUBJECT: Budget Variance Report 1 st Quarter DATE: April 20, 2017") MEMORANDUM F&A 5/1/ Page 1 of 6 TO: Finance and Administration Committee FROM: Kathy Fisher, Budget Manager (612-726-8158) SUBJECT: Budget Variance Report 1 st Quarter DATE: April 20, The 1 st Quarter
MEMORANDUM F&A 5/1/ Page 1 of 6 TO: Finance and Administration Committee FROM: Kathy Fisher, Budget Manager (612-726-8158) SUBJECT: Budget Variance Report 1 st Quarter DATE: April 20, The 1 st Quarter
FUEL PRICE RISK MANAGEMENT POLICY REPORT "FUEL HEDGE"
 FUEL PRICE RISK MANAGEMENT POLICY REPORT "FUEL HEDGE" December 2018 FUEL PRICE RISK MANAGEMENT POLICY REPORT December 2018 The Fuel Price Risk Management Policy approved by the Board on February 16, 2006
MONTHLY FINANCIAL STATUS AUGUST 2018
 (Millions) MONTHLY FINANCIAL STATUS To: Dave Genova, General Manager and CEO ACTION DISCUSSION INFO From: Heather McKillop, CFO and AGM Administration x Date: October 9, VS. BUDGET YTD VS. BUDGET AUGUST
Capital Metropolitan Transportation Authority Monthly Performance & Financial Report For Period Ending October 31, 2012 Soft Close
 Capital Metropolitan Transportation Authority Monthly Performance & Financial Report For Period Ending October 31, 2012 Soft Close Table of Contents SUMMARY REPORT Financial Performance -Sales Tax 3 -Other
BUDGETWATCH March 2016 Flash Report
 March 2016 Flash Report Summary of February Budgetwatch (reporting on operations through January and subsidies through February): Overall results through February were slightly favorable. Net operating
Executive Summary. July 17, 2015
 Executive Summary July 17, 2015 The Revenue Estimating Conference adopted interest rates for use in the state budgeting process. The adopted interest rates take into consideration current benchmark rates
Fiscal Year 2018 Project 1 Annual Budget
 Fiscal Year 2018 Project 1 Annual Budget Table of Contents Table Page Summary 3 Summary of Costs Table 1 4 Treasury Related Expenses Table 2 5 Summary of Full Time Equivalent Table 3 6 Positions Cost-to-Cash
Economic Activity Index ( GDB-EAI ) For the month of May 2013 G O V E R N M E N T D E V E L O P M E N T B A N K F O R P U E R T O R I C O
 For the month of May 2013 G O V E R N M E N T D E V E L O P M E N T B A N K F O R P U E R T O R I C O") Economic Activity Index ( GDB-EAI ) For the month of May 2013 General Commentary May 2013 GDB-EAI for the month of May registered a 3.4% year-over-year ( YOY ) reduction May 2013 EAI was 126.7, a 3.4%
Economic Activity Index ( GDB-EAI ) For the month of May 2013 General Commentary May 2013 GDB-EAI for the month of May registered a 3.4% year-over-year ( YOY ) reduction May 2013 EAI was 126.7, a 3.4%
MONTHLY FINANCIAL STATUS OCTOBER 2018
 (Millions) MONTHLY FINANCIAL STATUS To: Dave Genova, General Manager and CEO ACTION DISCUSSION INFO From: Heather McKillop, CFO and AGM Administration x Date: December 11, VS. BUDGET YTD VS. BUDGET OCTOBER
Financial Management Report... 3
 November 13, 2013 Table of Contents Financial Management Report... 3 OPERATING FUNDS STATEMENT OF REVENUES & EXPENSES... 3 METROPOLITAN COUNCIL INVESTMENT PERFORMANCE SHORT-TERM PORTFOLIO... 4 METROPOLITAN
QUESTION 2. QUESTION 3 Which one of the following is most indicative of a flexible short-term financial policy?
 QUESTION 1 Compute the cash cycle based on the following information: Average Collection Period = 47 Accounts Payable Period = 40 Average Age of Inventory = 55 QUESTION 2 Jan 41,700 July 39,182 Feb 18,921
METRO. Fiscal Year Monthly Performance Report. Revenue Expense Ridership Performance. February 2018 (First Quarter Fiscal Year-to Date)
") METRO Fiscal Year 2018 Monthly Performance Report Revenue Expense Ridership Performance (First Quarter Fiscal Year-to Date) 3/12/2018 Table of Contents Section A Section B Section C Section D Section E
METRO Fiscal Year 2018 Monthly Performance Report Revenue Expense Ridership Performance (First Quarter Fiscal Year-to Date) 3/12/2018 Table of Contents Section A Section B Section C Section D Section E
HIPIOWA - IOWA COMPREHENSIVE HEALTH ASSOCIATION Unaudited Balance Sheet As of January 31
 Unaudited Balance Sheet As of January 31 Total Enrollment: 371 Assets: Cash $ 1,408,868 $ 1,375,117 Invested Cash 4,664,286 4,136,167 Premiums Receivable 94,152 91,261 Prepaid 32,270 33,421 Assessments
Financial & Business Highlights For the Year Ended June 30, 2017
 Financial & Business Highlights For the Year Ended June, 17 17 16 15 14 13 12 Profit and Loss Account Operating Revenue 858 590 648 415 172 174 Investment gains net 5 162 909 825 322 516 Other 262 146
PRESS RELEASE. Securities issued by Hungarian residents and breakdown by holding sectors. October 2018
 PRESS RELEASE 10 December 2018 Securities issued by Hungarian residents and breakdown by holding sectors October 2018 According to securities statistics, the amount outstanding of equity securities and
Washington State Health Insurance Pool Treasurer s Report April 2018 Financial Review
 Washington State Health Insurance Pool Treasurer s Report April 2018 Financial Review 1. 2018 Interim I Assessment Required An assessment of $7.0 M is required to adequately fund the pool until the next
Washington State Health Insurance Pool Treasurer s Report March 2018 Financial Review
 Washington State Health Insurance Pool Treasurer s Report March 2018 Financial Review 1. 2017 Interim III Assessment Required An assessment of $8.5 M was required to adequately fund the pool until the
Washington State Health Insurance Pool Treasurer s Report January 2018 Financial Review
 Washington State Health Insurance Pool Treasurer s Report January 2018 Financial Review 1. 2017 Interim III Assessment Required An assessment of $8.5 M was required to adequately fund the pool until the
April 30, 2016 Financial Report
 2016 April 30, 2016 Financial Report Capital Metropolitan Transportation Authority 6/15/2016 Table of Contents SUMMARY REPORT Budgetary Performance - Revenue 2 - Sales Tax Revenue 6 - Operating Expenses
Washington State Health Insurance Pool Treasurer s Report November 2014 Financial Review
 Washington State Health Insurance Pool Treasurer s Report November 2014 Financial Review 1. 2014 Interim III and 2013 Final True-up Assessment Required An assessment of $2.0 M is required in order to adequately
Business & Financial Services December 2017
 Business & Financial Services December 217 Completed Procurement Transactions by Month 2 4 175 15 125 1 75 5 2 1 Business Days to Complete 25 Jan Feb Mar Apr May Jun Jul Aug Sep Oct Nov Dec 217 Procurement
General Fund Revenue
 Millions Percent of Kathy Steinert, Director of Fiscal Services Phone: 541.923.8927 145 SE Salmon Ave Redmond, OR 97756 kathy.steinert@redmond.k12.or.us Date: May 23, 2014 To: Redmond School District Board
BUDGETWATCH March 2019 Flash Report
 March 2019 Flash Report Overall Latest Condition (reporting on operations through February and subsidies through March): Overall, YTD preliminary net results were favorable mainly reflecting lower operating
Financial Report for the Month of SEPTEMBER
 WILLOUGHBY, OH Financial Report for the Month of SEPTEMBER Month Ended SEPTEMBER 30, 2013 BOARD OF EDUCATION Mrs. Margaret Warner, President SUPERINTENDENT Mr. Steve Thompson Mrs. Sharon Scott, Vice President
Washington State Health Insurance Pool Treasurer s Report August 2017 Financial Review
 Washington State Health Insurance Pool Treasurer s Report August 2017 Financial Review 1. 2017 Interim I Assessment Required An assessment of $9.5 M was required to adequately fund the pool until the next
TERMS OF REFERENCE FOR THE INVESTMENT COMMITTEE
 I. PURPOSE The purpose of the Investment Committee (the Committee ) is to recommend to the Board the investment policy, including the asset mix policy and the appropriate benchmark for both ICBC and any
Jul Aug Sept Oct Nov Dec Jan Feb Mar Apr May Jun
 REVENUE AND RIDERSHIP 4th Quarter FY2014 REVENUE (in Millions) $90M $85M $80M $75M $70M $65M $60M $55M $50M 79 77 74 74 72 70 FY2013 Actual FY2014 Budget FY2014 Actual 79 85 78 78 77 67 66 70 59 67 65
Management Reports. June for PREPARED BY POWERED BY
 Management Reports for June 217 PREPARED BY POWERED BY Contents 1. Management Reports Cashflow Forecast Actual vs Budget P&L Forecast Where Did Our Money Go? Net Worth 2. Understanding your Reports 3.
BUDGETWATCH May 2017 Flash Report
 May 2017 Flash Report Summary of April Budgetwatch (reporting on operations through March and subsidies through April): Overall, results were favorable for the month, and remained favorable YTD. Passenger
Washington State Health Insurance Pool Treasurer s Report January 2017 Financial Review
 Washington State Health Insurance Pool Treasurer s Report January 2017 Financial Review 1. 2016 Interim III Assessment Required An assessment of $8.5 M is required to adequately fund the pool until the
August 31, 2016 Financial Report
 August 31, 2016 Financial Report Capital Metropolitan Transportation Authority 10/14/2016 Table of Contents SUMMARY REPORTS Budgetary Performance - Revenue 2 - Sales Tax Revenue 6 - Operating Expenses
Determination (9 /2010) of a Customer Complaint Submitted by a Customer Against Muscat Electricity Distribution Company SAOC
 of a Customer Complaint Submitted by a Customer Against Muscat Electricity Distribution Company SAOC") Determination (9 /2010) of a Customer Complaint Submitted by a Customer Against Muscat Electricity Distribution Company SAOC 1. Introduction 1.1 The Authority for Electricity Regulation, Oman (the Authority)
Determination (9 /2010) of a Customer Complaint Submitted by a Customer Against Muscat Electricity Distribution Company SAOC 1. Introduction 1.1 The Authority for Electricity Regulation, Oman (the Authority)
MONTHLY FINANCIAL REPORT June 2009
 California Independent System Operator MONTHLY FINANCIAL REPORT June 2009 151 Blue Ravine Road Folsom, CA 95630 (916) 351-4000 CALIFORNIA INDEPENDENT SYSTEM OPERATOR CORPORATION MONTHLY FINANCIAL REPORT
Regional overview Gisborne
 Regional overview Purchasing intentions - additional income-related rent subsidy (IRRS) places Area District 1 2 3 4+ TOTAL 3 35 5 7 total 3 35 5 7 7 8 9 1 11 Purchasing intentions - change within the
BUDGETWATCH February 2016 Flash Report
 February 2016 Flash Report Overall Latest Condition (reporting on operations for January and subsidies through February): Overall, preliminary results were on target for the month and slightly favorable
Board of Directors October 2018 and YTD Financial Report
 Board of Directors October 2018 and YTD Financial Report Consolidated Financial Results Operating Margin October ($30,262) $129,301 ($159,563) Year-to-date $292,283 $931,358 ($639,076) Excess of Revenue
PRESS RELEASE. Securities issued by Hungarian residents and breakdown by holding sectors. January 2019
 7 March 2019 PRESS RELEASE Securities issued by Hungarian residents and breakdown by holding sectors January 2019 According to securities statistics, the amount outstanding of equity securities and debt
Pre-Existing Condition Insurance Plan Washington State (PCIP-WA) June 2011 Financial Review
 June 2011 Financial Review") Pre-Existing Condition Insurance Plan Washington State (PCIP-WA) June 2011 Financial Review 1. Financial Statements June 2011 UBalance Sheet Due to the timing of the HHS reimbursement receipts, there is
Pre-Existing Condition Insurance Plan Washington State (PCIP-WA) June 2011 Financial Review 1. Financial Statements June 2011 UBalance Sheet Due to the timing of the HHS reimbursement receipts, there is
Quarterly Financial Review
 Second Quarter 2013 Quarterly Financial Review Norfolk Southern Corporation Finance Department Three Commercial Place Norfolk, Virginia 23510.2191 7/20/2012 DRAFTB Norfolk Southern Railway System Contents
MONTHLY FINANCIAL STATUS MAY 2018
 (Millions) MONTHLY FINANCIAL STATUS To: Dave Genova, General Manager and CEO ACTION DISCUSSION INFO From: Heather McKillop, CFO and AGM Administration x Date: July 10, VS. BUDGET YTD VS. BUDGET MAY VS.
MONTHLY FINANCIAL STATUS APRIL 2018
 (Millions) MONTHLY FINANCIAL STATUS To: Dave Genova, General Manager and CEO ACTION DISCUSSION INFO From: Heather McKillop, CFO and AGM Administration x Date: June 19, VS. BUDGET YTD VS. BUDGET APRIL VS.
PRESS RELEASE. Securities issued by Hungarian residents and breakdown by holding sectors. April 2016
 10 June 2016 PRESS RELEASE Securities issued by Hungarian residents and breakdown by holding sectors April 2016 According to securities statistics data, the amount outstanding of equity securities and
PASSENGER REJECTION REDUCTION INITIATIVE KIRK PEREIRA. 24 th April 2018
 PASSENGER REJECTION REDUCTION INITIATIVE KIRK PEREIRA 24 th April 2018 WHAT IS THIS PROJECT ABOUT? Well we are not going into that again this year! Nearly everyone in this room knows about the project
Home and Community Based Services (HCBS) Waiver Monthly Surplus-Deficit Report for Waiver Program Expenditures. June 20, 2016
 Waiver Monthly Surplus-Deficit Report for Waiver Program Expenditures. June 20, 2016") Home and Community Based Services (HCBS) Waiver Monthly Surplus-Deficit Report for Waiver Program Expenditures June 20, 2016 Appropriations and Expenditure Information The Fiscal Year 2015-16 General Appropriations
Home and Community Based Services (HCBS) Waiver Monthly Surplus-Deficit Report for Waiver Program Expenditures June 20, 2016 Appropriations and Expenditure Information The Fiscal Year 2015-16 General Appropriations