CITY OF ST. PETERSBURG FISCAL YEAR 2013 ADOPTED OPERATING BUDGET & CAPITAL IMPROVEMENT PROGRAM
|
|
|
- Lee Ferguson
- 5 years ago
- Views:
Transcription
1 CITY OF ST. PETERSBURG FISCAL YEAR 2013 ADOPTED OPERATING BUDGET & CAPITAL IMPROVEMENT PROGRAM
2 City of St. Petersburg Budget I. FUND SUMMARIES General Fund (0001) 1 Preservation Fund (0002) 4 Industrial Development (0005) 5 Economic Stability (0008) 6 Healthcare Facilities Authority (0051) 7 Utility Tax Revenue (1001) 8 Local Option Tax Revenue (1003) 9 Franchise Tax Revenue (1005) 10 Excise Tax Revenue (1007) 11 Emergency Medical Services (1009) 12 American Recovery & Reinvestment Act (1017) 13 Local Housing Assistance (1019) 14 Parking Revenue (1021) 15 Law Enforcement Fund (1023) 16 School Crossing Guard Fund (1025) 17 Weeki Wachee (1041) 18 Arts & Cultural Programs (1042) 19 Pro Sports Facility (1051) 20 Economic Development (1101) 21 Downtown Redevelopment District (1105) 22 Bayboro Harbor Tax Increment District (1106) 23 Intown West Tax Increment District (1107) 24 Assessment Revenue (1108) 25 Community Development Block Grant (1111) 26 Emergency Shelter Grant Fund (1112) 27 Home Programs (1113) 28 Neighborhood Stabilization Program (1114) 29 Miscellaneous Trust Funds (1115) 30 Community Housing Donation (1117) 31 Building Permit Special Revenue (1151) 32 Mahaffey Theater Operating (1201) 33 Pier Operating (1203) 34
3 Coliseum Operating (1205) 35 Sunken Gardens (1207) 36 Tropicana Field (1208) 37 Community Redevelopment District (1301) 38 Police Grant Fund (1702) 39 Arts in Public Places (1901) 40 JP Morgan Chase Revenue Notes (2010) 41 FFGFC Loan (2011) 42 Banc of America Notes Debt Service Fund (2013) 43 BB&T Notes (2014) 44 Utility Tax Debt Service (2021) 45 Stadium Debt Service (2025) 46 Sports Facility Sales Tax Debt (2027) 47 Redevelopment Debt Service (2035) 48 Water Resources (4001) 49 Water Resources Debt (4002) 50 Water Cost Stabilization (4005) 51 Stormwater Utility Operating (4011) 52 Stormwater Debt Service (4012) 53 Sanitation Operating (4021) 54 Sanitation Equipment Replacement (4027) 55 Airport Operating (4031) 56 Marina Operating (4041) 57 Golf Course Operating (4061) 58 Jamestown Complex (4081) 59 Port Operating (4091) 60 Fleet Management (5001) 61 Equipment Replacement (5002) 62 Municipal Office Buildings (5005) 63 Information & Communication Services (5011) 64 PC Replacement (5015) 65 Radio Replacement (5017) 66 Technology & Intrastructure Fund (5019) 67 Supply Management (5031) 68 Print Shop (5041) 69
4 Health Insurance (5121) 70 Life Insurance (5123) 71 General Liabilities Claim (5125) 72 Commercial Insurance (5127) 73 Worker s Compensation (5129) 74 Billing & Collections (5201) 75 II. DEPARTMENT SUMMARIES City Development Administration Summary 1 City Development Administration Department 5 Codes Compliance Department 6 Downtown Enterprise Facilities Department 8 Marketing & Communications Department 11 Planning & Economic Development Department 13 Real Estate & Property Management Department 16 Transportation & Parking Management Department 18 General Government Administration Summary 20 Audit Services Department 26 Billing & Collections Department 28 Budget & Management Department 30 City Clerk 32 City Council 34 Finance Department 35 Human Resources Department 41 Information & Communication Services Department 44 Legal Department 46 Mayor s Office 48 Leisure & Community Services Administration Summary 50 Community Service Department 53 Golf Course Department 55 Housing Department 57 Leisure & Community Services Administration Department 60 Library Department 61 Neighborhood Partnership 63 Parks & Recreation Department 65
5 Public Safety Administration Summary 68 Fire Department 71 Police Department 73 Public Works Administration Summary 76 Engineering and Capital Improvements Department 80 Fleet Management Department 83 Procurement & Supply Management 85 Public Works Administration Department 87 Sanitation Department 88 Stormwater, Pavement & Traffic Operations Department 90 Water Resources Department 93 III. FY13 CAPITAL IMPROVEMENT PROGRAM (CIP) Overview Introduction to Capital Improvement Program (CIP) 1 CIP Project Types 2 Summary of All CIP Funds CIP Funds Housing Capital Improvement (Fund 3000) 4 General Capital Improvement Fund (3001) 6 Bicycle/Pedestrian Safety Grants CIP Fund (3004) 9 Public Safety Capital Improvement Fund (3025) 12 Neighborhood & Citywide Infrastructure CIP Fund (3207) 14 Recreation & Culture Capital Improvement Fund (3029) 19 City Facilities Capital Improvement Fund (3031) 24 Weeki Wachee Capital Projects Fund (3041) 26 Transportation Impact fee CIP Fund (3071) 28 Downtown Parking Capital Projects Fund (3073) 30 Tropicana Field Capital Projects Fund (3081) 32 Water Rescources Capital Project Fund (4003) 34 Stormwater Drainage Capital Projects Fund (4013) 43 Airport Capital Projects Fund (4033) 46 Marina Capital Projects Fund (4043) 48 Golf Courses Capital Projects Fund (4063) 50 Port Capital Projects Fund (4093) 52
6 City of St. Petersburg Budget General Fund (0001) The General Operating Fund is the principal fund of the city and is used to account for the receipt and expenditure of resources traditionally associated with local government and not required to be accounted for in another fund. Resources are provided primarily through taxes and intergovernmental revenues and are expended to provide basic services such as fire and police protection, parks, libraries, and street maintenance, as well as for administrative departments which perform support functions. Revenue Summary Fund Summaries Page 1 Tax Revenue Taxes Property Current 83,109,215 74,570,330 69,616,255 69,616,255 69,616,255 78,560, % Taxes Property Delinquent 367, , , , , , % Taxes Property Penalties & Interest 7,929 4, % Taxes Franchise Electricity 0 19,684,895 19,695,527 19,695,527 19,084,985 20,384, % Taxes Franchise Natural Gas 901, , , , , ,500 (7.95%) Taxes Utility Services 0 (488) % Taxes Utility Services Electricity 4,778,713 21,113,455 21,161,401 21,161,401 20,245,455 21,279, % Taxes Utility Services Natural Gas 54, , , , , ,834 (3.06%) Taxes Utility Services Water 625,724 3,574,736 3,669,137 3,669,137 3,795,432 3,555,416 (3.10%) Taxes Utility Services Fuel Oil 2, ,300 2,300 3,052 3, % Taxes Utility Services Propane (21,540) 165, , , , , % Taxes Utility Services Communications Services Tax 1,982,636 13,107,242 12,791,371 12,791,371 13,300,000 12,961, % Business Taxes 2,405,903 2,407,083 2,500,000 2,500,000 2,531,000 2,340,000 (6.40%) Total Tax Revenue 94,214, ,457, ,533, ,533, ,603, ,132, % License And Permits Contractors Permits 50, ,986 35,000 35,000 50,000 35, % Other License And Permits 343, , , , , , % Total License And Permits 394, , , , , , % Intergovernmental Revenue Federal Grants 3,445,778 1,837, ,000 2,512,564 2,231,871 1,836, % State Grants 1,385 21, ,248 39, % Shared State Revenue Sharing 4,308,012 4,337,544 7,665,401 7,665,401 4,539,000 4,824,000 (37.07%) Shared State Revenue State Traffic Signal Reimburse , , , , % Shared State Mobile Home 98, , , , , , % Shared State Alcoholic Beverag 119, , , , , , % Shared State Sales Tax - Half 0 11,923,368 3,880,775 3,880,775 14,400,000 14,832, % Shared State Fire Fighters' Su 60,256 58,180 64,420 64,420 64,420 64, % Shared State Fuel Tax Rebates 203,650 99, , , , , % Grants From Other Local Units 1,396,870 1,409,011 1,338,807 2,434,510 1,935,716 1,514, % Shared Revenue 0 3,173,633 8,415,627 8,415,627 3,170,000 3,282,001 (61.00%) Total Intergovernmental Revenue 9,634,172 23,099,732 22,674,930 25,788,445 27,005,655 26,978, % Charges For Services General Government 279, , , , , , % Public Safety 2,106,171 2,817,540 2,297,410 2,297,410 2,300,150 2,320, % Physical Environment Charges 30,561 45, % Transportation Charges 103, , , , , ,424 (10.05%) Culture And Recreation Charges 5,386,951 5,973,281 6,798,129 6,798,129 6,546,394 6,153,981 (9.48%) Other Charges For Services 804,935 1,143, , , , ,246 (5.51%) Total Charges For Services 8,711,496 10,391,673 10,363,945 10,363,945 10,150,941 9,688,143 (6.52%) Fines And Forfeitures Traffic And Parking 556, ,020 2,862,015 2,862,015 2,947,725 3,663, % Library Fines 132, , , , , , % Violation Of Local Ordinances 466, , , , , , % Total Fines And Forfeitures 1,155,235 1,187,471 3,499,535 3,499,535 3,585,245 4,301, % Misc Revenues Interest Earnings Rents And Royalties 778, ,065 (658,694) 378, , , , , , , , , % (1.23%)
7 City of St. Petersburg Budget Special Assessment ,050 73,050 73,050 73, % Sale Of Fixed Assets 243,495 (178,469) 160, , , , % Sale Of Surplus Material 5,472 6,083 2,000 2,000 2,000 2, % Contributions And Donations 55, ,977 16,450 16,450 87,000 16, % Misc Revenue 375, , , , , ,112 (3.10%) Total Misc Revenues 1,794,712 (162,100) 1,762,176 1,762,176 2,054,226 2,078, % Pilot/G&A Revenue General & Administrative 8,724,084 9,403,380 9,449,460 9,449,460 9,306,012 9,306,012 (1.52%) Payment In Lieu Of Taxes 14,185,748 14,514,720 14,553,396 14,553,396 14,553,396 14,873, % Total Pilot/G&A Revenue 22,909,832 23,918,100 24,002,856 24,002,856 23,859,408 24,179, % Transfer In Utility Tax Revenue 36,969, % Local Option Tax Revenue 3,517, % Franchise Tax Revenue 21,018,607 2,397, % Excise Tax Revenue 11,224, ,945 1,431,495 1,431,495 1,711,895 0 (100.00%) Emergency Medical Services 0 6, % Parking Revenue 15, , , , , ,896 (12.77%) School Crossing Guard 355, , , , , , % Weeki Wachee 0 8,223 20,000 20,000 20,000 20, % Community Development Block Grant 0 272, , , , ,314 (21.45%) Neighborhood Stabilization Program 0 216, , , % Housing Capital Improvements , % General Capital Improvements , % Public Safety Capital Improvement 0 (49,794) % Neighborhood & Citywide Infrastructure 0 (114,017) % Recreation & Culture Capital 0 (68,634) % City Facilities Capital Improvement 0 (11,285) % Sanitation Operating 455, , , , , , % Airport Operating 0 50,004 50,000 50,000 50,000 50, % Marina Operating 300, , , , , , % Jamestown Complex 0 35,004 35,000 35, (100.00%) Information & Communication Services 399, , , , , ,000 (50.00%) Technology & Infrastructure Fund , % Total Transfer In 74,256,522 5,074,809 3,727,195 4,141,195 4,081,809 2,124,977 (42.99%) Internal Charges Department Charges % Other Charges (523) (2,587) % Total Internal Charges (315) (2,521) % Total Revenue Summary 213,070, ,416, ,300, ,828, ,092, ,345, % Appropriations Fund Summaries Page 2 Wages And Benefits 150,906, ,528, ,803, ,644, ,841, ,676, % Services And Commodities 41,540,709 41,910,740 39,783,064 42,484,980 42,507,930 43,332, % Capital 2,639,514 1,452, ,775 1,561, , , % Grants And Aid 1,928,236 1,944,369 2,657,450 2,820,648 2,781,397 2,663, % Contingencies , , ,000 (5.19%) Transfers Out Economic Stability ,016, % Downtown Redevelopment District ,663, % Bayboro Harbor Tax Increment District 0 37,597 21,004 21,004 21,004 16,587 (21.03%) Intown West Tax Increment District 0 171, , , , ,484 (10.03%) Neighborhood Stabilization Program 0 360, % Mahaffey Theater Operating 965,700 1,016, , , , ,520 (24.10%) Pier Operating 1,427,000 1,207,000 1,399,000 1,399,000 1,346,000 1,260,000 (9.94%) Coliseum Operating 232, , , , , , % Sunken Gardens 222, , , , , , % Tropicana Field 1,102,000 1,480,335 1,250,000 1,250,000 1,384,000 1,236,000 (1.12%) Community Redevelopment District 4,856,894 4,374,560 4,366,735 4,366,735 3,998,197 0 (100.00%) FFGFC Loan 2,625,421 2,629,377 2,635,316 2,635,316 2,635,316 2,625,836 (0.36%)
8 City of St. Petersburg Budget Banc Of America Notes Debt Service Fund , % General Capital Improvements 364, , ,900 71, % Water Resources ,000 35, % Airport Operating 136, % Jamestown Complex 70, , % Port Operating 508, , , , , ,500 (23.43%) Total Transfers Out 12,509,305 12,954,145 11,134,416 11,241,316 11,397,311 12,097, % Total Appropriations 209,523, ,789, ,871, ,233, ,375, ,345, % Increase/(Decrease) in Fund Balance 3,546,683 (9,373,554) (1,571,357) (3,405,543) (3,283,571) 0 Beginning Balance 21,101,096 26,504,009 25,726,729 17,787,274 17,787,274 14,503,703 Adjustments 1,856, , Ending Balance 26,504,009 17,787,274 24,155,372 14,381,731 14,503,703 14,503,703 Each year City Council has committed a portion of the General Operating Fund balance that exceeds the target balance for specific purposes. $2.611 million was designated at the end of FY11. The FY12 commitment amounts will be established after the final adjustments are made. The transfer to the Economic Stability Fund represents monies available to contend with any shortfall in. In the event that the General Fund exceeds its budget at the end of FY12, the transfer to Economic Stability Fund will not occur and the monies will stay in the General Fund balance to offset the shortage. The city's fiscal policies call for a General Fund Operating Reserve target equal to 20% of the current year appropriations, with the fund balance of the Economic Stability Fund included. Fund Summaries Page 3
9 City of St. Petersburg Budget Preservation Reserve (0002) The Environmental Preservation Reserve was established (Resolution ) to provide a funded reserve for environmental preservation enhancement activities as specified in the agreements relating to the sale of the former Sod Farm area to Pinellas County in Revenue Summary Charges For Services Other Charges For Services , % Total Charges For Services , % Misc Revenues Interest Earnings % Misc Revenue % Total Misc Revenues % Total Revenue Summary , % Increase/(Decrease) in Fund Balance , Beginning Balance 910, , , , , ,945 Adjustments Ending Balance 911, , , , , ,445 Fund Summaries Page 4
10 City of St. Petersburg Budget Industrial Development (0005) The Industrial Development Reserve was established in FY02 with the proceeds from the sale of a portion of the Sod Farm. A majority of the proceeds are restricted for the acquisition of industrial development property. Revenue Summary Misc Revenues Interest Earnings % Total Misc Revenues % Total Revenue Summary % Appropriations Transfers Out General Capital Improvements 123, % Total Transfers Out 123, % Total Appropriations 123, % Increase/(Decrease) in Fund Balance (123,605) Beginning Balance 123, Adjustments (31) Ending Balance This fund was closed in FY10 and is presented for historical purposes. Fund Summaries Page 5
11 City of St. Petersburg Budget Economic Stability (0008) The Economic Stability Fund was established in FY04 (Resolution ) and is to be used to offset economic impacts on the budget from significant or sustained increases in expenditures or significant decreases in revenue. Revenue Summary Misc Revenues Interest Earnings 499,973 (137,368) 198, , , , % Total Misc Revenues 499,973 (137,368) 198, , , , % Transfer In General Fund ,016, % Utility Tax Revenue 412, % Franchise Tax Revenue 0 499, % Total Transfer In 412, , ,016, % Total Revenue Summary 912, , , , ,699 1,214, % Appropriations Transfers Out Golf Course Capital Projects , % Total Transfers Out , % Total Appropriations , % Increase/(Decrease) in Fund Balance 912, , , , , ,946 Beginning Balance 23,143,134 22,006,207 21,411,360 22,371,376 22,371,376 22,599,075 Adjustments (2,049,016) 3, Ending Balance 22,006,207 22,371,376 21,609,960 22,569,976 22,599,075 23,554,021 The Economic Stability Fund was used in FY09 to pay off the Airport debt in accordance with policy to only use this fund for one-time, or non-recurring expenses. The Airport Operating Fund will repay the Economic Stability Fund from their future earnings. In June 2012, $5 million of the Economic Stability Fund fund balance was committed to self insure for the primary layer of insurance to fund the required participation level in the event of a loss. The transfer from the General Fund represents monies available to contend with any shortfall in. In the event that the General Fund exceeds its budget at the end of FY12, the transfer to Economic Stability Fund will not occur and the monies will stay in the General Fund balance to offset the shortage. The transfer in FY13 is for Golf Course capital projects. The Golf Course Operating Fund will repay the Economic Stability Fund from their future earnings. Fund Summaries Page 6
12 City of St. Petersburg Budget Health Facilities Authority (0051) This fund accounts for revenues that are service charges to non-profit health care organizations benefiting from tax exempt debt issues. Expenditures are the administrative costs incurred by the authority. Revenue Summary Charges For Services General Government 5, ,000 14,000 4,000 14, % Total Charges For Services 5, ,000 14,000 4,000 14, % Misc Revenues Interest Earnings % Total Misc Revenues % Total Revenue Summary 5, ,000 14,000 4,003 14, % Appropriations Services And Commodities ,000 14, , % Total Appropriations ,000 14, , % Increase/(Decrease) in Fund Balance 4,853 (157) 0 0 3,828 0 Beginning Balance 45,627 50,480 50,322 50,322 50,322 54,150 Adjustments 0 (1) Ending Balance 50,480 50,322 50,322 50,322 54,150 54,150 Fund Summaries Page 7
13 City of St. Petersburg Budget Utility Tax Revenue (1001) This fund accounted for the revenue used to fund the debt service for outstanding Utility Tax Bonds. The remaining revenue was transferred to the General Fund. It was established in the Series 1986 Bonds and was closed in. Revenue Summary Tax Revenue Taxes Utility Services Electricity 17,653, % Taxes Utility Services Natural Gas 536, % Taxes Utility Services Water 2,817, % Taxes Utility Services Fuel Oil % Taxes Utility Services Propane 163,093 1, % Taxes Utility Services Communications Services Tax 11,116, % Total Tax Revenue 32,288,507 1, % Charges For Services Physical Environment Charges (33) % Total Charges For Services (33) % Misc Revenues Misc Revenue (210) (383) 0 0 (15) % Total Misc Revenues (210) (383) 0 0 (15) % Total Revenue Summary 32,288,264 1, (15) % Appropriations Services And Commodities 2, % Transfers Out General Fund 36,969, , % Economic Stability 412, % Police Grant Fund 11, % Utility Tax Debt Service 1,881, % Airport Operating 51, % Marina Operating 286, % Golf Course Operating 462, % Health Insurance 1,584, % Total Transfers Out 41,659, , % Total Appropriations 41,661, , % Increase/(Decrease) in Fund Balance (9,373,585) 1, (1,037) 0 Beginning Balance 9,373, ,037 1,037 0 Adjustments (1) Ending Balance 1 1, , This fund will be closed at the end of FY12. Fund Summaries Page 8
14 City of St. Petersburg Budget Local Option Tax Revenue (1003) The Local Option Tax Revenue Fund accounted for revenue received from the City's share of Pinellas County Local Option Gas Tax and Local Option Sales Surtax (F.S ) to fund transportation activities, purchase public safety vehicles, and make improvements to parks, buildings, roads, and other infrastructure. This fund was closed at the end of, but the revenue was not transferred to the capital improvement funds and the General Fund until. Revenue Summary Intergovernmental Revenue Shared Revenue 22,122, % Total Intergovernmental Revenue 22,122, % Charges For Services Other Charges For Services % Total Charges For Services % Misc Revenues Interest Earnings 2, % Total Misc Revenues 2, % Total Revenue Summary 22,125, % Appropriations Transfers Out General Fund 3,517, % Public Safety Capital Improvement 4,073, , % Neighborhood & Citywide Infrastructure 10,868,004 2,106, % Recreation & Culture Capital 6,168,996 1,268, % City Facilities Capital Improvement 1,280, , % Total Transfers Out 25,908,004 4,503, % Total Appropriations 25,908,004 4,503, % Increase/(Decrease) in Fund Balance (3,782,332) (4,502,252) 0 0 (34) 0 Beginning Balance 8,284,618 4,502, Adjustments Ending Balance 4,502, This fund is presented for historical purposes. Fund Summaries Page 9
15 City of St. Petersburg Budget Franchise Tax Revenue (1005) The Franchise Tax Revenue Fund accounted for revenue used as a secondary pledge for the debt service for outstanding Public Improvement Revenue Bonds. The remaining revenue was transferred to the General Fund. It was established in the Series 1988A Bonds and closed at the end of. Revenue Summary Tax Revenue Taxes Franchise Electricity 21,258, % Total Tax Revenue 21,258, % Transfer In Community Development Block Grant 558, % Total Transfer In 558, % Total Revenue Summary 21,816, % Appropriations Transfers Out General Fund 21,018,607 2,397, % Economic Stability 0 499, % Total Transfers Out 21,018,607 2,896, % Total Appropriations 21,018,607 2,896, % Increase/(Decrease) in Fund Balance 797,992 (2,896,856) Beginning Balance 2,098,864 2,896,856 2,896, Adjustments Ending Balance 2,896, ,896, This fund is presented for historical purposes. Fund Summaries Page 10
16 City of St. Petersburg Budget Excise Tax Revenue (1007) This fund accounts for revenue used to fund the debt service for outstanding Excise Tax Secured Revenue Bonds. Beginning in FY11, the Excise Tax revenues are going directly to the debt service, with any remaining revenues going directly to the General Fund. Revenue Summary Intergovernmental Revenue Shared State Revenue Sharing 3,125, % Shared State Sales Tax - Half 11,870, % Shared Revenue 4,502, % Total Intergovernmental Revenue 19,498, % Transfer In Community Development Block Grant 0 270, % Total Transfer In 0 270, % Total Revenue Summary 19,498, , % Appropriations Transfers Out General Fund 11,224, ,945 1,431,495 1,431,495 1,711,895 0 (100.00%) Stadium Debt Service 8,541, % Total Transfers Out 19,765, ,945 1,431,495 1,431,495 1,711,895 0 (100.00%) Total Appropriations 19,765, ,945 1,431,495 1,431,495 1,711,895 0 (100.00%) Increase/(Decrease) in Fund Balance (266,974) (561,160) (1,431,495) (1,431,495) (1,711,895) 0 Beginning Balance 2,540,029 2,273,055 1,642,462 1,711,895 1,711,895 0 Adjustments Ending Balance 2,273,055 1,711, , , This fund will be closed at the end of FY12. Fund Summaries Page 11
17 City of St. Petersburg Budget Emergency Medical Services (1009) The Emergency Medical Services Fund records pre-hospital advance life support/rescue activity and is funded by Pinellas County. Revenue Summary License And Permits Other License And Permits % Total License And Permits % Intergovernmental Revenue Federal Grants 0 24, % Shared State Fire Fighters' Su 16,606 23,920 23,040 23,040 6,090 23, % Total Intergovernmental Revenue 16,606 48,154 23,040 23,040 6,090 23, % Charges For Services General Government % Public Safety 11,928,766 12,594,528 12,455,148 12,455,148 12,423,953 12,945, % Other Charges For Services 3, % Total Charges For Services 11,932,606 12,594,674 12,455,148 12,455,148 12,423,953 12,945, % Misc Revenues Interest Earnings % Sale Of Fixed Assets 0 61, , % Misc Revenue (696) (363) % Total Misc Revenues 3 61, , % Total Revenue Summary 11,949,265 12,704,057 12,478,188 12,478,188 12,447,275 12,968, % Appropriations Wages And Benefits 11,135,627 11,502,209 11,855,764 11,855,764 11,461,254 12,234, % Services And Commodities 789, ,805 1,005,176 1,012, , ,392 (4.55%) Capital 598, , , , , , % Transfers Out General Fund 0 6, % Total Transfers Out 0 6, % Total Appropriations 12,523,372 12,664,180 13,072,940 13,110,371 12,621,033 13,545, % Increase/(Decrease) in Fund Balance (574,107) 39,877 (594,752) (632,183) (173,758) (576,852) Beginning Balance 1,651,835 1,224,286 3,395,414 1,274,896 1,274,896 1,101,138 Adjustments 146,558 10, Ending Balance 1,224,286 1,274,896 2,800, ,713 1,101, ,286 Fund Summaries Page 12
18 City of St. Petersburg Budget American Recovery & Reinvestment Act (1017) This fund, established in FY09, accounts for revenue received under the American Recovery and Reinvestment Act (ARRA) for HUD programs under the Homelessness Prevention and Rapid Re-Housing (HPRP) program and the Community Development Block Grant - Recovery (CDBG-R) program that assist persons experiencing homelessness and to provide funding for community infrastructure improvements. The funds under these programs are intended to provide financial assistance and services to individuals and families who are experiencing homelessness to be quickly re-housed and stabilized, and fund city infrastructure projects that provide essential services to all citizens. The HPRP funds assist in numerous ways, including: short-term or medium-term rental assistance and housing relocation and stabilization services, including such activities as mediation, credit counseling, security or utility deposits, utility payments, moving cost assistance, and case management. Revenue Summary Intergovernmental Revenue Federal Grants 607,867 1,082, ,160 54, % Total Intergovernmental Revenue 607,867 1,082, ,160 54, % Misc Revenues Interest Earnings % Total Misc Revenues % Total Revenue Summary 607,867 1,082, ,160 54, % Appropriations Wages And Benefits 107,713 22, % Services And Commodities 442, , ,160 54, % Capital 460, , % Grants And Aid 0 113, % Total Appropriations 1,010,461 1,082, ,160 54, % Increase/(Decrease) in Fund Balance (402,594) (151) Beginning Balance 0 (233,247) 111, Adjustments 169, , Ending Balance (233,247) 0 111, This fund will be closing at the end of. Fund Summaries Page 13
19 City of St. Petersburg Budget Local Housing Assistance (1019) This fund accounts for revenue received under the State Housing Initiatives Partnership Program (SHIP) to produce and preserve affordable housing in St. Petersburg for low- to moderate-income earning households (Ordinance 90-G). Revenue Summary Intergovernmental Revenue State Grants 89, % Shared State Housing Initiativ 0 218, , , ,027 0 (100.00%) Total Intergovernmental Revenue 89, , , , ,027 0 (100.00%) Fines And Forfeitures Violation Of Local Ordinances 1,257 1, % Total Fines And Forfeitures 1,257 1, % Misc Revenues Interest Earnings 201,262 74,029 3,972 3,972 28,596 5, % Misc Revenue 297, , , , , ,000 (20.86%) Total Misc Revenues 498, , , , , ,000 (20.21%) Total Revenue Summary 589, , , , , ,000 (55.00%) Appropriations Wages And Benefits 94,270 80,583 53, ,650 93,000 35,940 (32.63%) Services And Commodities 3,216,142 1,546, ,650 2,005, , ,060 (57.67%) Total Appropriations 3,310,412 1,626, ,000 2,153,787 1,064, ,000 (55.00%) Increase/(Decrease) in Fund Balance (2,720,436) (1,000,066) 0 (1,653,787) (496,189) 0 Beginning Balance 5,383,566 2,664,565 2,782,223 1,666,888 1,666,888 1,170,699 Adjustments 1,435 2, Ending Balance 2,664,565 1,666,888 2,782,223 13,101 1,170,699 1,170,699 Due to state budget constraints, the State of Florida has not indicated that there will be any distribution of SHIP funds. Services to clients in the form of rehab and down payment assistance will become limited to the available funding. Fund Summaries Page 14
20 City of St. Petersburg Budget Parking Revenue (1021) The Parking Fund accounts for the operation of city parking facilities. Its revenue is pledged for Tax Increment Financing (TIF) and other debt. It was established in the Series 1988A Bonds. Because of the new GASB 54 requirements, this fund was reclassified from a Special Revenue Fund to an Enterprise Fund in FY11. Revenue Summary License And Permits Other License And Permits 4,250 6, ,393 7, % Total License And Permits 4,250 6, ,393 7, % Charges For Services Transportation Charges 3,141,838 3,629,395 4,049,714 4,049,714 4,150,473 4,253, % Other Charges For Services 9, % Total Charges For Services 3,151,291 3,629,395 4,049,714 4,049,714 4,150,473 4,253, % Fines And Forfeitures Traffic And Parking 1,577,518 1,444,549 1,370,000 1,370,000 1,328,494 1,540, % Violation Of Local Ordinances 510 1, % Total Fines And Forfeitures 1,578,028 1,445,559 1,370,441 1,370,441 1,328,654 1,540, % Misc Revenues Interest Earnings % Rents And Royalties 64,109 56,661 30,000 30,000 51,183 30, % Sale Of Fixed Assets 6,327 18, , % Misc Revenue (290,089) (191,009) (200,000) (200,000) 0 (200,000) 0.00% Total Misc Revenues (219,247) (115,890) (170,000) (170,000) 55,698 (170,000) 0.00% Internal Charges Other Charges (104) (437) (63) % Total Internal Charges (104) (437) (63) % Total Revenue Summary 4,514,218 4,965,145 5,250,167 5,250,167 5,536,155 5,630, % Appropriations Wages And Benefits 1,624,296 1,860,283 2,140,343 2,140,343 2,237,766 2,290, % Services And Commodities 2,302,702 2,072,784 2,241,594 2,246,425 2,247,232 2,280, % Capital 78,875 34, , % Transfers Out General Fund 15, , , , , ,896 (12.77%) Downtown Parking Improvement 250, , , % Total Transfers Out 265, , , , ,500 1,068, % Total Appropriations 4,270,873 4,195,565 4,809,413 4,814,244 4,975,498 5,719, % Increase/(Decrease) in Fund Balance 243, , , , ,657 (88,384) Beginning Balance 276, ,316 1,243,245 1,289,075 1,289,075 1,849,732 Adjustments 4,747 (4,821) Ending Balance 524,316 1,289,075 1,683,999 1,724,998 1,849,732 1,761,348 In FY13, revenues are expected to increase by 7.25%. This is primarily due to additional parking meters deployed during FY12 ($200,000) and an increase in fines due to increased activity from two new Parking Enforcement Officers ($170,000). Expenditures will increase by 18.92% in FY13 due to a $696,000 transfer from the Parking Fund to the Downtown Capital Projects Fund for capital projects improvements. Also for FY13, the transfer to the General Fund was reduced from ($404,000) to ($350,000). A portion of the fund balance ($101,024) is committed for the Committee to Advocate Persons with Impairments (CAPI). Fund Summaries Page 15
21 City of St. Petersburg Budget Law Enforcement Fund (1023) The Law Enforcement Fund records revenue from the forfeiture and seizure of property. Its use is restricted by state statute. Revenues are not projected for this fund and are only budgeted subsequent to receipt from available fund balance. Revenue Summary Fines And Forfeitures Traffic And Parking 964, , , % Total Fines And Forfeitures 964, , , % Misc Revenues Interest Earnings 1,204 2, , % Misc Revenue % Total Misc Revenues 1,204 2, , % Total Revenue Summary 966, , , % Appropriations Services And Commodities 419, , , , , , % Capital 42,715 1, , , % Grants And Aid 34,820 46, ,780 44, % Total Appropriations 497, , , , , , % Increase/(Decrease) in Fund Balance 468,732 99,539 (186,335) (935,061) (634,640) (186,335) Beginning Balance 870,839 1,341,312 1,513,687 1,452,377 1,452, ,737 Adjustments 1,741 11, Ending Balance 1,341,312 1,452,377 1,327, , , ,402 During FY12, supplemental appropriations were approved for the FY12 Forfeiture Fund Award Program ($29,281), travel to the National Law Enforcement Officers Memorial ($17,757), a donation to a project that was developed by Leadership St. Petersburg ($5,000) for renovations at Resurrection House, and for the purchase of ipads ($5,520) and SAPI Plates ($13,500). Fund Summaries Page 16
22 City of St. Petersburg Budget School Crossing Guard (1025) This fund records the revenue collected from the parking ticket surcharge. It is then transferred to the General Fund to reimburse the cost of the program (F.S (11)(b)). Revenue Summary Fines And Forfeitures Traffic And Parking 387, , , , , , % Total Fines And Forfeitures 387, , , , , , % Misc Revenues Interest Earnings % Misc Revenue (35,000) (28,000) 0 0 (35,000) % Total Misc Revenues (34,961) (27,987) 0 0 (34,999) % Total Revenue Summary 352, , , , , , % Appropriations Transfers Out General Fund 355, , , , , , % Total Transfers Out 355, , , , , , % Total Appropriations 355, , , , , , % Increase/(Decrease) in Fund Balance (2,590) 2, (45,174) 0 Beginning Balance 45,179 42,589 42,589 45,174 45,174 0 Adjustments Ending Balance 42,589 45,174 42,589 45, Fund Summaries Page 17
23 City of St. Petersburg Budget Weeki Wachee (1041) This fund was established during FY01 (Ordinance 530-G). In 1940, the city of St. Petersburg acquired property in Weeki Wachee Springs, Florida, as a potential future water source. For both economic and environmental reasons, this use was impractical and ultimately unachievable. On March 23, 1999, city voters approved a referendum authorizing the sale of the property. The referendum applied to the portion of the property west of U.S. 19 and required that "any sale proceeds shall be deposited in an account from which monies can only be expended for parks, recreational, preservation and beautification purposes." By ordinance, this restriction was applied to the process from the sale of the entire parcel. Revenue will be transferred to other funds for capital or operating expenses as authorized in the referendum approving the sale. Revenue Summary Misc Revenues Interest Earnings 657, , , , , , % Total Misc Revenues 657, , , , , , % Total Revenue Summary 657, , , , , , % Appropriations Services And Commodities 75,871 87,480 80,000 80, , , % Transfers Out General Fund 0 8,223 20,000 20,000 20,000 20, % Weeki Wachee Capital Improvements 0 1,682, , , % Total Transfers Out 0 1,690,223 20, , ,050 20, % Total Appropriations 75,871 1,777, , , , , % Increase/(Decrease) in Fund Balance 581,633 (1,575,780) 19,160 (521,890) (479,050) 62,000 Beginning Balance 15,874,677 16,433,178 16,533,703 14,911,487 14,911,487 14,432,437 Adjustments (23,132) 54, Ending Balance 16,433,178 14,911,487 16,552,863 14,389,597 14,432,437 14,494,437 Appropriations from the Weeki Wachee fund in FY13 include support for investment management services and a transfer to the General Fund to support Weeki Wachee project maintenance. During FY12, $541,050 was transferred to the Weeki Wachee Capital Projects Fund (3041) for the Lakewood Shade Structure Project ($41,050) and the Rio Vista Park Improvements Project ($500,000). Fund Summaries Page 18
24 City of St. Petersburg Budget Arts and Cultural Programs (1042) This fund was established in 2009 (Ordinance 865-G) and shall be used only to provide city matching funds for grants and donations for art and cultural programs within the city, or to support art and cultural organizations located within the city. Revenue Summary Misc Revenues Interest Earnings % Total Misc Revenues % Total Revenue Summary % Appropriations Services And Commodities ,000 50, % Total Appropriations ,000 50, % Increase/(Decrease) in Fund Balance (100,000) (49,970) 0 Beginning Balance 100, , , , ,179 50,209 Adjustments Ending Balance 100, , , ,209 50,209 During FY12, a supplemental appropriation was approved for arts consulting ($100,000). Any unspent funds will be rolled over to FY13. Fund Summaries Page 19
25 City of St. Petersburg Budget Pro Sports Facility (1051) The Pro Sports Facility Fund accounts for revenue used to support debt service for Professional Sports Facility Sales Tax Revenue Bonds (F.S ) and the First Florida Government Financing Commission Notes. Revenue Summary Intergovernmental Revenue Shared State Sales Tax - Half 2,000,004 2,000,004 2,000,000 2,000,000 2,000,000 2,000, % Total Intergovernmental Revenue 2,000,004 2,000,004 2,000,000 2,000,000 2,000,000 2,000, % Misc Revenues Interest Earnings ,972 3, , % Total Misc Revenues ,972 3, , % Total Revenue Summary 2,000,048 2,000,011 2,003,972 2,003,972 2,000,000 2,003, % Appropriations Transfers Out FFGFC Loan 71,529 71,188 71,234 71,234 71,234 73, % Sports Facility Sales Tax Debt 1,928,475 1,928,816 1,928,770 1,928,770 1,928,770 1,927,540 (0.06%) Total Transfers Out 2,000,004 2,000,004 2,000,004 2,000,004 2,000,004 2,000, % Total Appropriations 2,000,004 2,000,004 2,000,004 2,000,004 2,000,004 2,000, % Increase/(Decrease) in Fund Balance ,968 3,968 (4) 3,168 Beginning Balance 13,784 13,827 13,836 13,834 13,834 13,830 Adjustments (1) Ending Balance 13,827 13,834 17,804 17,802 13,830 16,998 Fund Summaries Page 20
26 City of St. Petersburg Budget Economic Development (1101) This fund accounts for revenue received for Brownfields Grant programs. This fund was closed in FY11. Appropriations Transfers Out General Capital Improvements 12, % Total Transfers Out 12, % Total Appropriations 12, % Increase/(Decrease) in Fund Balance (12,636) Beginning Balance 12, Adjustments Ending Balance This page is shown for historical purposes only. The City has received three Brownfield grants. The first grant ($200,000) was for an environmental assessment on the Dome Industrial Park (formerly the Business Retention Target Area). The second grant ($350,000) was the Brownfields Cleanup Revolving Loan (CURL) Program, which was intended to provide an incentive for commercial and industrial property owners to conduct environmental cleanups in the Dome Industrial Park area. These two grants were awarded from the U.S. Environmental Protection Agency. The third grant ($500,000) was a continuation of the Brownfields CURL Program and was provided by the State Office of Tourism, Trade and Economic Development (OTTED). Fund Summaries Page 21
27 City of St. Petersburg Budget Downtown Redevelopment District (1105) The Community Redevelopment Agency (CRA) was established under Florida Law to act as the Redevelopment Agency for all Redevelopment Districts. The St. Petersburg City Council is the governing body of the CRA and conducts business as the CRA in sessions that are separate from the regular Council meetings. State regulations require the inclusion of all dependent districts in local government budgets. The fund balance is the amount available for districts in the Downtown District. This fund accounts for revenue used to fund the debt service for outstanding Public Improvement Revenue Bonds. It was established in the Series 1988A Bonds. The district covers the city's waterfront from 7th Avenue North to Albert Whitted Airport in the south, and west to 16th Street. In FY12, the Community Redevelopment District Fund will be closed and the fund balance transferred into this fund. This fund will be reclassified as a Dependent District Fund. Revenue Summary Intergovernmental Revenue Shared Revenue ,482, % Total Intergovernmental Revenue ,482, % Misc Revenues Interest Earnings 80,935 19, ,153 32, % Total Misc Revenues 80,935 19, ,153 32, % Transfer In General Fund ,663, % Community Redevelopment District 8,213,827 6,712,750 6,703,500 6,703,500 7,318,245 0 (100.00%) Total Transfer In 8,213,827 6,712,750 6,703,500 6,703,500 7,318,245 4,663,442 (30.43%) Debt & Loan Proceeds Debt Proceeds 0 4,520, % Total Debt & Loan Proceeds 0 4,520, % Total Revenue Summary 8,294,762 11,252,748 6,703,500 6,703,500 7,348,398 8,178, % Appropriations Debt 0 36, % Transfers Out JP Morgan Chase Revenue Notes , , , % Banc Of America Notes Debt Service Fund 820, , , ,120 40,921 0 (100.00%) BB&T Notes 0 630, , ,396 40, , % Redevelopment Debt Service 6,680,875 6,713,240 6,703,500 6,703,500 6,703,500 0 (100.00%) General Capital Improvements 3,027,000 4,478, , % Total Transfers Out 10,528,854 12,643,189 8,169,124 8,169,124 7,039,369 1,904,248 (76.69%) Total Appropriations 10,528,854 12,679,935 8,169,124 8,169,124 7,039,369 1,904,248 (76.69%) Increase/(Decrease) in Fund Balance (2,234,092) (1,427,187) (1,465,624) (1,465,624) 309,029 6,274,028 Beginning Balance 4,883,854 2,649,762 1,885,695 1,223,961 1,223,961 1,532,990 Adjustments 0 1, Ending Balance 2,649,762 1,223, ,071 (241,663) 1,532,990 7,807,018 The transfer to the CIP in FY13 is for Plaza Parkway. Fund Summaries Page 22
28 City of St. Petersburg Budget Bayboro Harbor Tax Increment District (1106) The Community Redevelopment Agency (CRA) was established under Florida Law to act as the Redevelopment Agency for all Redevelopment Districts. The St. Petersburg City Council is the governing body of the CRA and conducts business as the CRA in sessions that are separate from the regular Council meetings. State regulations require the inclusion of all dependent districts in local government budgets. The fund balance is the amount available for districts in the Bayboro Harbor District. This fund receives the city and county tax increment financing (TIF) payments for the Bayboro Harbor District that is an established tax management district. The boundaries run along 4th Street south from 5th Avenue South to around 18th Avenue South. Prior to FY10, these TIF payments were recorded in the CRA Tax Increment Fund. The amount accumulated for this district was transferred in FY10. Revenue Summary Intergovernmental Revenue Shared Revenue 0 31,056 38,316 17,312 17,312 13,671 (64.32%) Total Intergovernmental Revenue 0 31,056 38,316 17,312 17,312 13,671 (64.32%) Misc Revenues Interest Earnings % Total Misc Revenues % Transfer In General Fund 0 37, ,004 21,004 16, % Community Redevelopment District 151, % Total Transfer In 151,556 37, ,004 21,004 16, % Total Revenue Summary 151,663 68,726 38,316 38,316 38,366 30,258 (21.03%) Increase/(Decrease) in Fund Balance 151,663 68,726 38,316 38,316 38,366 30,258 Beginning Balance 0 151, , , , ,754 Adjustments (1) Ending Balance 151, , , , , ,012 Fund Summaries Page 23
29 City of St. Petersburg Budget Intown West Tax Increment District (1107) The Community Redevelopment Agency (CRA) was established under Florida Law to act as the Redevelopment Agency for all Redevelopment Districts. The St. Petersburg City Council is the governing body of the CRA and conducts business as the CRA in sessions that are separate from the regular Council meetings. State regulations require the inclusion of all dependent districts in local government budgets. The fund balance is the amount available for districts in the Intown West District. This fund receives the city and county tax increment financing (TIF) payments for the Intown District that is an established tax management district. The boundaries run to the north and west of the Downtown District from Dr. MLK N to 18th Street. Prior to FY10, these TIF payments were recorded in the CRA Tax Increment Fund. The amount accumulated for this district was transferred in FY10. Revenue Summary Intergovernmental Revenue Shared Revenue 0 141, , , ,916 87,762 (59.35%) Total Intergovernmental Revenue 0 141, , , ,916 87,762 (59.35%) Misc Revenues Interest Earnings % Total Misc Revenues % Transfer In General Fund 0 171, , , , % Community Redevelopment District 502, % Total Transfer In 502, , , , , % Total Revenue Summary 502, , , , , ,246 (10.03%) Increase/(Decrease) in Fund Balance 502, , , , , ,246 Beginning Balance 0 502, , , ,733 1,059,062 Adjustments Ending Balance 502, ,733 1,031,644 1,031,645 1,059,062 1,253,308 Fund Summaries Page 24
30 City of St. Petersburg Budget Assessments Revenue (1108) This fund accounts for revenue from collection of principal and interest on special assessments for capital improvements. Revenue is transferred to the General Capital Improvement Fund after collection expenses are paid to provide funding for capital projects. Revenue Summary Misc Revenues Interest Earnings 32,445 31,430 15,888 15,888 25,000 31, % Special Assessment 184,011 97, , ,000 85, ,000 (28.57%) Misc Revenue 5,800 9, % Total Misc Revenues 222, , , , , ,000 (15.97%) Total Revenue Summary 222, , , , , ,000 (15.97%) Appropriations Services And Commodities 177, ,128 98,131 98,131 98,131 5,589 (94.30%) Total Appropriations 177, ,128 98,131 98,131 98,131 5,589 (94.30%) Increase/(Decrease) in Fund Balance 45,100 (27,746) 57,757 57,757 11, ,411 Beginning Balance 25,657 70,757 64,613 43,011 43,011 54,880 Adjustments Ending Balance 70,757 43, , ,768 54, ,291 The decrease in the charges to the special assessment fund are the result of changes in the way special assessment projects are billed which would increase revenue (to net against the charges) by increasing the current lien research fee from $35 to $55 for a combined utility lien and special assessment lien search and also implementing a lien filing fee for special assessment liens as is currently charged when filing utility liens. Customers with delinquent special assessment accounts would be required to pay a $35 fee to help cover the expenditures related to the administrative process and lien filing fee as is currently done for utility liens. Fund Summaries Page 25
31 City of St. Petersburg Budget Community Development Block Grant (1111) This fund accounts for annual entitlement grant funds from the U.S. Department of Housing and Urban Development (HUD) that provide community block grants to expand economic opportunities, and provide decent housing and a suitable living environment principally for low- and moderate-income earning persons. Revenue Summary Intergovernmental Revenue Federal Grants 2,273,166 2,250,870 1,992,593 2,429,073 2,193,209 1,565,253 (21.45%) Total Intergovernmental Revenue 2,273,166 2,250,870 1,992,593 2,429,073 2,193,209 1,565,253 (21.45%) Fines And Forfeitures Violation Of Local Ordinances 1, % Total Fines And Forfeitures 1, % Misc Revenues Interest Earnings 4, ,972 3,972 1,056 3, % Rents And Royalties 22,983 22, , % Misc Revenue 108,059 54,053 96,028 96, ,000 96, % Total Misc Revenues 135,374 77, , , , , % Total Revenue Summary 2,409,630 2,329,321 2,092,593 2,529,073 2,297,025 1,665,253 (20.42%) Appropriations Wages And Benefits 808, , , , , ,762 (24.41%) Services And Commodities 734, , , , , ,606 (17.03%) Capital (10,689) 0 0 (10,689) % Grants And Aid 8, % Transfers Out General Fund 0 272, , , , ,314 (21.45%) Franchise Tax Revenue 558, % Excise Tax Revenue 0 270, % JP Morgan Chase Revenue Notes ,960 47, % Banc Of America Notes Debt Service Fund 283, , , , , ,147 (30.87%) Total Transfers Out 841, , , , , ,491 (18.83%) Total Appropriations 2,382,453 2,367,517 2,092,593 2,529,073 2,398,082 1,663,859 (20.49%) Increase/(Decrease) in Fund Balance 27,177 (38,196) 0 0 (101,057) 1,394 Beginning Balance (15,801,794) 149,733 2,436,625 99,663 99,663 (1,394) Adjustments 15,924,350 (11,874) Ending Balance 149,733 99,663 2,436,625 99,663 (1,394) 0 The transfer to the General Fund is the repayment of funds advanced for the Jordan School Improvements project. The amount of the loan repayment is capped at 25% of the current year grant revenue. There are scheduled installments in FY13 and FY14, and if necessary in FY15 until the loan is paid off. These payments will be made from available grant revenue in those years. Fund Summaries Page 26
32 City of St. Petersburg Budget Emergency Shelter Grant Fund (1112) This fund accounts for grant revenue from the U. S. Department of Housing and Urban Development to provide homeless persons with basic shelter and essential supportive services by assisting with the operational costs of the shelter facilities. Revenue Summary Intergovernmental Revenue Federal Grants 0 94,327 97, , , , % Total Intergovernmental Revenue 0 94,327 97, , , , % Total Revenue Summary 0 94,327 97, , , , % Appropriations Wages And Benefits 0 4,862 4,851 8,945 8,945 12, % Services And Commodities 0 89,466 92, , , , % Total Appropriations 0 94,328 97, , , , % Increase/(Decrease) in Fund Balance 0 (1) 0 (54,584) 0 0 Beginning Balance , Adjustments Ending Balance ,763 (54,584) 0 0 The available grant revenue is spent each year. Fund Summaries Page 27
33 City of St. Petersburg Budget Home Program (1113) This fund accounts for grant revenue from the U.S. Department of Housing and Urban Development that provides resources to fulfill the City's Consolidated Plan initiatives that assist low- and moderate-income earning persons in meeting their affordable housing needs. Revenue Summary Intergovernmental Revenue Federal Grants 2,204,739 1,192,628 1,229,023 3,851, , ,005 (41.58%) Total Intergovernmental Revenue 2,204,739 1,192,628 1,229,023 3,851, , ,005 (41.58%) Fines And Forfeitures Violation Of Local Ordinances % Total Fines And Forfeitures % Misc Revenues Interest Earnings 21,921 17, ,344 5, % Misc Revenue 214, , , , , ,000 (27.50%) Total Misc Revenues 236, , , , , ,000 (25.00%) Total Revenue Summary 2,442,370 1,452,335 1,429,023 4,051, , ,005 (39.26%) Appropriations Wages And Benefits 156, , , , ,698 85,698 (41.66%) Services And Commodities 2,235,571 1,372,376 1,272,121 3,744, , ,204 (39.30%) Grants And Aid ,000 10, , % Total Appropriations 2,392,248 1,524,245 1,429,023 4,051, , ,902 (39.27%) Increase/(Decrease) in Fund Balance 50,122 (71,910) 0 0 3, Beginning Balance 15,820 68,545 1,923,699 (3,252) (3,252) (103) Adjustments 2, Ending Balance 68,545 (3,252) 1,923,699 (3,252) (103) 0 The available grant revenue is spent each year. The fund balance in the prior years has been adjusted to reflect the latest information from the city's financial system. Fund Summaries Page 28
34 City of St. Petersburg Budget Neighborhood Stabilization Program (1114) This fund is used to account for funds received from the U.S. Department of Housing and Urban Development to assist local governments to address the effects of abandoned and foreclosed properties. The uses of these funds are to establish financing mechanisms, purchase and rehabilitate abandoned and foreclosed homes, establish land banks for homes that have been foreclosed, demolish blighted structures, and redevelop demolished or vacant properties. Revenue Summary Intergovernmental Revenue Federal Grants 4,257,045 1,964, ,041,342 1,562, % Total Intergovernmental Revenue 4,257,045 1,964, ,041,342 1,562, % Misc Revenues Interest Earnings % Sale Of Fixed Assets 79, , , , % Misc Revenue ,000 1, % Total Misc Revenues 79, , , , % Transfer In General Fund 0 360, % Total Transfer In 0 360, % Total Revenue Summary 4,336,332 3,125, ,041,342 1,913, , % Appropriations Wages And Benefits 372, , ,000 30, % Services And Commodities 2,841,402 2,643, ,897,342 1,550, , % Capital 1,790,275 13, % Transfers Out General Fund 0 216, , , % Total Transfers Out 0 216, , , % Total Appropriations 5,004,446 3,096, ,041,342 1,943, , % Increase/(Decrease) in Fund Balance (668,114) 29, (29,691) 0 Beginning Balance (21,720) (397,032) 704,809 29,691 29,691 0 Adjustments 292, , Ending Balance (397,032) 29, ,809 29, The available grant revenue is spent each year, and any unused funds will be rolled over into the next year. Fund Summaries Page 29
35 City of St. Petersburg Budget Miscellaneous Trust Funds (1115) This fund is an aggregate of many diverse trust funds. Proceeds from each fund can only be used for the specific purpose of the trust. Revenue Summary Appropriations Services And Commodities 426, ,591 1,500,000 1,500,000 1,500,000 1,500,000 0% Total Appropriations 830, ,764 1,500,000 1,500,000 1,500,000 1,500,000 0% Miscellaneous Revenue Miscellaneous Revenue 830, ,764 1,500,000 1,500,000 1,500,000 1,500,000 0% Total Miscellaneous Revenue 830, ,764 1,500,000 1,500,000 1,500,000 1,500,000 0% Total Revenue Summary Appropriations 830, ,764 1,500,000 1,500,000 1,500,000 1,500,000 0% Increase/(Decrease) in Fund Balance Beginning Balance Adjustments Ending Balance Fund Summaries Page 30
36 City of St. Petersburg Budget Community Housing Donation (1117) This fund was established in FY07 (Pinellas County Ordinance 06-28) with grant funding from Pinellas County. The purpose is to fund multi-family housing for low- to moderate-income earning persons and permanent rental housing for those with special needs. Revenue Summary Intergovernmental Revenue Grants From Other Local Units , % Total Intergovernmental Revenue , % Misc Revenues Interest Earnings 1,730 (124,739) ,000 20, % Total Misc Revenues 1,730 (124,739) ,000 20, % Total Revenue Summary 1,730 (124,739) 0 967,526 12,000 20, % Appropriations Wages And Benefits 62,085 25, ,220 20, % Services And Commodities 1,525, , ,526 20, % Total Appropriations 1,587, , ,526 42,020 20, % Increase/(Decrease) in Fund Balance (1,586,247) (1,068,681) 0 0 (30,020) 0 Beginning Balance 2,993,226 1,406,979 1,053, , , ,278 Adjustments Ending Balance 1,406, ,298 1,053, , , ,278 This fund has no new funding other than the $20,000 for estimated interest earnings which is applied to salaries and benefits. The existing funding will be rollover funding. Also, at the present time, there are no projects designated for this funding. The rollover funding will be designated for projects at some point in the future. Fund Summaries Page 31
37 City of St. Petersburg Budget Building Permit Special Revenue (1151) This fund was established in FY08 to isolate the building permit revenues and expenses in accordance with the Florida building code (F.S ). Revenue Summary License And Permits Contractors Permits 2,775,690 2,826,561 2,631,000 2,631,000 3,168,563 3,123, % Other License And Permits 0 0 6,000 6, , % Total License And Permits 2,775,690 2,826,561 2,637,000 2,637,000 3,168,563 3,129, % Charges For Services General Government 434, , , , , , % Transportation Charges (205) % Total Charges For Services 433, , , , , , % Misc Revenues Interest Earnings 479 (53,734) % Sale Of Fixed Assets , % Misc Revenue % Total Misc Revenues 489 (53,695) 0 0 7, % Total Revenue Summary 3,210,161 3,333,805 3,051,000 3,051,000 3,350,342 3,543, % Appropriations Wages And Benefits 2,895,434 2,845,735 2,878,267 2,878,267 2,766,476 2,928, % Services And Commodities 473, , , , , , % Capital % Total Appropriations 3,369,230 3,471,891 3,485,604 3,486,081 3,388,405 3,539, % Increase/(Decrease) in Fund Balance (159,069) (138,086) (434,604) (435,081) (38,063) 3,809 Beginning Balance 815, , , , , ,119 Adjustments Ending Balance 656, , ,042 84, , ,928 Starting in FY13, 20% of the Planning and Economic Development Director's salaries and benefits will be paid out of the Building Permit Special Revenue Fund. Fund Summaries Page 32
38 City of St. Petersburg Budget Mahaffey Theater Operating (1201) This fund accounts for the operation of the Mahaffey Theater at the Progress Energy Center for the Arts and is subsidized by the General Fund. Revenue Summary Charges For Services Transportation Charges 241, , , , , ,230 (6.70%) Culture And Recreation Charges 2,271,337 1,891,345 1,994,653 1,994,653 2,259,969 1,671,377 (16.21%) Total Charges For Services 2,513,253 2,220,446 2,248,908 2,248,908 2,575,922 1,908,607 (15.13%) Misc Revenues Interest Earnings 3,292 22,494 1,343 1, , % Contributions And Donations , , ,000 (10.83%) Misc Revenue 214, , , , , , % Total Misc Revenues 218, , , , , , % Transfer In General Fund 965,700 1,016, , , , ,520 (24.10%) Total Transfer In 965,700 1,016, , , , ,520 (24.10%) Internal Charges Other Charges (475) % Total Internal Charges (475) % Total Revenue Summary 3,696,561 3,723,053 3,528,544 3,528,544 3,528,542 3,103,034 (12.06%) Appropriations Wages And Benefits 904, ,082 1,010,635 1,010,635 1,010,635 1,138, % Services And Commodities 2,745,585 2,779,403 2,521,764 2,521,764 2,508,556 2,090,908 (17.09%) Capital 14, , % Total Appropriations 3,664,544 3,727,485 3,532,399 3,532,399 3,524,754 3,229,514 (8.57%) Increase/(Decrease) in Fund Balance 32,017 (4,432) (3,855) (3,855) 3,788 (126,480) Beginning Balance 70,607 90,112 4, , , ,480 Adjustments (12,512) 37, Ending Balance 90, , , ,480 0 The Mahaffey Foundation has made a commitment of $400,000 for. This will be used to offer new events and increase marketing to establish the brand throughout the area. The amount of subsidy required for the Mahaffey Theater fund for FY13 is reduced by the favorable impact of $126,000 funding anticipated to be available from the Mahaffey fund balance. Fund Summaries Page 33
39 City of St. Petersburg Budget Pier Operating (1203) The Pier Operating Fund accounts for the operation of the downtown waterfront retail/restaurant complex and is subsidized by the General Fund. Revenue Summary Charges For Services Culture And Recreation Charges 491, , , , , ,002 (36.19%) Total Charges For Services 491, , , , , ,002 (36.19%) Misc Revenues Rents And Royalties 727, , , , , ,150 (47.49%) Misc Revenue 61,630 (73,808) 47,511 47,511 11,792 22,874 (51.86%) Total Misc Revenues 788, , , , , ,024 (47.78%) Transfer In General Fund 1,427,000 1,207,000 1,399,000 1,399,000 1,346,000 1,260,000 (9.94%) Total Transfer In 1,427,000 1,207,000 1,399,000 1,399,000 1,346,000 1,260,000 (9.94%) Total Revenue Summary 2,707,541 2,254,335 2,372,708 2,372,708 2,351,041 1,797,026 (24.26%) Appropriations Wages And Benefits 747, , , , , ,501 (28.90%) Services And Commodities 2,067,726 1,687,553 1,709,265 1,709,287 1,680,717 1,331,806 (22.08%) Capital 9, % Total Appropriations 2,824,783 2,308,970 2,373,869 2,373,891 2,345,321 1,804,307 (23.99%) Increase/(Decrease) in Fund Balance (117,242) (54,635) (1,161) (1,183) 5,720 (7,281) Beginning Balance 150,447 56,937 10,032 1,777 1,777 7,497 Adjustments 23,732 (525) Ending Balance 56,937 1,777 8, , The pier is scheduled to close on May 31, 2013 with an additional 45 day wind down period to get it ready for construction of a new pier. Fund Summaries Page 34
40 City of St. Petersburg Budget Coliseum Operating (1205) The Coliseum Operating Fund accounts for the operation of the historic ballroom/exhibit hall and is subsidized by the General Fund. Revenue Summary Charges For Services Transportation Charges ,000 34, (100.00%) Culture And Recreation Charges 501, , , , , , % Total Charges For Services 501, , , , , , % Misc Revenues Interest Earnings ,390 1, (100.00%) Contributions And Donations 0 1, % Misc Revenue ,184 (1,384) % Total Misc Revenues 384 1,077 1,390 2,574 (1,384) 0 (100.00%) Transfer In General Fund 232, , , , , , % Total Transfer In 232, , , , , , % Internal Charges Other Charges (1) % Total Internal Charges (1) % Total Revenue Summary 734, , , , , , % Appropriations Wages And Benefits 488, , , , , , % Services And Commodities 302, , , , , , % Total Appropriations 791, , , , , , % Increase/(Decrease) in Fund Balance (57,218) (3,529) 2,151 1,864 1,864 0 Beginning Balance 55,742 3,599 (1,452) (1,864) (1,864) 0 Adjustments 5,075 (1,934) Ending Balance 3,599 (1,864) There will be two tea dances eliminated in June and two in July. There will still be 16 tea dances at the Coliseum during the year. Fund Summaries Page 35
41 City of St. Petersburg Budget Sunken Gardens (1207) The Sunken Gardens Fund accounts for the operation of the historic botanical gardens and is subsidized by the General Fund. Revenue Summary Charges For Services Culture And Recreation Charges 593, , , , , ,000 (0.30%) Total Charges For Services 593, , , , , ,000 (0.30%) Misc Revenues Interest Earnings ,307 1, (100.00%) Rents And Royalties 11, % Contributions And Donations 844 2,199 1,000 1, , % Misc Revenue ,963 25,820 3, % Total Misc Revenues 12,656 2,485 2,407 6,270 26,093 4, % Transfer In General Fund 222, , , , , , % Total Transfer In 222, , , , , , % Internal Charges Other Charges (199) % Total Internal Charges (199) % Total Revenue Summary 828, , , , , , % Appropriations Wages And Benefits 478, , , , , , % Services And Commodities 394, , , , , , % Capital 1, % Total Appropriations 874, , , , , , % Increase/(Decrease) in Fund Balance (45,938) (14,061) ,109 (3) Beginning Balance 41,357 14,980 6,935 (4,106) (4,106) 3 Adjustments 19,561 (5,025) Ending Balance 14,980 (4,106) 7,194 (3,847) 3 0 The expenses will increase 4.17% due to increased costs in utilities, marketing, and ground maintenance. Fund Summaries Page 36
42 City of St. Petersburg Budget Tropicana Field (1208) The Tropicana Field Fund accounts for the operation of the domed baseball stadium and is subsidized by the General Fund. Revenue Summary Charges For Services Transportation Charges ,665 24, (100.00%) Culture And Recreation Charges 1,131, ,747 1,110,038 1,110, ,880 1,179, % Total Charges For Services 1,131, ,747 1,134,703 1,134, ,880 1,179, % Misc Revenues Interest Earnings (98.93%) Total Misc Revenues (98.93%) Transfer In General Fund 1,102,000 1,480,335 1,250,000 1,250,000 1,384,000 1,236,000 (1.12%) Total Transfer In 1,102,000 1,480,335 1,250,000 1,250,000 1,384,000 1,236,000 (1.12%) Total Revenue Summary 2,233,382 2,402,086 2,385,641 2,385,641 2,379,880 2,415, % Appropriations Wages And Benefits 758, , , , , , % Services And Commodities 1,708,581 1,626,404 1,673,904 1,673,904 1,732,936 1,649,616 (1.45%) Total Appropriations 2,467,268 2,367,470 2,421,227 2,421,227 2,415,144 2,414,716 (0.27%) Increase/(Decrease) in Fund Balance (233,886) 34,616 (35,586) (35,586) (35,264) 344 Beginning Balance 234, ,035 35,073 35,073 (191) Adjustments Ending Balance , (513) (191) 153 Fund Summaries Page 37
43 City of St. Petersburg Budget Community Redevelopment District (1301) The Community Redevelopment Agency (CRA) was established under Florida Law to act as the Redevelopment Agency for all Redevelopment Districts. The St. Petersburg City Council is the governing body of the CRA and conducts business as the CRA in sessions that are separate from the regular Council meetings. State regulations require the inclusion of all dependent districts in local government budgets. The fund balance is the amount available for districts in the Downtown District. Prior to FY10, this fund received the city and county tax increment financing (TIF) payments for all Redevelopment districts that are established tax management districts. The Downtown District monies were then transferred to the Redevelopment Special Revenue Fund; where they were further transferred to the Public Improvement Debt Service Fund to pay principal and interest on TIF bond issues. Beginning in FY10, this fund will only receive the Downtown District monies. Separate funds have been established to receive the TIF payments for the other districts. Revenue Summary Intergovernmental Revenue Shared Revenue 8,843,107 3,606,742 7,965,737 3,967,540 3,296,678 0 (100.00%) Total Intergovernmental Revenue 8,843,107 3,606,742 7,965,737 3,967,540 3,296,678 0 (100.00%) Misc Revenues Interest Earnings 3,064 2,818 7,944 7,944 2,000 0 (100.00%) Total Misc Revenues 3,064 2,818 7,944 7,944 2,000 0 (100.00%) Transfer In General Fund 0 4,374, ,998,197 3,998, % Total Transfer In 0 4,374, ,998,197 3,998, % Total Revenue Summary 8,846,171 7,984,120 7,973,681 7,973,681 7,296,875 0 (100.00%) Appropriations Transfers Out Downtown Redevelopment District 8,213,827 6,712,750 6,703,500 6,703,500 7,318,245 0 (100.00%) Bayboro Harbor Tax Increment District 151, % Intown West Tax Increment District 502, % General Capital Improvements 2,480, ,250,000 1,250, % Total Transfers Out 11,347,559 6,712,750 6,703,500 7,953,500 8,568,245 0 (100.00%) Total Appropriations 11,347,559 6,712,750 6,703,500 7,953,500 8,568,245 0 (100.00%) Increase/(Decrease) in Fund Balance (2,501,388) 1,271,370 1,270,181 20,181 (1,271,370) 0 Beginning Balance 2,501, ,270,738 1,271,370 1,271,370 0 Adjustments Ending Balance 0 1,271,370 2,540,919 1,291, This fund will be closed in FY12 and the fund balance transferred to the Downtown Redevelopment Fund. The transfers to the CIP in FY12 are for the Pier and Plaza Parkway projects. Fund Summaries Page 38
44 City of St. Petersburg Budget Police Grant Fund (1702) This fund was established in FY10 to receive funds through the Edward Byrne Memorial Justice Assistance Grant Program (JAG). JAG funding is required to be accounted for in a separate trust fund account. JAG funds support a range of program areas including law enforcement, prosecution and court, prevention and education, corrections and community corrections, drug treatment and enforcement, planning, evaluation, technology improvement, and crime victim and witness initiatives. Revenue Summary Intergovernmental Revenue Federal Grants 680, , , % Total Intergovernmental Revenue 680, , , % Misc Revenues Interest Earnings % Total Misc Revenues % Total Revenue Summary 681, , , % Appropriations Wages And Benefits 629, , , , ,294 34,508 (93.55%) Services And Commodities 42,657 47,780 12, ,225 86,698 0 (100.00%) Grants And Aid 13,585 14, ,980 1, % Total Appropriations 686, , , , ,992 34,508 (93.70%) Increase/(Decrease) in Fund Balance (4,470) (7,055) (548,042) (856,576) 300,864 (34,508) Beginning Balance 0 7, , ,706 Adjustments 12, Ending Balance 7, ,108 (855,734) 301, ,198 The three year Edward Byrne Memorial Justice Assistance Grant ($1,303,348) ends in FY12. The grant funded one full-time Information Clerk II ($37,474), three full-time Emergency Complaint Writers ($154,801), one full-time Office Systems Specialist ($43,215), one full-time Data Entry Operator I ($42,770), one fulltime Police Investigative Assistant ($69,515), two full-time Crime Analysts ($101,951), and one full-time Intelligence Analyst ($58,870). One Crime Analyst position, one Intelligence Analyst position, and one Office Systems Specialist position are being eliminated in FY13. The remaining seven positions will be added to the General Fund. During FY12, a supplemental appropriation was approved for the FY11 Edward Byrne Memorial Justice Assistance Grant ($190,603). Fund Summaries Page 39
45 City of St. Petersburg Budget Arts in Public Places (1901) This fund is used to account for transfers from capital improvement projects for public art. Certain capital improvement construction projects within the city are required by ordinance to make transfers to the Arts in Public Places Fund. The amount to be transferred is equal to 1% of the project's construction costs up to $2,500,000 and 0.5% for costs between $2,500,000 and $7,500,000 with a maximum transfer of $50,000. Revenue Summary Misc Revenues Interest Earnings % Total Misc Revenues % Transfer In General Capital Improvements 31, % Public Safety Capital Improvement 29, ,000 30, % Recreation & Culture Capital 13,250 36, ,500 15, % City Facilities Capital Improvement 3, % Water Resource Capital Projects 0 25, % Total Transfer In 78,060 61, ,500 45, % Total Revenue Summary 78,325 61, ,500 45, % Appropriations Services And Commodities 83, , , % Total Appropriations 83, , , % Increase/(Decrease) in Fund Balance (5,579) (90,252) 0 45,500 36,100 0 Beginning Balance 295, , , , ,007 Adjustments Ending Balance 290, , , , ,007 Each year, transfers are made into this fund for any projects that are eligible for public art. Fund Summaries Page 40
46 City of St. Petersburg Budget JP Morgan Chase Revenue Notes (2010) This fund was established in December 2011 on resolution and is used to record debt service to refund the city's outstanding non-ad valorem revenue note, series 2008A. The debt has a final maturity date of February Revenue Summary Transfer In Downtown Redevelopment District , , % Community Development Block Grant ,960 47, % Banc Of America Notes Debt Service Fund , , % Total Transfer In , , , % Debt & Loan Proceeds Debt Proceeds ,522,000 21,522, % Total Debt & Loan Proceeds ,522,000 21,522, % Total Revenue Summary ,952,000 22,213, , % Appropriations Debt , ,507 1,228, % Transfers Out Banc Of America Notes Debt Service Fund ,500,000 21,039, % Total Transfers Out ,500,000 21,039, % Total Appropriations ,794,000 21,538,072 1,228, % Increase/(Decrease) in Fund Balance , ,562 (246,995) Beginning Balance ,562 Adjustments Ending Balance , , ,567 Fund Summaries Page 41
47 City of St. Petersburg Budget FFGFC Loan (2011) This fund was established in Series 1987A, B and C Bonds. Bond debt in this fund has supported improvements for General Government, the Bayfront Center, Pier, and Tropicana Field. In FY96, additional funding was added to pay $ million in notes issued (along with Pro Sports Sales Tax Bonds) which were used to make Tropicana Field baseball ready. In FY97, $6.350 million was added to replace the air-conditioning system at Tropicana Field. In FY98, $2.815 million was added for a city-wide telephone switch, $1.770 million for new parking meter system, and $8 million of previous FFGFC notes were refinanced. In FY01, the callable portions of the 1996 and 1997 bonds were refinanced using $ million in commission notes, significantly lowering the debt requirements. In April 2007, $7.43 million in notes were issued for the Marina, repaying the $3.775 million balance of a 2006 SSGFC Marina Improvement Loan and adding $3.5 million for the construction of a new Marina pier. These notes and the associated debt service are reflected and budgeted in the Marina Operating Fund. In FY 2009, the final payment was made on the original unrefunded portion of the 1996 FFGFC Note. Beginning in FY10, debt service payments are for the 2001 Refunding Notes and the Marina Notes. Revenue Summary Misc Revenues Interest Earnings % Total Misc Revenues % Transfer In General Fund 2,625,421 2,629,377 2,635,316 2,635,316 2,637,561 2,625,836 (0.36%) Pro Sports Facility 71,529 71,188 71,234 71,234 70,289 73, % Total Transfer In 2,696,950 2,700,565 2,706,550 2,706,550 2,707,850 2,699,100 (0.28%) Total Revenue Summary 2,697,022 2,700,601 2,706,550 2,706,550 2,707,858 2,699,100 (0.28%) Appropriations Debt 2,697,021 2,700,602 2,706,550 2,706,550 2,707,858 2,699,100 (0.28%) Total Appropriations 2,697,021 2,700,602 2,706,550 2,706,550 2,707,858 2,699,100 (0.28%) Increase/(Decrease) in Fund Balance 1 (1) Beginning Balance 0 1 6, Adjustments Ending Balance 1 0 6, Fund Summaries Page 42
48 City of St. Petersburg Budget Banc of America Notes Debt Service Fund (2013) This debt fund, created in Resolution , to refinance the Sunshine State Governmental Financing Commission Notes, is used to record debt service payments for the Florida International Museum and the Mahaffey Theater. Revenue Summary Misc Revenues Interest Earnings (100.00%) Total Misc Revenues (100.00%) Transfer In General Fund , % Downtown Redevelopment District 820, , , ,228 40,921 0 (100.00%) Community Development Block Grant 283, , , , , ,147 (30.87%) JP Morgan Chase Revenue Notes ,500,000 21,039, % Total Transfer In 1,104,074 1,106,211 1,105,511 22,605,511 21,497, ,147 (82.35%) Total Revenue Summary 1,104,636 1,106,450 1,106,011 22,606,011 21,498, ,147 (82.36%) Appropriations Debt 1,173,020 1,178,269 1,181,512 22,417,512 21,967, ,147 (83.48%) Transfers Out JP Morgan Chase Revenue Notes , % Total Transfers Out , % Total Appropriations 1,173,020 1,178,269 1,181,512 22,847,512 21,967, ,147 (83.48%) Increase/(Decrease) in Fund Balance (68,384) (71,819) (75,501) (241,501) (469,824) 0 Beginning Balance 610, , , , ,824 0 Adjustments Ending Balance 541, , , , Fund Summaries Page 43
49 City of St. Petersburg Budget BB&T Notes (2014) This debt fund was created in December 2010 and is used to record debt service payments for on-going projects at the Progress Energy Center for the Arts, the Pier, and grant funds for the Salvador Dali Museum. It is scheduled to be paid in Revenue Summary Misc Revenues Interest Earnings % Total Misc Revenues % Transfer In Downtown Redevelopment District 0 630, , , , % Total Transfer In 0 630, , , , % Total Revenue Summary 0 630, , , , % Appropriations Debt 0 28, , , , , % Total Appropriations 0 28, , , , , % Increase/(Decrease) in Fund Balance 0 601, (601,556) 0 Beginning Balance , ,556 0 Adjustments Ending Balance 0 601, , Fund Summaries Page 44
50 City of St. Petersburg Budget Utility Tax Debt Service (2021) Utility Tax Revenue Bonds were issued on a number of occasions between 1977 and 1988 to provide resources for general purpose capital projects including neighborhood streets and drainage, streets and drainage for newly annexed areas, acquisition of property for expansion of the University of South Florida St. Petersburg Campus, and numerous other city services and general governmental facilities. The fund was established in the Series 1986 Bonds. Revenue Summary Misc Revenues Interest Earnings % Total Misc Revenues % Transfer In Utility Tax Revenue 1,881, % Total Transfer In 1,881, % Total Revenue Summary 1,882, % Appropriations Debt 2,824, % Total Appropriations 2,824, % Increase/(Decrease) in Fund Balance (941,500) Beginning Balance 941, Adjustments Ending Balance This debt was paid off in FY10 and is presented for historical purposes. Fund Summaries Page 45
51 City of St. Petersburg Budget Stadium Debt Service (2025) This fund was established in the Series 1984 Bonds. Excise Tax Secured Revenue Bonds ($85 million) were issued in 1987 to construct a multi-purpose domed stadium (Tropicana Field) in St. Petersburg. $114 million of refunding excise tax bonds were issued in October 1993 to refund the remaining outstanding 1984 Excise Tax Secured Revenue Bonds and the 1989B Public Improvement Revenue Bond issue. The 1993 refunding Excise Tax Bonds are secured by a pledge of the city's guaranteed entitlement of Municipal Revenue Sharing, the city's Half-Cent Sales Tax, and a portion of Pinellas County Tourist Development Taxes. This debt was remarketed in 2003 to yield a net savings to the city of $3.544 million in FY04. Debt Service requirements run through FY16. Revenue Summary Intergovernmental Revenue Shared State Revenue Sharing 0 3,125, ,125,855 3,125, % Shared State Sales Tax - Half 0 424,425 7,030,423 7,030, , ,528 (93.31%) Shared Revenue 0 4,977,610 1,462,477 1,462,477 4,900,000 4,900, % Total Intergovernmental Revenue 0 8,527,857 8,492,900 8,492,900 8,498,463 8,496, % Misc Revenues Interest Earnings 291, , , , , ,036 (33.32%) Total Misc Revenues 291, , , , , ,036 (33.32%) Transfer In Excise Tax Revenue 8,541, % Total Transfer In 8,541, % Total Revenue Summary 8,832,667 8,729,040 8,792,880 8,792,880 8,698,533 8,696,386 (1.10%) Appropriations Debt 8,397,033 8,386,833 8,375,019 8,375,019 8,375,569 8,367,408 (0.09%) Transfers Out Water Cost Stabilization 242, , , , , ,000 (38.78%) Total Transfers Out 242, , , , , ,000 (38.78%) Total Appropriations 8,639,906 8,537,095 8,620,019 8,620,019 8,525,569 8,517,408 (1.19%) Increase/(Decrease) in Fund Balance 192, , , , , ,978 Beginning Balance 7,231,220 7,423,981 7,405,671 7,615,929 7,615,929 7,788,893 Adjustments Ending Balance 7,423,981 7,615,929 7,578,532 7,788,790 7,788,893 7,967,871 $8.996 million was transferred into this fund from the Water Cost Stabilization Funds in FY08 as a reserve for the Excise Tax Debt as a result of the bond surety being downgraded in FY08. The interest on these funds will be transferred back into the Water Cost Stabilization Fund for eventual transfer to the Water Resources operations. Fund Summaries Page 46
52 City of St. Petersburg Budget Sports Facility Sales Tax Debt (2027) This fund was established in 1995 with the Series 1995 Bonds for principal and interest payments on the $ million Professional Sports Facility Sales Tax Revenue Bonds used for modifications to Tropicana Field; it is supported by State Sales Tax revenues earmarked for sports facilities under Florida Statutes Chapter 166, Section (6)(g) 5.A and Section In 2003, the 1995 bond issue was refinanced using the $ million Professional Sports Facility Sales Tax refinancing revenue bonds. Revenue Summary Misc Revenues Interest Earnings (53.64%) Total Misc Revenues (53.64%) Transfer In Pro Sports Facility 1,928,475 1,928,816 1,928,770 1,928,770 1,928,770 1,926,740 (0.11%) Total Transfer In 1,928,475 1,928,816 1,928,770 1,928,770 1,928,770 1,926,740 (0.11%) Total Revenue Summary 1,929,250 1,929,190 1,929,525 1,929,525 1,929,066 1,927,090 (0.13%) Appropriations Debt 1,912,244 1,914,490 1,911,587 1,911,587 1,472,802 1,911,078 (0.03%) Total Appropriations 1,912,244 1,914,490 1,911,587 1,911,587 1,472,802 1,911,078 (0.03%) Increase/(Decrease) in Fund Balance 17,006 14,700 17,938 17, ,264 16,012 Beginning Balance 1,457,619 1,474,625 1,481,745 1,489,325 1,489,325 1,945,589 Adjustments Ending Balance 1,474,625 1,489,325 1,499,683 1,507,263 1,945,589 1,961,601 Fund Summaries Page 47
53 City of St. Petersburg Budget Redevelopment Debt Service (2035) These bonds were issued in 1985 as part of a multi-year program to provide infrastructure improvements, including parking facilities, in the Downtown Redevelopment Area in accordance with interlocal agreements between the city, the Community Redevelopment Agency (CRA), and Pinellas County. The 1984 and 1985 issues were refinanced during FY88; a new $9.8 million issue (1989A) was made in March 1989, and a new $22.5 million issue (1989B) occurred in August 1989 for improvements to Tropicana Field. All outstanding issues except Series 1989B were refinanced in The 1989B issue was refunded with issue proceeds from the 1993 Excise Tax Refunding Bond issue dated October Debt service for the new issue (Series 1992) runs through FY12. Revenue Summary Misc Revenues Interest Earnings % Total Misc Revenues % Transfer In Downtown Redevelopment District 6,680,875 6,713,240 6,703,500 6,703,500 6,703,500 0 (100.00%) Total Transfer In 6,680,875 6,713,240 6,703,500 6,703,500 6,703,500 0 (100.00%) Total Revenue Summary 6,680,875 6,713,250 6,703,500 6,703,500 6,703,500 0 (100.00%) Appropriations Debt 6,680,875 6,713,250 6,703,500 6,703,500 6,703,500 0 (100.00%) Total Appropriations 6,680,875 6,713,250 6,703,500 6,703,500 6,703,500 0 (100.00%) Increase/(Decrease) in Fund Balance Beginning Balance Adjustments Ending Balance This fund was paid off in 2012 and is presented for historical purposes. Fund Summaries Page 48
54 City of St. Petersburg Budget Water Resources (4001) The Water Resources Operating Fund, like all other Enterprise Funds, is used to account for costs that are funded substantially by external (non-city department) user fees and charges. The fund is required to cover all expenses of the operation (salaries, benefits, services, commodities, and capital outlay) and allocation of general and administrative costs, payment-in-lieu-of-taxes, as well as any transfers to capital project funds, debt service funds, or return on investment/equity. Its use is governed by City Code Article 1, Section Revenue Summary Intergovernmental Revenue Grants From Other Local Units 72, , , ,000 75, , % Total Intergovernmental Revenue 72, , , ,000 75, , % Charges For Services General Government % Physical Environment Charges 90,827,710 95,727, ,512, ,512,200 97,991, ,113, % Other Charges For Services 6, , , , % Total Charges For Services 90,834,010 95,861, ,512, ,512,200 98,143, ,263, % Misc Revenues Interest Earnings 558,149 (573,957) 120, , , ,000 (0.39%) Rents And Royalties 13,244 13,248 15,000 15,000 12,000 10,000 (33.33%) Sale Of Fixed Assets 115, ,509 60,000 60,000 45,114 60, % Sale Of Surplus Material 66,979 76,701 50,000 50,000 78,000 50, % Misc Revenue (266,970) (98,006) (250,000) (250,000) (311,626) (250,000) 0.00% Total Misc Revenues 486,757 (429,505) (4,531) (4,531) (29,078) (10,000) % Transfer In General Fund ,000 35, % Water Cost Stabilization 2,994,316 2,752,806 1,500,000 1,500,000 2,300,000 1,500, % Total Transfer In 2,994,316 2,752,806 1,500,000 1,535,000 2,335,000 1,500, % Internal Charges Other Charges (797) % Total Internal Charges (797) % Total Revenue Summary 94,387,596 98,285, ,107, ,142, ,523, ,903, % Appropriations Wages And Benefits 21,918,184 22,231,843 22,328,835 22,328,835 22,904,933 22,833, % Services And Commodities 59,636,886 58,781,034 60,370,026 60,892,978 59,799,210 62,321, % Capital 145, , , , , ,161 (48.38%) Transfers Out Water Resources Debt 14,922,808 15,732,127 17,130,250 17,130,250 17,130,250 19,445, % Water Resource Capital Projects 3,000,000 3,218,000 3,000,000 3,000,000 3,000,000 3,000, % Total Transfers Out 17,922,808 18,950,127 20,130,250 20,130,250 20,130,250 22,445, % Total Appropriations 99,623, ,320, ,073, ,750, ,214, ,726, % Increase/(Decrease) in Fund Balance (5,235,706) (2,034,687) (965,866) (1,607,528) (2,691,115) (3,823,395) Beginning Balance 29,054,385 23,257,119 21,901,336 20,041,432 20,041,432 17,350,317 Adjustments (561,560) (1,181,000) Ending Balance 23,257,119 20,041,432 20,935,470 18,433,904 17,350,317 13,526,922 A 2.75% overall rate increase for water, wastewater, and reclaimed water is included in the FY13 Budget. Fund Summaries Page 49
55 City of St. Petersburg Budget Water Resources Debt (4002) In FY85, Series 1985A for $ million and Series 1985B for $19 million were issued. The $57 million Water Resources Revenue Bond Refunding Issue from 1977 was retired, and $16.5 million in bond anticipation notes dated August 1, 1982 were redeemed. Outstanding Water Resources bond issues were refinanced late in FY91. During FY93, there was a new issue of approximately $34 million which was subsequently refunded with Series 1999A and 1999B. Additional bonds were issued in FY03 ($45 million) and FY09 ($ million). Resolution established this fund. Revenue Summary Intergovernmental Revenue Federal Grants 0 924,585 1,188,752 1,188,752 1,188,752 1,186,809 (0.16%) Total Intergovernmental Revenue 0 924,585 1,188,752 1,188,752 1,188,752 1,186,809 (0.16%) Misc Revenues Interest Earnings 153, , , , , , % Total Misc Revenues 153, , , , , , % Transfer In Water Resources 14,922,808 15,732,127 17,130,250 17,130,250 17,130,250 19,445, % Total Transfer In 14,922,808 15,732,127 17,130,250 17,130,250 17,130,250 19,445, % Debt & Loan Proceeds Debt Proceeds 0 5,448, % Total Debt & Loan Proceeds 0 5,448, % Total Revenue Summary 15,076,565 22,309,852 18,470,113 18,470,113 18,470,113 20,787, % Appropriations Debt 13,450,561 15,861,905 18,046,144 18,046,144 20,124,902 20,692, % Total Appropriations 13,450,561 15,861,905 18,046,144 18,046,144 20,124,902 20,692, % Increase/(Decrease) in Fund Balance 1,626,004 6,447, , ,969 (1,654,789) 94,146 Beginning Balance 12,578,042 14,204,046 20,152,461 20,651,248 20,651,248 18,996,459 Adjustments 0 (745) Ending Balance 14,204,046 20,651,248 20,576,430 21,075,217 18,996,459 19,090,605 Fund Summaries Page 50
56 City of St. Petersburg Budget Water Cost Stabilization (4005) This fund was established in FY98 from the sale of the well fields to Tampa Bay Water in order to build a fund that could be drawn against to help limit rate increases. On April 8, 1999, the City Council approved the transfer of interest earnings from this fund to the Water Resources Operating Fund to partially offset the cost of buying water. Revenue Summary Misc Revenues Interest Earnings 2,765,375 (1,682,858) 1,255,000 1,255,000 1,250,098 1,255, % Total Misc Revenues 2,765,375 (1,682,858) 1,255,000 1,255,000 1,250,098 1,255, % Transfer In Stadium Debt Service 242, , , ,000 23, ,000 (38.78%) Total Transfer In 242, , , ,000 23, ,000 (38.78%) Total Revenue Summary 3,008,248 (1,532,596) 1,500,000 1,500,000 1,273,739 1,405,000 (6.33%) Appropriations Transfers Out Water Resources 2,994,316 2,752,806 1,500,000 1,500,000 1,500,000 1,500, % Total Transfers Out 2,994,316 2,752,806 1,500,000 1,500,000 1,500,000 1,500, % Total Appropriations 2,994,316 2,752,806 1,500,000 1,500,000 1,500,000 1,500, % Increase/(Decrease) in Fund Balance 13,932 (4,285,402) 0 0 (226,261) (95,000) Beginning Balance 83,280,784 83,259,636 83,656,024 78,974,979 78,974,979 78,748,718 Adjustments (35,080) Ending Balance 83,259,636 78,974,979 83,656,024 78,974,979 78,748,718 78,653,718 There is no change to the amount of the transfer to the Water Resources Operating Fund in FY13. The loan of $8.996 million to the Stadium Debt Service Fund is scheduled to be re-paid in FY Fund Summaries Page 51
57 City of St. Petersburg Budget Stormwater Utility Operating (4011) The Stormwater Utility Operating Fund, like all other Enterprise Funds, is used to account for costs that are funded substantially by external (non-city department) user fees and charges. The fund is required to cover all expenses of the operation (salaries, benefits, services, commodities, and capital outlay) and allocation of general and administrative costs, payment-in-lieu-of-taxes, as well as any transfers to capital project funds, debt service funds, or return on investment/equity. Revenue Summary Intergovernmental Revenue Federal Grants 0 2, % Total Intergovernmental Revenue 0 2, % Charges For Services Physical Environment Charges 11,828,564 11,865,480 11,769,885 11,769,885 11,696,801 11,769, % Other Charges For Services 486, , , , , , % Total Charges For Services 12,315,533 12,235,147 12,069,885 12,069,885 12,130,801 12,069, % Misc Revenues Interest Earnings 22,672 97,860 23,832 23,832 82,037 23, % Sale Of Fixed Assets 2,609 21,274 7,000 7,000 16,000 7, % Sale Of Surplus Material 15,700 10, , % Misc Revenue (26,600) 69 (51,000) (51,000) (47,000) (51,000) 0.00% Total Misc Revenues 14, ,417 (20,168) (20,168) 52,916 (20,168) 0.00% Total Revenue Summary 12,329,914 12,367,204 12,049,717 12,049,717 12,183,717 12,049, % Appropriations Wages And Benefits 4,261,276 4,160,916 3,508,181 3,508,181 4,462,067 4,012, % Services And Commodities 4,727,961 4,672,716 5,119,720 5,364,175 4,882,882 5,685, % Capital 2,415 3, ,862 2, % Transfers Out Stormwater Debt Service 1,057,856 1,056,403 1,058,000 1,058,000 1,058,000 1,054,080 (0.37%) Stormwater Drainage Capital 1,930, , , , ,000 2,800, % Total Transfers Out 2,987,856 1,856,403 1,858,000 1,858,000 1,858,000 3,854, % Total Appropriations 11,979,508 10,693,264 10,485,901 10,732,218 11,205,123 13,552, % Increase/(Decrease) in Fund Balance 350,406 1,673,940 1,563,816 1,317, ,594 (1,502,917) Beginning Balance 3,770,333 4,126,000 5,950,904 5,893,731 5,893,731 6,872,325 Adjustments 5,261 93, Ending Balance 4,126,000 5,893,731 7,514,720 7,211,230 6,872,325 5,369,408 A rate increase is not included in the FY13 Budget. Fund Summaries Page 52
58 City of St. Petersburg Budget Stormwater Debt Service (4012) The debt was issued in May 1999 (Resolution ) and allowed for the acceleration of approximately 20 stormwater projects. Revenue Summary Misc Revenues Interest Earnings % Total Misc Revenues % Transfer In Stormwater Utility Operating 1,057,856 1,056,403 1,058,000 1,058,000 1,058,000 1,054,080 (0.37%) Total Transfer In 1,057,856 1,056,403 1,058,000 1,058,000 1,058,000 1,054,080 (0.37%) Total Revenue Summary 1,058,173 1,056,533 1,058,332 1,058,332 1,058,332 1,054,412 (0.37%) Appropriations Debt 1,053,076 1,055,453 1,053,332 1,053,332 1,053,533 1,055, % Total Appropriations 1,053,076 1,055,453 1,053,332 1,053,332 1,053,533 1,055, % Increase/(Decrease) in Fund Balance 5,097 1,080 5,000 5,000 4,799 (960) Beginning Balance 596, , , , , ,966 Adjustments Ending Balance 602, , , , , ,006 Fund Summaries Page 53
59 City of St. Petersburg Budget Sanitation Operating (4021) The Sanitation Operating Fund, like all other Enterprise Funds, is used to account for costs that are funded substantially by external (non-city department) user fees and charges. The fund is required to cover all expenses of the operation (salaries, benefits, services, commodities and capital outlay) and allocation of general and administrative costs, payment-in-lieu-of-taxes, as well as any transfers to capital project funds, debt service funds, or return on investment/equity. The Sanitation Operating Fund supports both Sanitation operations and part of the Codes Compliance Department (Sanitation/Codes Compliance Demolition division.) Revenue Summary Intergovernmental Revenue Grants From Other Local Units 189, , , , , , % Total Intergovernmental Revenue 189, , , , , , % Charges For Services General Government 11,276 11, , % Physical Environment Charges 39,761,394 39,311,178 39,406,000 39,406,000 39,189,861 39,406, % Other Charges For Services % Total Charges For Services 39,772,887 39,322,731 39,406,000 39,406,000 39,201,584 39,406, % Misc Revenues Interest Earnings 243, , , , , , % Special Assessment 174, , , % Sale Of Fixed Assets 17, , , ,000 4, , % Sale Of Surplus Material 217, , , , , , % Misc Revenue (8,216) (143,468) 3,000 3,000 (100,258) 3, % Total Misc Revenues 644,219 1,120, , , , , % Total Revenue Summary 40,606,687 40,632,554 40,113,876 40,113,876 40,074,036 40,113, % Appropriations Wages And Benefits 12,970,460 12,997,157 13,550,654 13,550,654 13,270,121 13,401,690 (1.10%) Services And Commodities 23,136,160 23,272,612 22,530,828 22,542,745 22,828,587 22,468,202 (0.28%) Capital 7,979 10, ,507 5, % Transfers Out General Fund 455, , , , , , % Sanitation Equipment Replacement 2,342,735 3,500,004 2,000,000 2,000,000 2,000,000 4,500, % Total Transfers Out 2,797,811 3,955,080 2,455,076 2,455,076 2,455,076 4,955, % Total Appropriations 38,912,410 40,235,443 38,536,558 38,552,982 38,558,784 40,824, % Increase/(Decrease) in Fund Balance 1,694, ,111 1,577,318 1,560,894 1,515,252 (711,092) Beginning Balance 9,439,106 11,119,819 14,564,368 11,596,566 11,596,566 13,111,818 Adjustments (13,564) 79, Ending Balance 11,119,819 11,596,566 16,141,686 13,157,460 13,111,818 12,400,726 A rate increase is not included in the FY13 Budget. Fund Summaries Page 54
60 City of St. Petersburg Budget Sanitation Equipment Replacement (4027) This fund was established to provide a funded reserve for the replacement of Sanitation equipment including residential, commercial, and brush vehicles and receptacles. It also funds any capital projects related to Sanitation facilities. Revenue Summary Charges For Services Physical Environment Charges % Total Charges For Services % Misc Revenues Interest Earnings 78,525 51,762 29,790 29,790 29,935 29, % Total Misc Revenues 78,525 51,762 29,790 29,790 29,935 29, % Transfer In Sanitation Operating 2,342,735 3,500,004 2,000,000 2,000,000 2,000,000 4,500, % Total Transfer In 2,342,735 3,500,004 2,000,000 2,000,000 2,000,000 4,500, % Total Revenue Summary 2,421,260 3,552,375 2,029,790 2,029,790 2,029,935 4,529, % Appropriations Services And Commodities 0 230, , , , , % Capital 3,365,804 2,259,505 1,744,000 1,836, ,192 5,334, % Total Appropriations 3,365,804 2,489,859 2,244,000 2,336,713 1,137,192 5,841, % Increase/(Decrease) in Fund Balance (944,544) 1,062,516 (214,210) (306,923) 892,743 (1,311,510) Beginning Balance 4,255,691 3,375,000 4,946,198 6,353,349 6,353,349 7,246,092 Adjustments 63,853 1,915, Ending Balance 3,375,000 6,353,349 4,731,988 6,046,426 7,246,092 5,934,582 A transfer from the Sanitation Operating Fund to the Sanitation Equipment Replacement Fund in the amount of $4,500,000 is budgeted for FY13. Fund Summaries Page 55
61 City of St. Petersburg Budget Airport Operating (4031) The Airport Operating Fund, like all other Enterprise Funds, is used to account for costs that are funded substantially by external (non-city department) user fees and charges. The fund is required to cover all expenses of the operation (salaries, benefits, services, commodities, and capital outlay) and allocation of general and administrative costs and payment-in-lieu-of-taxes, as well as any transfers to capital project funds, debt service funds, or return on investment/equity. Revenue Summary Charges For Services Transportation Charges 941, , , , , , % Other Charges For Services 1,552 1, % Total Charges For Services 943, , , , , , % Misc Revenues Interest Earnings % Misc Revenue 2, (1,117) % Total Misc Revenues 2, (1,110) % Transfer In General Fund 136, % Utility Tax Revenue 51, % Total Transfer In 187, % Total Revenue Summary 1,133, , , , , , % Appropriations Wages And Benefits 335, , , , , , % Services And Commodities 528, , , , , , % Capital 5, , % Transfers Out General Fund 0 50,004 50,000 50,000 50,000 50, % Airport Capital Projects 390,000 48, , % Total Transfers Out 390,000 98,408 50,000 50,000 50, , % Total Appropriations 1,259, , , , ,621 1,043, % Increase/(Decrease) in Fund Balance (126,441) 1,882 33,919 22,953 8,926 (48,753) Beginning Balance 232, , , , , ,966 Adjustments 7,532 6, Ending Balance 113, , , , ,966 82,213 From FY06-FY10, payments from the General Fund totaling $1,997,469 were needed for the Airport's operations. Because the Airport is an enterprise fund, these payments from the General Fund are considered a loan and will be repaid from future Airport revenues. Starting in FY11, the Airport will pay back $50,000 a year to the General Fund. The remaining Airport debt, in the amount of $1,582,493, was paid in FY09. Part of this debt payment, $1,009,594, was provided by the Economic Stability Fund and will be repaid to the Economic Stability Fund from future earnings of the Airport. The total to be repaid by the Airport to the General Fund is $3,007,063 ($1,997,469 plus $1,009,594). Also in FY13, the Airport's expenses are expected to increase by 8.75% due primarily to a transfer of $55,000 to the Airport Capital Projects Fund. Fund Summaries Page 56
62 City of St. Petersburg Budget Marina Operating (4041) The Marina Operating Fund, like all other Enterprise Funds, is used to account for costs that are funded substantially by external (non-city department) user fees and charges. The fund is required to cover all expenses of the operation (salaries, benefits, services, commodities, and capital outlay) and allocation of general and administrative costs and payment-in-lieu-of-taxes, as well as any transfers to capital project funds, debt service funds, or return on investment/equity. Revenue Summary Charges For Services Culture And Recreation Charges 2,782,018 3,275,606 3,222,903 3,222,903 3,334,211 3,469, % Total Charges For Services 2,782,018 3,275,606 3,222,903 3,222,903 3,334,211 3,469, % Fines And Forfeitures Traffic And Parking % Total Fines And Forfeitures % Misc Revenues Interest Earnings ,192 1, , % Misc Revenue (12,113) (19,454) 1,500 1,500 (10,486) 1, % Total Misc Revenues (11,813) (19,339) 2,692 2,692 (10,478) 2, % Transfer In Utility Tax Revenue 286, % Total Transfer In 286, % Internal Charges Other Charges (678) (49) % Total Internal Charges (678) (49) % Total Revenue Summary 3,056,797 3,256,298 3,225,595 3,225,595 3,323,775 3,472, % Appropriations Wages And Benefits 895, , , , ,179 1,015, % Services And Commodities 866,270 1,351,735 1,156,135 1,162,104 1,258,784 1,368, % Capital 3, % Debt 673, , , , , , % Transfers Out General Fund 300, , , , , , % Marina Capital Improvement 350, , , , , , % Total Transfers Out 650, , , , , , % Total Appropriations 3,088,236 3,387,465 3,225,402 3,251,371 3,306,834 3,474, % Increase/(Decrease) in Fund Balance (31,439) (131,167) 193 (25,776) 16,941 (1,644) Beginning Balance 265, , ,176 91,848 91, ,789 Adjustments (8,593) (2,044) Ending Balance 225,059 91, ,369 66, , ,145 A rent increase is not budgeted for FY13. There has been no increase since FY The debt service associated with the construction at the Marina for the fifth pier and the renovations is $674,471. In FY13, the fund's revenues are projected to increase by 7.65% and its expenses by 7.71%. Most of these increases are associated with the Marina Ship Store and slip rentals. A Marina Supervisor position was eliminated and replaced with a Marina/Port Supervisor to oversee both the Marina and Port. The cost for the new position is shared by both the Marina and Port. Fund Summaries Page 57
63 City of St. Petersburg Budget Golf Course Operating (4061) The Golf Courses Operating Fund, like all other Enterprise Funds, is used to account for costs that are funded substantially by external (non-city department) user fees and charges. The fund is required to cover all expenses of the operation (salaries, benefits, services, commodities, and capital outlay), allocation of general and administrative costs, and payment-in-lieu-of-taxes, as well as any transfers to capital project funds, debt service funds, or return on investment/equity. Revenue Summary Charges For Services Culture And Recreation Charges 3,272,489 3,456,973 3,756,120 3,756,120 3,801,439 3,770, % Other Charges For Services 2,819 5,266 1,060 1, (100.00%) Total Charges For Services 3,275,308 3,462,239 3,757,180 3,757,180 3,802,170 3,770, % Misc Revenues Interest Earnings (84.62%) Contributions And Donations 4, % Misc Revenue 2, % Total Misc Revenues 6, (84.62%) Transfer In Utility Tax Revenue 462, % Total Transfer In 462, % Debt & Loan Proceeds Debt Proceeds 0 188, % Total Debt & Loan Proceeds 0 188, % Internal Charges Other Charges 410 (67) % Total Internal Charges 410 (67) % Total Revenue Summary 3,744,907 3,651,133 3,757,986 3,757,986 3,802,572 3,770, % Appropriations Wages And Benefits 2,157,385 2,156,338 2,171,521 2,171,521 2,188,966 2,189, % Services And Commodities 1,349,999 1,540,858 1,458,106 1,458,693 1,490,082 1,482, % Capital 68, ,193 80,000 80,000 72,389 80, % Debt 4,407 28,828 49,500 49,500 49,500 49, % Total Appropriations 3,580,063 4,002,217 3,759,127 3,759,714 3,800,937 3,801, % Increase/(Decrease) in Fund Balance 164,844 (351,084) (1,141) (1,728) 1,635 (31,064) Beginning Balance 179, , , , , ,837 Adjustments (44,372) 185, Ending Balance 300, , , , , ,773 The Golf Courses Department has made several changes due to the downturn in the economy to remain profitable. The total request of $3.801 million is 1.13% more than the Budget. In FY13, the Economic Stability Fund will transfer $260,000 to the Golf Course Capital Projects Fund. The Golf Course Operating Fund will repay the Economic Stability Fund from their future earnings. In FY13, a full-time Concessions Aide III position will be reduced to a part-time Concessions Aide II position ($25,453), there will be increases to Other Specialized Services, Chemicals, and Fuel ($27,040), and funding is scheduled to replace outdated turf equipment ($80,000). Fund Summaries Page 58
64 City of St. Petersburg Budget Jamestown Complex (4081) This fund was established to provide accounting for the Jamestown Housing Complex which provides affordable apartment units to low- and moderate-income earning families. Revenue Summary Charges For Services Housing Services 509, , , , , , % Total Charges For Services 509, , , , , , % Misc Revenues Interest Earnings % Rents And Royalties 1,567 1,456 1,400 1, , % Misc Revenue 531 6,424 (4,175) (4,175) (38,600) 0 (100.00%) Total Misc Revenues 2,275 7,962 (2,775) (2,775) (38,257) 1,400 (150.45%) Transfer In General Fund 70, , % Total Transfer In 70, , % Internal Charges Other Charges % Total Internal Charges % Total Revenue Summary 582, , , , , , % Appropriations Wages And Benefits 232, , , , , , % Services And Commodities 296, , , , , , % Capital 2,222 2,166 13,000 13,000 13,000 13, % Transfers Out General Fund 0 35,004 35,000 35, (100.00%) Total Transfers Out 0 35,004 35,000 35, (100.00%) Total Appropriations 531, , , , , , % Increase/(Decrease) in Fund Balance 50,755 (20,753) (47,622) (47,675) (60,277) (50,905) Beginning Balance 100, , , , ,228 50,951 Adjustments 756 (19,618) Ending Balance 151, ,228 94,792 63,553 50, Revenues will increase 2.14% due to an expected increase in the occupancy rate. Expenses will increase 2.55% due to increases in facility maintenance, utilities, and administrative overhead. There are capital requests in the amount of $13,000 for replacement of carpeting and air conditioning units at Jamestown. Fund Summaries Page 59
65 City of St. Petersburg Budget Port Operating (4091) The Port Operating Fund, like all other Enterprise Funds, is used to account for costs that are funded substantially by external (non-city department) user fees and charges. The enterprise funds are required to cover all expenses of the operation (salaries, benefits, services, commodities, and capital outlay) and allocation of general and administrative costs and payment-in-lieu-of-taxes, as well as any transfers to capital project funds, debt service funds, or return on investment/equity. Revenue Summary Charges For Services Transportation Charges 186, , , , , , % Other Charges For Services % Total Charges For Services 186, , , , , , % Misc Revenues Interest Earnings % Misc Revenue (1,621) 5,450 3,273 3,273 (45,188) 3, % Total Misc Revenues (1,621) 5,450 3,726 3,726 (45,188) 3, % Transfer In General Fund 508, , , , , ,500 (23.43%) Total Transfer In 508, , , , , ,500 (23.43%) Total Revenue Summary 693, , , , , ,026 (13.97%) Appropriations Wages And Benefits 380, , , , , ,148 (17.35%) Services And Commodities 281, , , , , ,953 (5.49%) Total Appropriations 662, , , , , ,101 (13.90%) Increase/(Decrease) in Fund Balance 31,090 (122,777) 307 (32) (5,480) (75) Beginning Balance 85, ,082 2,280 5,764 5, Adjustments 6,448 5, Ending Balance 123,082 5,764 2,587 5, Expenses will decrease 13.9% due to reduced funding for repair and maintenance ($9,396), and position changes ($53,722). This will reduce the subsidy by $63,500 from the FY12 budget. Fund Summaries Page 60
66 City of St. Petersburg Budget Fleet Management (5001) This fund is an Internal Service Fund that accounts for all fleet services. The primary users are the Police, Fire, Parks, Stormwater, Sanitation, and Water Resources departments. Revenue Summary Intergovernmental Revenue Federal Grants 0 396, % Total Intergovernmental Revenue 0 396, % Misc Revenues Interest Earnings 13,546 19,345 9,741 9,741 9,000 37, % Sale Of Fixed Assets 0 12, , % Sale Of Surplus Material 5,438 9,004 7,500 7,500 15,200 15, % Misc Revenue % Total Misc Revenues 19,139 41,365 17,241 17,241 24,200 64, % Internal Charges Department Charges 15,118,233 16,796,903 16,294,400 16,294,400 16,382,940 17,371, % Other Charges % Total Internal Charges 15,118,233 16,796,903 16,294,400 16,294,400 16,382,940 17,371, % Total Revenue Summary 15,137,372 17,234,837 16,311,641 16,311,641 16,407,140 17,435, % Appropriations Wages And Benefits 5,116,395 4,769,940 5,047,131 5,047,131 4,721,162 4,816,108 (4.58%) Services And Commodities 10,436,896 11,980,101 10,964,738 11,372,915 11,771,160 12,774, % Capital 17,993 69, ,795 45, % Transfers Out Workers' Compensation 721, % Total Transfers Out 721, % Total Appropriations 16,293,000 16,819,617 16,011,869 16,465,841 16,538,117 17,591, % Increase/(Decrease) in Fund Balance (1,155,628) 415, ,772 (154,200) (130,977) (155,245) Beginning Balance 2,403,627 1,120,649 2,503,634 1,959,880 1,959,880 1,828,903 Adjustments (127,350) 424, Ending Balance 1,120,649 1,959,880 2,803,406 1,805,680 1,828,903 1,673,658 Fund Summaries Page 61
67 City of St. Petersburg Budget Equipment Replacement (5002) The Equipment Replacement Fund is an Internal Service Fund that accounts for the normal replacement of City vehicles and related equipment that is used by City departments. The primary users are the Police, Fire, Parks, Stormwater, Sanitation, and Water Resources departments. Revenue Summary Misc Revenues Interest Earnings 516,457 (125,212) 247, , , , % Sale Of Fixed Assets 51, , , % Contributions And Donations 25, % Misc Revenue , % Total Misc Revenues 592, , , , , , % Internal Charges Department Charges 2,820,868 3,124,610 3,476,215 3,476,215 3,263,315 5,173, % Total Internal Charges 2,820,868 3,124,610 3,476,215 3,476,215 3,263,315 5,173, % Total Revenue Summary 3,413,394 3,557,550 3,723,642 3,723,642 4,036,058 5,635, % Appropriations Wages And Benefits 13,692 13,140 13,700 13,700 14, , % Services And Commodities 174, , , , ,000 2,838 (98.18%) Capital 2,579,175 8,813,002 7,891,000 11,879,956 11,876,317 9,192, % Transfers Out Technology & Infrastructure Fund 1,757, % Total Transfers Out 1,757, % Total Appropriations 4,525,214 8,986,867 8,060,800 12,049,756 12,050,417 9,364, % Increase/(Decrease) in Fund Balance (1,111,820) (5,429,317) (4,337,158) (8,326,114) (8,014,359) (3,728,899) Beginning Balance 23,187,963 22,448,355 22,108,843 17,845,218 17,845,218 9,830,859 Adjustments 372, , Ending Balance 22,448,355 17,845,218 17,771,685 9,519,104 9,830,859 6,101,960 The Equipment Replacement Fund budget will increase by 16.17% in FY13. The replacements maintain the city's current level of service and the increase results from the cyclical nature of the equipment replacement plan. Fund Summaries Page 62
68 City of St. Petersburg Budget Municipal Office Buildings (5005) This is an Internal Service Fund used to account for rents applied to City departments in City Hall, City Annex, and the Municipal Services Center (MSC) to cover the cost of maintenance, repairs, and security. The primary users include General Government and Community Development agencies. Revenue Summary Misc Revenues Interest Earnings 2,681 (21,406) 8,041 8,041 14,025 8, % Rents And Royalties 2,664,732 2,685,756 2,685,756 2,685,756 2,685,756 2,685, % Misc Revenue % Total Misc Revenues 2,667,413 2,664,850 2,693,797 2,693,797 2,699,781 2,693, % Total Revenue Summary 2,667,413 2,664,850 2,693,797 2,693,797 2,699,781 2,693, % Appropriations Wages And Benefits 968,106 1,017,957 1,003,168 1,003, , ,999 (1.31%) Services And Commodities 1,428,794 1,301,190 1,402,984 1,406,187 1,479,939 1,370,044 (2.35%) Capital 72,698 21, % Transfers Out General Capital Improvements 0 275, % Total Transfers Out 0 275, % Total Appropriations 2,469,598 2,615,947 2,406,152 2,409,355 2,414,808 2,360,043 (1.92%) Increase/(Decrease) in Fund Balance 197,815 48, , , , ,754 Beginning Balance 1,276,096 1,532,737 1,700,831 1,609,841 1,609,841 1,894,814 Adjustments 58,826 28, Ending Balance 1,532,737 1,609,841 1,988,476 1,894,283 1,894,814 2,228,568 In FY13, the fund's expenses are projected to decrease by 1.92%. The reduction in expenses is due to miscellaneous reductions in services and commodities ($32,940) and the Billing & Collections Fund paying for the cost of one security guard ($13,169). Fund Summaries Page 63
69 City of St. Petersburg Budget Information & Communication Services (5011) The Information & Communication Services (ICS) Fund is an Internal Service Fund that accounts for the technical infrastructure and an employee base which assists city departments in determining and implementing their information/communication requirements. All city agencies are users of ICS' services and equipment. Revenue Summary Charges For Services Other Charges For Services 9,324 12, % Total Charges For Services 9,324 12, % Misc Revenues Interest Earnings 35,609 11,210 24,670 24,670 1,000 35, % Sale Of Fixed Assets 7, % Misc Revenue % Total Misc Revenues 44,090 11,458 24,670 24,670 1,030 35, % Transfer In Print Shop 0 (50,908) % Total Transfer In 0 (50,908) % Internal Charges Department Charges 10,064,526 9,892,659 9,604,952 9,741,848 9,948,975 10,321, % Total Internal Charges 10,064,526 9,892,659 9,604,952 9,741,848 9,948,975 10,321, % Total Revenue Summary 10,117,940 9,865,687 9,629,622 9,766,518 9,950,223 10,357, % Appropriations Wages And Benefits 5,823,622 5,766,099 6,060,354 6,060,354 5,669,317 6,098, % Services And Commodities 4,260,356 3,669,873 3,910,785 4,248,025 4,835,058 4,087, % Capital 475, ,984 19,000 60,770 70,990 51, % Transfers Out General Fund 399, , , , , ,000 (50.00%) Technology & Infrastructure Fund 999, % Print Shop 58, % Total Transfers Out 1,457, , , , , ,000 (50.00%) Total Appropriations 12,017,170 9,933,956 10,190,139 10,569,149 10,775,365 10,337, % Increase/(Decrease) in Fund Balance (1,899,230) (68,269) (560,517) (802,631) (825,142) 19,540 Beginning Balance 3,141,643 1,707,293 1,942,893 1,828,461 1,828,461 1,003,319 Adjustments 464, , Ending Balance 1,707,293 1,828,461 1,382,376 1,025,830 1,003,319 1,022,859 In FY13, the ICS Department's budget will increase 1.45% due to additional software, equipment, and miscellaneous purchases needed ($326,798). These enhancements include 450 Kronos licenses ($97,758), procurement contracts and services ($101,424), SMS support for all servers, Citrix support for the Police Department, Vmware server support, Groupwise annual maintenance, and Xiotech SAN ($85,116). In addition, various line items were reduced including Car Allowance ($7,180), Consulting ($20,000), Office Supplies ($10,200), and miscellaneous ($300). Fund Summaries Page 64
70 City of St. Petersburg Budget PC Replacement (5015) The PC Replacement Fund was an Internal Service Fund that accounted for the normal replacement of standard personal computer (PC) and laptop equipment that is used by city departments. Revenue Summary Misc Revenues Interest Earnings 6,884 6, % Total Misc Revenues 6,884 6, % Internal Charges Department Charges 464, % Total Internal Charges 464, % Total Revenue Summary 471,235 6, % Appropriations Wages And Benefits 14, % Services And Commodities % Capital 210, % Transfers Out Technology & Infrastructure Fund 3,638,761 (155,906) % Total Transfers Out 3,638,761 (155,906) % Total Appropriations 3,863,030 (155,906) % Increase/(Decrease) in Fund Balance (3,391,795) 162, Beginning Balance 2,310, , Adjustments 1,081,242 (162,000) Ending Balance , During FY10, the PC Replacement Fund was moved to a division within the new Technology and Infrastructure Fund. The information on this page is provided for historical purposes. Fund Summaries Page 65
71 City of St. Petersburg Budget Radio Replacement (5017) The Radio Replacement Fund was an Internal Service Fund that accounted for the normal replacement of portable radio equipment that was used by city departments. The primary users were the Police and Fire departments. Revenue Summary Misc Revenues Interest Earnings % Total Misc Revenues % Internal Charges Department Charges 419, % Total Internal Charges 419, % Total Revenue Summary 420, % Appropriations Capital 45, % Transfers Out Technology & Infrastructure Fund 1,162, % Total Transfers Out 1,162, % Total Appropriations 1,208, % Increase/(Decrease) in Fund Balance (788,381) Beginning Balance 512, , Adjustments 276, Ending Balance , During FY10, the Radio Replacement Fund was moved to a division within the new Technology and Infrastructure Fund. The information on this page is provided for historical purposes. Fund Summaries Page 66
72 City of St. Petersburg Budget Technology & Infrastructure Fund (5019) The Technology and Infrastructure Fund is an Internal Service Fund that was established in to centrally locate all technology/infrastructure resources. The fund balances of the former PC and Radio Replacement Funds, and the amount above the target fund balance of the ICS Fund were transferred here. In addition, reserves for television equipment contributed by the Marketing and Communications Department were transferred to this fund from the Equipment Replacement Fund. Revenue Summary Misc Revenues Interest Earnings 0 116,969 39,124 39, ,184 36,338 (7.12%) Total Misc Revenues 0 116,969 39,124 39, ,184 36,338 (7.12%) Transfer In Equipment Replacement 1,757, % Information & Communication Services 999, % Pc Replacement 3,638,761 (155,906) % Radio Replacement 1,162, % General Liabilities Claims 2,798, % Total Transfer In 10,357,139 (155,906) % Internal Charges Department Charges 0 873, , , , , % Total Internal Charges 0 873, , , , , % Total Revenue Summary 10,357, , , , ,424 1,007, % Appropriations Wages And Benefits 0 14,004 14,000 14,000 14,000 14, % Services And Commodities 0 111, , % Capital 0 1,602, ,090 2,207,467 2,277,515 2,036, % Transfers Out General Fund , % General Capital Improvements ,020, % Total Transfers Out , ,020, % Total Appropriations 0 1,728, ,090 2,491,467 2,291,515 3,586, % Increase/(Decrease) in Fund Balance 10,357,139 (894,023) (2,294) (1,713,671) (1,325,091) (2,579,189) Beginning Balance 0 9,018,406 8,224,428 8,319,294 8,319,294 6,994,203 Adjustments (1,338,733) 194, Ending Balance 9,018,406 8,319,294 8,222,134 6,605,623 6,994,203 4,415,014 The city has initiated a Virtual Desktop PC program that requires each virtual machine to have its own XP Professional license loaded. These VECD (virtual enterprise centralized desktop) licenses are $100 per year, per machine and are recurring costs. The Virtual Desktop initiative is directly tied to substantial cost savings. By virtualizing desktop PCs, the city benefits by reducing the number of PC replacements for each year the equipment is in use. Instead of a 4 year replacement cycle, the city may see a 6 or 7 year cycle, while still providing the latest desktop software experience to the users ($260,000). The Budget Department charges this fund its salary and benefits cost related to the department's oversight of this fund ($14,000). In FY13, $1,020,000 will be transferred to the General Capital Improvement Fund for the upgrade of the Police CAD/RMS Project. Fund Summaries Page 67
73 City of St. Petersburg Budget Supply Management (5031) The Materials Management Fund is an Internal Service Fund that accounts for the storage and handling of identified materials for distribution to user agencies. The primary users of the Consolidated Warehouse are Parks, Water Resources, and Stormwater, Pavement & Traffic Operations. Revenue Summary Misc Revenues Interest Earnings % Sale Of Fixed Assets 36,248 35,406 15,000 14,972 6,993 15, % Sale Of Surplus Material % Misc Revenue 1, % Total Misc Revenues 38,452 36,259 15,000 14,972 7,050 15, % Internal Charges Department Charges 495, , , , , , % Total Internal Charges 495, , , , , , % Total Revenue Summary 533, , , , , , % Appropriations Wages And Benefits 412, , , , , ,804 (8.14%) Services And Commodities 97, ,545 97, , ,906 98, % Capital 1, % Transfers Out Workers' Compensation 249, % Total Transfers Out 249, % Total Appropriations 760, , , , , ,250 (6.39%) Increase/(Decrease) in Fund Balance (226,912) 2,941 2,335 (12,244) 2,008 35,750 Beginning Balance 127,554 45, ,194 40,969 40,969 42,977 Adjustments 144,606 (7,220) Ending Balance 45,248 40, ,529 28,725 42,977 78,727 The overhead rate for FY13 will be 16.5%. Fund Summaries Page 68
74 City of St. Petersburg Budget Print Shop (5041) Revenue Summary Transfer In Information & Communication Services 58, % Total Transfer In 58, % Internal Charges Department Charges 354,389 1, % Total Internal Charges 354,389 1, % Total Revenue Summary 412,825 1, % Appropriations Wages And Benefits 151,696 58, % Services And Commodities 206,405 25, % Capital 29, % Transfers Out Information & Communication Services 0 (50,908) % Total Transfers Out 0 (50,908) % Total Appropriations 387,651 33, % Increase/(Decrease) in Fund Balance 25,174 (31,565) Beginning Balance 2,247 25,690 0 (5,200) (5,200) 0 Adjustments (1,731) ,200 0 Ending Balance 25,690 (5,200) 0 (5,200) 0 0 During FY11, the Print Shop was consolidated into the ICS Fund. The information on this page is provided for historical purposes. Fund Summaries Page 69
75 City of St. Petersburg Budget Health Insurance (5121) This fund is an Internal Service Fund that accounts for health and dental insurance costs for current and retired city employees. Revenue Summary Misc Revenues Interest Earnings 171, ,001 39,551 39, , , % Contributions And Donations 32,763,954 31,872,447 32,317,867 32,317,867 33,122,791 35,963, % Misc Revenue 419, , , , , ,000 (23.40%) Total Misc Revenues 33,355,056 33,006,485 32,651,159 32,651,159 34,130,865 36,367, % Transfer In Utility Tax Revenue 1,584, % General Liabilities Claims 7,510, % Total Transfer In 9,094, % Total Revenue Summary 42,450,041 33,006,485 32,651,159 32,651,159 34,130,865 36,367, % Appropriations Wages And Benefits 184, , , , , , % Services And Commodities 32,768,645 32,801,372 33,701,121 33,702,076 33,686,913 36,220, % Total Appropriations 32,953,560 33,099,147 34,019,506 34,020,461 33,996,000 36,588, % Increase/(Decrease) in Fund Balance 9,496,481 (92,662) (1,368,347) (1,369,302) 134,865 (220,605) Beginning Balance 9,132,722 18,629,203 20,694,134 18,503,632 18,503,632 18,638,497 Adjustments 0 (32,909) Ending Balance 18,629,203 18,503,632 19,325,787 17,134,330 18,638,497 18,417,892 For FY13, the Health Insurance Fund expenditures will increase 7.55%. These increases are based on increases in projected claims and administrative costs - self funded health - and contracted rate for fully insured insurances. Fund Summaries Page 70
76 City of St. Petersburg Budget Life Insurance (5123) This is an Internal Service Fund that accounts for life and disability insurance costs for current and retired city employees. Revenue Summary Misc Revenues Interest Earnings ,944 4, , % Contributions And Donations 798, , , , , ,606 (2.16%) Misc Revenue 0 (2) % Total Misc Revenues 799, , , , , ,585 (2.14%) Total Revenue Summary 799, , , , , ,585 (2.14%) Appropriations Wages And Benefits 24,570 36,825 40,471 40,471 36,967 38,073 (5.93%) Services And Commodities 850, , , , , ,955 (16.34%) Transfers Out Workers' Compensation 216, % Total Transfers Out 216, % Total Appropriations 1,090, , , , , ,028 (15.90%) Increase/(Decrease) in Fund Balance (291,759) (72,844) (198,924) (198,924) 16,171 (64,443) Beginning Balance 512, , , , , ,213 Adjustments (1) Ending Balance 220, ,042 5,224 (50,882) 164,213 99,770 For FY13, the expenses were reduced 15.9% due to changes in overall enrollment and levels of coverage. Fund Summaries Page 71
77 City of St. Petersburg Budget General Liabilities Claims (5125) The Self Insurance Fund is an Internal Service Fund that accounts for the cost of self-insuring and self-administrating city claims. Revenue Summary Charges For Services General Government 36,268 64, , % Total Charges For Services 36,268 64, , % Misc Revenues Interest Earnings 675,741 (365,868) 453, , , ,000 (55.86%) Contributions And Donations 2,419,908 1,801,296 1,796,935 1,796,935 1,785,041 2,015, % Misc Revenue 7,408 30, , % Total Misc Revenues 3,103,057 1,466,340 2,250,035 2,250,035 2,245,970 2,215,988 (1.51%) Internal Charges Other Charges % Total Internal Charges % Total Revenue Summary 3,139,325 1,530,582 2,250,035 2,250,035 2,250,000 2,215,988 (1.51%) Appropriations Wages And Benefits 442, , , , , ,172 (13.04%) Services And Commodities 975,733 2,058,959 1,826,178 1,826,178 1,800,687 1,766,826 (3.25%) Transfers Out Technology & Infrastructure Fund 2,798, % Health Insurance 7,510, % Workers' Compensation 1,802, % Total Transfers Out 12,111, % Total Appropriations 13,529,694 2,503,722 2,265,672 2,265,672 2,245,687 2,148,998 (5.15%) Increase/(Decrease) in Fund Balance (10,390,369) (973,140) (15,637) (15,637) 4,313 66,990 Beginning Balance 14,976,975 4,618,437 4,265,556 3,343,113 3,343,113 3,347,426 Adjustments 31,831 (302,184) Ending Balance 4,618,437 3,343,113 4,249,919 3,327,476 3,347,426 3,414,416 The reduction in expenses is in response to the changes in the property tax collections and the adjustment to revenue is in response to the changes in the interest earnings anticipated on the liability funds. Fund Summaries Page 72
78 City of St. Petersburg Budget Commercial Insurance (5127) This is an Internal Service Fund that accounts for the cost of commercial insurance for the city. Revenue Summary Misc Revenues Interest Earnings 159,868 (347) 43,007 43,007 5,000 20,000 (53.50%) Contributions And Donations 5,076,744 4,835,736 4,836,456 4,836,456 4,834,456 4,854, % Total Misc Revenues 5,236,612 4,835,389 4,879,463 4,879,463 4,839,456 4,874,373 (0.10%) Total Revenue Summary 5,236,612 4,835,389 4,879,463 4,879,463 4,839,456 4,874,373 (0.10%) Appropriations Wages And Benefits 29,000 29,585 28,537 28,537 28,609 98, % Services And Commodities 5,058,356 4,650,268 4,852,894 4,852,894 4,852,988 4,846,640 (0.13%) Transfers Out Workers' Compensation 1,533, % Total Transfers Out 1,533, % Total Appropriations 6,621,100 4,679,853 4,881,431 4,881,431 4,881,597 4,945, % Increase/(Decrease) in Fund Balance (1,384,488) 155,536 (1,968) (1,968) (42,141) (70,888) Beginning Balance 3,950,581 2,803,964 3,038,521 3,288,978 3,288,978 3,246,837 Adjustments 237, , Ending Balance 2,803,964 3,288,978 3,036,553 3,287,010 3,246,837 3,175,949 Commercial Insurance expenses increased 1.31% due to labor distribution for a Risk Management Analyst position. Fund Summaries Page 73
79 City of St. Petersburg Budget Workers' Compensation (5129) The Workers' Compensation Fund is an Internal Service Fund that accounts for the cost of self-insuring the city for the cost of work-related injuries. Revenue Summary Charges For Services Other Charges For Services 59,926 66, , % Total Charges For Services 59,926 66, , % Misc Revenues Interest Earnings 284, ,484 28,833 28, ,017 30, % Contributions And Donations 6,643,356 7,040,844 7,023,258 7,023,258 7,023,258 7,025, % Misc Revenue 71, ,678 6,000 6,000 45,400 6, % Total Misc Revenues 6,999,222 7,383,006 7,058,091 7,058,091 7,273,675 7,062, % Transfer In Fleet Management 721, % Supply Management 249, % Life Insurance 216, % General Liabilities Claims 1,802, % Commercial Insurance 1,533, % Billing & Collections 1,466, % Total Transfer In 5,989, % Total Revenue Summary 13,048,984 7,449,842 7,058,091 7,058,091 7,323,675 7,062, % Appropriations Wages And Benefits 470, , , , , , % Services And Commodities 10,391,283 5,800,678 6,574,036 6,574,036 4,365,899 6,528,258 (0.70%) Total Appropriations 10,862,029 6,282,295 7,247,940 7,247,940 4,947,168 7,218,214 (0.41%) Increase/(Decrease) in Fund Balance 2,186,955 1,167,547 (189,849) (189,849) 2,376,507 (155,577) Beginning Balance 8,929,413 15,047,368 16,394,771 15,537,915 15,537,915 17,914,422 Adjustments 3,931,000 (677,000) Ending Balance 15,047,368 15,537,915 16,204,922 15,348,066 17,914,422 17,758,845 The reduction in expenses is in response to the changes in the property tax collections. Fund Summaries Page 74
80 City of St. Petersburg Budget Billing & Collections (5201) The Billing & Collections Fund is an Internal Service Fund that accounts for the cost of providing billing and customer services to the city enterprise operations which provide water, wastewater, reclaimed water, stormwater management, refuse collection, and disposal services. It also accounts for the collection of all revenue for the city, including utility charges, special assessments, business taxes, property taxes, past due accounts, and other revenue due to the city. Revenue Summary Charges For Services General Government 151, , , , , , % Total Charges For Services 151, , , , , , % Fines And Forfeitures Violation Of Local Ordinances 1,128,845 1,119,638 1,160,000 1,160,000 1,166,000 1,485, % Total Fines And Forfeitures 1,128,845 1,119,638 1,160,000 1,160,000 1,166,000 1,485, % Misc Revenues Interest Earnings 187,041 (121,983) 250, , , , % Sale Of Fixed Assets % Misc Revenue (99,245) (88,648) (119,000) (119,000) (23,782) (119,000) 0.00% Total Misc Revenues 87,796 (209,888) 131, , , , % Internal Charges Other Charges 7,594,911 7,865,524 6,868,449 6,868,449 6,777,237 6,630,614 (3.46%) Total Internal Charges 7,594,911 7,865,524 6,868,449 6,868,449 6,777,237 6,630,614 (3.46%) Total Revenue Summary 8,963,459 8,956,899 8,359,449 8,359,449 8,307,920 8,651, % Appropriations Wages And Benefits 5,367,719 5,324,399 5,198,908 5,198,908 5,207,667 5,343, % Services And Commodities 3,593,995 3,591,173 3,181,679 3,138,640 2,807,283 3,192, % Capital 8,200 3, % Transfers Out Workers' Compensation 1,466, % Total Transfers Out 1,466, % Total Appropriations 10,436,111 8,919,472 8,380,587 8,337,548 8,014,950 8,535, % Increase/(Decrease) in Fund Balance (1,472,652) 37,427 (21,138) 21, , ,714 Beginning Balance 2,867,945 1,386,688 1,806,060 1,363,070 1,363,070 1,656,040 Adjustments (8,605) (61,045) Ending Balance 1,386,688 1,363,070 1,784,922 1,384,971 1,656,040 1,771,754 In FY13, the Billing and Collections Department's budget increased 1.85% due to increases in customer credit card usage ($22,000) and postage expenditures ($12,000). Revenue changes include the following: Charge a $2 convenience fee for each customer payment made through Click 2 Gov online or by phone through Interactive Voice Response ($325,000), increase current lien research fee from $35 to $55 for both utility lien and special assessments lien searches ($175,000), implement a lien filing fee for special assessment liens as is currently done when filing utility liens ($30,000) and increase original police false alarm registration fee from $15 to $25 in the General Fund ($25,000). Fund Summaries Page 75
81 City of St. Petersburg FY2013 Budget City Development City Development Total Full Time Equivalents (FTE) = City Development Administration Department Total Full Time Equivalents (FTE) = 5.00 Codes Compliance Department Total Full Time Equivalents (FTE) = Downtown Enterprise Facilities Department Total Full Time Equivalents (FTE) = Marketing & Communications Department Total Full Time Equivalents (FTE) = Planning & Economic Development Department Total Full Time Equivalents (FTE) = Real Estate & Property Management Department Total Full Time Equivalents (FTE) = Transportation & Parking Management Department Total Full Time Equivalents (FTE) = Department Summary Page 1
82 City of St. Petersburg FY2013 Budget City Development Budgetary Cost Summary Wages And Benefits 19,076,121 19,106,788 19,328,181 19,302,421 19,118,554 19,475, % Services And Commodities 16,418,100 16,635,102 15,325,168 15,613,129 15,836,656 14,696,326 (4.10%) Capital 260, ,948 56,000 93,000 89, , % Debt 673, , , , , , % Grants And Aid 622, , , , , , % Transfers Out 1,040, , , , , , % Total Budget 38,090,832 37,633,761 36,611,120 37,033,322 36,964,310 36,277,385 (0.91%) Appropriations By Fund/Department General Operating Fund City Development Administration Department 646, , , , , , % Codes Compliance Department 2,523,703 2,474,773 2,439,255 2,439,789 2,461,986 2,512, % Downtown Enterprise Facilities Department 461, , , , , , % Marketing & Communications Department 2,229,783 2,091,263 2,149,292 2,232,792 2,242,338 2,142,221 (0.33%) Planning & Economic Development Department 4,328,545 3,556,730 3,298,880 3,317,962 3,096,157 3,074,055 (6.82%) Real Estate & Property Management Department 742, , , , , ,947 (4.57%) Transportation & Parking Management Department 516, , , , , ,281 (8.37%) Non-General Funds Total General Operating Fund 11,450,126 11,387,025 10,562,390 10,833,078 10,579,924 10,379,105 (1.74%) Airport Operating 1,258, , , , ,621 1,043, % American Recovery & Reinvestment Act % Arts And Cultural Programs ,000 50, % Billing & Collections % Building Permit Special Revenue 3,369,229 3,471,891 3,485,604 3,486,081 3,388,405 3,539, % Coliseum Operating 791, , , , , , % Fleet Management 0 1, % Home Program % Jamestown Complex 531, , , , , , % Local Housing Assistance % Mahaffey Theater Operating 3,664,543 3,727,486 3,532,399 3,532,399 3,524,754 3,229,514 (8.57%) Marina Operating 3,088,501 3,387,680 3,225,402 3,251,371 3,306,834 3,474, % Municipal Office Buildings 2,164,352 1,997,206 2,050,309 2,053,512 2,100,984 2,026,900 (1.14%) Neighborhood Stabilization Program 83,816 31, % Parking Revenue 3,963,768 3,917,447 4,295,223 4,300,053 4,484,998 4,563, % Pier Operating 2,824,783 2,308,969 2,373,869 2,373,891 2,345,321 1,804,307 (23.99%) Port Operating 662, , , , , ,101 (13.90%) Sanitation Operating 907,181 1,088,313 1,034,156 1,034,476 1,043,907 1,071, % Sunken Gardens 863, , , , , , % Technology & Infrastructure Fund 0 40,015 37,000 37,000 37,000 69, % Tropicana Field 2,467,268 2,367,470 2,421,227 2,421,227 2,415,144 2,414,716 (0.27%) Utility Tax Debt Service % Total Non-General Funds 26,640,706 26,246,736 26,048,730 26,200,244 26,384,386 25,898,280 (0.58%) Total Budget 38,090,832 37,633,761 36,611,120 37,033,322 36,964,310 36,277,385 (0.91%) Department Summary Page 2
83 City of St. Petersburg FY2013 Budget Revenue Sources Contractors Permits 2,791,180 2,843,826 2,631,000 2,631,000 3,168,563 3,123, % Other License And Permits 19,189 16,927 78,100 78,100 73, , % Federal Grants 145,673 63, % State Grants 0 18, , % Grants From Other Local Units , % General Government 534, , , , , , % Transportation Charges 4,511,820 5,121,878 5,535,534 5,535,534 5,584,060 5,667, % Housing Services 509, , , , , , % Culture And Recreation Charges 7,794,848 7,748,221 7,769,678 7,769,678 8,043,218 7,726,877 (0.55%) Other Charges For Services 38,478 44,873 20,000 20,000 20,000 20, % Traffic And Parking 1,965,666 1,797,382 1,670,000 1,670,000 1,691,533 1,840, % Violation Of Local Ordinances 466, , , , , , % Interest Earnings 80, ,494 48,923 48,923 48,528 45,298 (7.41%) Rents And Royalties 3,706,668 3,776,806 3,721,230 3,721,230 3,848,274 3,393,945 (8.80%) Special Assessment ,050 73,050 73,050 73, % Sale Of Fixed Assets 44,452 28, , % Contributions And Donations 12,452 13, , ,576 2, ,000 (10.69%) Misc Revenue (22,636) 256,968 8,376 13, , , % General & Administrative 1,344,816 1,385,160 1,385,160 1,385,160 1,241,712 1,241,712 (10.36%) Other Charges (1,388) (362) % Transfer From General Fund 4,662,700 4,548,335 3,993,000 3,993,000 4,306,600 3,668,520 (8.13%) Transfer From Parking Revenue 15,000 22,896 22,896 22,896 22,896 22, % Sunken Gardens 35,252 4,173 (259) (259) (4,109) 3 (101.16%) General Fund 8,945,696 8,707,280 7,999,422 8,259,110 8,096,567 7,861,114 (1.73%) Building Permit Special Revenue 159,547 84, , ,081 38,105 (3,809) (100.88%) Parking Revenue (550,044) (1,045,388) (954,944) (950,114) (1,051,136) (1,067,226) 11.76% Pier Operating 117,242 54,634 1,161 1,183 (5,720) 7, % Port Operating (30,929) 122,923 (307) 32 5, (124.43%) Airport Operating 176,501 (425) (33,919) (22,953) (8,926) 48,753 (243.73%) Marina Operating 318, ,382 (193) 25,776 (16,941) 1,644 (951.81%) Mahaffey Theater Operating (32,017) 4,433 3,855 3,855 (3,788) 126, % Municipal Office Buildings (501,891) (708,009) (643,488) (640,285) (598,772) (666,897) 3.64% Sanitation Operating 895,904 1,076,760 1,034,156 1,034,476 1,032,184 1,071, % Jamestown Complex (50,579) 20,752 47,622 47,675 60,281 50, % Coliseum Operating 57,296 3,556 (2,151) (1,864) (1,864) 0 (100.00%) Billing & Collections % Tropicana Field 233,886 (34,613) 35,586 35,586 35,264 (344) (100.97%) School Crossing Guard (387,808) (352,752) (300,000) (300,000) (363,039) (300,000) 0.00% Technology & Infrastructure 0 40,015 37,000 37,000 37,000 69, % Fund Preservation Reserve 0 (2) % Local Housing Assistance % Neighborhood Stabilization 83,816 31, % Program Fleet Management 0 1, % Home Program % Arts And Cultural Programs ,000 50, % American Recovery & Reinvestment % Act Utility Tax Debt Service % Total Revenue 38,090,832 37,633,761 36,611,120 37,033,322 36,964,310 36,277,385 (0.91%) Position Summary By Department City Development Administration Department % Codes Compliance Department % Downtown Enterprise Facilities Department (2.78%) Marketing & Communications Department % Planning & Economic Development Department (2.95%) Real Estate & Property Management Department (4.17%) Transportation & Parking Management Department % Total Full-Time FTE % % Department Summary Page 3
84 City of St. Petersburg FY2013 Budget Position Summary By Department Downtown Enterprise Facilities Department Marketing & Communications Department % Planning & Economic Development Department % Real Estate & Property Management Department % Total Part-Time FTE % Total FTE % Department Summary Page 4
85 City of St. Petersburg FY2013 Budget City Development City Development Administration Department Department Mission Statement The mission of City Development Administration Department (CDA) is to provide team leadership and management guidance to all departments and activities within the City Development Administration. Services Provided City Development Administration Department (CDA) provides the following services: CDA provides management and administrative services to all CDA departments: Codes Compliance, Planning & Economic Development, Real Estate & Property Management, Marketing & Communications, Transportation & Parking Management, and Downtown Enterprise Facilities (Airport, Port, Marina, Jamestown, Dwight Jones Center, Mahaffey Theater, Pier, Coliseum, Manhattan Casino, Sunken Gardens, and Tropicana Field). This department also plays a lead role in major downtown events (e.g. Honda Grand Prix of St. Petersburg), sports franchise negotiations and coordination, convention business recruitment, development projects, and other special programs. Budgetary Cost Summary Wages And Benefits 561, , , , , , % Services And Commodities 85, ,391 64,606 75,606 68,946 64,184 (0.65%) Total Budget 646, , , , , , % Appropriations By Fund/Program General Operating Fund City Development Administration Program 646, , , , , , % Total Budget 646, , , , , , % Revenue Sources State Grants 0 18, , % Grants From Other Local Units , % Contributions And Donations 4, % Misc Revenue % General & Administrative 286, , , , , , % General Fund 354, , , , , , % Total Revenue 646, , , , , , % Position Summary City Development Administration Program % Total Full-Time FTE % Total FTE % Notes - In FY13, the department's budget will increase by.15%. The increase is due to changes in the benefits selected by employees. Department Summary Page 5
86 City of St. Petersburg FY2013 Budget Codes Compliance Department Department Mission Statement The mission of the Codes Compliance Assistance Department is to educate property owners and enforce the municipal codes, including zoning issues and housing/vegetation maintenance standards, in order to maintain the quality and extend the life of the existing housing stock, to stabilize neighborhoods, and to protect the public. Services Provided The Codes Department provides the following services: Encourage voluntary compliance with municipal codes through education and notification. Encourage code compliance through administration of legal processes such as the Code Enforcement Board, Special Magistrate, and municipal ordinance violation prosecution (notices to appear, trials, and arraignments) in County court. Address a variety of municipal code issues involving zoning and redevelopment regulations, vegetation maintenance, rental housing inspection, securing structures, inoperative motor vehicles, junk and rubbish, structure disrepair, and unsafe structures. Support neighborhoods, city teams, and city initiatives that improve the quality of life in St. Petersburg. Refer citizens in need to volunteer help, loan programs, and other city services provided by Police, Fire, Planning & Economic Development Services, and Sanitation. Support City Council to craft and administer ordinances which address community concerns. Address blighting issues which include overgrown vegetation, junk and rubbish, and inoperative motor vehicles. Discourage unsafe maintenance and parking practices on private property that may otherwise lead to criminal activity and vehicle accidents. Address unfit and unsafe structures through condemnation resulting in rehabilitation or demolition. Provide administrative and clerical services, including a citizen telephone call center, in support of the various education and enforcement programs. Administer and supervise the Neighborhood Team, commonly called the N-Team; this includes budget and expenditure oversight. Budgetary Cost Summary Wages And Benefits 2,445,201 2,599,294 2,658,856 2,658,856 2,616,218 2,783, % Services And Commodities 996, , , , , ,000 (1.79%) Total Budget 3,441,226 3,565,105 3,473,411 3,474,265 3,505,893 3,583, % Appropriations By Fund/Program General Operating Fund Codes Compliance Assistance Program 2,523,703 2,474,773 2,439,255 2,439,789 2,461,986 2,512, % Local Housing Assistance Codes Compliance Assistance Program % Home Program Codes Compliance Assistance Program % Neighborhood Stabilization Program Housing Trust Funds Program 10,446 1, % Sanitation Operating Sanitation & Codes Compliance Program 907,076 1,088,313 1,034,156 1,034,476 1,043,907 1,071, % Total Budget 3,441,226 3,565,105 3,473,411 3,474,265 3,505,893 3,583, % Revenue Sources General Government ,000 3,000 3,035 3, % Violation Of Local Ordinances 465, , , , , , % Special Assessment ,050 73,050 73,050 73, % Sale Of Fixed Assets 7, % Misc Revenue % General Fund 2,049,667 1,980,549 1,863,205 1,863,739 1,885,936 1,936, % Sanitation Operating 906,656 1,087,963 1,034,156 1,034,476 1,043,872 1,071, % Preservation Reserve 0 (2) % Department Summary Page 6
87 City of St. Petersburg FY2013 Budget Revenue Sources Local Housing Assistance % Neighborhood Stabilization Program 10,446 1, % Home Program % Total Revenue 3,441,226 3,565,105 3,473,411 3,474,265 3,505,893 3,583, % Position Summary Codes Compliance Assistance Program % Sanitation & Codes Compliance Program (2.48%) Total Full-Time FTE % Total FTE % Notes - In FY13, the Codes Compliance Department's budget increased 3.18% primarily due to increases in medical ($47,524) and (ERS) employment retirement services ($54,474) line items. Also, a full-time Codes Permit Tech II ($70,212) will be funded through labor distribution out of the Billing & Collections Department for FY13. Department Summary Page 7
88 City of St. Petersburg FY2013 Budget Downtown Enterprise Facilities Department Department Mission Statement The mission of the Downtown Enterprise Facilities Department is to oversee the management and operation of its assigned facilities, ensuring safe and enjoyable access to residents and visitors, while taking measures to operate those facilities efficiently and economically, and stabilizing and reducing subsidies where possible. Services Provided The Downtown Enterprise Facilities Department provides the following services: Oversight of the management, operation, and/or contract management for the following city facilities and related business: the Pier, the Port, the Marina, Albert Whitted Airport, Jamestown, Dwight Jones Center, Sunken Gardens, the Coliseum, Manhattan Casino, Mahaffey Theater at the Progress Energy Center, Tropicana Field, and Progress Energy Park. Budgetary Cost Summary Wages And Benefits 5,231,236 5,239,766 5,384,668 5,358,908 5,220,324 5,369,066 (0.29%) Services And Commodities 9,348,536 9,869,636 8,845,371 8,894,600 9,243,878 8,383,736 (5.22%) Capital 36,041 2,166 13,000 29,500 25,729 13, % Debt 673, , , , , , % Grants And Aid 284, , , , , , % Transfers Out 1,040, , , , , , % Total Budget 16,613,918 16,530,274 15,766,810 15,929,778 16,044,802 15,313,523 (2.87%) Appropriations By Fund/Program General Operating Fund Airport Program 0 6, % Downtown Enterprise Facilities Program 395, , , , , , % Dwight Jones Center Program 65,916 61,394 64,668 64,695 64,036 69, % Housing Administration Program % Non-Departmental/Arts/Social Services 0 627, , , , , % Totals for General Operating Fund 461, , , , , , % Mahaffey Theater Operating Mahaffey Theater Program 3,664,543 3,727,486 3,532,399 3,532,399 3,524,754 3,229,514 (8.57%) Pier Operating Pier Program 2,824,783 2,308,969 2,373,869 2,373,891 2,345,321 1,804,307 (23.99%) Coliseum Operating Coliseum Program 791, , , , , , % Sunken Gardens Coliseum Program Sunken Gardens Program 0 863, , , , , , % 4.17% Totals for Sunken Gardens 863, , , , , , % Tropicana Field Tropicana Field Program 2,467,268 2,367,470 2,421,227 2,421,227 2,415,144 2,414,716 (0.27%) Sanitation Operating Parking Revenue Program % Airport Operating Airport Program 1,258, , , , ,621 1,043, % Marina Operating Marina Program 3,088,501 3,387,680 3,225,402 3,251,371 3,306,834 3,474, % Jamestown Complex Dwight Jones Center Program Jamestown Complex Program 0 531, , , , , , % 2.55% Department Summary Page 8
89 City of St. Petersburg FY2013 Budget Appropriations By Fund/Program Totals for Jamestown Complex 531, , , , , , % Port Operating Port Program 662, , , , , ,101 (13.90%) Total Budget 16,613,918 16,530,274 15,766,810 15,929,778 16,044,802 15,313,523 (2.87%) Revenue Sources Transportation Charges 1,370,187 1,495,297 1,485,820 1,485,820 1,433,587 1,414,430 (4.80%) Housing Services 509, , , , , , % Culture And Recreation Charges 7,794,848 7,748,221 7,769,678 7,769,678 8,043,218 7,726,877 (0.55%) Other Charges For Services 1,552 3, % Traffic And Parking % Interest Earnings 3,712 22,699 6,623 6, ,998 (54.73%) Rents And Royalties 746, , , , , ,550 (47.72%) Sale Of Fixed Assets % Contributions And Donations 844 3, , , ,000 (10.80%) Misc Revenue 266, , , , , , % Other Charges (1,284) % Transfer From General Fund 4,662,700 4,548,335 3,993,000 3,993,000 4,306,600 3,668,520 (8.13%) Transfer From Economic Stability % Transfer From Airport Capital Projects % Sunken Gardens 35,252 4,173 (259) (259) (4,109) 3 (101.16%) Pier Operating 117,242 54,634 1,161 1,183 (5,720) 7, % Mahaffey Theater Operating (32,017) 4,410 3,855 3,855 (3,788) 126, % Marina Operating 318, ,382 (193) 25,776 (16,941) 1,644 (951.81%) Port Operating (30,929) 122,923 (307) 32 5, (124.43%) General Fund 432, , , , , , % Airport Operating 176,501 (425) (33,919) (22,953) (8,926) 48,753 (243.73%) Jamestown Complex (50,579) 20,752 47,622 47,675 60,281 50, % Coliseum Operating 57,296 3,556 (2,151) (1,864) (1,864) 0 (100.00%) Tropicana Field 233,886 (34,613) 35,586 35,586 35,264 (344) (100.97%) Sanitation Operating % Total Revenue 16,613,918 16,530,274 15,766,810 15,929,778 16,044,802 15,313,523 (2.87%) Position Summary Airport Program % Coliseum Program % Downtown Enterprise Facilities Program % Jamestown Complex Program % Marina Program % Port Program (50.00%) Sunken Gardens Program % Total Full-Time FTE (2.78%) Airport Program % Coliseum Program % Dwight Jones Center Program % Marina Program % Port Program % Sunken Gardens Program % Total Part-Time FTE % Department Summary Page 9
90 City of St. Petersburg FY2013 Budget Position Summary Total FTE (0.40%) Notes - All costs required for the administration of this department (DEF), except for the Progress Energy Park charges, are allocated to the facilities managed according to the estimated amount of time spent directing and assisting in each operation. - The six full-time positions in the Downtown Enterprise Facilities Program are currently staffed at different locations but provide administrative and accounting services through the Downtown Enterprise Facilities Department, with salaries and benefits costs allocated to each facility. - The department's General Fund budget increased by 10.57% in FY13 due to the department taking over management of the Manhattan Casino ($85,664). - There are various changes at each of the facilities to reflect anticipated events, attendance, and revenue. The only facility with any major change in service level or staffing is the Pier. It is scheduled to close on May 31, 2013 with an additional 45 day wind down period. - There are capital requests in the amount of $13,000 for replacement of carpeting and air conditioning at Jamestown. - The FY13 amount for Non-Departmental costs is $53,000, which includes $15,000 for the Pier Aquarium and $38,000 for the Florida Orchestra. Department Summary Page 10
91 City of St. Petersburg FY2013 Budget Marketing & Communications Department Department Mission Statement The mission of the Marketing & Communications Department is to provide citizens, businesses, and visitors of the city information to enhance their lives, opportunities, and experiences through the promotion of the city's services, diverse communities, and cultural events and organizations. Services Provided The Marketing & Communications Department provides the following services: Communicates with media. Disseminates news and press releases. Coordinates press conferences and ceremonial events. Coordinates and places city advertising. Provides marketing services to support city departments, including the Mayor's Office. Oversees content and design for the city web site, Creates graphic design for print, web, and other purposes. Coordinates city photography. Broadcasts 24 hours a day via three cable channels (615 - Brighthouse, 15 - Knology, and 20 - Verizon FiOS) and a USF FCC-licensed broadcast channel (35). Also, webcasts via live streaming on the city's website. Broadcasts gavel-to-gavel coverage of the City Council, City Council Committees, City Council Workshops, City Council Committees of the Whole and seven other city boards/commissions. Produces/broadcasts informational feature programs, promotional spots, weekly and monthly television programs, and bulletin board information regarding city events and services. Provides other services such as maintaining A/V equipment in Council Chamber and City Hall, providing video documentation of key city issues or events, creating an on-hold message for city phone services, etc. Recruits and supports the planning and promotion of events that generate an economic impact for the city and help enhance a positive national and international profile of the city. Promotes and produces St. Pete International Baseball including all advertising, media, game day activities, etc. Collaborates with local organizations and Visit St. Pete/Clearwater to enhance tourism opportunities. Provides outreach services at major city events and conferences/meetings. Coordinates the city's street banner program. Provides staffing for the International Relations Committee and maintains relationships with Sister Cities of Takamatsu, Japan and St.Petersburg, Russia. Oversees Community Cultural Plan through the Arts Advisory Committee. Oversees the process for city grant funding to arts organizations through the Arts Advisory Committee. Oversees the city's public art program through the Public Art Commission. Acts as an advocate for and liaison with the city's museums and arts/cultural organizations. Facilitates St. Petersburg Arts - a collaborative of the Executive Directors and Board Presidents of St. Petersburg's cultural institutions and arts organizations. Budgetary Cost Summary Wages And Benefits 1,314,667 1,307,180 1,429,996 1,429,996 1,580,911 1,439, % Services And Commodities 641, , , , , ,342 (6.48%) Capital 11,268 40,015 43,000 43,000 43,000 69, % Grants And Aid 262, , , , , , % Total Budget 2,229,783 2,132,630 2,186,292 2,369,792 2,329,338 2,211, % Appropriations By Fund/Program General Operating Fund Arts & International Relations Program 114, , , , , , % Marketing & Communications Program 1,417,047 1,176,689 1,240,366 1,308,866 1,363,992 1,240,002 (0.03%) Non-Departmental/Arts/Social Services 0 260, , , , , % Television Program 697, , , , , ,201 (4.77%) Totals for General Operating Fund 2,229,783 2,091,263 2,149,292 2,232,792 2,242,338 2,142,221 (0.33%) Arts And Cultural Programs Arts & International Relations Program ,000 50, % Fleet Management Department Summary Page 11
92 City of St. Petersburg FY2013 Budget Appropriations By Fund/Program Marketing & Communications Program % Television Program % Totals for Fleet Management 0 1, % Technology & Infrastructure Fund Television Program 0 40,015 37,000 37,000 37,000 69, % Total Budget 2,229,783 2,132,630 2,186,292 2,369,792 2,329,338 2,211, % Revenue Sources Other Charges For Services 16,494 18,062 20,000 20,000 20,000 20, % Contributions And Donations 6,065 9,577 5,000 5,000 2,000 5, % Misc Revenue % General & Administrative 918, , , , , , % Transfer From Parking Revenue 15,000 22,896 22,896 22,896 22,896 22, % General Fund 1,272,591 1,094,115 1,154,578 1,238,078 1,250,624 1,147,507 (0.61%) Technology & Infrastructure Fund 0 40,015 37,000 37,000 37,000 69, % Fleet Management 0 1, % Arts And Cultural Programs ,000 50, % Total Revenue 2,229,783 2,132,630 2,186,292 2,369,792 2,329,338 2,211, % Position Summary Arts & International Relations Program % Marketing & Communications Program % Television Program % Total Full-Time FTE % Marketing & Communications Program % Television Program % Total Part-Time FTE % Total FTE % Notes - In FY13, the department's General Fund budget will decrease by 0.33%. s to the budget include cancelling the lease of rooftop space on building for the television transmitter equipment ($27,225), eliminating professional photography for the Employee Recognition Council and council presentations ($5,000), and not renewing the subscription to the VOCUS media database ($6,000). - The FY13 amount for Non-Departmental costs is $299,000, which includes $25,000 for First Night, $175,000 for Arts Grants, $35,000 for the Festival of States, $35,000 for MLK Festival of Bands, $17,000 for the MLK Parade, and $12,000 for the Museum of History. - In FY12, the department added a full-time Event Recruitment & Management Manager position and a full-time Event Recruitment & Management Coordinator position. Department Summary Page 12
93 City of St. Petersburg FY2013 Budget Planning & Economic Development Department Department Mission Statement The mission of the Planning & Economic Development Department is to broaden the city's economic base and encourage economic expansion in St. Petersburg, implement city development goals and state regulations through planning, land development regulation, and permitting services. Services Provided Planning, and Construction Services and Permitting provides the following services: Prepare, maintain, and amend as needed the city's Comprehensive Plan as required by Florida Statutes Chapter 163 including the Evaluation & Appraisal report and subsequent Comprehensive Plan text amendments. Prepare and maintain city's records of zoning and land use for every parcel. Process private applications for amendments to the Comprehensive Plan map and text. Participate with review agencies including regional planning council and state planning agency. Prepare, implement, and amend the city's land development regulations as required by Florida Statutes Chapter 163 including: zoning; historic preservation; neighborhood design review; landscaping, tree preservation, and environmental preservation; airport zoning; non-structural uses: pushcarts, sidewalk sales, temporary uses, roadside vending, and special approval uses ( i.e. adult use and alcoholic beverage). Meet with property owners, developers, and design professionals to identify which land development regulations apply to their property, review their development goals, and identify the process to achieve their goals. Review applications for construction, which includes providing plan review for zoning, engineering, fire and building, plumbing, electrical, and mechanical by licensed plan examiners, issuing construction permits, providing inspections by licensed inspection staff, and maintaining records of all the above. Maintain the city's participation in the Federal Emergency Management Agency's Flood Insurance program including code enforcement, construction plan review and inspection, and annual reporting. Economic Development provides the following services: Business retention and recruitment, including lead response, marketing, and incentive programs. Business training and counseling at the Business Assistance Center. Small Business Enterprise (SBE) program development and administration. Community Redevelopment Area (CRA) Program, including administration of all seven of the city's existing CRA areas. Annexation of unincorporated lands, including identifying and pursuing viable annexation candidates. Development of Regional Impact Program, including administration of the city's two city-sponsored areawide Development of Regional Impact (DRI) for the downtown and gateway areas. Demographic research for internal and external purposes and customers. Community development services/facilitation. Budgetary Cost Summary Wages And Benefits 6,175,051 5,655,691 5,486,371 5,486,371 5,256,728 5,332,572 (2.80%) Services And Commodities 1,390,867 1,264,403 1,222,113 1,241,672 1,151,834 1,204,674 (1.43%) Capital 80,923 21, % Grants And Aid 55,545 87,199 76,000 76,000 76,000 76, % Total Budget 7,702,387 7,028,621 6,784,484 6,804,043 6,484,562 6,613,246 (2.52%) Appropriations By Fund/Program General Operating Fund Business Assistance Program Community Enrichment Admin Program 629, , , , , , , ,590 0 (14.87%) 0.00% Construction Services & Permitting 38, , , , , ,872 (8.97%) Program Development Review Services Program 810, , , , , , % Midtown Economic Development Program 159,940 5, % Non-Departmental/Arts/Social Services 42,728 58,899 76,000 76,000 76,000 76, % Permitting & Codes Administration Program 678, % Planning and Economic Development Program 1,013, , , , , ,748 (1.42%) Urban Design & Historic Preservation 348,205 (29,673) % Program Weed & Seed Program 274, , % Department Summary Page 13
94 City of St. Petersburg FY2013 Budget Appropriations By Fund/Program Totals for General Operating Fund 4,328,545 3,556,730 3,298,880 3,317,962 3,096,157 3,074,055 (6.82%) Neighborhood Stabilization Program Housing Trust Funds Program 4, % Building Permit Special Revenue Construction Services & Permitting Program 3,369,229 3,471,891 3,485,604 3,486,081 3,388,405 3,539, % Total Budget 7,702,387 7,028,621 6,784,484 6,804,043 6,484,562 6,613,246 (2.52%) Revenue Sources Contractors Permits 2,791,180 2,843,826 2,631,000 2,631,000 3,168,563 3,123, % Other License And Permits 14,939 10,409 78,100 78,100 72, , % Federal Grants 145,673 63, % General Government 533, , , , , , % Transportation Charges (205) % Sale Of Fixed Assets , % Contributions And Donations 1, % Misc Revenue (650) 64, % General & Administrative 139, , , , (100.00%) General Fund 3,923,900 3,197,708 2,972,260 2,991,342 2,912,985 2,791,140 (6.09%) Building Permit Special Revenue 159,547 84, , ,081 38,105 (3,809) (100.88%) Sanitation Operating (10,856) (11,203) 0 0 (11,688) % Neighborhood Stabilization Program 4, % Total Revenue 7,702,387 7,028,621 6,784,484 6,804,043 6,484,562 6,613,246 (2.52%) Position Summary Business Assistance Program (25.00%) Community Enrichment Admin Program % Construction Services & Permitting Program % Development Review Services Program % Midtown Economic Development Program % Planning and Economic Development Program % Weed & Seed Program % Total Full-Time FTE (2.95%) Construction Services & Permitting Program % Total Part-Time FTE % Total FTE (2.20%) Notes - The department's General Fund budget will decrease by 6.82% in FY13. This is due to eliminating a vacant full-time Safe Haven Coordinator position ($24,710), transferring an Economic Development Coordinator position to the Community Services Department ($91,407), eliminating a full-time Administrative Secretary position ($35,499), sharing expenses of an administrative position with another department ($33,547), increasing the salary transfer of the director to the Building Permit Special Revenue Fund ($14,666), and miscellaneous line item reductions ($9,000). Department Summary Page 14
95 City of St. Petersburg FY2013 Budget - The department has completed a comprehensive analysis of the fee schedule and has identified many opportunities to increase fees while keeping the city's fees with the range of fees charged by our peer local governments. These changes were done in FY12 ($99,743). - The Construction Services and Permitting Program was transferred out of the General Fund into a new Building Permit Special Revenue Fund in FY08. This move was in response to State Statute that requires revenue and expenses for the enforcement of the Florida building code be in a separate fund. The budget for the Building Permit Special Revenue Fund is increased by 1.54% due to the addition of a full-time Code & Permit Tech I and a part-time Plans Review Coordinator position. These positions are needed due to increased permitting activity. The funds for these positions will be offset by increased revenue. Department Summary Page 15
96 City of St. Petersburg FY2013 Budget Real Estate & Property Management Department Department Mission Statement The mission of the Real Estate & Property Management Department is to provide technical and professional expertise in the negotiation of acquisitions for the city of St. Petersburg's capital and neighborhood improvement projects, dispositions of surplus real estate, and leasing of various city-owned properties while managing each in a manner to maximize contributions to the economic and revenue base for the city, in addition to overseeing the design, construction, renovation, and maintenance of the city`s municipal office buildings [City Hall, City Hall Annex, Municipal Services Center (MSC), and MSC Garage]. Services Provided The Real Estate & Property Management Department provides the following real estate services: Prepares contracts, monitors and directs the appraisal, acquisition, and disposition of real estate, including but not limited to the negotiation, contract, and closing of real estate transactions for various city departments in accordance with city policy. Prepares contracts, monitors and manages the appraisal, acquisition, and disposition of city-owned real estates under Florida Statute 163. Initiates, monitors, and directs payments for real estate related services, including but not limited to appraisals, real estate closings, demolitions, and environmental inspections. Prepares leases, monitors and manages commercial and non-profit leases for city-owned properties, including but not limited to tenant contact, rent collection, and lease enforcement. Provides real estate support and information services for all city departments including but not limited to valuation information, property maps, ownership information, official records, including appraisals, deeds, mortgages, title and environmental reports, and survey and legal descriptions. The Municipal Office Buildings Fund provides the followings services: Provides administrative direction to ensure proper management and maintenance of municipal office buildings including City Hall, City Hall Annex, MSC, and MSC Garage. Budgetary Cost Summary Wages And Benefits 1,309,509 1,326,391 1,203,858 1,203,858 1,190,252 1,226, % Services And Commodities 1,591,952 1,470,756 1,573,599 1,550,944 1,577,255 1,494,220 (5.04%) Capital 72,698 42, ,500 20, % Total Budget 2,974,159 2,839,981 2,777,457 2,775,302 2,788,007 2,720,847 (2.04%) Appropriations By Fund/Program General Operating Fund Real Estate & Property Mgmt Admin Program 742, , , , , ,947 (4.57%) American Recovery & Reinvestment Act Real Estate & Property Mgmt Admin Program % Neighborhood Stabilization Program Housing Trust Funds Program 66,800 29, % Municipal Office Buildings Municipal Office Buildings Program 2,164,352 1,997,099 2,050,309 2,053,512 2,100,984 2,026,900 (1.14%) Real Estate & Property Mgmt Admin Program % Totals for Municipal Office Buildings 2,164,352 1,997,206 2,050,309 2,053,512 2,100,984 2,026,900 (1.14%) Total Budget 2,974,159 2,839,981 2,777,457 2,775,302 2,788,007 2,720,847 (2.04%) Revenue Sources General Government 0 0 1,020 1,020 1,020 1, % Other Charges For Services 2, % Interest Earnings 76, ,795 42,300 42,300 48,259 42, % Rents And Royalties 2,895,631 2,929,391 3,005,395 3,005,395 3,032,484 3,005, % Department Summary Page 16
97 City of St. Petersburg FY2013 Budget Revenue Sources Sale Of Fixed Assets 30, % Misc Revenue % Municipal Office Buildings (501,891) (708,009) (643,488) (640,285) (598,772) (666,897) 3.64% General Fund 404, , , , , ,029 (8.92%) Neighborhood Stabilization Program 66,800 29, % American Recovery & Reinvestment Act % Total Revenue 2,974,159 2,839,981 2,777,457 2,775,302 2,788,007 2,720,847 (2.04%) Position Summary Municipal Office Buildings Program % Real Estate & Property Mgmt Admin Program (8.33%) Total Full-Time FTE (4.17%) Municipal Office Buildings Program % Total Part-Time FTE % Total FTE (2.63%) Notes - In FY13, the department's General Fund budget will decrease by 4.57% due to the department sharing costs of an Administrative Secretary position with another department ($34,365). Department Summary Page 17
98 City of St. Petersburg FY2013 Budget Transportation & Parking Management Department Department Mission Statement The mission of the Transportation & Parking Management Department is to provide superior transportation services to the citizens of St. Petersburg that maintain consistency with the city's Comprehensive Plan and support neighborhood cohesiveness, enhanced public safety, economic development, and improved quality of life as outlined in the city's Vision 20/20 Program. Services Provided The Transportation & Parking Management Department provides the following services: Provides well maintained roadways with proper lighting, safe and accessible sidewalks and crossings for pedestrians, bicycle lanes, neighborhood traffic management programs, and efficient intersections. Provides management and planning for downtown parking facilities. Budgetary Cost Summary Wages And Benefits 2,038,967 2,367,967 2,591,662 2,591,662 2,670,954 2,749, % Services And Commodities 2,363,943 2,433,689 2,373,628 2,420,103 2,481,641 2,346,170 (1.16%) Capital 59,525 (393) , % Grants And Aid 20,000 20,000 20,000 20,000 7,000 20, % Total Budget 4,482,435 4,821,263 4,985,290 5,031,765 5,159,595 5,195, % Appropriations By Fund/Program General Operating Fund Downtown Enterprise Facilities Program % Engineering Parking Program 22,250 32, % Engineering Support Program 4,899 (811) % Transportation Planning Administration 1,854 5, , % Program Transportation Program 487, , , , , ,281 (8.37%) Totals for General Operating Fund 516, , , , , ,281 (8.37%) Parking Revenue Engineering Parking Program 339, , % Parking Enforcement Program 1,062, ,064 1,091,617 1,090, ,289 1,285, % Parking Revenue Program 2,562,479 2,561,280 3,203,606 3,209,370 3,520,709 3,278, % Totals for Parking Revenue 3,963,768 3,917,447 4,295,223 4,300,053 4,484,998 4,563, % Neighborhood Stabilization Program Housing Trust Funds Program 1, % Utility Tax Debt Service Parking Enforcement Program % Billing & Collections Parking Enforcement Program % Total Budget 4,482,435 4,821,263 4,985,290 5,031,765 5,159,595 5,195, % Revenue Sources Other License And Permits 4,250 6, ,393 7, % Transportation Charges 3,141,838 3,626,581 4,049,714 4,049,714 4,150,473 4,253, % Other Charges For Services 18,042 23, % Traffic And Parking 1,965,326 1,797,302 1,670,000 1,670,000 1,691,533 1,840, % Violation Of Local Ordinances 510 1, % Department Summary Page 18
99 City of St. Petersburg FY2013 Budget Revenue Sources Rents And Royalties 64,109 56,661 30,000 30,000 51,183 30, % Sale Of Fixed Assets 6,327 28, , % Misc Revenue (289,996) (191,067) (200,000) (200,000) 0 (200,000) 0.00% Other Charges (104) (437) (63) % Parking Revenue (550,044) (1,045,388) (954,944) (950,114) (1,051,136) (1,067,226) 11.76% General Fund 508, , , , , ,281 (8.37%) Mahaffey Theater Operating % Billing & Collections % School Crossing Guard (387,808) (352,752) (300,000) (300,000) (363,039) (300,000) 0.00% Neighborhood Stabilization Program 1, % Utility Tax Debt Service % Total Revenue 4,482,435 4,821,263 4,985,290 5,031,765 5,159,595 5,195, % Position Summary Engineering Parking Program % Parking Enforcement Program % Parking Revenue Program % Transportation Program (4.06%) Total Full-Time FTE % Total FTE % Notes - In FY13, the department's General Fund budget will decrease 8.37%. This decrease is due to reductions in Consulting ($5,000), Telephone ($624), R/M Vehicles ($11,108), Fuel ($37,479) and Vehicle Replacement ($12,103). In addition, the increase in labor distribution to the Parking Fund ($27,291) for the Director's position is due to increased administrative duties assuming four parking enforcement divisions. - In FY13, the department's Parking Fund budget will increase 6.25%. Miscellaneous increases total $26,700. Additional increases also include purchase of two segways ($10,000), two Parking Enforcement Officers ($73,334), hand held ticket replacement and cleaning/sealing of South Core Parking Garage ($170,000). Reductions include Pier parking reductions due to pay stations being more efficient and Urban Property Management not being involved ($50,000), reduce Office System Specialist position ($50,608) subsequently sharing an Administrative Assistant position with Planning & Economic Development. Revenue changes include reduction in employee parking ($138,000), increase in parking meter revenue ($170,000), increase in events at Al Lang Field ($50,000), increase parking rate by $5.00 at Al Lang Field ($15,000), and increase for South Core Garage customers ($100,000). A $696,000 transfer to the Downtown Capital Projects Fund for capital improvement projects was done in addition to reducing the transfer to the General fund from ($404,000) to ($350,000). - Also during FY12, the Engineering Parking Program was moved to the Transportation and Parking Management Department. One of the five full-time positions remained in the department; two positions moved to the Stormwater, Pavement & Traffic Operations Department and the remaining two went to the Transportation and Parking Management Department. All five positions' cost is charged to the Parking Fund. Department Summary Page 19
100 City of St. Petersburg FY2013 Budget General Government Administration General Government Administration Total Full Time Equivalents (FTE) = Audit Services Department Total Full Time Equivalents (FTE) = 5.50 Billing & Collections Department Total Full Time Equivalents (FTE) = Budget & Management Department Total Full Time Equivalents (FTE) = 6.50 City Clerk Total Full Time Equivalents (FTE) = City Council Total Full Time Equivalents (FTE) = Finance Department Total Full Time Equivalents (FTE) = Human Resources Department Total Full Time Equivalents (FTE) = Information & Communication Services Department Total Full Time Equivalents (FTE) = Legal Department Total Full Time Equivalents (FTE) = Mayor's Office Total Full Time Equivalents (FTE) = Department Summary Page 20
101 City of St. Petersburg FY2013 Budget General Government Administration Budgetary Cost Summary Wages And Benefits 22,806,710 22,351,575 19,620,168 19,662,416 21,319,368 22,361, % Services And Commodities 64,442,543 59,326,225 59,149,138 60,143,814 57,883,901 62,163, % Capital 796, , ,800 1,169,913 1,273,768 2,022, % Debt 38,187,894 37,876,257 40,620,040 62,150,040 63,506,079 36,919,317 (9.11%) Grants And Aid 871,582 1,038, ,000 1,016, , ,000 (25.75%) Transfers Out 177,748,187 53,128,203 32,131,015 56,228,965 55,032,209 20,421,163 (36.44%) Contingencies , , ,000 (5.19%) Total Budget 304,853, ,342, ,026, ,852, ,996, ,359,658 (5.63%) Appropriations By Fund/Department General Operating Fund Audit Services Department 940, , , , , , % Budget & Management Department 6,510,864 5,436,052 3,187,091 2,877,231 4,995,145 5,180, % City Clerk 1,164, ,498 1,195,204 1,204,621 1,208,628 1,184,944 (0.86%) City Council 887, , , , , , % Finance Department 11,046,822 11,496,754 9,526,505 9,652,008 9,499,777 10,910, % Human Resources Department 3,696,092 3,529,785 3,404,343 3,448,893 3,244,300 2,923,765 (14.12%) Information & Communication Services Department % Legal Department 2,936,957 3,427,858 2,287,812 2,812,812 2,914,307 2,531, % Mayor s Office 2,178,500 2,382,608 1,993,811 2,119,317 1,986,307 2,039, % Non-General Funds Total General Operating Fund 29,361,497 29,007,065 23,275,543 23,859,409 25,629,243 26,555, % Assessments Revenue 177, ,128 98,131 98,131 98,131 5,589 (94.30%) Banc Of America Notes Debt Service Fund 1,173,020 1,178,269 1,181,512 22,847,512 21,967, ,147 (83.48%) BB&T Notes 0 28, , , , , % Billing & Collections 10,436,111 8,919,346 8,380,587 8,337,547 8,014,950 8,535, % Commercial Insurance 6,621,100 4,679,853 4,881,431 4,881,431 4,881,597 4,945, % Community Redevelopment District 11,347,559 6,712,750 6,703,500 7,953,500 8,568,245 0 (100.00%) Deferred Compensation - ICMA 4,316,712 4,824,357 32,798 32,798 43,407 35, % Downtown Redevelopment District 10,528,854 12,679,936 8,169,124 8,169,124 7,039,369 1,904,248 (76.69%) Economic Development 12, % Economic Stability , % Emergency Medical Services 0 6, % Equipment Replacement 1,757, % Excise Tax Revenue 19,765, ,945 1,431,495 1,431,495 1,711,895 0 (100.00%) FFGFC Loan 2,697,021 2,700,602 2,706,550 2,706,550 2,707,858 2,699,100 (0.28%) Fleet Management 721, % Franchise Tax Revenue 21,018,607 2,896, % General Liabilities Claims 13,529,694 2,503,722 2,265,672 2,265,672 2,245,687 2,148,998 (5.15%) Health Facilities Authority ,000 14, , % Health Insurance 32,953,551 33,099,147 34,019,506 34,020,461 33,996,000 36,588, % Industrial Development 123, % Information & Communication Services 12,017,169 9,934,058 10,190,139 10,569,150 10,775,365 10,337, % JP Morgan Chase Revenue Notes ,794,000 21,538,072 1,228, % Life Insurance 1,090, , , , , ,028 (15.90%) Local Option Tax Revenue 25,908,004 4,503, % Municipal Office Buildings 305, , , , , ,143 (6.38%) Department Summary Page 21
102 City of St. Petersburg FY2013 Budget Appropriations By Fund/Department Neighborhood Stabilization Program 0 216, % Parking Revenue 307, , , , ,500 1,155, % Pc Replacement 3,863,030 (155,906) % Print Shop 387,651 33, % Pro Sports Facility 2,000,004 2,000,004 2,000,004 2,000,004 2,000,004 2,000, % Radio Replacement 1,208, % Redevelopment Debt Service 6,680,875 6,713,250 6,703,500 6,703,500 6,703,500 0 (100.00%) Sanitation Operating 342, % School Crossing Guard 355, , , , , , % Sports Facility Sales Tax Debt 1,912,244 1,914,490 1,911,587 1,911,587 1,472,802 1,911,078 (0.03%) Stadium Debt Service 8,639,905 8,537,094 8,620,019 8,620,019 8,525,569 8,517,408 (1.19%) Stormwater Debt Service 1,053,076 1,055,452 1,053,332 1,053,332 1,053,533 1,055, % Stormwater Utility Operating 137,856 3, % Supply Management 238,128 (6,196) % Technology & Infrastructure Fund 0 504, ,800 1,389,143 1,197,481 3,517, % Utility Tax Debt Service 2,824,064 (918) % Utility Tax Revenue 41,661, , % Water Cost Stabilization 2,994,316 2,752,806 1,500,000 1,500,000 1,500,000 1,500, % Water Resources (5,648) 112, % Water Resources Debt 13,450,561 15,861,905 18,046,144 18,046,144 20,124,902 20,692, % Weeki Wachee 75,871 1,777, , , , , % Workers' Compensation 10,862,030 6,282,295 7,247,940 7,247,940 4,947,168 7,218,214 (0.41%) Total Non-General Funds 275,492, ,335, ,750, ,993, ,367, ,803,800 (9.14%) Total Budget 304,853, ,342, ,026, ,852, ,996, ,359,658 (5.63%) Revenue Sources Taxes Property Delinquent 367, , , , , , % Taxes Property Penalties & Interest 7,929 4, % Taxes Property Current 83,109,215 74,570,330 69,616,255 69,616,255 69,616,255 78,560, % Taxes Franchise Natural Gas 901, , , , , ,500 (7.95%) Taxes Franchise Electricity 21,258,541 19,684,895 19,695,527 19,695,527 19,084,985 20,384, % Taxes Utility Services Natural Gas 591, , , , , ,834 (3.06%) Taxes Utility Services Water 3,443,292 3,574,736 3,669,137 3,669,137 3,795,432 3,555,416 (3.10%) Taxes Utility Services Fuel Oil 3, ,300 2,300 3,052 3, % Taxes Utility Services 0 (488) % Taxes Utility Services Communications 13,099,351 13,107,242 12,791,371 12,791,371 13,300,000 12,961, % Services Tax Taxes Utility Services Electricity 22,432,711 21,113,455 21,161,401 21,161,401 20,245,455 21,279, % Taxes Utility Services Propane 141, , , , , , % Business Taxes 2,405,903 2,407,083 2,500,000 2,500,000 2,531,000 2,340,000 (6.40%) Contractors Permits 4,238 52, % Other License And Permits 13, ,100 5,100 5,100 5, % Federal Grants 1,167, ,370 1,188,752 1,188,752 1,188,752 1,186,809 (0.16%) State Grants , % Shared State Revenue Sharing 7,433,838 7,463,366 7,665,401 7,665,401 7,664,855 7,949, % Shared State Mobile Home 98, , , , , , % Shared State Alcoholic Beverag 119, , , , , , % Shared State Sales Tax - Half 13,870,492 14,347,797 12,911,198 12,911,198 16,872,608 17,302, % Shared Revenue 35,467,727 11,930,501 18,098,069 13,981,317 11,493,906 11,766,268 (34.99%) General Government 216, , , , , , % Other Charges For Services 126, , , , , , % Violation Of Local Ordinances 1,129,696 1,119,788 1,160,000 1,160,000 1,166,000 1,485, % Interest Earnings 12,411,728 (3,323,358) 3,470,817 3,470,817 4,196,968 3,656, % Rents And Royalties 98, ,417 24,000 24,000 24,000 24, % Department Summary Page 22
103 City of St. Petersburg FY2013 Budget Revenue Sources Special Assessment 184,011 97, , ,000 85, ,000 (28.57%) Sale Of Fixed Assets 7, ,000 10,000 72,547 10, % Contributions And Donations 91,050,481 52,766,130 46,717,144 46,717,144 54,076,674 50,585, % Misc Revenue 474,851 1,423, , ,981 1,408, ,240 (8.27%) General & Administrative 6,694,292 7,216,572 7,262,652 7,262,652 7,262,652 7,262, % Payment In Lieu Of Taxes 14,185,748 14,514,720 14,553,396 14,553,396 14,553,396 14,873, % Debt Proceeds 0 9,968, ,522,000 21,522, % Department Charges 11,798,240 11,269,308 10,343,624 10,480,520 11,312,215 11,292, % Other Charges 7,594,833 7,865,229 6,868,449 6,868,449 6,777,012 6,630,614 (3.46%) Transfer From General Fund 2,625,421 7,573,170 2,635,316 6,787,068 7,021,056 8,428, % Transfer From Utility Tax 41,659, % Revenue Transfer From Local Option 3,517, % Tax Revenue Transfer From Franchise Tax 21,018,607 2,896, % Revenue Transfer From Excise Tax Revenue 19,765, ,945 1,431,495 1,431,495 1,711,895 0 (100.00%) Transfer From Emergency Medical 0 6, % Services Transfer From Parking Revenue 0 99, , , , ,000 (13.49%) Transfer From School Crossing 355, , , , , , % Guard Transfer From Weeki Wachee ,000 20,000 20,000 20, % Transfer From Pro Sports Facility 2,000,004 2,000,004 2,000,004 2,000,004 1,999,059 2,000, % Transfer From Downtown Redevelopment 7,501,854 8,164,484 8,169,124 8,169,124 6,998,529 1,704,249 (79.14%) District Transfer From Community Development 841, , , , , ,491 (18.83%) Block Grant Transfer From Neighborhood 0 216, , , % Stabilization Program Transfer From Community Redevelopment 8,867,559 6,712,750 6,703,500 6,703,500 7,318,245 0 (100.00%) District Transfer From JP Morgan Chase ,500,000 21,039, % Revenue Notes Transfer From Banc Of America , , % Notes Debt Service Fund Transfer From Stadium Debt 242, , , ,000 23, ,000 (38.78%) Service Transfer From Public Safety 0 (49,794) % Capital Improvement Transfer From Neighborhood 0 (114,017) % & Citywide Infrastructure Transfer From Recreation & 0 (68,634) % Culture Capital Transfer From City Facilities 0 (11,285) % Capital Improvement Transfer From Water Resources 14,922,808 15,732,127 17,130,250 17,130,250 17,130,250 19,445, % Transfer From Water Cost Stabilization 0 2,519, ,300, % Transfer From Stormwater Utility 1,057,856 1,056,403 1,058,000 1,058,000 1,058,000 1,054,080 (0.37%) Operating Transfer From Sanitation Operating 797, , , , , , % Transfer From Airport Operating 0 50,004 50,000 50,000 50,000 50, % Transfer From Marina Operating 300, , , , , , % Transfer From Jamestown Complex 0 35,004 35,000 35, (100.00%) Transfer From Fleet Management 721, % Transfer From Equipment Replacement 1,757, % Transfer From Information 1,457, , , , , ,000 (50.00%) & Communication Services Transfer From Pc Replacement 3,638,761 (155,906) % Transfer From Radio Replacement 1,162, % Transfer From Supply Management 249, % Transfer From Print Shop 0 (50,908) % Transfer From Life Insurance 216, % Transfer From General Liabilities 12,111, % Claims Transfer From Commercial Insurance 1,533, % Department Summary Page 23
104 City of St. Petersburg FY2013 Budget Revenue Sources Transfer From Billing & Collections 1,466, % General Fund (166,487,547) (153,755,942) (155,144,301) (154,804,683) (154,556,949) (163,371,446) 5.30% Franchise Tax Revenue (797,992) 2,896, % Utility Tax Revenue 9,373,356 (1,385) 0 0 1, % Water Resources (544,263) (1,828,015) (20,469) (55,469) (2,499,247) 0 (100.00%) Economic Development 12, % Preservation Reserve (855) (423) 0 0 (200) (500) 0.00% Billing & Collections 1,472,651 (37,553) 21,138 (21,902) (292,970) (115,714) (647.42%) Information & Communication 1,899,230 68, , , ,142 (19,540) (103.49%) Services Parking Revenue 307, , , , ,500 1,155, % Stadium Debt Service (192,763) (191,946) (172,861) (172,861) (172,964) (178,978) 3.54% Excise Tax Revenue 266, ,160 1,431,495 1,431,495 1,711,895 0 (100.00%) Pro Sports Facility (44) (7) (3,968) (3,968) 4 (3,168) (20.16%) Community Development Block (632) % Grant Community Redevelopment District 2,501,388 (1,271,370) (1,270,181) (20,181) 1,271,370 0 (100.00%) Bayboro Harbor Tax Increment (151,662) (68,726) (38,316) (38,316) (38,366) (30,258) (21.03%) District Intown West Tax Increment (502,419) (313,314) (215,912) (215,912) (243,329) (194,246) (10.03%) District Local Option Tax Revenue 3,782,900 4,502, % Downtown Redevelopment District 2,313,237 1,494,590 1,465,624 1,465,624 (279,105) (6,242,028) (525.90%) Industrial Development 123, % General Liabilities Claims 10,390, ,041 15,637 15,637 (4,313) (66,990) (528.41%) Health Facilities Authority (4,853) (3,828) % Weeki Wachee (581,633) 1,575,780 (19,160) 521, ,050 (62,000) % Marina Operating (286,930) % Workers' Compensation (2,186,955) (1,167,547) 189, ,849 (2,376,507) 155,577 (18.05%) Stormwater Utility Operating 116,822 (94,365) 0 0 (82,000) % Sanitation Operating 342,731 90, % Assessments Revenue (45,100) 27,745 (57,757) (57,757) (11,869) (125,411) % Community Housing Donation (1,730) 124, (12,000) % Fleet Management 721, % Municipal Office Buildings 304, , , , , ,143 (6.38%) Redevelopment Debt Service % Health Insurance (9,496,491) 92,701 1,368,347 1,369,302 (134,850) 220,605 (83.88%) Building Permit Special Revenue (479) 53, (42) % Commercial Insurance 1,384,488 (155,536) 1,968 1,968 42,141 70, % Water Resources Debt (1,626,004) (6,447,946) (423,969) (423,969) 1,654,789 (94,146) (77.79%) Equipment Replacement 1,696, , , % Technology & Infrastructure (10,357,139) (329,839) (42,996) 611, ,057 2,509,789 ( %) Fund Deferred Compensation - ICMA (44,332,471) (1,986,770) (167,202) (167,202) (6,656,593) (164,822) (1.42%) Economic Stability (912,089) (361,838) (198,600) (198,600) (227,699) (954,946) % Water Cost Stabilization (13,932) 4,285, ,261 95, % Utility Tax Debt Service 941,500 (918) % Pc Replacement 3,393,137 (162,000) % Local Housing Assistance 0 49, % FFGFC Loan % Sanitation Equipment Replacement (342,731) % Tropicana Field 0 (4) % BB&T Notes 0 (601,556) , % Stormwater Debt Service (5,096) (1,080) (5,000) (5,000) (4,799) 960 (119.20%) Print Shop (25,174) 31, % Neighborhood Stabilization 0 (144,000) % Program Radio Replacement 788, % Police Grant Fund (11,930) (464) 0 0 (66) % Airport Operating (51,469) % Golf Course Operating (462,357) % Arts And Cultural Programs (87) (42) 0 0 (30) % School Crossing Guard 355, , , , , , % Life Insurance 291,760 72, , ,924 (16,171) 64,443 (67.60%) Emergency Medical Services 0 6, % Department Summary Page 24
105 City of St. Petersburg FY2013 Budget Revenue Sources Sports Facility Sales Tax (17,006) (14,700) (17,938) (17,938) (456,264) (16,012) (10.74%) Debt Sunken Gardens (46) (24) % Banc Of America Notes Debt 68,384 71,819 75, , ,824 0 (100.00%) Service Fund Coliseum Operating (77) (27) % Law Enforcement Fund (25) % Supply Management (257,322) (508,364) 0 0 (500,000) % JP Morgan Chase Revenue Notes (158,000) (675,562) 246, % Total Revenue 304,853, ,342, ,026, ,852, ,996, ,359,658 (5.63%) Position Summary By Department Audit Services Department % Billing & Collections Department % Budget & Management Department % City Clerk (6.25%) City Council (12.50%) Finance Department % Human Resources Department (4.53%) Information & Communication Services Department (2.94%) Legal Department (1.24%) Mayor's Office % Total Full-Time FTE (0.80%) Billing & Collections Department % City Clerk % City Council % Human Resources Department % Information & Communication Services Department % Legal Department (25.00%) Mayor's Office % Total Part-Time FTE (1.60%) Total FTE (0.84%) Department Summary Page 25
106 City of St. Petersburg FY2013 Budget General Government Administration Audit Services Department Department Mission Statement The mission of the Audit Services Department is to provide an independent objective assurance and consulting services function within the city, designed to add value and improve the organization's operations. The primary objective is to assist management in the effective discharge of their duties. To this end, the Department provides analysis, appraisals, recommendations, counsel, and information concerning the activities and programs reviewed. The underlying basis for Department objectives is to promote effective control at a reasonable cost. Services Provided The Audit Services Department provides the following services: Financial and compliance audits. Operational and performance audits. Revenue/contract audits. Utility tax, and franchise fee audits. Special reviews and analysis. Grant audits. IT audits. Sales tax audits. Fraud and other investigations. Consulting assignments. Hurricane cost recovery. Budgetary Cost Summary Wages And Benefits 526, , , , , , % Services And Commodities 414, , , , , , % Total Budget 940, , , , , , % Appropriations By Fund/Program General Operating Fund Audit Services Program 940, , , , , , % Total Budget 940, , , , , , % Revenue Sources General & Administrative 445, , , , , , % General Fund 495, , , , , , % Total Revenue 940, , , , , , % Position Summary Audit Services Program % Total Full-Time FTE % Total FTE % Department Summary Page 26
107 City of St. Petersburg FY2013 Budget Notes - The Audit Services budget will increase by 1.09% in FY13 due to replacing auditing software ($12,000). - Salary and benefits for a full-time Senior Auditor position will be reduced by $25,673 for FY13. The department plans to recruit and fill this position at a lower salary range than is currently budgeted in FY12. Also during FY12, the Administrative Secretary ($42,028) will be reinstated and shared with the Budget & Management Department. - The department will also reduce the mileage reimbursement line-item by $4,036. Department Summary Page 27
108 City of St. Petersburg FY2013 Budget Billing & Collections Department Department Mission Statement The mission of the Billing & Collections Department is to provide every customer with a consistent, accurate response to every request in a prompt and timely manner, at all times serving with courtesy, honesty, and fairness. Services Provided The Billing & Collections Department provides the following services: The Utility Accounts Division reads over 95,000 meters per month and bills 90,000+ accounts each month. This function also takes over 25,000 calls per month responding to customer issues. The Business Tax Division issues over 17,000 business tax receipts annually and licenses taxicabs on an annual basis. The Central Cashier Division accepts most monies collected by the city and deposits those funds with the bank. The Special Assessment Division files liens against properties for codes violations and nonpayment of utility bills. The False Alarm Division bills citizens that exceed limits for police false alarms. Budgetary Cost Summary Wages And Benefits 5,367,719 5,324,399 5,198,908 5,198,908 5,207,667 5,343, % Services And Commodities 3,594,067 3,591,072 3,181,679 3,138,639 2,807,283 3,192, % Capital 8,200 3, % Total Budget 8,969,986 8,919,371 8,380,587 8,337,547 8,014,950 8,535, % Appropriations By Fund/Program Parking Revenue Utility Accounts Program % Billing & Collections Utility Accounts Program 8,969,914 8,919,346 8,380,587 8,337,547 8,014,950 8,535, % Total Budget 8,969,986 8,919,371 8,380,587 8,337,547 8,014,950 8,535, % Revenue Sources General Government 151, , , , , , % Violation Of Local Ordinances 1,128,845 1,119,638 1,160,000 1,160,000 1,166,000 1,485, % Interest Earnings 186, , , , , , % Sale Of Fixed Assets % Misc Revenue (99,040) (88,648) (119,000) (119,000) (23,782) (119,000) 0.00% Other Charges 7,594,954 7,865,523 6,868,449 6,868,449 6,777,237 6,630,614 (3.46%) Billing & Collections 6,516 (296,712) 21,138 (21,902) (292,970) (115,714) (647.42%) Parking Revenue % Total Revenue 8,969,986 8,919,371 8,380,587 8,337,547 8,014,950 8,535, % Position Summary Utility Accounts Program % Total Full-Time FTE % Utility Accounts Program % Total Part-Time FTE % Total FTE % Department Summary Page 28
109 City of St. Petersburg FY2013 Budget Notes - In FY13, the Billing and Collections Department's budget will increase 1.85% due to increases in customer credit card usage ($22,000) and postage expenditures ($12,000). - Revenue changes include the following: Charge a $2 convenience fee for each customer payment made through Click 2 Gov online or by phone through Interactive Voice Response ($325,000), increase current lien research fee from $35 to $55 for both utility lien and special assessments lien searches ($175,000), implement a lien filing fee for special assessment liens as is currently done when filing utility liens ($30,000) and increase original police false alarm registration fee from $15 to $25 in the General Fund ($25,000). - Also for FY13, a full-time Security Guard ($25,190) located in the Utility Accounts area and budgeted in the Municipal Office Buildings Department and a full-time Codes Permit Tech II ($70,212) will be funded out of the Billing and Collections Department through labor distribution subsequently increasing the FY13 FTE count by two. Department Summary Page 29
110 City of St. Petersburg FY2013 Budget Budget & Management Department Department Mission Statement The mission of the Budget & Management Department is to facilitate the responsible use of city resources, which support services that meet community goals. Services Provided The Budget & Management Department provides the following services: Citywide operating budget preparation. Citywide Capital Improvement Program (CIP) budget preparation. Budget monitoring. Departmental budget support. Position control. Budget analysis and planning. Budgetary Cost Summary Wages And Benefits 707, ,689 (1,762,759) (1,762,759) 541, ,050 (134.89%) Services And Commodities 1,140, , , , , ,986 (10.45%) Transfers Out 4,662,700 4,548,335 3,993,000 3,993,000 4,306,600 3,668,520 (8.13%) Contingencies , , ,000 (5.19%) Total Budget 6,510,864 5,450,056 3,201,091 2,891,231 5,009,145 5,194, % Appropriations By Fund/Program General Operating Fund Budget & Management Support Program 426, , , , , , % Budget Administration Program 1,421, , , , , ,630 (5.25%) Subsidies & Contingency Program 4,662,700 4,548,335 2,442,263 2,132,263 4,306,600 4,418, % Totals for General Operating Fund 6,510,864 5,436,052 3,187,091 2,877,231 4,995,145 5,180, % Technology & Infrastructure Fund Budget & Management Support Program 0 14,004 14,000 14,000 14,000 14, % Total Budget 6,510,864 5,450,056 3,201,091 2,891,231 5,009,145 5,194, % Revenue Sources Federal Grants 867, % Interest Earnings 0 103, % Misc Revenue % General & Administrative 412, , , , , , % Transfer From Jamestown Complex 0 35,004 35,000 35, (100.00%) General Fund 5,231,007 4,976,596 2,704,599 2,394,739 4,547,653 4,733, % Technology & Infrastructure Fund 0 (89,951) 14,000 14,000 14,000 14, % Total Revenue 6,510,864 5,450,056 3,201,091 2,891,231 5,009,145 5,194, % Position Summary Budget & Management Support Program % Budget Administration Program % Total Full-Time FTE % Total FTE % Department Summary Page 30
111 City of St. Petersburg FY2013 Budget Notes - The Budget & Management Department is faced with developing and managing an efficient budget in a time of economic uncertainty. - In FY12, about $2.3 million of budgeted salary savings was shown in the Budget Department's budget instead of the individual departments' budgets resulting in a reduction of 41.8%. The $2.3 million in budgeted salary savings was removed from the Budget Department's budget. Also, the Administrative Secretary ($42,028) position was re-instated during FY12 and shared with the Audit Services department subsequently increasing the budget 62.55% for FY13. - For FY13, the transfer out for subsidies will be ($324,480) less than FY12 due to an increase in revenue at the Mahaffey Theater, resulting from a commitment in the amount of $400,000 from the Mahaffey Foundation. Department Summary Page 31
112 City of St. Petersburg FY2013 Budget City Clerk Department Mission Statement The mission of the City Clerk's Office is to preserve the city's history through maintenance of its legal documents and proceedings of City Council, conduct city elections, and safeguard city staff, officials, residents, and property. Services Provided The City Clerk's Office provides the following services: Provides overall administrative and support services for all the programs of this department. Preserves the city's history through maintenance of its books, records, legal documents, and journals of the proceeds of the City Council. Organizes, manages, and coordinates city elections and provides assistance to candidates. Responds to public records requests by coordinating with departments and providing records on a timely basis per Florida Statute Chapter 119. Performs research for staff, elected officials, other governmental entities, and residents. Video streams all City Council meetings. Establishes and administers, with the assistance of departmental records coordinators, a records management program directed to the application of efficient and economical management methods relating to the creation, utilization, maintenance, retention, preservation, and disposal of records per the Florida Department of State Division of Library & Archives of Florida. Provides efficient and timely sorting, delivery, and pickup of mail. Safeguards city staff, officials, and residents. Safeguards city property. Budgetary Cost Summary Wages And Benefits 932, , , , , , % Services And Commodities 536, , , , , ,942 (5.83%) Total Budget 1,469,483 1,260,238 1,551,047 1,560,464 1,522,452 1,518,087 (2.13%) Appropriations By Fund/Program General Operating Fund City Clerk Administration Program 582, , , , , ,033 (5.15%) City Clerk Program 227, , , , , ,538 (0.11%) Mail Room Program 113, , , , , , % Records Retention Program 240, , , , , , % Totals for General Operating Fund 1,164, ,498 1,195,204 1,204,621 1,208,628 1,184,944 (0.86%) Municipal Office Buildings Building Security Program 305, , , , , ,143 (6.38%) Total Budget 1,469,483 1,260,238 1,551,047 1,560,464 1,522,452 1,518,087 (2.13%) Revenue Sources General Government 3,732 4,276 5,800 5,800 5,800 5, % Other Charges For Services (30) % Violation Of Local Ordinances % Misc Revenue % General & Administrative 446, , , , , , % Other Charges % General Fund 713, , , , , ,676 (1.41%) Municipal Office Buildings 305, , , , , ,143 (6.38%) Total Revenue 1,469,483 1,260,238 1,551,047 1,560,464 1,522,452 1,518,087 (2.13%) Department Summary Page 32
113 City of St. Petersburg FY2013 Budget Position Summary Building Security Program (14.29%) City Clerk Administration Program % City Clerk Program % Mail Room Program % Records Retention Program % Total Full-Time FTE (6.25%) City Clerk Administration Program % Records Retention Program % Total Part-Time FTE % Total FTE (5.80%) Notes - In FY13, one full-time Security Guard ($25,190) located in the Utility Accounts area in the Municipal Office Buildings Department will be funded from the Billing & Collections department through labor distribution resulting in one less full time position reported in the Building Security program for FY13. - Also for FY13, the Other Special Services line item was reduced $30,200 resulting in a.86% decrease for the General Fund in the City Clerk Department. Department Summary Page 33
114 City of St. Petersburg FY2013 Budget City Council Department Mission Statement The mission of the City Council is to govern the city of St. Petersburg in the interest of its citizens. Services Provided The City Council provides the following service: Serves as the governing body of the city with all legislative powers of the city vested therein. Budgetary Cost Summary Wages And Benefits 762, , , , , , % Services And Commodities 124, , , , , , % Total Budget 887, , , , , , % Appropriations By Fund/Program General Operating Fund City Council Program 887, , , , , , % Total Budget 887, , , , , , % Revenue Sources Misc Revenue % General & Administrative 382, , , , , , % General Fund 504, , , , , , % Total Revenue 887, , , , , , % Position Summary City Council Program (12.50%) Total Full-Time FTE (12.50%) City Council Program % Total Part-Time FTE % Total FTE (4.17%) Notes - The department's budget will increase by 11.60% in FY13. This increase is mainly due to a management study ($50,000), a correction in the salary calculations for two positions which were calculated incorrectly in the FY12 Budget, and an increase in travel ($8,000). - In FY13, the membership expense for the National League of Cities ($13,400) will be moved from the Mayor's Office budget to the City Council budget. - Also in FY13, a full-time Administrative Secretary position will be shared with the Mayor's Office Action Center ($31,502) and there will be reductions in car allowances ($1,620) and food and ice ($1,000). Department Summary Page 34
115 City of St. Petersburg FY2013 Budget Finance Department Department Mission Statement The mission of the Finance Department is to maintain, at the highest level possible, the credibility of the financial information flowing from the Finance Department; to ensure that city employees, customers, vendors, contractors, and other firms, following the policies set forth by City Council and established procedures, are all treated on an equal basis regarding the opportunities to provide services in the financial area and disbursements of funds; to consistently review the methods used so as to have the most cost-effective means of accomplishing the mission of the Finance Department with a high level of performance by departmental staff. Services Provided The Finance Department provides the following services: Assures that all city accounting transactions are processed correctly and report financial information concerning the city in conformance with federal, state, and local statutes, and generally accepted accounting principles. Delivers service to city employees, retirees, and vendors with correct and on-time issuance of payroll, retirement and vendor payments, as well as to answer all questions relating to these functions. Provides a professional level of investment activities which achieve and maintain confidence in the Treasury Division. Provides administration and support services for all of the programs within this department. Budgetary Cost Summary Wages And Benefits 1,381,929 1,255,134 1,298,559 1,298,559 1,250,767 1,324, % Services And Commodities 2,122,343 2,116,344 1,278,661 1,297,264 1,361,891 1,294, % Capital , % Debt 38,187,894 37,876,257 40,620,040 62,150,040 63,506,079 36,919,317 (9.11%) Transfers Out 172,670,491 48,256,972 27,915,119 52,013,069 50,462,109 16,629,747 (40.43%) Total Budget 214,362,656 89,504,708 71,112, ,758, ,598,143 56,168,194 (21.01%) Appropriations By Fund/Program General Operating Fund Debt, Reserves & CIP Transfers 2,989,711 8,405,809 7,141,416 7,248,316 7,090,711 8,428, % Disbursements, Cash & Debt Management 7,275,013 2,323,048 1,982,484 2,001,051 2,011,378 2,064, % Program General Accounting & Reporting Program 782, , , , , , % Totals for General Operating Fund 11,046,822 11,496,754 9,526,505 9,652,008 9,499,777 10,910, % Industrial Development Subsidies & Contingency Program 123, % Economic Stability Debt, Reserves & CIP Transfers , % Health Facilities Authority Debt, Reserves & CIP Transfers ,000 14, , % Utility Tax Revenue Debt, Reserves & CIP Transfers 41,661, , % Local Option Tax Revenue Debt, Reserves & CIP Transfers 25,908,004 4,503, % Franchise Tax Revenue Debt, Reserves & CIP Transfers 21,018,607 2,896, % Excise Tax Revenue Debt, Reserves & CIP Transfers 19,765, ,945 1,431,495 1,431,495 1,711,895 0 (100.00%) Emergency Medical Services Subsidies & Contingency Program 0 6, % Parking Revenue Parking Revenue Program 250, , , , ,000 1,046, % Department Summary Page 35
116 City of St. Petersburg FY2013 Budget Appropriations By Fund/Program School Crossing Guard School Crossing Guards Program 355, , , , , , % Weeki Wachee Weeki Wachee Program 75,871 1,777, , , , , % Pro Sports Facility Debt, Reserves & CIP Transfers 2,000,004 2,000,004 2,000,004 2,000,004 2,000,004 2,000, % Economic Development Subsidies & Contingency Program 12, % Downtown Redevelopment District Debt, Reserves & CIP Transfers 10,528,854 12,643,190 8,169,124 8,169,124 7,039,369 1,904,248 (76.69%) Disbursements, Cash & Debt Management Program 0 36, % Totals for Downtown Redevelopment District 10,528,854 12,679,936 8,169,124 8,169,124 7,039,369 1,904,248 (76.69%) Assessments Revenue Debt, Reserves & CIP Transfers 177, ,128 98,131 98,131 98,131 5,589 (94.30%) Neighborhood Stabilization Program Subsidies & Contingency Program 0 216, % Community Redevelopment District Debt, Reserves & CIP Transfers 11,347,559 6,712,750 6,703,500 7,953,500 8,568,245 0 (100.00%) JP Morgan Chase Revenue Notes Debt, Reserves & CIP Transfers ,794,000 21,538,072 1,228, % FFGFC Loan Debt, Reserves & CIP Transfers 2,697,021 2,700,602 2,706,550 2,706,550 2,707,858 2,699,100 (0.28%) Banc Of America Notes Debt Service Fund Debt, Reserves & CIP Transfers 1,173,020 1,178,269 1,181,512 22,847,512 21,967, ,147 (83.48%) BB&T Notes Subsidies & Contingency Program 0 28, , , , , % Utility Tax Debt Service Debt, Reserves & CIP Transfers 2,824,064 (918) % Stadium Debt Service Debt, Reserves & CIP Transfers 8,639,905 8,537,094 8,620,019 8,620,019 8,525,569 8,517,408 (1.19%) Sports Facility Sales Tax Debt Debt, Reserves & CIP Transfers 1,912,244 1,914,490 1,911,587 1,911,587 1,472,802 1,911,078 (0.03%) Redevelopment Debt Service Debt, Reserves & CIP Transfers 6,680,875 6,713,250 6,703,500 6,703,500 6,703,500 0 (100.00%) Water Resources Administrative Support Services (5,648) 112, % Water Resources Debt Debt, Reserves & CIP Transfers 13,450,561 15,861,905 18,046,144 18,046,144 20,124,902 20,692, % Water Cost Stabilization Water Cost Stabilization Program 2,994,316 2,752,806 1,500,000 1,500,000 1,500,000 1,500, % Stormwater Utility Operating SW Utility Collection & Marine Infrastr Program 137,856 3, % Stormwater Debt Service Debt, Reserves & CIP Transfers 1,053,076 1,055,452 1,053,332 1,053,332 1,053,533 1,055, % Sanitation Operating Subsidies & Contingency Program 342, % Fleet Management Subsidies & Contingency Program 721, % Department Summary Page 36
117 City of St. Petersburg FY2013 Budget Appropriations By Fund/Program Equipment Replacement Subsidies & Contingency Program 1,757, % Municipal Office Buildings Subsidies & Contingency Program 0 275, % Information & Communication Services Disbursements, Cash & Debt Management % Program Subsidies & Contingency Program 1,057, % Totals for Information & Communication Services 1,057, % Pc Replacement Subsidies & Contingency Program 3,638,761 (155,906) % Radio Replacement Subsidies & Contingency Program 1,162, % Technology & Infrastructure Fund Subsidies & Contingency Program , ,020, % Supply Management Materials Management Program Subsidies & Contingency Program (11,395) 249,523 (6,196) % 0.00% Totals for Supply Management 238,128 (6,196) % Print Shop Subsidies & Contingency Program 0 (50,908) % Life Insurance Subsidies & Contingency Program 216, % General Liabilities Claims Subsidies & Contingency Program 12,111, % Commercial Insurance Subsidies & Contingency Program 1,533, % Billing & Collections Subsidies & Contingency Program 1,466, % Deferred Compensation - ICMA Pension Support Program 4,285,615 4,768, , % Total Budget 214,362,656 89,504,708 71,112, ,758, ,598,143 56,168,194 (21.01%) Revenue Sources Taxes Property Delinquent 367, , , , , , % Taxes Property Current 83,109,215 74,570,330 69,616,255 69,616,255 69,616,255 78,560, % Taxes Property Penalties & Interest 7,929 4, % Taxes Franchise Natural Gas 901, , , , , ,500 (7.95%) Taxes Franchise Electricity 21,258,541 19,684,895 19,695,527 19,695,527 19,084,985 20,384, % Taxes Utility Services Propane 141, , , , , , % Taxes Utility Services Electricity 22,432,711 21,113,455 21,161,401 21,161,401 20,245,455 21,279, % Taxes Utility Services Communications Services Tax 13,099,351 13,107,242 12,791,371 12,791,371 13,300,000 12,961, % Taxes Utility Services Water 3,443,292 3,574,736 3,669,137 3,669,137 3,795,432 3,555,416 (3.10%) Taxes Utility Services Fuel Oil 3, ,300 2,300 3,052 3, % Taxes Utility Services 0 (488) % Taxes Utility Services Natural Gas 591, , , , , ,834 (3.06%) Business Taxes 2,405,903 2,407,083 2,500,000 2,500,000 2,531,000 2,340,000 (6.40%) Contractors Permits 4,370 52, % Department Summary Page 37
118 City of St. Petersburg FY2013 Budget Revenue Sources Other License And Permits 13, ,100 5,100 5,100 5, % Shared State Revenue Sharing 7,433,838 7,463,366 7,665,401 7,665,401 7,664,855 7,949, % Shared State Mobile Home 98, , , , , , % Shared State Alcoholic Beverag 119, , , , , , % Shared State Sales Tax - Half 13,870,492 14,347,797 12,911,198 12,911,198 16,872,608 17,302, % Shared Revenue 35,467,727 11,930,501 18,098,069 13,981,317 11,493,906 11,766,268 (34.99%) General Government 24,507 17,364 34,000 34,000 24,000 34, % Other Charges For Services ,458 48,600 48,600 48,600 48, % Interest Earnings 10,890,374 (4,640,937) 2,626,712 2,626,712 2,877,788 2,934, % Rents And Royalties 98, ,417 23,000 23,000 23,000 23, % Special Assessment 184,011 97, , ,000 85, ,000 (28.57%) Sale Of Fixed Assets ,000 10,000 72,547 10, % Contributions And Donations 43,347,793 6,439, ,500, % Misc Revenue 67,088 82, , , , , % General & Administrative 1,084,772 1,438,752 1,461,792 1,461,792 1,461,792 1,461, % Payment In Lieu Of Taxes 14,185,748 14,514,720 14,553,396 14,553,396 14,553,396 14,873, % Debt Proceeds 0 9,968, ,522,000 21,522, % Federal Grants 0 924,585 1,188,752 1,188,752 1,188,752 1,186,809 (0.16%) Department Charges 495, , , % Other Charges (123) (294) 0 0 (225) % Transfer From General Fund 2,625,421 7,573,170 2,635,316 6,787,068 7,021,056 8,428, % Transfer From Economic Stability % Transfer From Utility Tax Revenue 41,659, % Transfer From Local Option Tax Revenue 3,517, % Transfer From Franchise Tax Revenue 21,018,607 2,896, % Transfer From Excise Tax Revenue 19,765, ,945 1,431,495 1,431,495 1,711,895 0 (100.00%) Transfer From Emergency Medical Services % Transfer From Parking Revenue 0 99, , , , ,000 (13.49%) Transfer From School Crossing Guard 355, , , , , , % Transfer From Weeki Wachee ,000 20,000 20,000 20, % Transfer From Pro Sports Facility 2,000,004 2,000,004 2,000,004 2,000,004 1,999,059 2,000, % Transfer From Downtown Redevelopment District 7,501,854 8,164,484 8,169,124 8,169,124 6,998,529 1,704,249 (79.14%) Transfer From Community Development Block Grant 841, , , , , ,491 (18.83%) Transfer From Neighborhood Stabilization Program 0 216, , , % Transfer From Community Redevelopment District 8,867,559 6,712,750 6,703,500 6,703,500 7,318,245 0 (100.00%) Transfer From JP Morgan Chase Revenue Notes ,500,000 21,039, % Transfer From Banc Of America Notes Debt Service Fund , , % Transfer From Stadium Debt Service 242, , , ,000 23, ,000 (38.78%) Transfer From Weeki Wachee Capital Improvements % Transfer From Water Resources 14,922,808 15,732,127 17,130,250 17,130,250 17,130,250 19,445, % Transfer From Water Cost Stabilization 0 2,519, ,300, % Transfer From Stormwater Utility Operating 1,057,856 1,056,403 1,058,000 1,058,000 1,058,000 1,054,080 (0.37%) Transfer From Sanitation Operating 797, , , , , , % Transfer From Airport Operating 0 50,004 50,000 50,000 50,000 50, % Transfer From Marina Operating 300, , , , , , % Transfer From Fleet Management 721, % Transfer From Equipment Replacement 1,757, % Transfer From Information & Communication Services 1,457, , , , , ,000 (50.00%) Transfer From Pc Replacement 3,638,761 (155,906) % Transfer From Radio Replacement 1,162, % Transfer From Supply Management 249, % Department Summary Page 38
119 City of St. Petersburg FY2013 Budget Revenue Sources Transfer From Life Insurance 216, % Transfer From General Liabilities 12,111, % Claims Transfer From Commercial Insurance 1,533, % Transfer From Billing & Collections 1,466, % General Fund (162,666,526 (164,476,10 (177,955,318) (165,312,810) (162,648,029) (172,806,758) 6.25% ) 5) Utility Tax Revenue 9,373,356 (1,385) 0 0 1, % Franchise Tax Revenue (797,992) 2,896, % Economic Development 12, % Water Resources (544,263) (1,828,015) (20,469) (55,469) (2,499,247) 0 (100.00%) Preservation Reserve (855) (423) 0 0 (200) (500) 0.00% Excise Tax Revenue 266, ,160 1,431,495 1,431,495 1,711,895 0 (100.00%) Stadium Debt Service (192,763) (191,946) (172,861) (172,861) (172,964) (178,978) 3.54% Billing & Collections 1,466, , % Pro Sports Facility (44) (7) (3,968) (3,968) 4 (3,168) (20.16%) Bayboro Harbor Tax Increment (151,662) (68,726) (38,316) (38,316) (38,366) (30,258) (21.03%) District Downtown Redevelopment District 2,313,237 1,494,590 1,465,624 1,465,624 (279,105) (6,242,028) (525.90%) Community Redevelopment District 2,501,388 (1,271,370) (1,270,181) (20,181) 1,271,370 0 (100.00%) Intown West Tax Increment (502,419) (313,314) (215,912) (215,912) (243,329) (194,246) (10.03%) District Local Option Tax Revenue 3,782,900 4,502, % Industrial Development 123, % Health Facilities Authority (4,853) (3,828) % Weeki Wachee (581,633) 1,575,780 (19,160) 521, ,050 (62,000) % Marina Operating (286,930) % Assessments Revenue (45,100) 27,745 (57,757) (57,757) (11,869) (125,411) % Water Cost Stabilization (13,932) 4,285, ,261 95, % Pc Replacement 3,638,761 (155,906) % Community Development Block (632) % Grant Parking Revenue 249, , , , ,000 1,046, % Redevelopment Debt Service % Utility Tax Debt Service 941,500 (918) % Sanitation Equipment Replacement (342,731) % Workers' Compensation (5,989,836) 149, % Building Permit Special Revenue (479) 53, (42) % Equipment Replacement 1,696, , , % Technology & Infrastructure (10,357,139) 156,793 (39,124) 230, ,662 ( %) Fund Community Housing Donation (1,730) 124, (12,000) % Municipal Office Buildings (1,170) 315, (25) % Sanitation Operating 342,731 90, % Local Housing Assistance 0 49, % Water Resources Debt (1,626,004) (6,447,946) (423,969) (423,969) 1,654,789 (94,146) (77.79%) General Liabilities Claims 12,111, , (572) % Information & Communication 1,057,837 50, % Services FFGFC Loan % Stormwater Utility Operating 116,822 (94,365) 0 0 (82,000) % Deferred Compensation - ICMA (44,363,568) (1,772,489) 0 0 (6,495,417) % Economic Stability (912,089) (361,838) (198,600) (198,600) (227,699) (954,946) % Commercial Insurance 1,533,744 73, % Health Insurance (9,094,985) 218, % Fleet Management 721, % Stormwater Debt Service (5,096) (1,080) (5,000) (5,000) (4,799) 960 (119.20%) Golf Course Operating (462,357) % Police Grant Fund (11,930) (464) 0 0 (66) % Law Enforcement Fund (25) % School Crossing Guard 355, , , , , , % BB&T Notes 0 (601,556) , % Airport Operating (51,469) % Sunken Gardens (46) (24) % Neighborhood Stabilization 0 (144,000) % Program Department Summary Page 39
120 City of St. Petersburg FY2013 Budget Revenue Sources Emergency Medical Services 0 6, % Coliseum Operating (77) (27) % Sports Facility Sales Tax Debt (17,006) (14,700) (17,938) (17,938) (456,264) (16,012) (10.74%) Print Shop (58,436) (50,908) % Tropicana Field 0 (4) % Arts And Cultural Programs (87) (42) 0 0 (30) % Banc Of America Notes Debt Service Fund 68,384 71,819 75, , ,824 0 (100.00%) Life Insurance 216, % Supply Management (257,322) (508,364) 0 0 (500,000) % JP Morgan Chase Revenue Notes (158,000) (675,562) 246, % Radio Replacement 1,162, % Total Revenue 214,362,656 89,504,708 71,112, ,758, ,598,143 56,168,194 (21.01%) Position Summary Disbursements, Cash & Debt Management Program % General Accounting & Reporting Program % Total Full-Time FTE % Total FTE % Notes - In FY13, the Finance Department's General Fund budget will increase by 14.53% primarily due to the transfer of $1,016,346 from the General Fund to the Economic Stability Fund and payments to the tax increment district $249,182. This transfer to the Economic Stability Fund represents monies available to contend with any shortfall in FY12. In the event that the General Fund exceeds its budget at the end of FY12, the transfer to Economic Stability Fund will not occur and the monies will stay in the General Fund balance to offset the shortage. This increase is partially offset by decreases in the department's internal service charges ($37,029). - Also in FY13, there will be increases in Data Processing - Internal ($47,796) and Claims - Self - internal ($56,856). - Due to the centralization of accounts payable one full-time Account Clerk II position will not be filled ($56,470). This reduction does not reflect in the position summary count due to labor distribution between Engineering and Finance. The reduction is shown on the Engineering and Capital Improvements Department page. - Please also note that as a result of the new budget system implemented last year many funds that are not associated with a single department will appear in the Finance Department's information. Department Summary Page 40
121 City of St. Petersburg FY2013 Budget Human Resources Department Department Mission Statement The mission of the Human Resources Department is to serve as a positive resource to both employees and departments, whereby the needs of both are satisfied to the fullest extent possible given the city's financial and legal constraints. We must be accessible, responsive, and committed to presenting the city organization as a business-like, caring employer to the community. To accomplish this, we must emphasize communication, a quality customer service, equity and objectivity, and a genuine concern for the individual. Services Provided The Human Resources Department provides the following services: Provides administration and support services for all aspects of human resources and risk management to all of the programs of the city. Budgetary Cost Summary Wages And Benefits 3,491,600 3,500,126 3,817,040 3,817,040 3,555,769 3,648,369 (4.42%) Services And Commodities 51,153,677 47,191,945 48,817,860 48,818,815 46,332,774 51,094, % Capital 19,363 35, % Grants And Aid 300, , , , ,000 0 (100.00%) Transfers Out 15,000 22,896 22,896 22,896 63,500 22, % Total Budget 54,980,222 51,072,426 52,907,796 52,953,301 50,212,043 54,765, % Appropriations By Fund/Program General Operating Fund Civilian Police Review Committee 79,372 76,507 80,851 80,851 75,122 81, % Program Community Advocacy Program % Community Affairs Administration 517, , , ,162 1,162,602 94,602 (78.67%) Program Employee Development Program 143, , , , , , % Employment Program 967, ,409 1,019,665 1,019, , ,117 (6.43%) Group Benefits Program 206, , , ,773 30,393 37,865 (73.10%) Human Resources Program 838, , , , , ,634 (6.17%) Labor Relations Program 322, , , , , , % Pension Support Program 620, , , , , , % Totals for General Operating Fund 3,696,092 3,529,785 3,404,343 3,448,893 3,244,300 2,923,765 (14.12%) Parking Revenue CAPI Program 56,362 68, , ,610 63, , % Community Affairs Administration Program 671 3, % Totals for Parking Revenue 57,033 72, , ,610 63, , % Health Insurance Health Insurance Program 32,953,551 33,099,147 34,019,506 34,020,461 33,996,000 36,588, % Life Insurance Life Insurance Program 874, , , , , ,028 (15.90%) General Liabilities Claims Health Insurance Program Self Insurance Program (22) 1,418, ,503, ,265, ,265, ,245, ,148, % (5.15%) Totals for General Liabilities Claims 1,418,134 2,503,722 2,265,672 2,265,672 2,245,687 2,148,998 (5.15%) Commercial Insurance Commercial Insurance Program 5,087,356 4,679,853 4,881,431 4,881,431 4,881,597 4,945, % Workers' Compensation Workers' Compensation Program 10,862,030 6,282,295 7,247,940 7,247,940 4,947,168 7,218,214 (0.41%) Department Summary Page 41
122 City of St. Petersburg FY2013 Budget Appropriations By Fund/Program Deferred Compensation - ICMA Pension Support Program 31,097 55,888 32,798 32,798 38,824 35, % Total Budget 54,980,222 51,072,426 52,907,796 52,953,301 50,212,043 54,765, % Revenue Sources Federal Grants 300,227 42, % General Government 36,402 64, , % Other Charges For Services 59,926 91, , % Interest Earnings 1,292,773 1,045, , , , ,843 (23.46%) Contributions And Donations 47,702,688 46,326,902 46,717,144 46,717,144 47,576,674 50,585, % Misc Revenue 499,052 1,424, , ,746 1,328, ,005 (8.12%) General & Administrative 1,867,104 1,923,156 1,923,156 1,923,156 1,923,156 1,923, % General Fund 1,527,575 1,537,152 1,134,182 1,178, , ,604 (42.37%) Parking Revenue 57,033 72, , ,610 63, , % General Liabilities Claims (1,721,191) 349,022 15,637 15,637 (3,741) (66,990) (528.41%) Workers' Compensation 3,802,881 (1,317,309) 189, ,849 (2,376,507) 155,577 (18.05%) Billing & Collections (310) 9, % Commercial Insurance (149,256) (229,273) 1,968 1,968 42,141 70, % Health Insurance (401,506) (126,210) 1,368,347 1,369,302 (134,850) 220,605 (83.88%) Life Insurance 75,725 72, , ,924 (16,171) 64,443 (67.60%) Deferred Compensation - ICMA 31,097 (214,281) (167,202) (167,202) (161,176) (164,822) (1.42%) Total Revenue 54,980,222 51,072,426 52,907,796 52,953,301 50,212,043 54,765, % Position Summary Civilian Police Review Committee Program % Commercial Insurance Program % Community Affairs Administration Program (50.00%) Employee Development Program % Employment Program % Group Benefits Program (100.00%) Health Insurance Program % Human Resources Program % Labor Relations Program % Life Insurance Program (28.57%) Pension Support Program % Self Insurance Program (16.04%) Workers' Compensation Program (8.23%) Total Full-Time FTE (4.53%) Employment Program % Total Part-Time FTE % Total FTE (4.48%) Notes - In FY13, the Human Resources General Fund budget will decrease by 14.12%. Reductions include reducing various line items ($7,850) based on prior years' actual costs (service award plaques, food and ice, postage, copy machine costs, advertising, other specialized services and uniforms). The department also plans to hold a full-time Personnel Analyst III position vacant for six months ($29,000), reduce Advertising ($7,000) and Training Fees ($3,000), reduce funding for unemployment compensation payments ($13,000) and reduce the full-time Community Department Summary Page 42
123 City of St. Petersburg FY2013 Budget Affairs Manager position ($129,078). Also, the Summer Youth Internship Program SYIP ($250,000) was transferred to the Community Services Department. - During FY12, a grant funded Management Methods Analyst II position was eliminated ($43,918). - In the insurance funds: Health Insurance - Health Insurance expenditures increased 7.55%. These changes are based on 1) increases in projected claims and administrative costs (self funded health) and 2) contracted rate for fully insured insurances; Life - changes are based on changes on overall enrollment and levels of coverage result in a decrease of 15.9% for FY13; Self - the reduction in expenses is in response to the change in the property tax collections and the adjustment to revenue is in response to the changes in the interest earnings anticipated in the liability funds; Commercial - the increase of 1.31% is due to labor distribution for a Risk Management Analyst position; Workers' Comp - the reduction in expenses is in response to the changes in the property tax collections. Department Summary Page 43
124 City of St. Petersburg FY2013 Budget Information & Communication Services Department Department Mission Statement The mission of the ICS Department is to pursue, implement and manage information systems and technologies that most effectively and efficiently support the city departments in accomplishing the goals and objectives of the city. All ICS employees will provide exceptional service to both our internal customers and the public. ICS management recognizes ICS team members as our most important asset and will provide the opportunity for development and will create a working environment that fosters innovative solutions and cooperative problem-solving in a fiscally responsible manner. Services Provided The following services are provided by the ICS, Print Shop and the Technology and Infrastructure Funds. ICS provides access, delivery, storage, retrieval and support services for all city voice and data processing systems to support city departments and the public in accomplishing the goals and objectives of the city. Print Shop provides printed materials and related services in a cost effective and efficient manner to all city departments. The Technology and Infrastructure Fund is an Internal Service Fund that was established in to centrally locate all technology/infrastructure resources. The fund balances of the former PC and Radio Replacement Funds, and the amount above the target fund balance of the ICS fund were transferred here. In addition, reserves for television equipment contributed by the Marketing and Communications Department were transferred to this fund from the Equipment Replacement Fund. Budgetary Cost Summary Wages And Benefits 5,989,321 5,824,444 6,060,354 6,060,354 5,669,317 6,098, % Services And Commodities 4,466,909 3,807,370 3,910,785 4,248,025 4,835,058 4,603, % Capital 760, , ,800 1,165,913 1,254,471 2,018, % Transfers Out 399, , , , , ,000 (50.00%) Total Budget 11,617,005 10,508,286 10,910,939 11,674,292 11,958,846 12,820, % Appropriations By Fund/Program General Operating Fund Information & Communication Services Program % Information & Communication Services Information & Communication Services 10,940,120 9,683,173 9,788,675 10,167,660 10,528,115 9,941, % Program Print Shop Program 19, , , , , ,383 (1.27%) Totals for Information & Communication Services 10,959,332 9,934,020 10,190,139 10,569,150 10,775,365 10,337, % Pc Replacement PC Replacement Program 224, % Radio Replacement Radio Replacement Program 45, % Technology & Infrastructure Fund Information & Communication Services 0 53,058 47,000 51,784 1,183,481 1,310, % Program Non-Department Program , % PC Replacement Program 0 410, , , ,300 (52.91%) Radio Replacement Program 0 26, , , % Totals for Technology & Infrastructure Fund 0 490, ,800 1,105,143 1,183,481 2,483, % Print Shop Print Shop Program 387,651 83, % Total Budget 11,617,005 10,508,286 10,910,939 11,674,292 11,958,846 12,820, % Department Summary Page 44
125 City of St. Petersburg FY2013 Budget Revenue Sources Other Charges For Services 9,324 12, % Interest Earnings 41,849 31,205 24,670 24, ,184 35, % Sale Of Fixed Assets 7, % Misc Revenue % Department Charges 11,302,792 10,767,141 10,343,624 10,480,520 10,812,215 11,292, % Transfer From Information & Communication Services % Information & Communication Services 841,393 17, , , ,142 (19,540) (103.49%) Technology & Infrastructure Fund 0 (396,681) (17,872) 366, ,057 1,512,127 ( %) Pc Replacement (245,624) (6,094) % Radio Replacement (374,471) % Print Shop 33,262 82, % General Fund % Total Revenue 11,617,005 10,508,286 10,910,939 11,674,292 11,958,846 12,820, % Position Summary Information & Communication Services Program (3.08%) Print Shop Program % Total Full-Time FTE (2.94%) Information & Communication Services Program % Total Part-Time FTE % Total FTE (2.82%) Notes - In FY13, the department's budget will increase by 1.45% due to additional software, equipment, and miscellaneous purchases ($326,798). These enhancements include 450 Kronos licenses ($97,758), procurement contracts and services ($101,424), SMS support for all servers, Citrix support for the Police Department, Vmware server support, Groupwise annual maintenance, and Xiotech SAN ($85,116). - In addition, various line items will be reduced including Car Allowance ($7,180), Consulting ($20,000), Office Supplies ($10,200), and miscellaneous ($300). - During FY12, two full-time positions (Computer Operator III and System Support Coordinator) were eliminated. - The transfer to the General Fund to offset the cost of the library collection was reduced from $200,000 to $100,000 in FY13. - Technology & Infrastructure Fund enhancements will total $3,333,930 for FY13, including the automation of accounts payable ($450,000), virtual desktop project ($260,800), Oracle system hardware refresh ($300,000), upgrade of nonpublic safety radios ($855,200), replace end-oflife GIS system ($447,930), and the transfer of $1,020,000 to the General CIP Fund for the upgrade of the Police CAD/RMS project. Laptop replacement cost will be $169,500 for FY13. - The city has initiated a Virtual Desktop PC program that requires each virtual machine to have its own XP Professional license loaded. These VECD (virtual enterprise centralized desktop) licenses are $100 per year, per machine and are recurring costs. The Virtual Desktop initiative is directly tied to substantial cost savings. By virtualizing desktop PCs, the city benefits by reducing the number of PC replacements for each year the equipment is in use. Instead of a 4 year replacement cycle, the city may see a 6 or 7 year cycle, while still providing the latest software experience to the users ($260,800). - In FY10, the PC and Radio Replacement programs were consolidated into the Technology & Infrastructure Fund. Department Summary Page 45
126 City of St. Petersburg FY2013 Budget Legal Department Department Mission Statement The mission of the Legal Department is to provide legal counsel and litigation services to City Council, the Mayor, and all city departments, boards, and commissions. Services Provided The Legal Department provides the following services: Provides legal counsel to City Council, the Mayor, and all city departments, boards, and commissions. Prosecutes and defends all lawsuits for and on behalf of the city. Budgetary Cost Summary Wages And Benefits 2,316,281 2,183,626 1,798,160 1,798,160 1,870,825 2,040, % Services And Commodities 612,233 1,237, ,652 1,010,652 1,041, , % Capital 8,442 7,050 4,000 4,000 2,000 4, % Total Budget 2,936,957 3,427,858 2,287,812 2,812,812 2,914,307 2,531, % Appropriations By Fund/Program General Operating Fund General Counsel Program Tort Litigation Program 2,056, ,590 1,949,282 1,478,576 1,713, ,518 1,938, ,518 2,017, ,046 2,531, % (100.00%) Totals for General Operating Fund 2,936,957 3,427,858 2,287,812 2,812,812 2,914,307 2,531, % Total Budget 2,936,957 3,427,858 2,287,812 2,812,812 2,914,307 2,531, % Revenue Sources General Government % Other Charges For Services 1, ,000 2,000 2,000 2, % Misc Revenue 6,089 4, % General & Administrative 1,309,188 1,348,464 1,348,464 1,348,464 1,348,464 1,348, % Other Charges % General Fund 1,620,678 2,073, ,348 1,462,348 1,563,843 1,180, % Total Revenue 2,936,957 3,427,858 2,287,812 2,812,812 2,914,307 2,531, % Position Summary General Counsel Program % Tort Litigation Program (100.00%) Total Full-Time FTE (1.24%) General Counsel Program % Tort Litigation Program (100.00%) Total Part-Time FTE (25.00%) Total FTE (2.39%) Department Summary Page 46
127 City of St. Petersburg FY2013 Budget Notes - In FY13, the Legal Department's budget will increase by 10.65% primarily due to reducing the project burden allocation. This expense was for salary and benefit charges to other departments. In Public Sector Budgeting (PSB) this expense is allocated through labor distribution in the regular salaries line. This change zeros out the project burden line. Also, a vacant part-time Assistant City Attorney position ($36,358) was eliminated. Part-time salaries have been adjusted to reflect actual hours worked. - Also for FY13, the Tort Litigation Program will be consolidated into the General Counsel Program. Department Summary Page 47
128 City of St. Petersburg FY2013 Budget Mayor's Office Department Mission Statement The mission of the Office of the Mayor is to provide executive leadership and direction and to administer all city business in the interest of its citizens and the corporate entity as a whole. Services Provided The Mayor's Office provides the following services: Provides executive leadership, implementation, and oversight in delivering city services. Defines city initiatives and sets implementation priorities. Establishes organizational structure and staffing. Works with City Council, businesses, and residents to ensure the safety, health, and prosperity of the city. Responds to and tracks citizen and Council complaints and concerns through the city's Action Center. Submits the annual mayor's budget recommendation to City Council and reports on the finances of the city. Confers with the school board, county, state, and local educational agencies to coordinate and enhance services within the city of St. Petersburg. Solicits private funding for college scholarships for economically disadvantaged youth. Budgetary Cost Summary Wages And Benefits 1,330,821 1,312,978 1,025,184 1,067,432 1,004,722 1,077, % Services And Commodities 276, , , , , ,959 (2.69%) Grants And Aid 571, , , , , , % Total Budget 2,178,500 2,382,608 1,993,811 2,119,317 1,986,307 2,039, % Appropriations By Fund/Program General Operating Fund Action Center Program 118, ,016 87,483 87,483 82, , % Codes Compliance Assistance Program (266) (466) 0 (466) % Education & Government Services 193, , , , , ,298 (1.49%) Government Services Administration 230, , % Program Government Services Program 0 78, % Internal Services Administration Program 1,001, , % Mayor's Office Program 571, , , , , , % Neighborhood Partnership Program 1, % Veterans, Homeless, & Social Services 62, , , , , , % Totals for General Operating Fund 2,178,500 2,382,608 1,993,811 2,119,317 1,986,307 2,039, % Total Budget 2,178,500 2,382,608 1,993,811 2,119,317 1,986,307 2,039, % Revenue Sources Contractors Permits (132) % State Grants , % Other Charges For Services 55,955 52,954 53,105 53,105 53,105 53, % Rents And Royalties 0 0 1,000 1,000 1,000 1, % Misc Revenue % General & Administrative 747, , , , , , % General Fund 1,374,852 1,559,302 1,169,582 1,194,840 1,162,078 1,215, % Total Revenue 2,178,500 2,382,608 1,993,811 2,119,317 1,986,307 2,039, % Department Summary Page 48
129 City of St. Petersburg FY2013 Budget Position Summary Action Center Program % Education & Government Services % Mayor's Office Program % Veterans, Homeless, & Social Services % Total Full-Time FTE % Action Center Program % Total Part-Time FTE % Total FTE % Notes - The department's budget will increase by 2.28% in FY13. This is mainly due to the sharing of a full-time Administrative Secretary position in the City Council Department with the Mayor's Office Action Center ($31,502). There will also be reductions in Memberships ($600), Training & Conference Travel ($1,500), Travel for City Business ($6,100), and Printing and Binding ($550). - In FY13, the membership expense for the National League of Cities ($13,400) will be moved from the Mayor's Office budget to the City Council budget. - Also in FY13, the amount of social service funding will remain the same ($721,000). Department Summary Page 49
130 City of St. Petersburg FY2013 Budget Leisure & Community Services Administration Leisure & Community Services Administration Total Full Time Equivalents (FTE) = Community Services Department Total Full Time Equivalents (FTE) = 7.00 Golf Course Department Total Full Time Equivalents (FTE) = Housing Department Total Full Time Equivalents (FTE) = Leisure & Community Services Administration Department Total Full Time Equivalents (FTE) = 2.00 Library Department Total Full Time Equivalents (FTE) = Neighborhood Partnership Department Total Full Time Equivalents (FTE) = 0.00 Parks & Recreation Department Total Full Time Equivalents (FTE) = Department Summary Page 50
131 City of St. Petersburg FY2013 Budget Leisure & Community Services Administration Budgetary Cost Summary Wages And Benefits 29,361,318 29,213,739 28,996,913 29,720,523 29,461,418 28,971,179 (0.09%) Services And Commodities 24,083,996 21,003,744 14,427,091 27,124,359 16,565,070 14,659, % Capital 2,882,760 1,413, , , , ,892 (15.23%) Debt 4,407 28,828 49,500 49,500 49,500 49, % Grants And Aid 8, , , , ,750 1,079, % Transfers Out 841, , ,431 1,056, , ,491 (18.83%) Total Budget 57,181,892 52,603,945 45,785,406 59,590,907 48,739,647 46,017, % Appropriations By Fund/Department General Operating Fund Community Services Department , % Golf Course Department % Housing Department 353, , , , , , % Leisure & Community Services Administration Department 306, , , , , , % Library Department 6,114,425 5,993,287 5,940,541 5,940,671 5,761,201 5,846,968 (1.58%) Neighborhood Partnership Department 425, , , ,533 64,104 0 (100.00%) Parks & Recreation Department 31,476,650 31,345,363 31,025,943 32,960,930 31,949,321 31,587, % Non-General Funds Total General Operating Fund 38,675,362 38,372,263 37,907,624 39,857,790 38,377,415 38,965, % American Recovery & Reinvestment Act 481, , ,160 54, % Community Development Block Grant 2,393,219 2,367,516 2,092,593 2,539,762 2,398,082 1,663,859 (20.49%) Community Housing Donation 1,587, , ,526 42,020 20, % Emergency Shelter Grant Fund 0 94,327 97, , , , % Golf Course Operating 3,580,062 4,002,217 3,759,127 3,759,714 3,800,937 3,801, % Home Program 2,392,248 1,524,100 1,429,023 4,051, , ,902 (39.27%) Local Housing Assistance 3,310,412 1,626, ,000 2,153,787 1,064, ,000 (55.00%) Neighborhood Stabilization Program 4,761,266 2,827, ,041,342 1,943, , % Total Non-General Funds 18,506,530 14,231,682 7,877,782 19,733,117 10,362,232 7,052,002 (10.48%) Total Budget 57,181,892 52,603,945 45,785,406 59,590,907 48,739,647 46,017, % Revenue Sources Federal Grants 9,896,100 7,228,723 3,318,655 12,486,818 4,582,986 2,455,811 (26.00%) State Grants 89,765 3, , % Shared State Housing Initiativ 0 218, , , ,027 0 (100.00%) Grants From Other Local Units 1,098,865 1,212,992 1,338,807 3,391, ,514, % General Government 39,431 84,010 56,600 56,600 56,600 56, % Transportation Charges 103, , , , , ,424 (11.98%) Department Summary Page 51
132 City of St. Petersburg FY2013 Budget Revenue Sources Culture And Recreation Charges 8,636,643 9,316,059 10,543,199 10,543,199 10,336,783 9,913,231 (5.98%) Other Charges For Services 284, , , , ,541 (40.97%) Library Fines 132, , , , , , % Violation Of Local Ordinances 3,113 2, % Interest Earnings 308, ,877 8,750 8,750 64,416 66, % Rents And Royalties 22,983 22, , % Sale Of Fixed Assets 82, , , , % Contributions And Donations 48,768 88,900 11,450 11,450 85,000 11, % Misc Revenue 612, , , , , ,228 (22.06%) General & Administrative 140, , , , , , % Debt Proceeds 0 188, % Other Charges 27 (1,748) % Transfer From Weeki Wachee 0 8, % Transfer From Housing Capital , % Improvements Transfer From General Capital , % Improvements General Fund 30,927,744 29,777,233 28,793,375 29,568,838 31,244,167 30,420, % Community Development Block (16,410) 38, , ,689 (1,394) 0.00% Grant Emergency Shelter Grant Fund , % Home Program (50,115) 71, (3,149) (103) 0.00% Golf Course Operating 297, ,084 1,141 1,728 (1,635) 31, % American Recovery & Reinvestment (126,522) (236,339) 0 (0) % Act Neighborhood Stabilization 424,934 61,819 0 (0) 29, % Program Local Housing Assistance 2,720, , ,653, , % Community Housing Donation 1,587, , , % Parking Revenue (398) (270) 0 0 (21) % Local Option Tax Revenue (443) % Emergency Medical Services (3,059) (142) % Downtown Redevelopment District (79,144) (67,402) 0 0 (29,924) (32,000) 0.00% Jamestown Complex (177) (4) % Total Revenue 57,181,892 52,603,945 45,785,406 59,590,907 48,739,647 46,017, % Position Summary By Department Community Services Department % Golf Course Department (4.17%) Housing Department (22.22%) Leisure & Community Services Administration Department % Library Department (1.54%) Neighborhood Partnership Department (100.00%) Parks & Recreation Department % Total Full-Time FTE (0.48%) Golf Course Department % Library Department (5.88%) Parks & Recreation Department % Total Part-Time FTE % Total FTE % Department Summary Page 52
133 City of St. Petersburg FY2013 Budget Leisure & Community Services Administration Community Services Department Department Mission Statement The mission of the Community Services Department is to be proactive and responsive to resident, business and neighborhood issues by coordinating city services and resources to ensure quality customer service, promote volunteerism, and encourage civic engagement and participation to enhance and sustain neighborhood and business corridor character. Services Provided The Community Services Department provides the following services: I. Community Services Work Order Generation and Proactive Surveys by Community Service Representatives Work Order Generation by Mayors Action Center II. Neighborhood Services Neighborhood Plan Updates Liaison with Neighborhood Associations, Business and other Community Groups Crime Prevention through Environmental Design (C. P.T.E.D.) Coordinate Sector Meetings (f/k/a City Teams) Advancing Neighborhoods Through Schools (A.N.T.S) a. Advance quality of life improvements in neighborhoods with emphasis around schools & parks b. Facilitate seamlessness c. Areas of greatest need: Melrose - Mercy, Campbell Park, John Hopkins, Fairmont Park/Childs Park d. Coordination of city departments/resources - Just Do It (Police, Codes, Fire, Water Resources, Stormwater & Traffic Ops, Sanitation, Planning & Economic Dev, Housing, Parks & Recreation, Schools, N-Team, Transportation, Homeless & Veteran Services, Engineering) III. Volunteer Coordination I CAN Recruit & monitor volunteer utilization Ongoing Assist with organization/reorganization of neighborhood associations Emergency Response: Mass Care (Points of Distribution) IV. Summer Youth Employment Oversee city s Summer Youth Employment and Workforce Readiness Programs Implement Mayors Partner for Youth Employment Program - U.S. Department of Labor Initiative V. Special Projects Carefest (collaboration with multiple departments depending on projects submitted) Paris Projects (collaboration with Housing & Community Development Department) African-American Heritage Trail (collaboration with Planning & Economic Development [Historic Preservation & BAC]) Scrubbin `Da Burg (collaboration with Parks & Recreation) Family Fun Day (collaboration with various community agencies and city departments) Edwards Gala (collaboration with various community agencies and city departments) St. Petersburg Together television show Budgetary Cost Summary Wages And Benefits , % Services And Commodities , % Grants And Aid , % Total Budget , % Appropriations By Fund/Program General Operating Fund Community Services Administration Program , % Department Summary Page 53
134 City of St. Petersburg FY2013 Budget Appropriations By Fund/Program Customer Services Representatives , % Program Non-Departmental/Arts/Social Services , % Totals for General Operating Fund , % Total Budget , % Revenue Sources General Fund , % Total Revenue , % Position Summary Community Services Administration Program % Customer Services Representatives Program % Total Full-Time FTE % Total FTE % Notes - The Neighborhood Partnership Department was reorganized as a new Community Services Department. The three positions in the former Neighborhood Partnership Department and four current positions from other departments were transferred into this department, so there will be no net increase of positions. The positions transferred from other departments are: an Economic Development Coordinator position from the Planning & Economic Development Department and three Public Service Representatives from the Public Works Department. $210,000 of the cost of the Public Service Representatives positions is supported by the Water Resources, Stormwater, and Sanitation departments. - Also in FY13, there will be an increase in the contributions from the three major utilities (Water Resources, Stormwater, Pavement, & Traffic Operations, and Sanitation) to offset services rendered by the three Public Service Representatives for the utility customer service support they provide. This funding is accomplished through intergovernmental payments (burden charges) and the amounts will increase from $50,000 to $70,000 per utility for a total of $210,000 in General Fund savings. - The Summer Youth Intern Program ($250,000) and Workforce Readiness Program ($35,000) will be administered out of this department - A vacant Neighborhood Planner position will not be filled for four and a half months ($18,405). Department Summary Page 54
135 City of St. Petersburg FY2013 Budget Golf Course Department Department Mission Statement The mission of the city of St. Petersburg's Golf Courses Department is to provide outstanding golf courses, programs, and practice facilities to the residents and visitors of St. Petersburg. Our excellent golf courses, programs, and practice facilities are provided at a tremendous value that covers 100% of all operational and capital expenditures by a courteous and professional staff. Services Provided Golf Courses Administration: Direction and leadership for the management and operation of three municipal golf facilities, including golf turf grass maintenance and facility maintenance; food and beverage operations; pro shop retail operations; player development through adult instructional programs, marketing programs for all three golf courses, and support and assistance for First Tee program along with management of the agreement with The First Tee youth golf program; personnel management, development and training; fiscal management; driving range operations; tournament, league and special event programs for the golfing public; and customer services to residents and visitors. Works with Mayor's Golf Courses Advisory Committee. Mangrove Bay Business: Sells greens fees, merchandise, books reservations for more than 70,000 residents and visitors annually, and collects more than $2,500,000 annually, while providing excellent customer service. Offers pro shop merchandise for resale and administers events, tournaments, leagues and outings, while providing exceptional customer service. Mangrove Bay Concessions: Food and beverage for resale and customer service at Mangrove Bay Golf Course, through three locations: the clubhouse, the starters building, and the on course beverage cart. Mangrove Bay Golf Carts: Maintain fleet of 82 golf carts; present and stage clean and operationally safe golf carts for customers; provide routine maintenance on entire fleet of 82 golf carts; retrieve and wash golf driving range balls. Mangrove Bay Starter/Driving Range: Sells range balls to more than 40,000 golfing customers annually, start and assist more than 70,000 golfers annually during their round, manage pace of play programs to help ensure good play times, and provide exceptional customer service to enhance the customers golfing experience. Cypress Links Business: Sells greens fees, merchandise, books reservations and provides starting and course ranging services for more than 35,000 residents and visitors annually; collects more than $400,000 annually; administers tournaments, leagues and outings, manages a fleet of 12 golf carts; provides excellent customer service. Twin Brooks Business: Sells greens fees, merchandise, books reservations for more than 20,000 residents and visitors annually, and collects more than $460,000 annually; sells driving range balls to more than 24,000 customers annually; administers events, tournaments, leagues and outings; provides outstanding customer service. Golf Courses Vehicle Maintenance: Provides preventative, routine maintenance and repairs of turf equipment utilized at Mangrove Bay, Cypress Links, and Twin Brooks Golf Courses. Mangrove Bay/Cypress Links Maintenance: Promote, manicure and maintain healthy turf grass on 180 acre, 18 hole championship Mangrove Bay Golf Course and driving range, and 17 acre, 9 hole Cypress Links Golf Course, by utilizing best management and cultural practices. Putting surfaces are mowed everyday and the golf course is set-up for play every day but Christmas. Mowing of all turf areas on a daily basis, bunker maintenance, chemical and fertilizer management, water management, irrigation maintenance of more than 1,000 irrigation heads and one pump station, repairs and maintenance to bridges and course shelters/restrooms, general maintenance of all outside areas on the property, and tree and plant maintenance and management. Twin Brooks Maintenance: Promote, manicure and maintain healthy turf grass on 29 acre, 18 hole, par three Twin Brooks Golf Course and driving range, by utilizing best management and cultural practices. Mowing of all turf areas on a daily basis, chemical and fertilizer management, water management, irrigation maintenance of more than 300 irrigation heads, one pump station, repairs and maintenance to on course bridges, general maintenance of all outside areas on the property, and tree/plant maintenance and management. Budgetary Cost Summary Wages And Benefits 2,157,385 2,156,338 2,171,521 2,171,521 2,188,966 2,189, % Services And Commodities 1,350,023 1,541,027 1,458,106 1,458,742 1,490,082 1,482, % Capital 68, ,193 80,000 80,000 72,389 80, % Debt 4,407 28,828 49,500 49,500 49,500 49, % Total Budget 3,580,086 4,002,387 3,759,127 3,759,763 3,800,937 3,801, % Appropriations By Fund/Program General Operating Fund Golf Courses Operations Program % Leisure & Community Services Administration Program % Totals for General Operating Fund % Department Summary Page 55
136 City of St. Petersburg FY2013 Budget Appropriations By Fund/Program Golf Course Operating Golf Courses Maintenance Program 1,261,411 1,246,245 1,338,756 1,338,741 1,400,548 1,390, % Golf Courses Operations Program 1,643,194 2,109,545 1,767,921 1,768,523 1,737,489 1,747,133 (1.18%) Golf Courses Program 668, , , , , , % The First Tee Program 6, % Totals for Golf Course Operating 3,580,062 4,002,217 3,759,127 3,759,714 3,800,937 3,801, % Total Budget 3,580,086 4,002,387 3,759,127 3,759,763 3,800,937 3,801, % Revenue Sources Culture And Recreation Charges 3,272,489 3,456,973 3,756,120 3,756,120 3,801,439 3,770, % Other Charges For Services 2,819 5,266 1,060 1, (100.00%) Interest Earnings (84.62%) Sale Of Fixed Assets % Contributions And Donations 4, % Misc Revenue 2, % Debt Proceeds 0 188, % Other Charges 410 (67) % Golf Course Operating 297, ,084 1,141 1,728 (1,635) 31, % General Fund % Total Revenue 3,580,086 4,002,387 3,759,127 3,759,763 3,800,937 3,801, % Position Summary Golf Courses Maintenance Program % Golf Courses Operations Program (10.00%) Golf Courses Program % Total Full-Time FTE (4.17%) Golf Courses Maintenance Program (4.00%) Golf Courses Operations Program % Total Part-Time FTE % Total FTE (1.01%) Notes - The Golf Courses Department has made several changes due to the downturn in the economy to remain profitable. The total request of $3.801 million is 1.13% more than the Budget. - In FY13, a full-time Concessions Aide III position will be reduced to a part-time Concessions Aide II position ($25,453). - In FY13, there will be increases to Other Specialized Services, Chemicals, and Fuel ($27,040). - In FY13, funding is scheduled to replace outdated turf equipment ($80,000). Department Summary Page 56
137 City of St. Petersburg FY2013 Budget Housing Department Department Mission Statement The mission of the Housing and Community Development Department is to utilize federal, state, and local funding to provide decent affordable housing, a suitable living environment, and to expand economic opportunities principally for persons with low and moderate incomes. Services Provided The department has three divisions: Administration, Community Development Programs, and Housing Programs, and provides the following services: Infrastructure improvement projects Capital projects (public facilities and improvements). Funding to the Planning and Economic Development Department to provide job creation activities. Funding for the provision of public services (homeless and special needs services, assist agencies that help battered and abused spouses, and rental assistance to tenants). Community Development Block Grant Housing Rehabilitation, Emergency Repair, Lead Abatement, and Barrier Free Programs. Purchase Assistance, and Police in Neighborhoods (on hold) Programs. Multi-Family Home Development Programs. Community Housing Development Organizations, Home Ownership Counseling, and Predatory Lending Foreclosure Prevention. Foreclosure Prevention Program. Neighborhood Stabilization Program. Budgetary Cost Summary Wages And Benefits 1,601,310 1,396,000 1,098,593 1,347,987 1,355,018 1,005,262 (8.50%) Services And Commodities 11,110,282 8,246,675 2,557,506 13,886,304 4,535,421 2,029,759 (20.64%) Capital 1,712, % Grants And Aid 8, ,724 10,700 10, ,000 (6.54%) Transfers Out 841, , ,431 1,056, , ,491 (18.83%) Total Budget 15,273,527 10,585,032 4,447,230 16,301,978 6,886,870 3,678,512 (17.29%) Appropriations By Fund/Program General Operating Fund Housing Administration Program 141, , , , , , % Housing Finance & Rehabilitation 157, , , , , , % Program Housing Program 53,482 67,076 42,128 42,128 39, , % Totals for General Operating Fund 353, , , , , , % American Recovery & Reinvestment Act Housing Finance & Rehabilitation % Program Housing Trust Funds Program 481, , ,160 54, % Totals for American Recovery & Reinvestment Act 481, , ,160 54, % Local Housing Assistance Local Housing Assistance (SHIP) Program 3,310,412 1,626, ,000 2,153,787 1,064, ,000 (55.00%) Community Development Block Grant Housing Trust Funds Program 2,393,219 2,367,516 2,092,593 2,539,762 2,398,082 1,663,859 (20.49%) Emergency Shelter Grant Fund Housing Finance & Rehabilitation % Program Housing Trust Funds Program 0 94,255 97, , , , % Totals for Emergency Shelter Grant Fund 0 94,327 97, , , , % Department Summary Page 57
138 City of St. Petersburg FY2013 Budget Appropriations By Fund/Program Home Program Housing Trust Funds Program 2,392,248 1,524,100 1,429,023 4,051, , ,902 (39.27%) Neighborhood Stabilization Program Housing Trust Funds Program 4,755,266 2,827, ,041,342 1,943, , % Community Housing Donation Housing Trust Funds Program 1,587, , ,526 42,020 20, % Total Budget 15,273,527 10,585,032 4,447,230 16,301,978 6,886,870 3,678,512 (17.29%) Revenue Sources Federal Grants 9,342,817 6,584,657 3,318,655 12,486,818 4,582,986 2,455,811 (26.00%) State Grants 89, % Shared State Housing Initiativ 0 218, , , ,027 0 (100.00%) Grants From Other Local Units , % Other Charges For Services % Violation Of Local Ordinances 3,126 2, % Interest Earnings 307, ,719 7,944 7,944 64,393 65, % Rents And Royalties 22,983 22, , % Sale Of Fixed Assets 79, , , , % Misc Revenue 620, , , , , ,228 (19.48%) Transfer From General Fund % Emergency Shelter Grant Fund , % Community Development Block Grant (16,410) 38, , ,689 (1,394) 0.00% Home Program (50,115) 71, (3,149) (103) 0.00% Neighborhood Stabilization Program 418,934 61,819 0 (0) 29, % American Recovery & Reinvestment Act (126,522) (236,339) 0 (0) % Local Housing Assistance 2,720, , ,653, , % Community Housing Donation 1,587, , , % General Fund 353, , , , , , % Downtown Redevelopment District (79,144) (67,402) 0 0 (29,924) (32,000) 0.00% Emergency Medical Services (699) (142) % Parking Revenue (398) (270) 0 0 (21) % Jamestown Complex (177) (4) % Total Revenue 15,273,527 10,585,032 4,447,230 16,301,978 6,886,870 3,678,512 (17.29%) Position Summary Housing Administration Program (5.15%) Housing Finance & Rehabilitation Program (50.53%) Housing Program % Housing Trust Funds Program (19.70%) Total Full-Time FTE (22.22%) Total FTE (22.22%) Notes - Housing & Community Development charges about 20% of its operating budget to the General Fund, with the remaining 80% coming from the departments grant resources. The total General Fund request of $427,998 is 30.26% more than the Budget. A 4.85% reduction of Department Summary Page 58
139 City of St. Petersburg FY2013 Budget ($13,613) will be achieved by transferring personnel costs ($7,092) out of the General Fund to the department's grant resources, eliminating miscellaneous line items ($4,196) and eliminating one vehicle and its related expenditures ($2,325). In FY13, $1,156,385 in grant reductions are expected in the following grant funds: SHIP ($218,087), CDBG ($427,340) and $511,018 in HOME. As a result of the expected grant reductions administrative dollars will not be sufficient to fund the following eliminated positions: a Housing Development Coordinator ($110,230) and a Housing Finance Officer ($66,784). - During FY12, two vacant grant funded positions ( a Loan Processing Clerk and a Housing Admin Technician) were eliminated due to the reduction in available grant funding. - $40,800 is added to the department budget for the severance package payouts for positions eliminated because of the reduction in the Housing grant funds that are available. Department Summary Page 59
140 City of St. Petersburg FY2013 Budget Leisure & Community Services Administration Department Department Mission Statement The mission of the Leisure & Community Services Administration Department is to provide administrative, managerial, financial, and technical leadership to the Parks & Recreation, Golf Courses, Libraries, Housing & Community Development, and Neighborhood Partnership Departments, leading to the effective delivery of the highest quality of public service while adhering to policy guidelines and fiscal constraints. Services Provided The Leisure & Community Services Administration Department provides the following services: Administrative oversight and management of the Parks & Recreation, Golf Courses, Libraries, Housing & Community Development, and Neighborhood Partnership Departments. Serves as the city's liaison to citizens, community groups, professional organizations, elected officials, and other governmental organizations. Budgetary Cost Summary Wages And Benefits 245, , , , , , % Services And Commodities 60,569 43,217 48,649 48,649 40,423 49, % Total Budget 306, , , , , , % Appropriations By Fund/Program General Operating Fund Leisure & Community Services Administration Program 306, , , , , , % Total Budget 306, , , , , , % Revenue Sources Other Charges For Services 9,148 2, % Misc Revenue % General & Administrative 140, , , , , , % General Fund 156, , , , , , % Total Revenue 306, , , , , , % Position Summary Leisure & Community Services Administration Program % Total Full-Time FTE % Total FTE % Notes - The department budget changed by 5.46%. There were miscellaneous reductions and no staffing or service level changes. Department Summary Page 60
141 City of St. Petersburg FY2013 Budget Library Department Department Mission Statement The mission of the St. Petersburg Public Library System is to provide library resources to meet the educational, recreational, cultural, intellectual, and social needs of our diverse community. Services Provided The St. Petersburg Public Library System, consisting of a Main Library and six branches, provides the following services: Free access to a collection of print and non-print materials exceeding one half million items. Free access to computers, the Internet, and a wide variety of online resources. Professional reference service in person, by telephone, text and via the Internet. Access to databases, which include but are not limited to: Reference USA; Facts on File; LitFinder; Biography Resource Center; Learning Express; and Ancestry.com. Interlibrary loans. Reciprocal borrowing. Literacy programs for adults and children. Outreach programming. Children's programming. Teen programming. Adult programming. Training and technology instruction. Coin-operated public copiers and printers. Real-time online registration. Request notification via phone, and text. Downloadable e-books and audio books. Wireless access for laptop users and printing. Community room meeting space. Books-to-Go Homebound Service. Book discussion groups. Federal, state, and local government documents. Convenient 24-hour book returns at all libraries. Mirror Lake Branch Library features a convenient drive-up window. Log Library Budgetary Cost Summary Wages And Benefits 4,163,601 4,162,663 4,138,390 4,138,390 3,990,905 4,081,309 (1.38%) Services And Commodities 1,297,226 1,222,882 1,241,065 1,317,195 1,254,216 1,267, % Capital 653, , , , , ,392 (11.17%) Total Budget 6,114,425 5,993,287 5,940,541 5,940,671 5,761,201 5,846,968 (1.58%) Appropriations By Fund/Program General Operating Fund Libraries Administration Program Library Branches Program 2,165,001 3,949,424 2,054,451 3,938,836 1,951,794 3,988,747 1,951,794 3,988,877 1,687,952 4,073,249 1,789,271 4,057,697 (8.33%) 1.73% Totals for General Operating Fund 6,114,425 5,993,287 5,940,541 5,940,671 5,761,201 5,846,968 (1.58%) Total Budget 6,114,425 5,993,287 5,940,541 5,940,671 5,761,201 5,846,968 (1.58%) Revenue Sources General Government 39,356 83,981 56,000 56,000 56,000 56, % Department Summary Page 61
142 City of St. Petersburg FY2013 Budget Revenue Sources Culture And Recreation Charges 832, , , , , ,609 (5.70%) Library Fines 132, , , , , , % Sale Of Fixed Assets 2, % Contributions And Donations ,450 1,450 1,450 1, % Misc Revenue (34) (238) % Other Charges 10 (23) % General Fund 5,107,732 4,993,658 4,958,052 4,958,182 4,778,716 4,909,389 (0.98%) Total Revenue 6,114,425 5,993,287 5,940,541 5,940,671 5,761,201 5,846,968 (1.58%) Position Summary Libraries Administration Program (7.14%) Library Branches Program % Total Full-Time FTE (1.54%) Libraries Administration Program (100.00%) Library Branches Program % Total Part-Time FTE (5.88%) Total FTE (2.04%) Notes - The Library Department budget will decrease by 1.58% mainly due to a reduction in funding requirements to St. Petersburg College for the joint-use West St. Petersburg Library. There will also be savings in services and commodities ($9,211). St. Petersburg College has agreed to contribute towards the West Branch Library's collection and to pay for the most expensive position at the branch. - In FY 13, one vacant full-time Librarian I position will be eliminated and part of the salaries and benefits savings will be used to turn a parttime Application Support Specialist position into a full-time position ($46,781). - During FY12, a Librarian II position was eliminated. Department Summary Page 62
143 City of St. Petersburg FY2013 Budget Neighborhood Partnership Department Department Mission Statement The mission of the Neighborhood Partnership Department is to be proactive and responsive to resident, business and neighborhood issues by coordinating city services and resources to ensure quality customer service, promote volunteerism, and encourage civic engagement and participation to enhance and sustain neighborhood and business corridor character. Services Provided The Neighborhood Partnership Department provides the following services: I. Community Services Work Order Generation and Proactive Surveys by Community Service Representatives Work Order Generation by Mayors Action Center II. Neighborhood Services Neighborhood Plan Updates Liaison with Neighborhood Associations, Business and other Community Groups Crime Prevention through Environmental Design (C. P.T.E.D.) Coordinate Sector Meetings (f/k/a City Teams) Advancing Neighborhoods Through Schools (A.N.T.S) a. Advance quality of life improvements in neighborhoods with emphasis around schools & parks b. Facilitate seamlessness c. Areas of greatest need: Melrose - Mercy, Campbell Park, John Hopkins, Fairmont Park/Childs Park d. Coordination of city departments/resources - Just Do It (Police, Codes, Fire, Water Resources, Stormwater & Traffic Ops, Sanitation, Planning & Economic Dev, Housing, Parks & Recreation, Schools, N-Team, Transportation, Homeless & Veteran Services, Engineering) III. Volunteer Coordination I CAN Recruit & monitor volunteer utilization Ongoing Assist with organization/reorganization of neighborhood associations Emergency Response: Mass Care (Points of Distribution) IV. Special Projects Carefest (collaboration with multiple departments depending on projects submitted) Paris Projects (collaboration with Housing & Community Development Department) African-American Heritage Trail (collaboration with Planning & Economic Development [Historic Preservation & BAC]) Scrubbin `Da Burg (collaboration with Parks & Recreation) Family Fun Day (collaboration with various community agencies and city departments) Edwards Gala (collaboration with various community agencies and city departments) St. Petersburg Together television show Budgetary Cost Summary Wages And Benefits 337, , , , (100.00%) Services And Commodities 87,507 75,608 61,928 61,928 63,631 0 (100.00%) Grants And Aid , % Total Budget 425, , , ,533 64,104 0 (100.00%) Appropriations By Fund/Program General Operating Fund Neighborhood Partnership Program 425, , , ,533 64,104 0 (100.00%) Total Budget 425, , , ,533 64,104 0 (100.00%) Department Summary Page 63
144 City of St. Petersburg FY2013 Budget Revenue Sources Contributions And Donations 20 6, % Misc Revenue (550) 15,000 19,064 19,064 19,064 0 (100.00%) General Fund 425, , , ,469 45,040 0 (100.00%) Total Revenue 425, , , ,533 64,104 0 (100.00%) Position Summary Neighborhood Partnership Program (100.00%) Total Full-Time FTE (100.00%) Total FTE (100.00%) Notes - The Neighborhood Partnership Department was reorganized as a new Community Services Department. The positions were all transferred to the new department. Department Summary Page 64
145 City of St. Petersburg FY2013 Budget Parks & Recreation Department Department Mission Statement The St. Petersburg Parks & Recreation Department mission is to preserve, protect, maintain, and enhance the city's parklands and recreational facilities and engage people in leisure activities that contribute to their quality of life. Services Provided The Parks & Recreation Department provides the following services: Recreation Section: Programming, maintenance, and operation of 13 recreation centers. Programming, maintenance, and operation of nine swimming pools and Treasure Island Beach. Programming, maintenance, and operation of two community service centers and citywide advocacy for aging issues. Planning and coordination of citywide services in therapeutic recreation, teen programs, special events, and citywide co-sponsored events. Maintenance and operation of two skate parks and 66 hard surface tennis courts. Parks Section: Administration Division: Responsible for the overall administration, support, marketing, leadership, planning, budget preparation, and fiscal management of the Parks Section. Also administers policies and procedures as directed by the mayor and administration. This division serves as a communication network for citizens and employees. Facilities Maintenance Division: Plans, directs, implements, and coordinates facility repairs and contractor provided services in order to provide safe, clean, and attractive facilities of the highest quality for the residents and visitors of St. Petersburg to enjoy their leisure pursuits. Parks Programs and Maintenance, Horticulture Operations, and Boyd Hill and Clam Bayou Nature Preserves Division: Responsible for the development and maintenance of parks, grounds, and related equipment, including playgrounds, beaches, and facilities located within Park Districts I & III. Provides staff support for the Green Thumb Committee and City Beautiful Commission (CBC); coordinates the Annual CBC Awards Program, Gift Tree Program, and Paving the Future Brick Program; and provides grounds maintenance and necessary services at the Gizella Kopsick Palm Arboretum. Park Maintenance, Equipment Coordination, Forestry, Large Mowing, and Tree Removal Division: Responsible for the development and maintenance of parks, grounds, and related equipment; including playgrounds, beaches, and facilities located within Park Districts II, IV and V. This division provides equipment coordination for the entire Leisure & Community Services Administration, which involves providing fuel and equipment pick up for outlying areas. Also provides forestry functions of trimming, pruning, and removing of hazardous trees citywide. This division is also responsible for tree removals, large equipment mowing for all large, open areas within the parks system and airport properties. Provides support to the city's Disaster Operations Plan by operating as the primary agency for debris clearance. Athletic Operations, Field Construction and Maintenance, Interstate Maintenance, and Safety and Training Division: Responsible for the development and maintenance of athletic facilities, grounds, and related equipment. This division coordinates the administration of adult athletic leagues and tournaments in softball, football, and basketball and the scheduling and rental use of athletic fields for adult and youth sports. Also oversees beautification grants and contract maintenance for city landscaping projects installed on state highways and the interstate system. Performs routine construction activities related to park maintenance and frequently assists with capital improvement projects involving parks and recreation facility development and/or renovation. Also responsible for safety and training of parks staff and other related department projects. Budgetary Cost Summary Wages And Benefits 20,855,894 20,939,684 21,086,421 21,560,637 21,689,265 21,107, % Services And Commodities 10,178,388 9,874,335 9,059,837 10,351,541 9,181,297 9,650, % Capital 448, ,687 94, , ,009 45,500 (52.07%) Grants And Aid 0 1, , , , , % Total Budget 31,482,650 31,345,363 31,025,943 32,960,930 31,949,321 31,587, % Appropriations By Fund/Program General Operating Fund Aquatics & Pools Program Athletics Operations 2,779,361 4,262,142 2,809,312 4,512,472 2,695,691 4,373,751 2,868,370 4,439,020 2,818,740 4,258,357 2,703,805 4,190, % (4.19%) Boyd Hill/Clam Bayou Nature Preserve Program 1,156,950 1,058, , , ,912 1,025, % Engineering Capital Improvements 0 3, % Program Facilities Maintenance 1,669, , , , , , % Office on Aging Program 1,371,544 1,388,269 1,270,534 1,270,845 1,246,180 1,272, % Park Maint & Equipment Coordination 3,943,335 4,727,854 4,604,460 4,658,785 4,862,591 4,847, % Program Parks Administration/Support Program 786, , ,225 10, % Parks Maintenance & Horticulture 3,136,126 3,167,546 3,076,451 3,234,883 3,200,359 2,895,790 (5.87%) Department Summary Page 65
146 City of St. Petersburg FY2013 Budget Appropriations By Fund/Program Program Recreation Administration Program 4,323,236 3,543,394 4,275,314 5,675,878 4,970,250 4,410, % Recreation Centers Program 6,365,303 7,087,383 7,563,223 7,599,579 7,598,023 7,770, % Special Programs & Therapeutic Rec 1,682,428 1,827,251 1,603,388 1,624,515 1,409,262 1,759, % Program Totals for General Operating Fund 31,476,650 31,345,363 31,025,943 32,960,930 31,949,321 31,587, % Neighborhood Stabilization Program Housing Trust Funds Program 6, % Total Budget 31,482,650 31,345,363 31,025,943 32,960,930 31,949,321 31,587, % Revenue Sources Federal Grants 553, , % State Grants 0 3, , % Grants From Other Local Units 1,098,865 1,212,992 1,338,807 2,423, ,514, % General Government % Transportation Charges 103, , , , , ,424 (11.98%) Culture And Recreation Charges 4,531,717 5,081,168 5,999,560 5,999,560 5,747,829 5,400,322 (9.99%) Other Charges For Services 272, , , , ,541 (40.83%) Violation Of Local Ordinances (13) % Sale Of Fixed Assets 1, % Contributions And Donations 43,534 81,831 10,000 10,000 83,550 10, % Misc Revenue (9,983) (26,408) % Other Charges (393) (1,657) % Transfer From Parking Revenue % Transfer From Weeki Wachee 0 8, % General Fund 24,884,877 23,918,750 23,057,967 23,818,251 25,962,342 24,251, % Emergency Medical Services (2,360) % Local Option Tax Revenue (443) % Neighborhood Stabilization Program 6, % Total Revenue 31,482,650 31,345,363 31,025,943 32,960,930 31,949,321 31,587, % Position Summary Aquatics & Pools Program % Athletics Operations (10.16%) Boyd Hill/Clam Bayou Nature Preserve Program % Facilities Maintenance % Office on Aging Program % Park Maint & Equipment Coordination Program % Parks Administration/Support Program % Parks Maintenance & Horticulture Program % Recreation Administration Program % Recreation Centers Program % Special Programs & Therapeutic Rec Program % Total Full-Time FTE % Aquatics & Pools Program % Athletics Operations % Boyd Hill/Clam Bayou Nature Preserve Program % Office on Aging Program % Park Maint & Equipment Coordination Program % Department Summary Page 66
147 City of St. Petersburg FY2013 Budget Position Summary Parks Maintenance & Horticulture Program (12.50%) Recreation Administration Program (79.43%) Recreation Centers Program % Special Programs & Therapeutic Rec Program (4.46%) Total Part-Time FTE % Total FTE % Notes The Parks & Recreation Department's budget will increase by 1.81% more than the budget due to the following changes for FY13: - Non-renewal of the FDOT contract provides for $282,370 in expense savings and a reduction in revenue of $280,721 for a net savings of $1, The following positions were deleted: Two Equipment Operators II ($96,788), a Maintenance Worker II ($53,204), and one Maintenance Mechanic I ($39,579). Those reductions were replaced by the following added positions: One full-time Laborer $27,991 and three part-time Laborers $32, Transfer labor cost of pickup of trash in parks to Sanitation ($501,366). - Revenue from a parking meter fee increase at Treasure Island Beach ($31,424). - Transfer of the labor cost for Central Avenue street and curb blowing and sweeping to Stormwater ($10,124). -Reduction in the revenue budget to reflect that parking meters at Northshore Park will not be installed (-$100,000), and an increase in grant revenues of $175,890 for the Child Care Food Program (Snack Grant). Net change $75, Miscellaneous savings ($64,017). Department Summary Page 67
148 City of St. Petersburg FY2013 Budget Public Safety Public Safety Total Full Time Equivalents (FTE) = 1, Fire Department Total Full Time Equivalents (FTE) = Police Department Total Full Time Equivalents (FTE) = Department Summary Page 68
149 City of St. Petersburg FY2013 Budget Public Safety Budgetary Cost Summary Wages And Benefits 114,203, ,963, ,569, ,088, ,986, ,871, % Services And Commodities 15,868,187 16,526,375 17,748,664 18,373,062 19,522,995 20,319, % Capital 2,039,684 1,804, ,044 2,625,995 2,010, , % Grants And Aid 482, , , , , ,000 (26.47%) Total Budget 132,594, ,686, ,745, ,389, ,797, ,951, % Appropriations By Fund/Department General Operating Fund Fire Department 33,788,063 32,219,362 30,687,107 32,625,042 32,330,410 32,471, % Police Department 85,099,282 87,550,550 86,242,409 86,797,372 87,357,554 91,713, % Non-General Funds Total General Operating Fund 118,887, ,769, ,929, ,422, ,687, ,185, % Emergency Medical Services 12,523,371 12,657,229 13,072,940 13,110,371 12,621,033 13,545, % Health Insurance % Law Enforcement Fund 497, , , , , , % Police Grant Fund 686, , , , ,992 34,508 (93.70%) Technology & Infrastructure Fund 0 1,183,847 8,290 1,065,324 1,057,034 0 (100.00%) Total Non-General Funds 13,706,843 14,916,367 13,815,607 15,967,334 15,109,444 13,766,123 (0.36%) Total Budget 132,594, ,686, ,745, ,389, ,797, ,951, % Revenue Sources Other License And Permits 294, , , , , , % Federal Grants 2,259,672 1,896, ,000 2,512,564 3,077,661 1,836, % State Grants 1, % Shared State Fire Fighters' Su 76,863 82,100 87,460 87,460 70,510 87, % Grants From Other Local Units 298, , ,935, % General Government 102,346 99, , , , , % Public Safety 14,034,937 15,412,068 14,752,558 14,752,558 14,724,103 15,266, % Other Charges For Services 275, , , , , , % Traffic And Parking 1,521, ,336 2,862,015 2,862,015 3,196,326 3,663, % Interest Earnings 1,180 2, , % Sale Of Fixed Assets 169,116 (165,479) 145, , , , % Contributions And Donations , % Misc Revenue 47,057 5, , , , , % Other Charges 10 (590) % Transfer From Technology & , % Infrastructure Fund General Fund 113,398, ,510, ,864, ,259, ,551, ,118, % Emergency Medical Services 577,165 (46,687) 594, , , ,852 (3.01%) Police Grant Fund 5,320 7, , ,577 (300,798) 34,508 (93.70%) Department Summary Page 69
150 City of St. Petersburg FY2013 Budget Revenue Sources Law Enforcement Fund (468,707) (93,165) 186, , , , % Local Option Tax Revenue (124) % Preservation Reserve (1,500) % Technology & Infrastructure 0 1,183,847 8,290 1,065,324 1,057,034 0 (100.00%) Fund Health Insurance % Total Revenue 132,594, ,686, ,745, ,389, ,797, ,951, % Position Summary By Department Fire Department % Police Department (0.40%) Total Full-Time FTE 1, , , , % Fire Department % Police Department % Total Part-Time FTE % Total FTE 1, , , , % Department Summary Page 70
151 City of St. Petersburg FY2013 Budget Public Safety Fire Department Department Mission Statement St. Petersburg Fire and Rescue is committed to serving the community and each other by protecting and improving health, safety, and quality of life through exceptional emergency service and education. Services Provided St. Petersburg Fire & Rescue provides the following services: Administration provides support to all divisions through the Fire Chief's executive leadership and personnel management including the department's medical evaluation program. Fiscal services, including grants management, provides required documentation for the department's City Council consent agenda items, coordination of the department's capital improvement program, budgeting, payroll, purchasing, accounts receivable and payable, and fixed assets management. Computer services provides administration and computer/communications support services for all divisions of the department. Fire prevention supports education, economic development, public safety, and neighborhoods through public education, arson investigation, cyclic inspection, and construction plans review. Fire operations saves lives and protects property from the ravages of fire with the first line of defense being public education and prevention. In the event a fire does start, the department's mission is to save lives and to extinguish the fire in the most expeditious manner available with a minimum of property damage. Fire operation facilitates new construction and manages the maintenance of all department facilities. Safety and training develops and manages the safety and training programs for the department. Promotes, enhances, and protects the safety and welfare of department personnel. Benchmarks of this mission are no firefighter fatalities, decreased injuries, increased effectiveness at emergency operations, decreased fire loss, and decreased damage to tools and equipment. Emergency Medical Services is responsible for the delivery of advanced life support services throughout the city of St. Petersburg. These services include the placement of advanced airways, monitoring and interpreting cardiac rhythms, cardiac defibrillation, and administering intravenous medications. This division also provides cardiopulmonary resuscitation and first aid training. Budgetary Cost Summary Wages And Benefits 40,135,959 40,005,349 38,882,059 40,134,525 39,599,485 40,332, % Services And Commodities 4,379,516 4,378,788 4,659,988 4,951,622 5,100,958 5,049, % Capital 1,784, , , , , , % Grants And Aid 11,250 9, % Total Budget 46,311,435 44,876,591 43,768,337 45,743,704 44,951,443 46,017, % Appropriations By Fund/Program General Operating Fund Fire Admin, Fiscal & Emergency Mgt 1,479,618 1,136,715 1,200,644 1,203,579 1,166,955 1,111,749 (7.40%) Program Fire Computer Services Program 408, , , , , , % Fire Operations Program 29,203,040 28,216,554 26,590,284 28,521,491 28,323,003 28,241, % Fire Prevention Program 2,018,857 1,752,092 1,819,898 1,822,698 1,832,557 1,979, % Fire Training Program 678, , , , , , % Totals for General Operating Fund 33,788,063 32,219,362 30,687,107 32,625,042 32,330,410 32,471, % Emergency Medical Services Emergency Medical Services Program Fire Operations Program 12,523, ,656,146 1,083 13,072, ,110, ,620, ,545, % 0.00% Totals for Emergency Medical Services 12,523,371 12,657,229 13,072,940 13,110,371 12,621,033 13,545, % Technology & Infrastructure Fund Fire Computer Services Program 0 0 8,290 8, (100.00%) Total Budget 46,311,435 44,876,591 43,768,337 45,743,704 44,951,443 46,017, % Department Summary Page 71
152 City of St. Petersburg FY2013 Budget Revenue Sources Other License And Permits 9,150 10,100 10,290 10,290 10,290 10, % Federal Grants 716, , ,827,564 2,231, , % Shared State Fire Fighters' Su 76,863 82,100 87,460 87,460 70,510 87, % General Government 101,740 99, , , , , % Public Safety 12,388,610 13,065,847 12,915,058 12,915,058 12,883,922 13,428, % Other Charges For Services % Sale Of Fixed Assets 8,112 62, , % Contributions And Donations , % Misc Revenue (2,081) (24,188) 7,600 7,600 7,600 7, % Other Charges 0 (519) % General Fund 32,433,155 31,197,270 30,017,787 30,128,159 29,429,160 30,942, % Emergency Medical Services 578,580 (46,687) 594, , , ,852 (3.01%) Technology & Infrastructure Fund 0 0 8,290 8, (100.00%) Total Revenue 46,311,435 44,876,591 43,768,337 45,743,704 44,951,443 46,017, % Position Summary Emergency Medical Services Program % Fire Admin, Fiscal & Emergency Mgt Program % Fire Computer Services Program % Fire Operations Program % Fire Prevention Program (12.50%) Fire Training Program % Total Full-Time FTE % Fire Admin, Fiscal & Emergency Mgt Program % Total Part-Time FTE % Total FTE % Notes - The Fire Department's General Fund budget will increase by 5.82% in FY13. The increase is mainly due to increases in Salaries & Wages - FT, Medical Insurance, Data Processing, Vehicle Replacement, Fuel, Overtime and Personal Protective Equipment. Also, an additional $75,000 was added per contract to provide fire services to South Pasadena. - In FY13, the Water Resources Department will start paying for fire hydrant testing services currently performed by the Fire Department ($100,000). - Also in FY13, one vacant full-time Maintenance Mechanic II Position ($44,003) will be eliminated. -During FY12, 6 full-time Firefighter positions were added as part of the two year Staffing for Adequate Fire and Emergency Response (SAFER) Grant ($1,143,006). - The department's Emergency Medical Services Fund budget will increase by 3.61% in FY13 due to increases in Salaries & Wages - FT, Medical Insurance, and Vehicles. Department Summary Page 72
153 City of St. Petersburg FY2013 Budget Police Department Department Mission Statement The mission of the Police Department is to provide professional police service to the community by adhering to the values of respect, accountability, and integrity. Services Provided The Police Department provides the following services: The department utilizes the Community Policing philosophy to achieve the highest level of quality service and citizen satisfaction and works to provide a safe and secure environment for the citizens of and visitors to the city of St. Petersburg. Employees work to prevent, detect, and investigate crime and provide the safe movement of traffic. Budgetary Cost Summary Wages And Benefits 74,067,726 75,957,825 73,687,356 73,954,406 73,386,965 76,538, % Services And Commodities 11,488,671 12,147,588 13,088,676 13,421,441 14,422,037 15,270, % Capital 254,974 1,321,718 30,754 1,968,438 1,759,688 0 (100.00%) Grants And Aid 471, , , , , ,000 (26.47%) Total Budget 86,282,754 89,809,688 86,976,786 89,646,045 89,845,965 91,934, % Appropriations By Fund/Program General Operating Fund Communications, Records & Info Program 10,467,835 10,387,746 10,386,960 10,443,468 11,021,570 11,038, % Community & Youth Resources Program 4,875,646 5,276,908 4,976,839 4,977,349 4,951,696 5,358, % Fire Operations Program % Investigative Services Program 17,751,182 17,722,555 16,597,119 16,599,064 16,587,722 16,904, % Non-Departmental/Arts/Social Services 0 196, , , , ,000 (26.47%) Police Administration Program 6,693,363 7,063,894 5,669,325 5,721,459 5,746,500 6,384, % Uniform Services Program 45,311,232 46,903,411 48,442,166 48,553,201 48,818,066 51,901, % Totals for General Operating Fund 85,099,282 87,550,550 86,242,409 86,797,372 87,357,554 91,713, % Law Enforcement Fund Investigative Services Program 0 (341) % Law Enforcement Trust Fund Program 492, , , , , , % Police Administration Program 4, % Totals for Law Enforcement Fund 497, , , , , , % Police Grant Fund Communications, Records & Info Program 159, , , , ,885 34,508 (83.16%) Investigative Services Program 103, , , ,227 61,216 0 (100.00%) Police Administration Program 44,522 62, ,631 84, % Uniform Services Program 378, , , , ,373 0 (100.00%) Totals for Police Grant Fund 686, , , , ,992 34,508 (93.70%) Technology & Infrastructure Fund Communications, Records & Info Program 0 1,183, ,057,034 1,057, % Health Insurance Uniform Services Program % Total Budget 86,282,754 89,809,688 86,976,786 89,646,045 89,845,965 91,934, % Department Summary Page 73
154 City of St. Petersburg FY2013 Budget Revenue Sources Other License And Permits 285, , , , , , % Federal Grants 1,542,715 1,490, , , ,790 1,000, % State Grants 1, % Grants From Other Local Units 298, , ,935, % General Government ,100 56,100 56,100 56, % Public Safety 1,646,328 2,346,221 1,837,500 1,837,500 1,840,181 1,837, % Other Charges For Services 275, , , , , , % Traffic And Parking 1,521, ,336 2,862,015 2,862,015 3,196,326 3,663, % Interest Earnings 1,180 2, , % Sale Of Fixed Assets 161,004 (227,729) 145, , , , % Contributions And Donations 0 3, % Misc Revenue 49,139 29, , , , , % Other Charges 10 (71) % Transfer From Law Enforcement Fund % General Fund 80,964,858 83,312,994 79,846,449 80,131,412 79,122,487 84,175, % Police Grant Fund 5,320 7, , ,577 (300,798) 34,508 (93.70%) Law Enforcement Fund (468,707) (93,165) 186, , , , % Emergency Medical Services (1,415) % Preservation Reserve (1,500) % Local Option Tax Revenue (124) % Technology & Infrastructure Fund 0 1,183, ,057,034 1,057, % Health Insurance % Total Revenue 86,282,754 89,809,688 86,976,786 89,646,045 89,845,965 91,934, % Position Summary Communications, Records & Info Program % Community & Youth Resources Program % Investigative Services Program (1.39%) Police Administration Program % Uniform Services Program (1.77%) Total Full-Time FTE (0.40%) Communications, Records & Info Program % Community & Youth Resources Program % Investigative Services Program % Police Administration Program (18.75%) Uniform Services Program % Total Part-Time FTE % Total FTE % Notes - The department's General Fund budget will increase by 6.34% in FY13. The majority of the increase is due to increases in Police Pension, Medical Insurance, Workers' Compensation, Data Processing, Claims - Self Insurance, R/M Vehicles, and Fuel. - These increases were partially offset by reductions in various line items including Overtime ($311,622), Medical Services ($34,329), Rent - Other Equipment ($42,481), Police Commodities ($22,750), and Other Office Supplies ($5,791). - The FY13 Budget includes $125,000 for WestCare. - During FY12, eight part-time Police Investigative Assistant positions were added as part of the Intersection Public Safety Program (Red Light Cameras). Department Summary Page 74
155 City of St. Petersburg FY2013 Budget - The three year Edward Byrne Memorial Justice Assistance Grant ($1,303,348) ends in FY12. The grant funded one full-time Information Clerk II ($37,474), three full-time Emergency Complaint Writers ($154,801), one full-time Office Systems Specialist ($43,215), one full-time Data Entry Operator I ($42,770), one full-time Police Investigative Assistant ($69,515), two full-time Crime Analysts ($101,951), and one fulltime Intelligence Analyst ($58,870). One Crime Analyst position, one Intelligence Analyst position, and one Office Systems Specialist position are being eliminated in FY13. The remaining seven positions will be added to the General Fund. - FY12 was the final year of the COPS Hiring Recovery Program Grant. The three year grant was used to retain five full-time Police Officer positions ($355,689), which would have been eliminated in FY10, and to increase staffing by five more full-time Police Officer positions ($355,689). These positions will be funded out of the General Fund starting in FY13. - In the FY12 Budget Book, grant funded positions were included in the position summary for the first time. Department Summary Page 75
156 City of St. Petersburg FY2013 Budget Public Works Administration Public Works Administration Total Full Time Equivalents (FTE) = Engineering and Capital Improvements Department Total Full Time Equivalents (FTE) = Fleet Management Department Total Full Time Equivalents (FTE) = Procurement & Supply Management Total Full Time Equivalents (FTE) = Public Works Administration Department Total Full Time Equivalents (FTE) = 2.40 Sanitation Department Total Full Time Equivalents (FTE) = Stormwater, Pavement & Traffic Operations Department Total Full Time Equivalents (FTE) = Water Resources Department Total Full Time Equivalents (FTE) = Department Summary Page 76
157 City of St. Petersburg FY2013 Budget Public Works Administration Budgetary Cost Summary Wages And Benefits 48,925,544 48,528,715 48,845,803 48,848,847 49,489,123 49,444, % Services And Commodities 104,352, ,488, ,929, ,182, ,418, ,232, % Capital 6,686,659 11,737,601 9,879,424 14,165,693 12,915,594 14,645, % Transfers Out 23,234,076 24,646,425 24,443,326 24,443,326 24,443,326 31,254, % Total Budget 183,198, ,401, ,098, ,640, ,266, ,577, % Appropriations By Fund/Department General Operating Fund Engineering And Capital Improvements Department 1,090,176 1,031,385 1,074,693 1,103,315 1,211,187 1,024,299 (4.69%) Procurement & Supply Management 1,179,482 1,214,580 1,134,835 1,143,138 1,160,246 1,214, % Public Works Administration Department 5,402,886 5,276,293 5,492,955 5,493,235 5,197,726 5,270,052 (4.06%) Sanitation Department 36,291 54, % Stormwater, Pavement & Traffic Operations Department 3,439,436 3,656,894 3,494,395 3,521,273 3,532,233 3,750, % Water Resources Department 1,347 20, % Non-General Funds Total General Operating Fund 11,149,619 11,253,624 11,196,878 11,260,960 11,101,392 11,259, % Airport Operating 1,409 (1,458) % American Recovery & Reinvestment Act 528, , % Community Development Block Grant (10,767) 0 0 (10,689) % Equipment Replacement 2,767,386 8,986,867 8,060,800 12,049,756 12,050,417 9,364, % Fleet Management 15,571,284 16,818,264 16,011,869 16,465,841 16,538,117 17,591, % Information & Communication Services 0 (102) % Marina Operating (266) (215) % Neighborhood Stabilization Program 159,363 21, % Port Operating (161) (147) % Sanitation Equipment Replacement 3,365,804 2,489,859 2,244,000 2,336,713 1,137,192 5,841, % Sanitation Operating 37,662,092 39,147,130 37,502,402 37,518,506 37,514,877 39,753, % Stormwater Utility Operating 11,841,652 10,689,860 10,485,901 10,732,218 11,205,123 13,552, % Sunken Gardens 10,732 9, % Supply Management 522, , , , , ,250 (6.39%) Water Resources 99,628, ,207, ,073, ,750, ,214, ,726, % Total Non-General Funds 172,048, ,147, ,901, ,379, ,165, ,318, % Total Budget 183,198, ,401, ,098, ,640, ,266, ,577, % Revenue Sources Contractors Permits 31,080 35,232 35,000 35,000 50,000 35, % Other License And Permits 20,410 22,165 19,500 19,500 19,500 19, % Department Summary Page 77
158 City of St. Petersburg FY2013 Budget Revenue Sources Federal Grants 0 399, % Shared State Revenue State Traffic Signal , , , , % Reimburse Shared State Fuel Tax Rebates 203,650 99, , , , , % Grants From Other Local Units 262, , , , , , % General Government 25,298 15,362 16,000 16,000 16,000 16, % Physical Environment Charges 142,448, ,950, ,688, ,688, ,877, ,289, % Other Charges For Services 660, , , , , , % Traffic And Parking (20) (256) % Interest Earnings 812, , , , , , % Rents And Royalties 13,244 13,248 15,000 15,000 12,000 10,000 (33.33%) Special Assessment 174, , , % Sale Of Fixed Assets 255,371 1,216, , , , , % Sale Of Surplus Material 311, , , , , , % Contributions And Donations 25, % Misc Revenue (9,426) (244,063) (267,000) (267,000) (440,264) (267,000) 0.00% General & Administrative 637, , , , , , % Department Charges 17,939,311 19,921,580 20,281,115 20,281,115 19,646,755 23,055, % Other Charges (72) (21) % Transfer From Water Cost Stabilization 2,994, ,784 1,500,000 1,500, ,500, % Transfer From Sanitation Operating 2,000,004 3,500,004 2,000,000 2,000,000 2,000,000 4,500, % General Fund 9,669,408 10,134,717 10,058,625 10,122,707 9,948,139 9,971,054 (0.87%) Utility Tax Revenue % Stormwater Utility Operating (467,228) (1,579,576) (1,563,816) (1,317,498) (896,594) 1,502,917 (196.11%) Fleet Management 433,912 (416,574) (299,772) 154, , ,245 (151.79%) Supply Management 484, ,423 (2,335) 12, ,992 (35,750) % Water Resources 5,779,968 3,862, ,335 1,662,996 5,190,362 3,823, % Sanitation Operating (2,933,319) (1,564,009) (2,611,474) (2,595,370) (2,547,436) (360,590) (86.19%) Equipment Replacement (585,077) 4,833,795 4,337,158 8,326,114 7,929,359 3,728,899 (14.02%) Information & Communication 0 (102) % Services Sanitation Equipment Replacement 1,287,275 (1,062,517) 214, ,923 (892,743) 1,311, % Health Insurance 0 (40) 0 0 (15) % Airport Operating 1,409 (1,458) % Neighborhood Stabilization 159,363 21, % Program Community Development Block (10,767) 0 0 (10,689) % Grant General Liabilities Claims % School Crossing Guard 35,000 28, , % American Recovery & Reinvestment 528, , % Act Sunken Gardens 10,732 9, % Port Operating (161) (147) % Marina Operating (266) (215) % Total Revenue 183,198, ,401, ,098, ,640, ,266, ,577, % Position Summary By Department Engineering and Capital Improvements Department (3.08%) Fleet Management Department (7.25%) Procurement & Supply Management % Public Works Administration Department (60.00%) Sanitation Department (0.56%) Stormwater, Pavement & Traffic Operations Department (1.53%) Water Resources Department (0.31%) Total Full-Time FTE (1.79%) Engineering and Capital Improvements Department (1.13%) Procurement & Supply Management % Public Works Administration Department (46.67%) Sanitation Department % Department Summary Page 78
159 City of St. Petersburg FY2013 Budget Position Summary By Department Stormwater, Pavement & Traffic Operations Department Water Resources Department % 0.00% Total Part-Time FTE (1.69%) Total FTE (1.78%) Department Summary Page 79
160 City of St. Petersburg FY2013 Budget Public Works Administration Engineering and Capital Improvements Department Department Mission Statement The mission of the Engineering and Capital Improvements Department is to provide proficient survey, mapping, engineering and architectural design, and construction inspection services for capital improvement and major maintenance projects; plan, design, and construct facilities and improvements of the highest quality in the most cost effective manner for the residents and visitors of St. Petersburg; and provide courteous and timely processing of permit applications. Services Provided The Engineering and Capital Improvements Department provides the following services: Plans, designs, and manages construction projects for city roads, infrastructure, and facilities. Administers major maintenance programs for roadways, bridges, and sidewalks. Maintains and improves the transportation system for the safe and efficient movement of people, goods, and services. Issues permits for work within city right-of-way. Regulates developments for stormwater runoff; administers the Stormwater Utility and city's National Pollutant Discharge Elimination System (NPDES/MS4) Permit. Compiles and updates city infrastructure records using GIS computer systems. Administers the school crossing guard program. Develops and administers a comprehensive capital improvements program for selected city facilities. Budgetary Cost Summary Wages And Benefits 1,373,666 1,494,649 1,046,049 1,046,049 1,535, ,852 (5.95%) Services And Commodities 47, ,577 28, , , , % Capital 538, ,541 0 (1,274) (28,668) (6,745) 0.00% Total Budget 1,959,792 2,131,767 1,074,693 1,375,309 1,818,696 1,244, % Appropriations By Fund/Program General Operating Fund Engineering Capital Improvements (14,312) 30, , % Program Engineering Support Program 273, , , , , , % School Crossing Guards Program 831, , , , , ,299 (6.85%) Totals for General Operating Fund 1,090,176 1,031,385 1,074,693 1,103,315 1,211,187 1,024,299 (4.69%) American Recovery & Reinvestment Act Engineering Support Program 464, , % Engineering Testing Program 6, % Housing Trust Funds Program 53,991 4, % Totals for American Recovery & Reinvestment Act 525, , % Community Development Block Grant Housing Trust Funds Program (10,767) 0 0 (10,689) % Neighborhood Stabilization Program Housing Trust Funds Program 142,296 20, % Sunken Gardens Sunken Gardens Program 10,732 9, % Water Resources Administrative Support Services Engineering Support Program 19, , , , , , % 0.00% Totals for Water Resources 19, , , , % Stormwater Utility Operating SW Utility Collection & Marine Infrastr Program 181, , , , , % Department Summary Page 80
161 City of St. Petersburg FY2013 Budget Appropriations By Fund/Program Airport Operating Airport Program 715 (763) % Engineering Support Program 694 (694) % Totals for Airport Operating 1,409 (1,458) % Marina Operating Marina Program (266) (215) % Port Operating Port Program (161) (147) % Total Budget 1,959,792 2,131,767 1,074,693 1,375,309 1,818,696 1,244, % Revenue Sources Contractors Permits 31,080 35,232 35,000 35,000 50,000 35, % Other License And Permits 20,410 22,165 19,500 19,500 19,500 19, % General Government 15,352 14,646 16,000 16,000 16,000 16, % Other Charges For Services 7,192 (8,252) 16,000 16,000 16,000 16, % Traffic And Parking (20) (256) % Sale Of Fixed Assets 2,241 3, % Misc Revenue (34,424) (27,563) 0 0 (35,000) % Department Charges % Other Charges (0) % General Fund 1,013, , ,693 1,016,315 1,109, ,299 (5.10%) Water Resources 19, , , , % Stormwater Utility Operating 181, , , , , % Community Development Block Grant (10,767) 0 0 (10,689) % Neighborhood Stabilization Program 142,296 20, % Airport Operating 1,409 (1,458) % School Crossing Guard 35,000 28, , % American Recovery & Reinvestment Act 525, , % Sunken Gardens 10,732 9, % Port Operating (161) (147) % Marina Operating (266) (215) % Total Revenue 1,959,792 2,131,767 1,074,693 1,375,309 1,818,696 1,244, % Position Summary Engineering Capital Improvements Program % Engineering Support Program (3.39%) School Crossing Guards Program % Total Full-Time FTE (3.08%) Engineering Support Program % School Crossing Guards Program (1.17%) Total Part-Time FTE (1.13%) Total FTE (2.45%) Department Summary Page 81
162 City of St. Petersburg FY2013 Budget Notes In FY13, the department's General Fund budget will decrease by 4.69%. This is mainly due to the elimination of school crossing guard participation at city recreation centers and pool facilities during the summer months ($30,273) and the elimination of one part-time School Crossing Guard position ($6,744). - Also in FY13, one full-time Account Clerk II position will not be filled due to the centralization of accounts payable ($56,470). This position is located in the Finance Department, but funded in the Engineering and Capital Improvement Department's budget. - During FY12, $220,000 was added to the Stormwater Utility Operating Fund's budget under this department for engineering costs charged to the fund. This item remains in the FY13 budget. - Also during FY12, the Engineering Parking Program was moved to the Transportation and Parking Management Department. One of the five full-time positions remained in the department, two positions moved to the Stormwater, Pavement & Traffic Operations Department and the remaining two went to the Transportation and Parking Management Department. All five positions' cost are charged to the Parking Fund. Department Summary Page 82
163 City of St. Petersburg FY2013 Budget Fleet Management Department Department Mission Statement The mission of the Fleet Management Department is to provide timely and cost effective services to all user departments to maximize availability, serviceability, safety, and appearance of all the city's vehicles and equipment. Services Provided Fleet Management provides the following services: Performs scheduled maintenance and repairs, and provides replacement parts as needed to maintain city equipment. Provides fuel and emergency road service on a 24 hour a day basis as needed. Procures parts, fuels, and lubricants to maintain city equipment. Monitors costs of fuel, parts, and labor and establishes internal service fund charges to other city agencies. Fleet Equipment Replacement provides the following services: Provides tracking and analysis of all fleet equipment to determine most economically useful life. Schedules and conducts ""retirement"" inspections, which support replacing equipment or extending its life. Prepares specifications for equipment and participates in the procurement process. Budgetary Cost Summary Wages And Benefits 5,130,087 4,781,727 5,060,831 5,060,831 4,735,262 4,985,808 (1.48%) Services And Commodities 10,611,415 12,140,725 11,120,838 11,529,015 11,931,160 12,777, % Capital 2,597,168 8,882,578 7,891,000 11,925,751 11,922,112 9,192, % Total Budget 18,338,671 25,805,030 24,072,669 28,515,596 28,588,534 26,955, % Appropriations By Fund/Program Fleet Management Fleet Program 15,571,284 16,818,264 16,011,869 16,465,841 16,538,117 17,591, % Equipment Replacement Equipment Replacement Program Fleet Program 2,767, ,986, ,060, ,049, ,050, ,364, % 0.00% Totals for Equipment Replacement 2,767,386 8,986,867 8,060,800 12,049,756 12,050,417 9,364, % Information & Communication Services Fleet Program 0 (102) % Total Budget 18,338,671 25,805,030 24,072,669 28,515,596 28,588,534 26,955, % Revenue Sources Federal Grants 0 396, % Interest Earnings 469, , , , , , % Sale Of Fixed Assets 51, , ,000 12, % Sale Of Surplus Material 5,438 9,004 7,500 7,500 15,200 15, % Contributions And Donations 25, % Misc Revenue , % Department Charges 17,939,100 19,921,513 19,770,615 19,770,615 19,646,255 22,544, % Other Charges 0 (0) % Fleet Management 433,912 (416,574) (299,772) 154, , ,245 (151.79%) Equipment Replacement (585,077) 4,833,795 4,337,158 8,326,114 7,929,359 3,728,899 (14.02%) Health Insurance 0 (40) 0 0 (15) % Information & Communication Services 0 (102) % Total Revenue 18,338,671 25,805,030 24,072,669 28,515,596 28,588,534 26,955, % Department Summary Page 83
164 City of St. Petersburg FY2013 Budget Position Summary Fleet Program (7.25%) Total Full-Time FTE (7.25%) Total FTE (7.25%) Notes - In FY13, the Fleet Management Fund budget will increase by 9.86%. The majority of this increase is attributed to the management and operating fees for NAPA to provide the onsite parts store ($351,528) and an increase in fuel ($1,328,744) and parts costs ($539,016). - This increase is somewhat offset by department operating reductions including the outsourcing of the Fleet Parts Division to NAPA ($303,970), which includes the reduction of five full-time positions (Automotive Parts Technician, Equipment Serviceman II and three Automotive Parts Clerks), a temporary part-time Automotive Parts Clerk (temporary positions are not included in the position count), and reductions to Other Compensation and Services and Commodities. There will also be savings in parts costs and a reduction in Overtime ($409,998). - The Equipment Replacement Fund budget will increase by 16.17% in FY13. The replacements maintain the city's current level of service and the increase results from the cyclical nature of the equipment replacement plan. Department Summary Page 84
165 City of St. Petersburg FY2013 Budget Procurement & Supply Management Department Mission Statement The mission of the Purchasing & Materials Management Department is to procure supplies and services for our clients at the best value through supplier collaboration and innovative supply-chain practices and technology. Services Provided The Purchasing & Materials Management Department provides the following services: Plans, directs, and supervises the procurement of supplies and services. Controls warehouse and inventory of supplies for internal distribution to requesting departments. Disposes of surplus property. Maintains procedures for the inspection of supplies and services and maintains the procurement and inventory applications in the Oracle E-Business Suite. Budgetary Cost Summary Wages And Benefits 1,291,471 1,322,972 1,310,155 1,313,199 1,288,215 1,316, % Services And Commodities 418, , , , , , % Capital 1, % Total Budget 1,711,363 1,757,913 1,657,500 1,680,354 1,665,288 1,703, % Appropriations By Fund/Program General Operating Fund Materials Management Program Purchasing Program 0 1,179, ,214, ,134, ,143, ,160, ,214, % 7.00% Totals for General Operating Fund 1,179,482 1,214,580 1,134,835 1,143,138 1,160,246 1,214, % Neighborhood Stabilization Program Purchasing Program 9,195 1, % Water Resources Purchasing Program % Supply Management Materials Management Program 522, , , , , ,250 (6.39%) Total Budget 1,711,363 1,757,913 1,657,500 1,680,354 1,665,288 1,703, % Revenue Sources General Government 9, % Interest Earnings % Sale Of Fixed Assets 36,248 35,406 15,000 14,972 6,993 15, % Sale Of Surplus Material ,000 2,000 2,018 2, % Misc Revenue 327,105 (4,422) 21,000 21,000 21,000 21, % General & Administrative 514, , , , , , % Department Charges , , , % Other Charges (72) (21) % Supply Management 484, ,423 (2,335) 12, ,992 (35,750) % General Fund 329, , , , , , % Water Resources % Neighborhood Stabilization Program 9,195 1, % Total Revenue 1,711,363 1,757,913 1,657,500 1,680,354 1,665,288 1,703, % Department Summary Page 85
166 City of St. Petersburg FY2013 Budget Position Summary Materials Management Program % Purchasing Program % Total Full-Time FTE % Materials Management Program % Total Part-Time FTE % Total FTE % Notes - In FY13, the department's General Fund budget will increase by 7%, mainly due to increases in Salary & Wages - Full-Time and Data Processing. - Also in FY13, the Supply Management Fund budget will decrease by 6.39%. This is due to decreases in Salary & Wages - Full-Time, Medical Insurance, and Workers' Compensation. Department Summary Page 86
167 City of St. Petersburg FY2013 Budget Public Works Administration Department Department Mission Statement The mission of the Public Works Administration Department is to administer the responsible use of city resources; implement the Capital Improvement Program; maintain the city's infrastructure; facilitate the maintenance, repair, and replacement of city vehicles; contribute to efficient solid waste operations; and maintain a quality water supply. Services Provided The Public Works Administration Department provides the following services: Administrative and support services for all of the programs in this department. Advises on policy decisions affecting operations within this administration. Budgetary Cost Summary Wages And Benefits 556, , , ,610 88, ,652 (18.06%) Services And Commodities 4,846,784 4,820,098 5,155,345 5,155,625 5,109,436 4,993,400 (3.14%) Total Budget 5,402,886 5,276,293 5,492,955 5,493,235 5,197,726 5,270,052 (4.06%) Appropriations By Fund/Program General Operating Fund Public Service Representative Program Public Works Program 383, , , , , , , ,281 (94,181) 268, ,022 (100.00%) 28.61% Street Lighting & Lighting Maintenance Program 4,753,849 4,722,379 5,070,030 5,070,310 5,023,000 4,970,030 (1.97%) Totals for General Operating Fund 5,402,886 5,276,293 5,492,955 5,493,235 5,197,726 5,270,052 (4.06%) Total Budget 5,402,886 5,276,293 5,492,955 5,493,235 5,197,726 5,270,052 (4.06%) Revenue Sources Shared State Revenue State Traffic Signal , , , , % Reimburse Misc Revenue 292 (25) 10,000 10,000 10,000 10, % General & Administrative 123, , , , , , % General Fund 5,278,886 5,148,902 5,220,539 5,220,819 4,925,310 4,997,636 (4.27%) Total Revenue 5,402,886 5,276,293 5,492,955 5,493,235 5,197,726 5,270,052 (4.06%) Position Summary Public Service Representative Program (100.00%) Public Works Program % Total Full-Time FTE (60.00%) Public Works Program (46.67%) Total Part-Time FTE (46.67%) Total FTE (58.26%) Notes - In FY13, the Public Works Administration Department's budget will decrease by 4.06%. The majority of this reduction is a decrease in Electric ($100,000) due to energy savings associated with lighting retrofits. - Also in FY13, three Public Service Representatives were transferred to the new Community Services Department as part of a reorganization ($77,697). Department Summary Page 87
168 City of St. Petersburg FY2013 Budget Sanitation Department Department Mission Statement The mission of the Sanitation Department is to collect solid waste within the city's boundaries and to ensure that it is disposed of in the most cost effective and efficient manner and to operate brush sites and rodent control programs. The department's mission is also to process yard waste into mulch for farming and landscaping, deliver recyclables to recycling businesses and transport the remaining waste to the Pinellas County Recovery Plant where it is converted into electricity. Services Provided The Sanitation Department provides the following services: Residential Services: provides for the collection of residential refuse. Commercial Services: provides for the collection of commercial refuse. Special Services: provides for sanitation services outside of the ordinary such as rodent control, special pick-up, Mr.Sparkle Program, brush sites, and mulch production from yard waste. Maintenance: washes the fleet and delivers and maintains the refuse containers. Administrative Services: provides for the management and supervision of the various operations. Community Services: collects snipe signs, removes graffiti and clears overgrown lots. Sanitation fees also pay for the Codes demolition and NTeam programs. Budgetary Cost Summary Wages And Benefits 12,468,526 12,393,753 12,881,321 12,881,321 12,643,697 12,704,983 (1.37%) Services And Commodities 22,766,934 23,072,074 22,666,005 22,677,602 22,911,104 22,600,227 (0.29%) Capital 3,373,783 2,270,099 1,744,000 1,841, ,192 5,334, % Transfers Out 2,455,080 3,955,080 2,455,076 2,455,076 2,455,076 4,955, % Total Budget 41,064,324 41,691,006 39,746,402 39,855,219 38,652,069 45,594, % Appropriations By Fund/Program General Operating Fund Finance Administration Program 1,611 6, % Public Works Program % Recreation Administration Program 20,504 26, % SW, Pavement & Traffic Ops Admin % Program Sanitation Administration Program 13,441 20, % Totals for General Operating Fund 36,291 54, % Neighborhood Stabilization Program Housing Trust Funds Program % Sanitation Operating Community Appearance Program 767, , , , , , % Sanitation Administration Program 36,894,269 38,483,190 36,947,842 36,963,073 36,957,121 39,178, % Sanitation Maintenance Shop Program (77.01%) Totals for Sanitation Operating 37,662,092 39,147,130 37,502,402 37,518,506 37,514,877 39,753, % Sanitation Equipment Replacement Sanitation Administration Program 6,634 48, , % Sanitation Equipment Replacement Program 3,359,171 2,441,210 2,244,000 2,336,713 1,137,192 5,777, % Totals for Sanitation Equipment Replacement 3,365,804 2,489,859 2,244,000 2,336,713 1,137,192 5,841, % Total Budget 41,064,324 41,691,006 39,746,402 39,855,219 38,652,069 45,594, % Department Summary Page 88
169 City of St. Petersburg FY2013 Budget Revenue Sources Grants From Other Local Units 189, , , , , , % Physical Environment Charges 39,791,955 39,357,262 39,406,000 39,406,000 39,189,861 39,406, % Other Charges For Services 511 1, % Interest Earnings 322, , , , , , % Special Assessment 174, , , % Sale Of Fixed Assets 17, , , ,000 4, , % Sale Of Surplus Material 217, , , , , , % Misc Revenue (8,216) (141,962) 3,000 3,000 (100,258) 3, % Transfer From Sanitation Operating 2,000,004 3,500,004 2,000,000 2,000,000 2,000,000 4,500, % Sanitation Operating (2,933,319) (1,564,009) (2,611,474) (2,595,370) (2,547,436) (360,590) (86.19%) General Fund 5,436 5, % Sanitation Equipment Replacement 1,287,275 (1,062,517) 214, ,923 (892,743) 1,311, % Neighborhood Stabilization Program % Total Revenue 41,064,324 41,691,006 39,746,402 39,855,219 38,652,069 45,594, % Position Summary Community Appearance Program % Sanitation Administration Program (0.57%) Total Full-Time FTE (0.56%) Sanitation Administration Program % Total Part-Time FTE % Total FTE (0.55%) Notes - In FY13, the Sanitation Operating Fund budget will increase by 6% mainly due to an increase in the transfer to the Sanitation Equipment Replacement Fund ($2,500,000). - In FY13, the department will reduce the number of spare roll off trucks from 2 to 1 ($58,000), reduce Overtime ($307,390), reduce the number of residential routes from 32 to 31, which includes eliminating a full-time Sanitation Specialist position and a residential truck ($175,098), reduce the number of spare commercial trucks from 5 to 4 ($78,286), and eliminate car allowances ($8,100). - Also in FY13, there will be an increase in the contribution to the Community Services Department from $50,000 to $70,000 to offset utility customer service support rendered by the three Public Service Representatives. - The department will also pay for Parks and Recreation Department salaries and benefit costs related to trash collection in parks and public places ($501,366) starting in FY13. - The department is budgeting about $5.841 million for planned equipment replacements, which includes, but is not limited to, the replacement of an air compressor, pressure washer, gate, welder, lot clearing equipment, residential and commercial garbage trucks, cameras, and truck scales for the brush sites. It will also purchase a CNG (Natural Gas) Time Fill Fueling Station. Department Summary Page 89
170 City of St. Petersburg FY2013 Budget Stormwater, Pavement & Traffic Operations Department Department Mission Statement The mission of the Stormwater, Pavement & Traffic Operations Department is to provide superlative service to citizens in the operations, repair, and maintenance of the city's drainage, sidewalks, roadways, and traffic signal system. Services Provided The Stormwater, Pavement & Traffic Operations Department provides the following services: Street sign installation and maintenance. Pavement marking. Traffic signal installation and maintenance. Administration/Support services. Pavement maintenance. Stormwater collection and marine facilities infrastructure maintenance. Streets sweeping and slope mowing. Budgetary Cost Summary Wages And Benefits 6,185,529 6,150,918 5,881,002 5,881,002 6,512,630 6,343, % Services And Commodities 6,045,053 6,123,489 6,241,294 6,292,627 6,235,116 6,886, % Capital 30,423 6, ,862 1, % Transfers Out 2,850,000 1,853,000 1,858,000 1,858,000 1,858,000 3,854, % Total Budget 15,111,005 14,134,035 13,980,296 14,033,491 14,607,608 17,083, % Appropriations By Fund/Program General Operating Fund Administrative Support Services % Pavement Maintenance Program 1,049,824 1,177,336 1,165,446 1,169,212 1,149,314 1,298, % Pavement Marking Program 275, , , , , , % SW Utility Collection & Marine Infrastr % Program SW, Pavement & Traffic Ops Admin 197, , , , , , % Program Sign Installation & Maintenance Program 415, , , , , , % Traffic Signals Program 1,501,373 1,533,390 1,454,753 1,475,952 1,468,918 1,532, % Totals for General Operating Fund 3,439,436 3,656,894 3,494,395 3,521,273 3,532,233 3,750, % American Recovery & Reinvestment Act Pavement Maintenance Program % Neighborhood Stabilization Program Housing Trust Funds Program 7, % Water Resources Administrative Support Services 2, % Potable & Reclaimed Water Distribution Systems (35) 2, % SW, Pavement & Traffic Ops Admin 388 1, % Program Sign Installation & Maintenance Program 0 4, % Totals for Water Resources 3,334 7, % Stormwater Utility Operating SW Utility Collection & Marine Infrastr Program SW, Pavement & Traffic Ops Admin Program 9,303,121 8,015,613 7,937,788 7,964,105 8,512,844 10,470, % % Department Summary Page 90
171 City of St. Petersburg FY2013 Budget Appropriations By Fund/Program Streets Sweeping & Slope Mowing Program 2,357,104 2,453,187 2,548,113 2,548,113 2,562,531 2,862, % Totals for Stormwater Utility Operating 11,660,249 10,468,801 10,485,901 10,512,218 11,075,375 13,332, % Total Budget 15,111,005 14,134,035 13,980,296 14,033,491 14,607,608 17,083, % Revenue Sources Federal Grants 0 2, % Shared State Fuel Tax Rebates 203,650 99, , , , , % Physical Environment Charges 11,828,564 11,865,480 11,769,885 11,769,885 11,696,801 11,769, % Other Charges For Services 646, , , , , , % Interest Earnings 1, ,832 23, , % Sale Of Fixed Assets 57,922 55,604 12,000 12,000 21,000 12, % Sale Of Surplus Material 21,173 16, , % Misc Revenue (27,302) 28,273 (51,000) (51,000) (47,000) (51,000) 0.00% General Fund 3,040,938 3,325,955 3,268,070 3,294,948 3,305,908 3,374, % Stormwater Utility Operating (648,632) (1,800,636) (1,563,816) (1,537,498) (1,026,342) 1,282,917 (182.04%) Water Resources (21,674) 7, % American Recovery & Reinvestment Act % Neighborhood Stabilization Program 7, % Total Revenue 15,111,005 14,134,035 13,980,296 14,033,491 14,607,608 17,083, % Position Summary Pavement Maintenance Program % Pavement Marking Program (20.00%) SW Utility Collection & Marine Infrastr Program % SW, Pavement & Traffic Ops Admin Program % Sign Installation & Maintenance Program (20.00%) Streets Sweeping & Slope Mowing Program % Traffic Signals Program % Total Full-Time FTE (1.53%) Pavement Maintenance Program % Total Part-Time FTE % Total FTE (1.49%) Notes - In FY13, the Stormwater, Pavement & Traffic Operations Department's (SPTO) budget will increase by 7.33% in the General Fund and by 27.15% in the Stormwater Utility Operating Fund. - The department's General Fund budget increase is mainly due to increases in Employee Retirement, Medical Insurance, Data Processing, Vehicle Replacement, and Fuel. Department Summary Page 91
172 City of St. Petersburg FY2013 Budget - The department will reduce their General Fund budget by $120,000 in FY13 due to a new capital project called Alley Reconstruction, which the department will be working on and charging their project related costs to. - Also in FY13, the Water Resources Department will pay for construction debris recycling and disposal expenses currently in the Stormwater, Pavement, & Traffic Operations Department ($100,000). - In FY12, two full-time Traffic Technician positions were moved to the department from the Engineering and Capital Improvements Department's Parking Program. The costs for these positions are charged to the Parking Fund. - The department's Stormwater Utility Operating Fund budget's increase is mainly due to the increase in project burden line items due to a decrease in the amount of IGWOs, CIP and grant project assignments ($321,886), the transfer of an additional $2,000,000 to the Stormwater Drainage Capital Projects Fund (4013) to fund stormwater capital projects, and increases to Fuel, Vehicle Replacement, Workers' Compensation, and Claims - Self - Internal. - Also in FY13, there will be an increase in the contribution to the Community Services Department from $50,000 to $70,000 to offset utility customer service support rendered by the three Public Service Representatives. Department Summary Page 92
173 City of St. Petersburg FY2013 Budget Water Resources Department Department Mission Statement The Water Resources Department provides the following services: Potable water treatment and delivery; wastewater collection, treatment, and disposal; and reclaimed water delivery for irrigation purposes. Raw water is purchased from Tampa Bay Water and delivered to the city's Cosme Water Treatment and Distribution Plant. It is then pumped via two 26-mile pipelines to St. Petersburg, Gulfport, South Pasadena, and Lealman residents. Wastewater is collected through a network of sanitary sewers and delivered to one of four treatment plants for treatment, disposal, and reclaimed water (effluent) production, which is the final product of the wastewater treatment process. Services Provided To provide outstanding core services through the delivery of quality drinking water, compliant treatment of wastewater, and efficient distribution of reclaimed water to the customers and rate payers of the department. Budgetary Cost Summary Wages And Benefits 21,920,163 21,928,500 22,328,835 22,328,835 22,685,808 22,833, % Services And Commodities 59,615,997 58,483,431 60,370,026 60,830,295 59,542,574 62,321, % Capital 145, , , , , ,161 (48.38%) Transfers Out 17,928,996 18,838,345 20,130,250 20,130,250 20,130,250 22,445, % Total Budget 99,610,559 99,605, ,073, ,687, ,736, ,726, % Appropriations By Fund/Program General Operating Fund Finance Administration Program Wastewater Collection System 1, , % 0.00% Totals for General Operating Fund 1,347 20, % American Recovery & Reinvestment Act Finance Administration Program 2, % Water Resources Administrative Support Services 41,224,810 42,556,824 44,097,841 44,214,079 43,410,149 46,868, % Potable & Reclaimed Water Distribution 5,088,473 4,421,799 5,425,508 5,450,784 5,522,724 5,874, % Systems Wastewater Collection System 6,650,823 6,343,416 6,459,434 6,460,630 6,340,005 6,868, % Wastewater Treatment & Reclamation 16,906,135 17,077,075 16,299,394 16,748,766 16,556,648 17,092, % Water Treatment & Distribution 29,736,147 29,183,907 30,791,358 30,813,254 30,907,197 31,022, % Totals for Water Resources 99,606,389 99,583, ,073, ,687, ,736, ,726, % Stormwater Utility Operating Finance Administration Program 0 1, % Total Budget 99,610,559 99,605, ,073, ,687, ,736, ,726, % Revenue Sources Grants From Other Local Units 72, , , ,000 75, , % General Government % Physical Environment Charges 90,827,677 95,727, ,512, ,512,200 97,991, ,113, % Other Charges For Services 6, , , , % Interest Earnings 19,402 4, , ,000 (17,639) 120, % Rents And Royalties 13,244 13,248 15,000 15,000 12,000 10,000 (33.33%) Sale Of Fixed Assets 90, ,509 60,000 60,000 45,114 60, % Sale Of Surplus Material 66,979 76,701 50,000 50,000 78,000 50, % Misc Revenue (267,035) (98,450) (250,000) (250,000) (311,611) (250,000) 0.00% Transfer From Water Cost Stabilization 2,994, ,784 1,500,000 1,500, ,500, % Department Summary Page 93
174 City of St. Petersburg FY2013 Budget Appropriations By Fund/Program Water Resources 5,782,416 3,218, ,335 1,600,313 4,712,601 3,823, % Utility Tax Revenue % General Fund 1,347 20, % Stormwater Utility Operating 0 1, % General Liabilities Claims % American Recovery & Reinvestment Act 2, % Total Revenue 99,610,559 99,605, ,073, ,687, ,736, ,726, % Position Summary Administrative Support Services % Potable & Reclaimed Water Distribution Systems % Wastewater Collection System % Wastewater Treatment & Reclamation (2.35%) Water Treatment & Distribution % Total Full-Time FTE (0.31%) Administrative Support Services % Total Part-Time FTE % Total FTE (0.31%) Notes - Overall expenses are projected to increase by 4.51% from the FY12 Budget mainly due to an increase in Debt Service ($2,314,677). Several offsetting factors also contribute to this increase. - Two full-time Belt Press Operator positions ($108,676) and one full-time Support Service Manager position ($106,187) will be eliminated and a full-time Management Methods Senior Analyst ($102,613) will be added in FY13. - In FY13, there are also numerous line item reductions totaling $103,616. These reductions are offset by increases in the transfer to the Water Resources Debt Fund ($854,830), estimated costs from Tampa Bay Water ($98,000), injection well mechanical integrity testing ($175,000), Facilities Maintenance and Repair ($91,500), bioset and sludge hauling ($428,000), Fuel External ($60,212), Small Tools and Equipment ($61,466), and various other line items ($161,274). - In FY13, the department will pay for fire hydrant testing services currently performed by the Fire Department ($100,000) and construction debris recycling and disposal expenses currently in the Stormwater, Pavement, & Traffic Operations Department ($100,000). - Also in FY13, there will be an increase in the contribution to the Community Services Department from $50,000 to $70,000 to offset utility customer service support rendered by the three Public Service Representatives. - The department decreased its appropriations in capital outlay for equipment purchase and replacement by about $118,000 compared to FY12. - During FY12, a full-time Utilities Construction Coordinator position ($31,609) was added. Department Summary Page 94
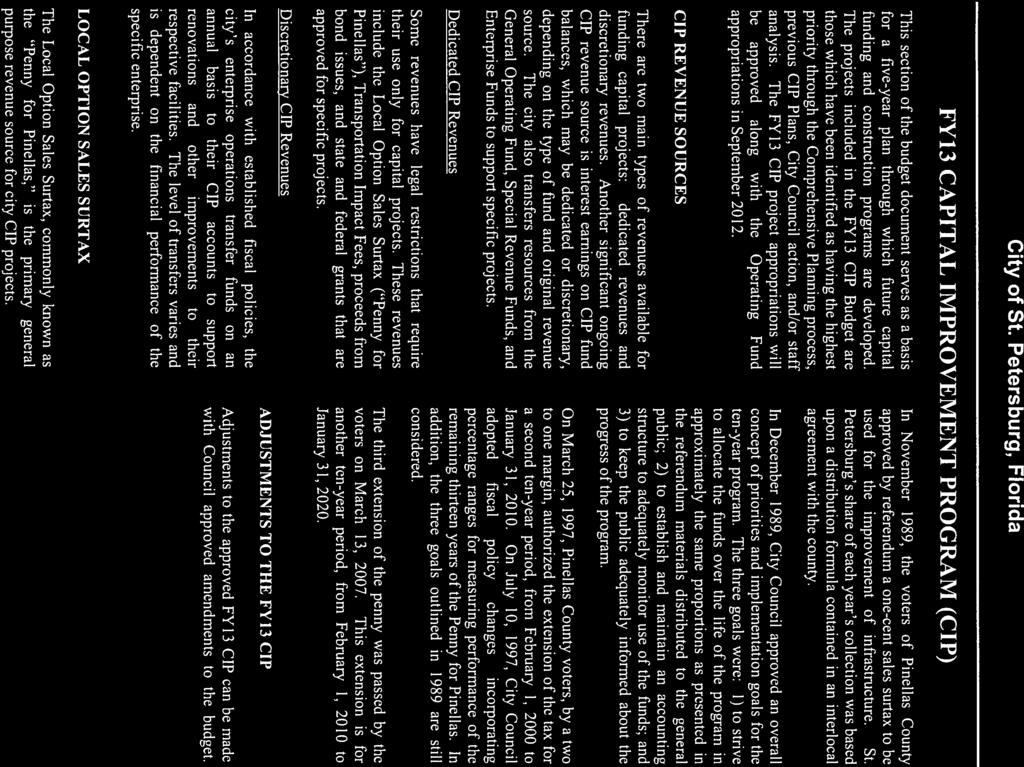
175
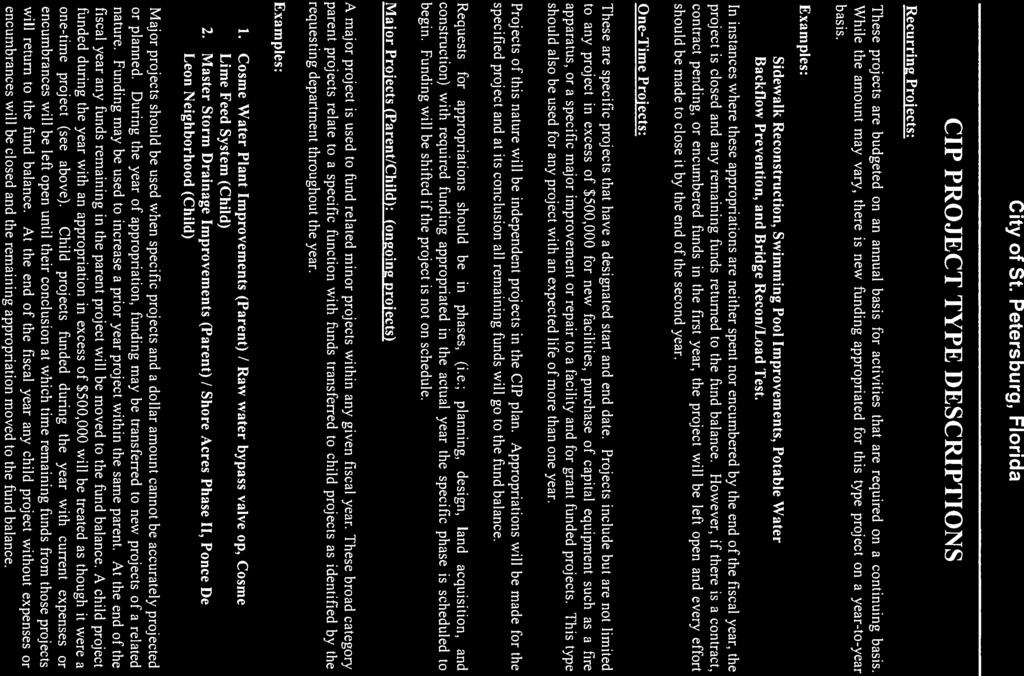
176
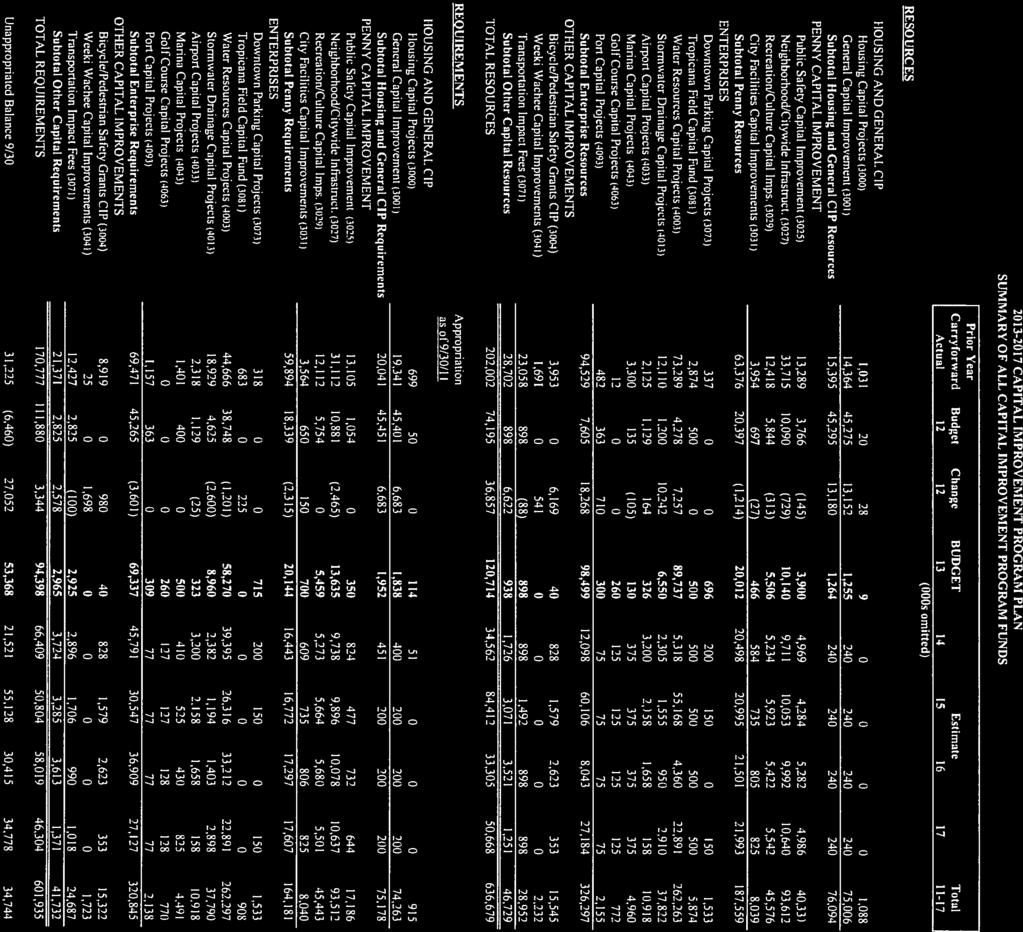
177
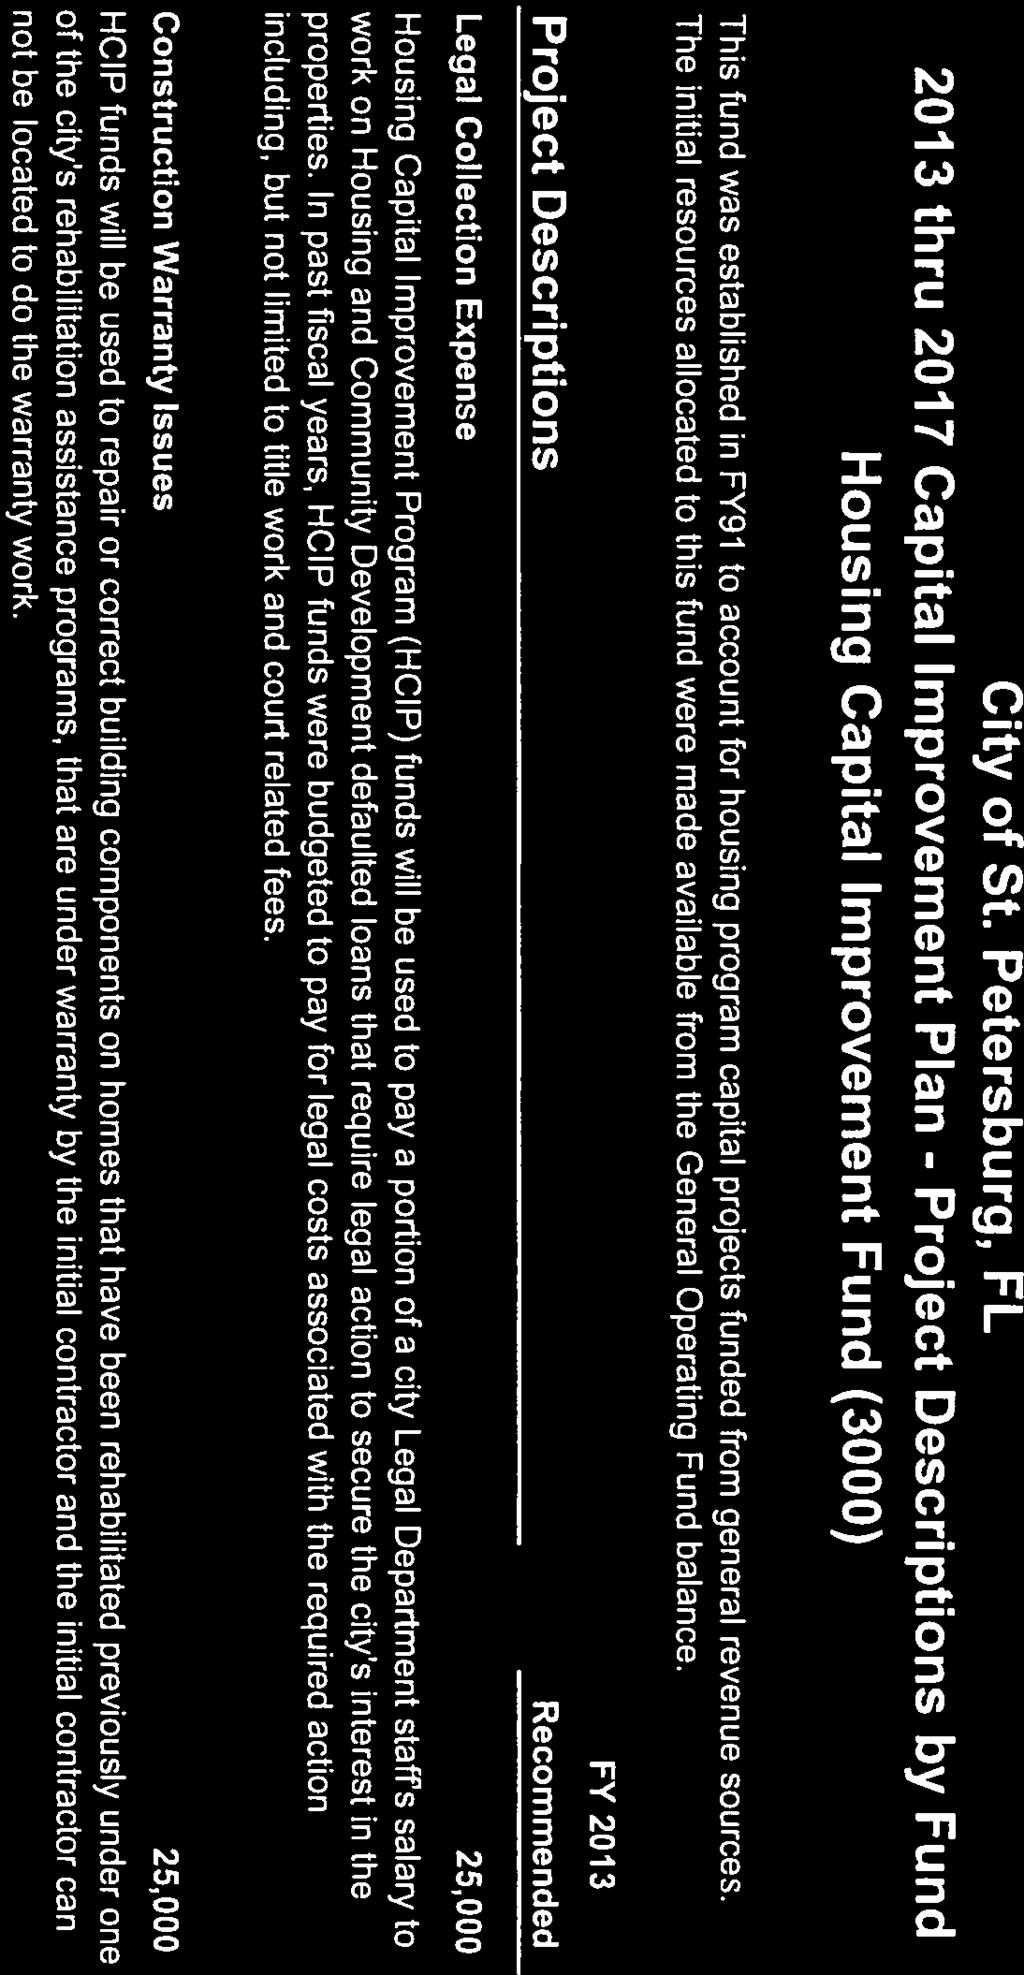
178
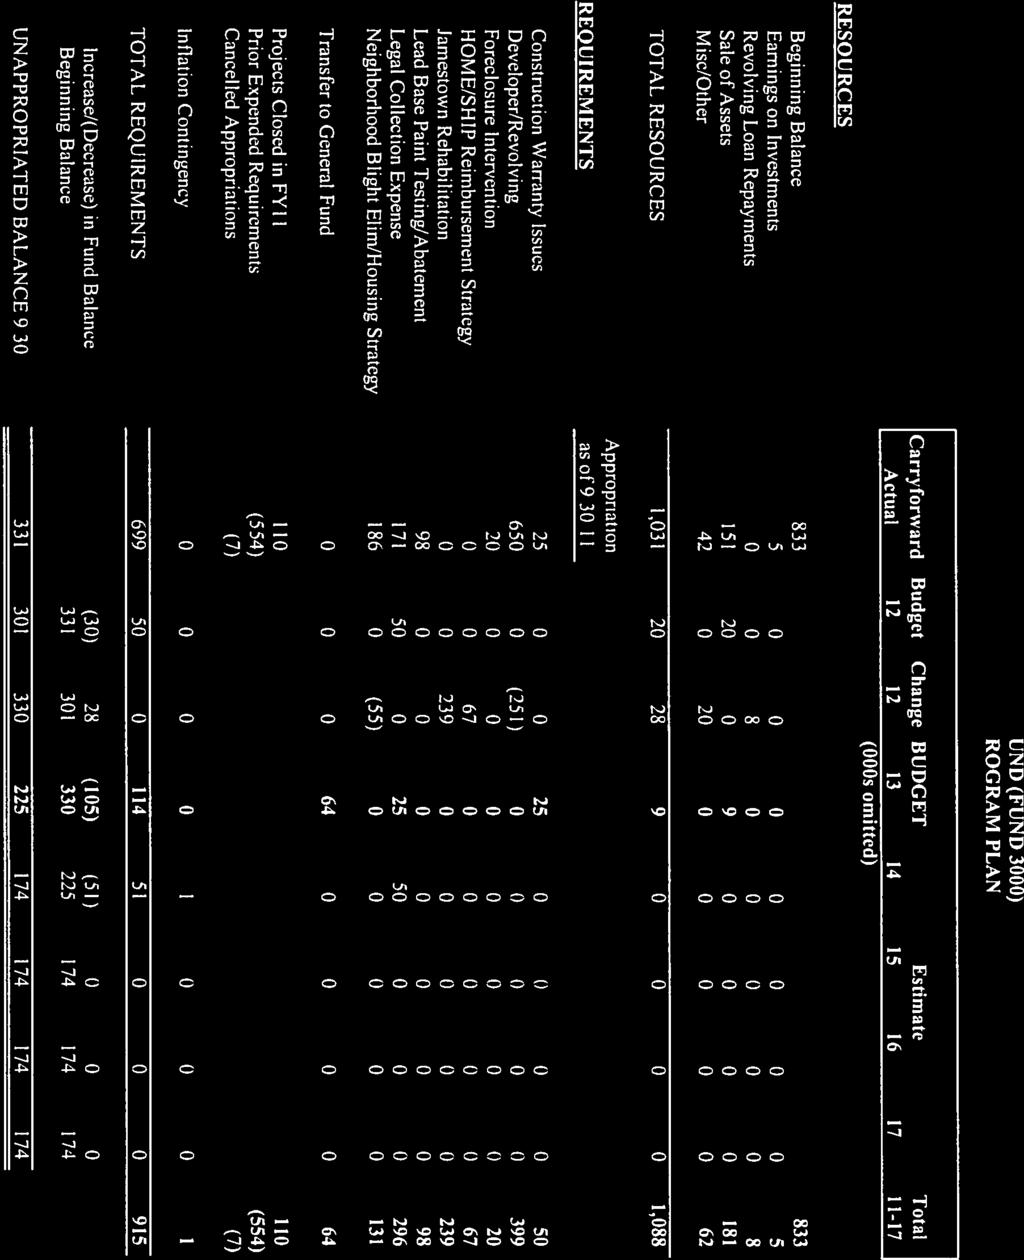

179
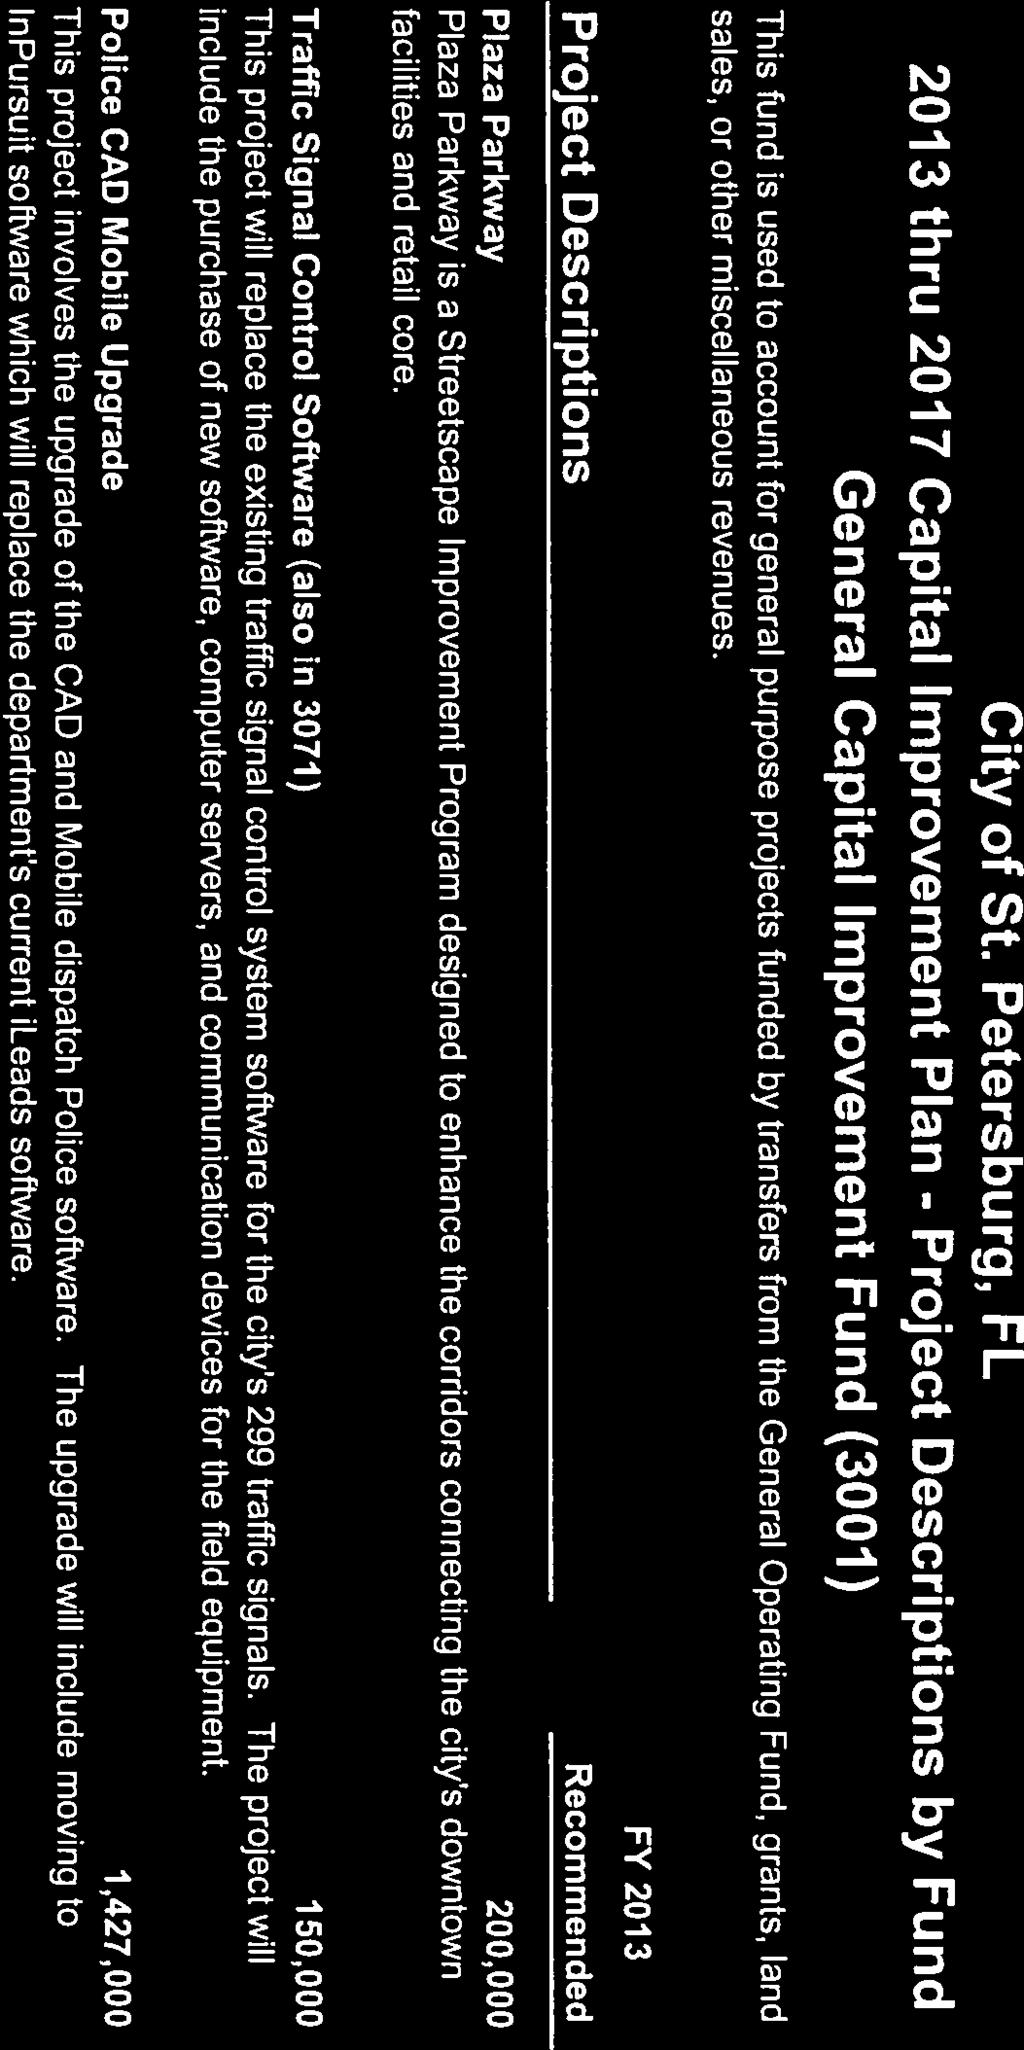
180
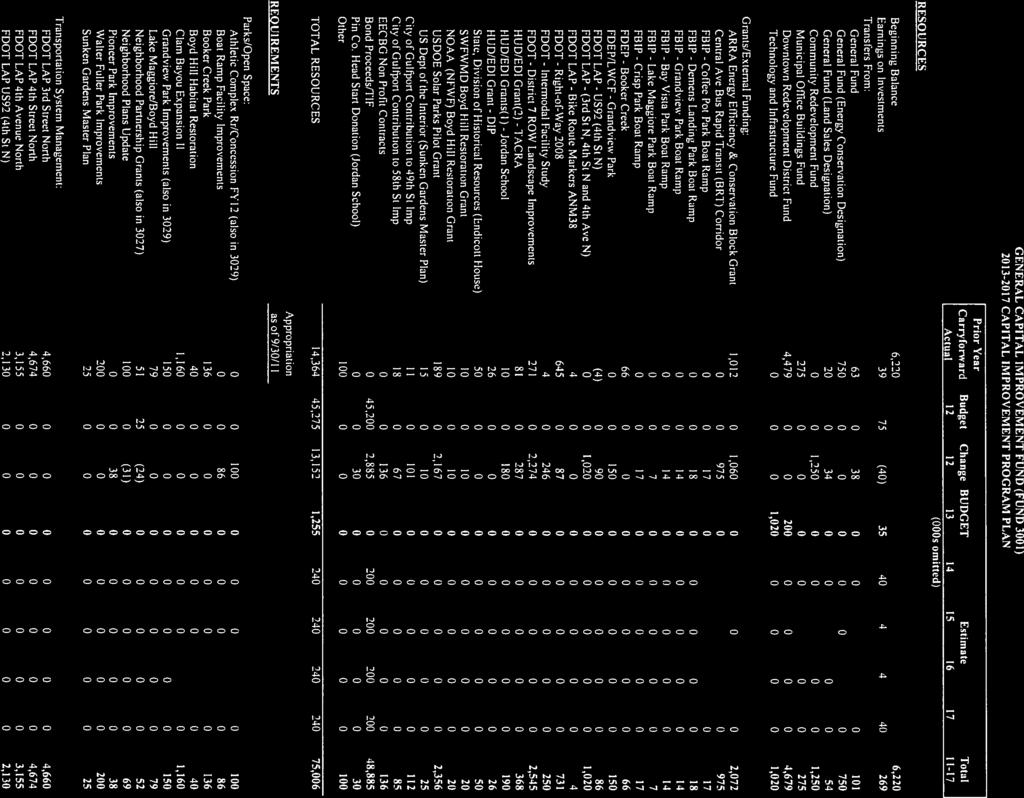
181
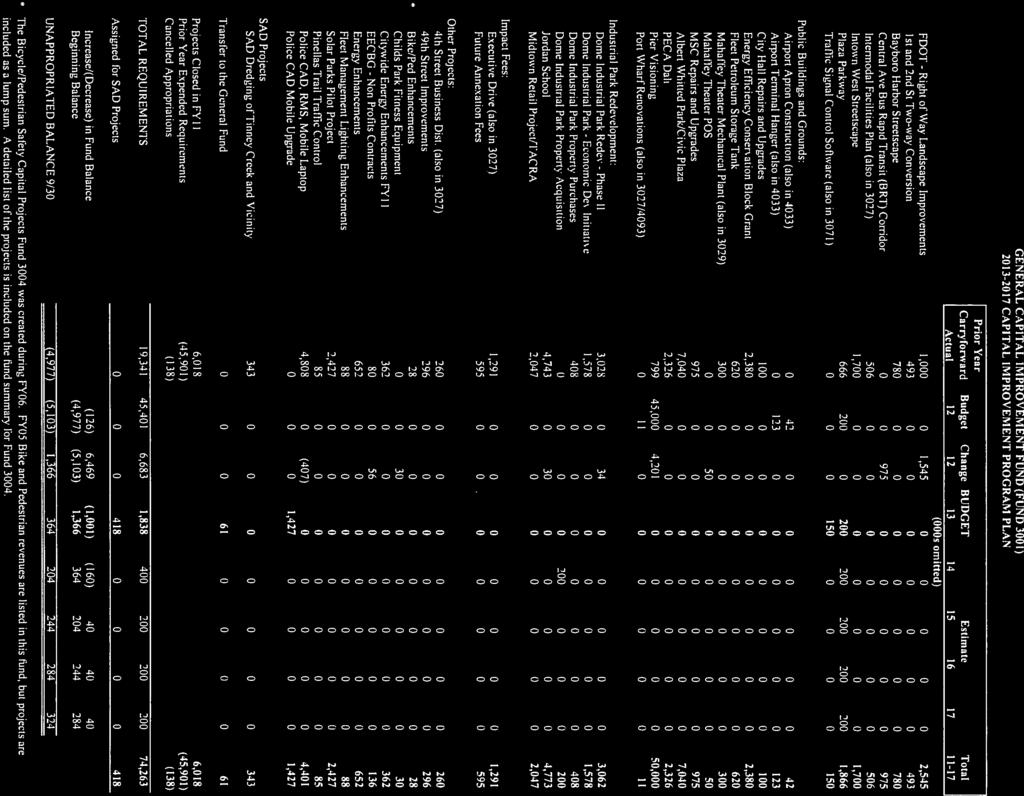
182
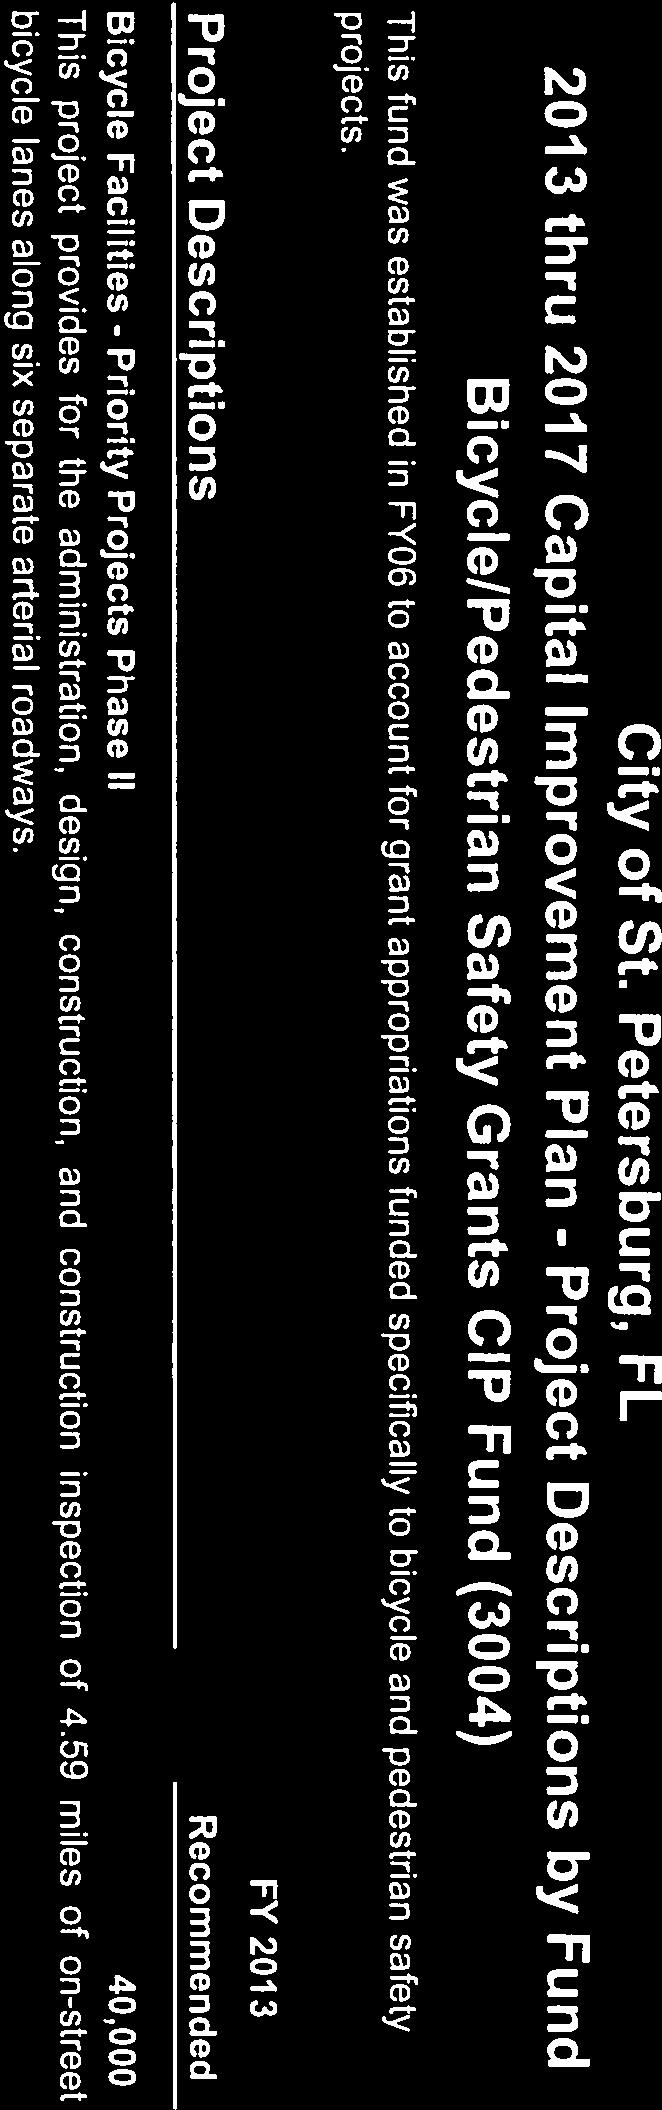
183
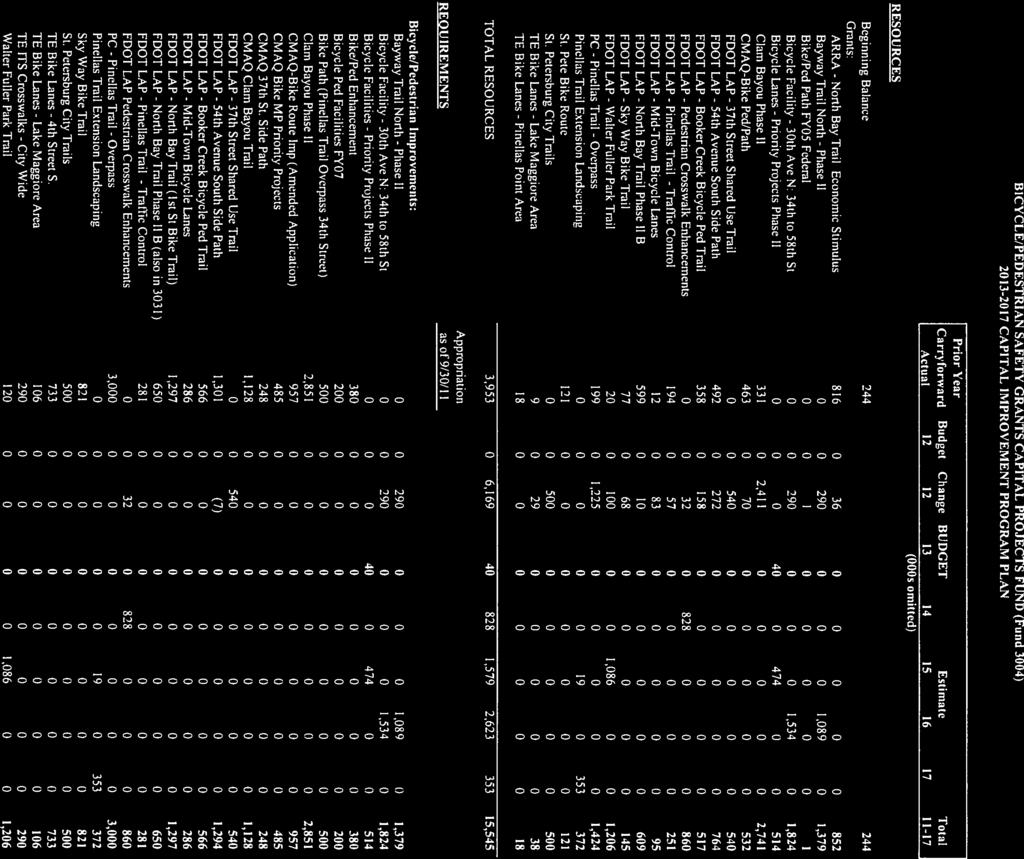
184
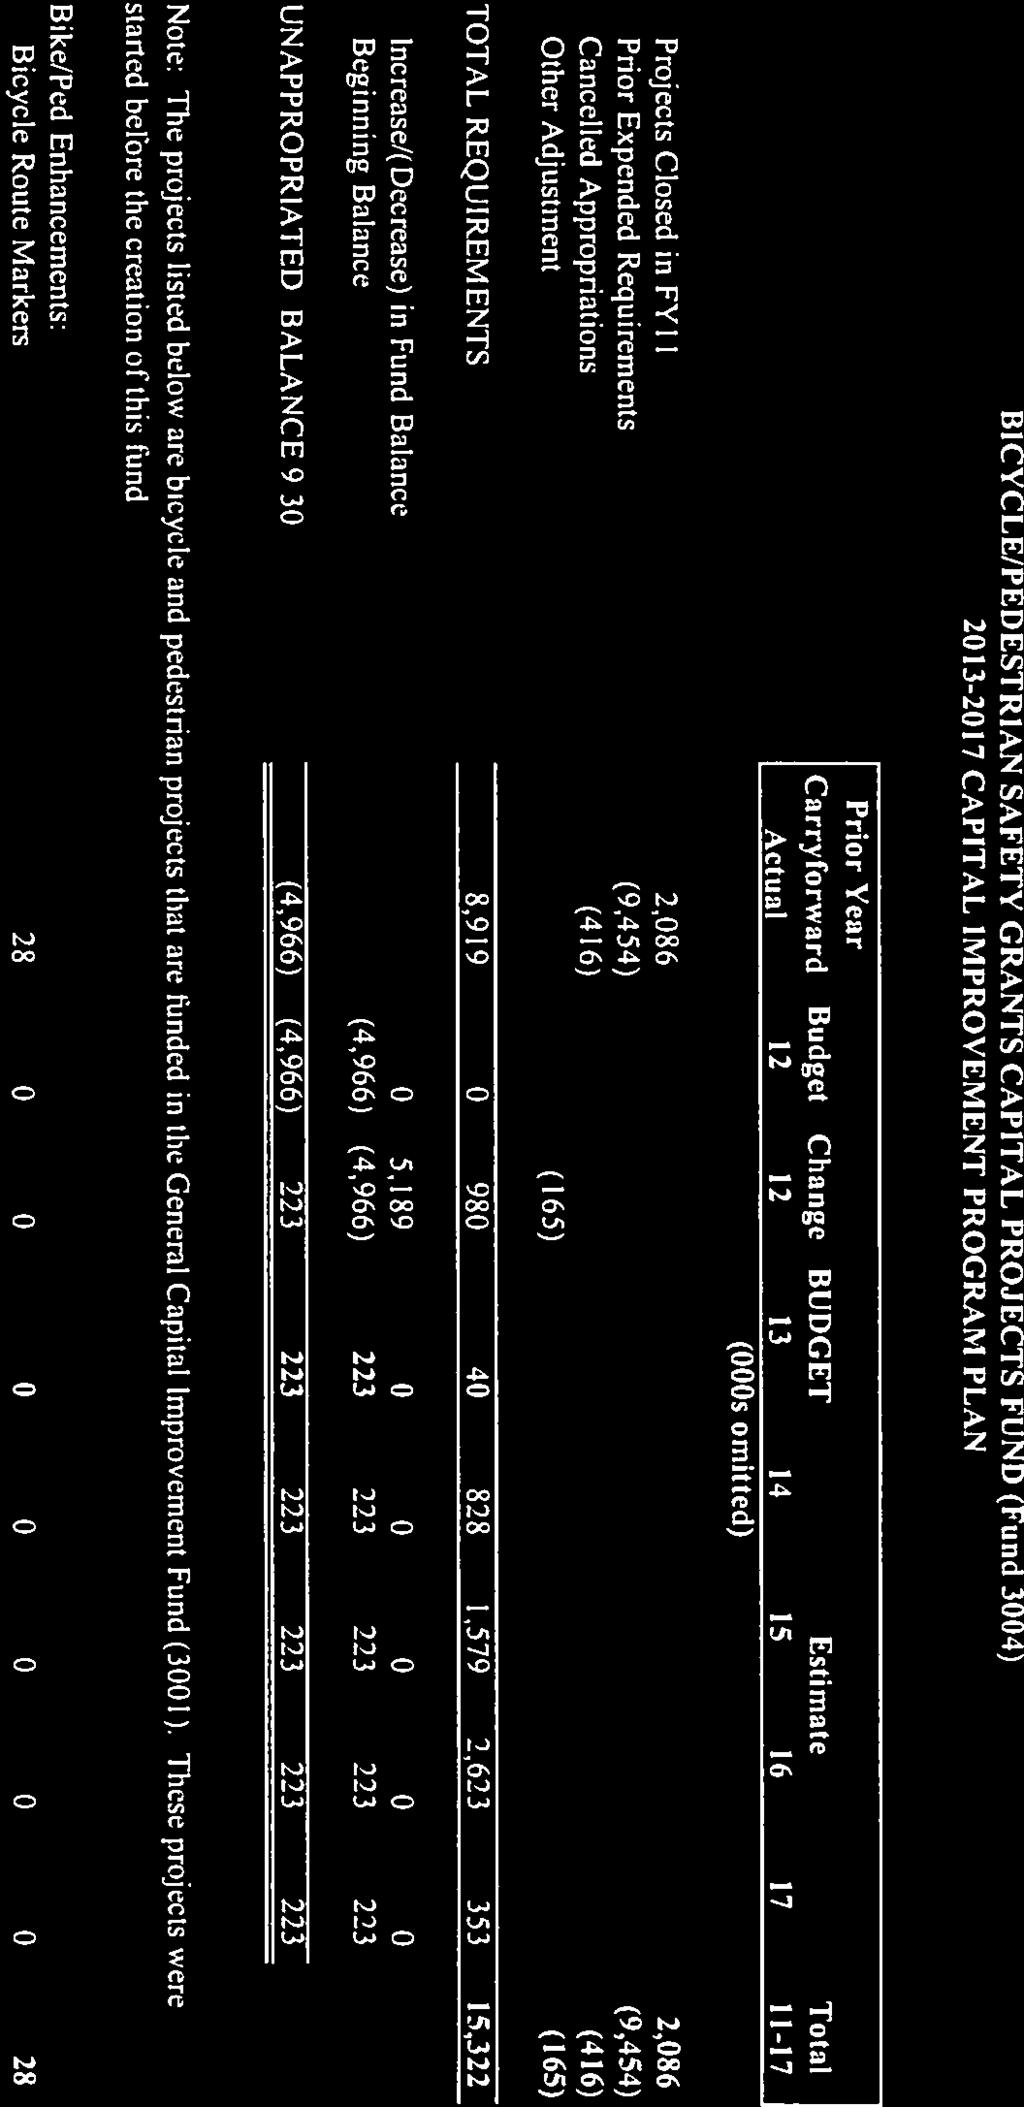
185

186
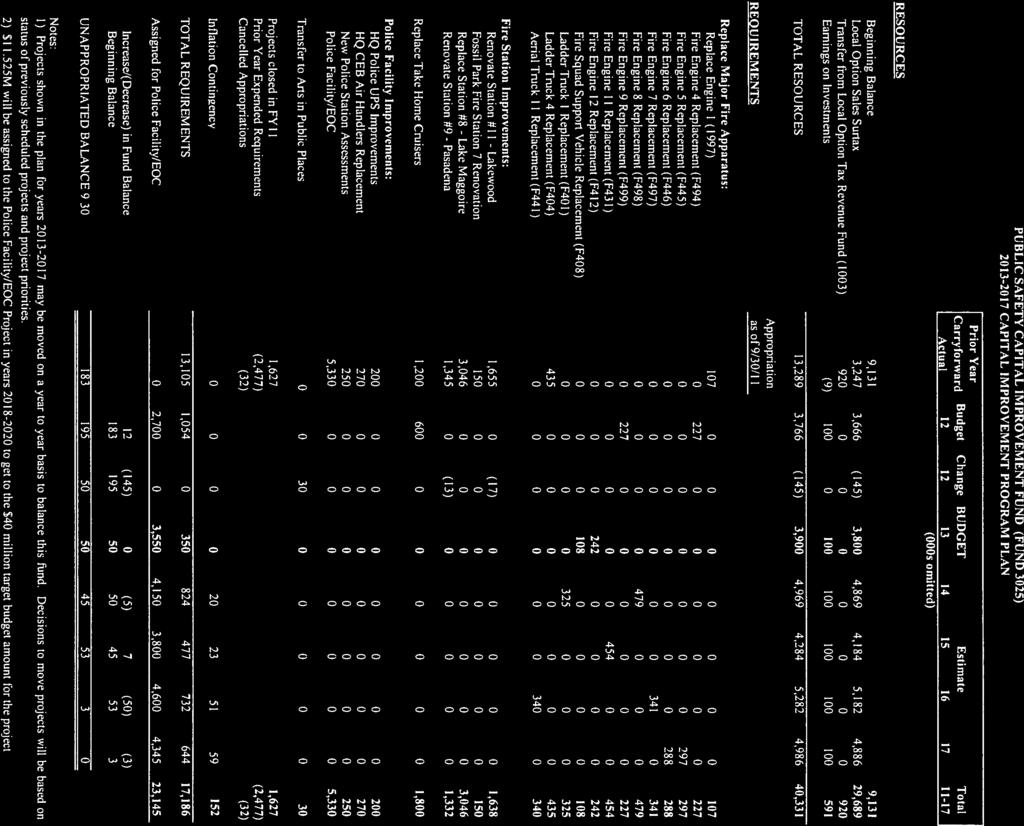
187
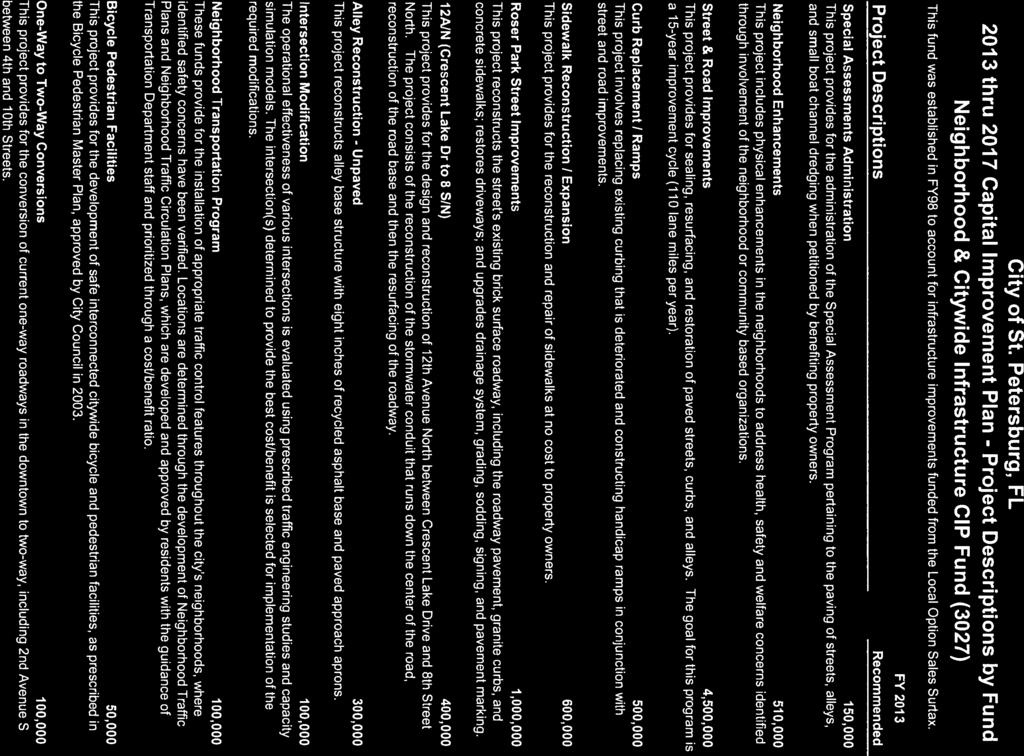
188
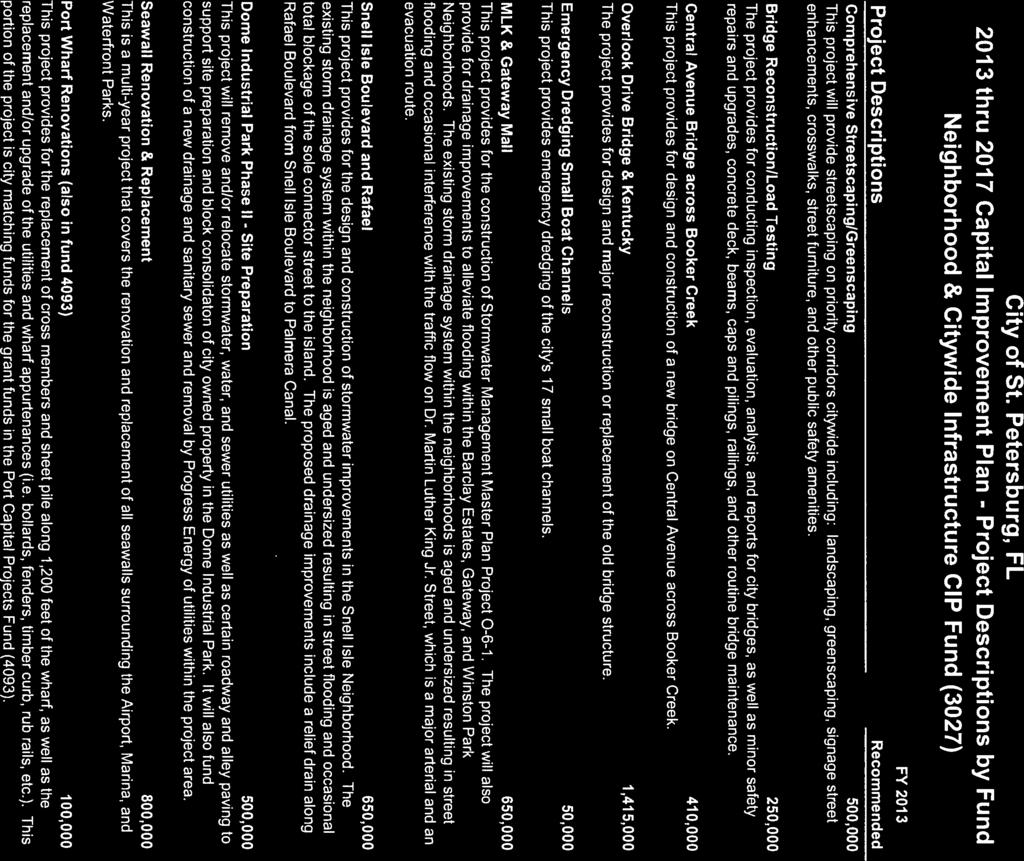
189
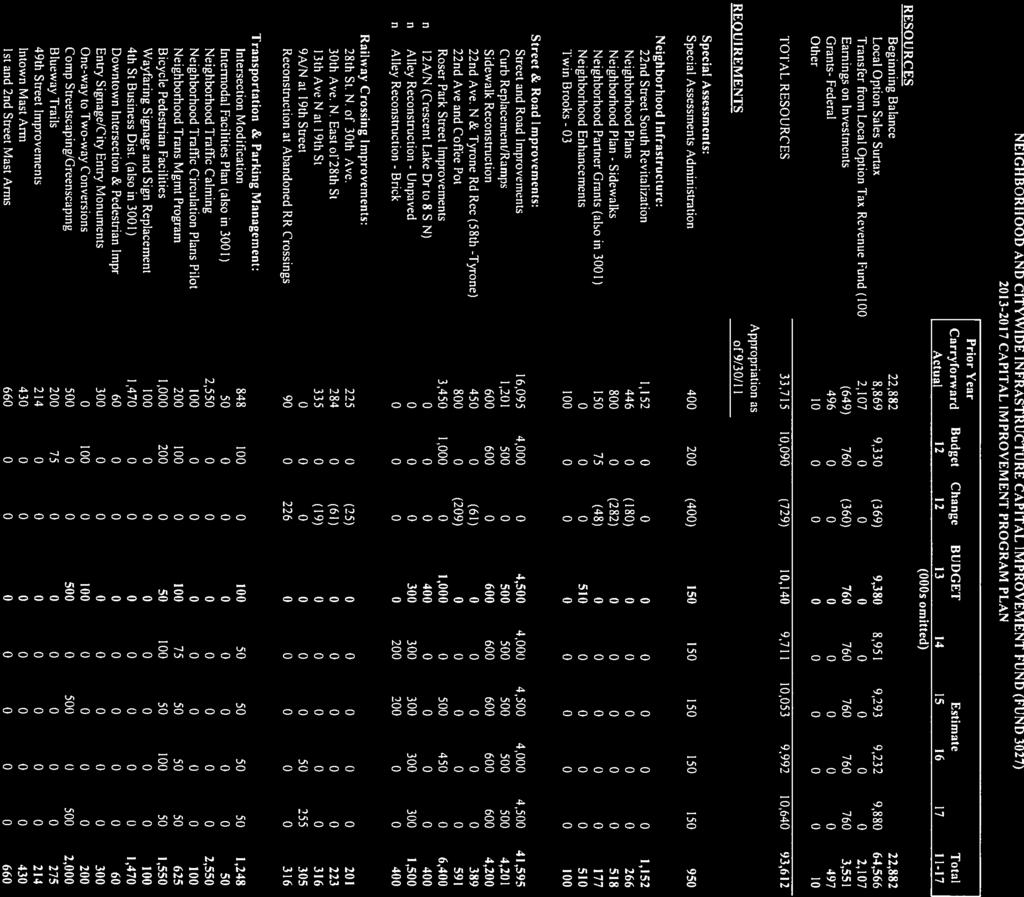
190
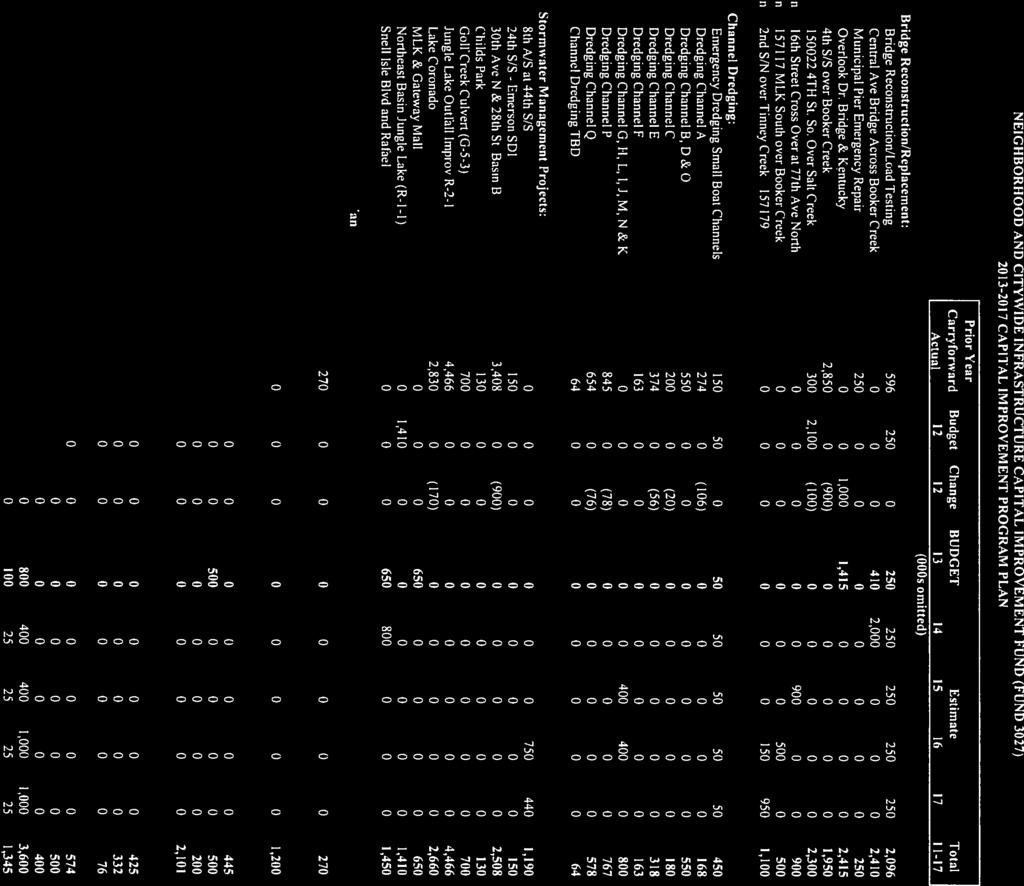
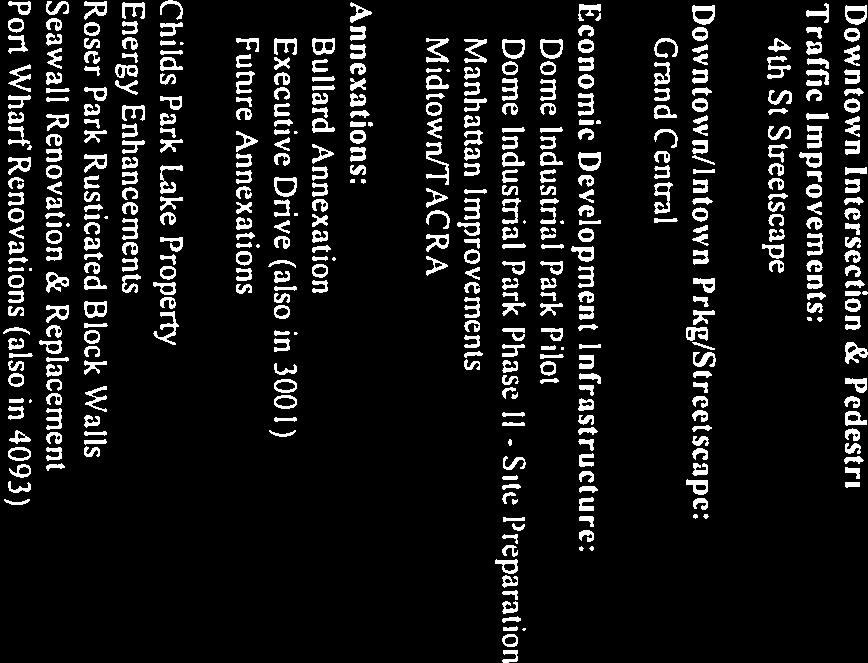
191
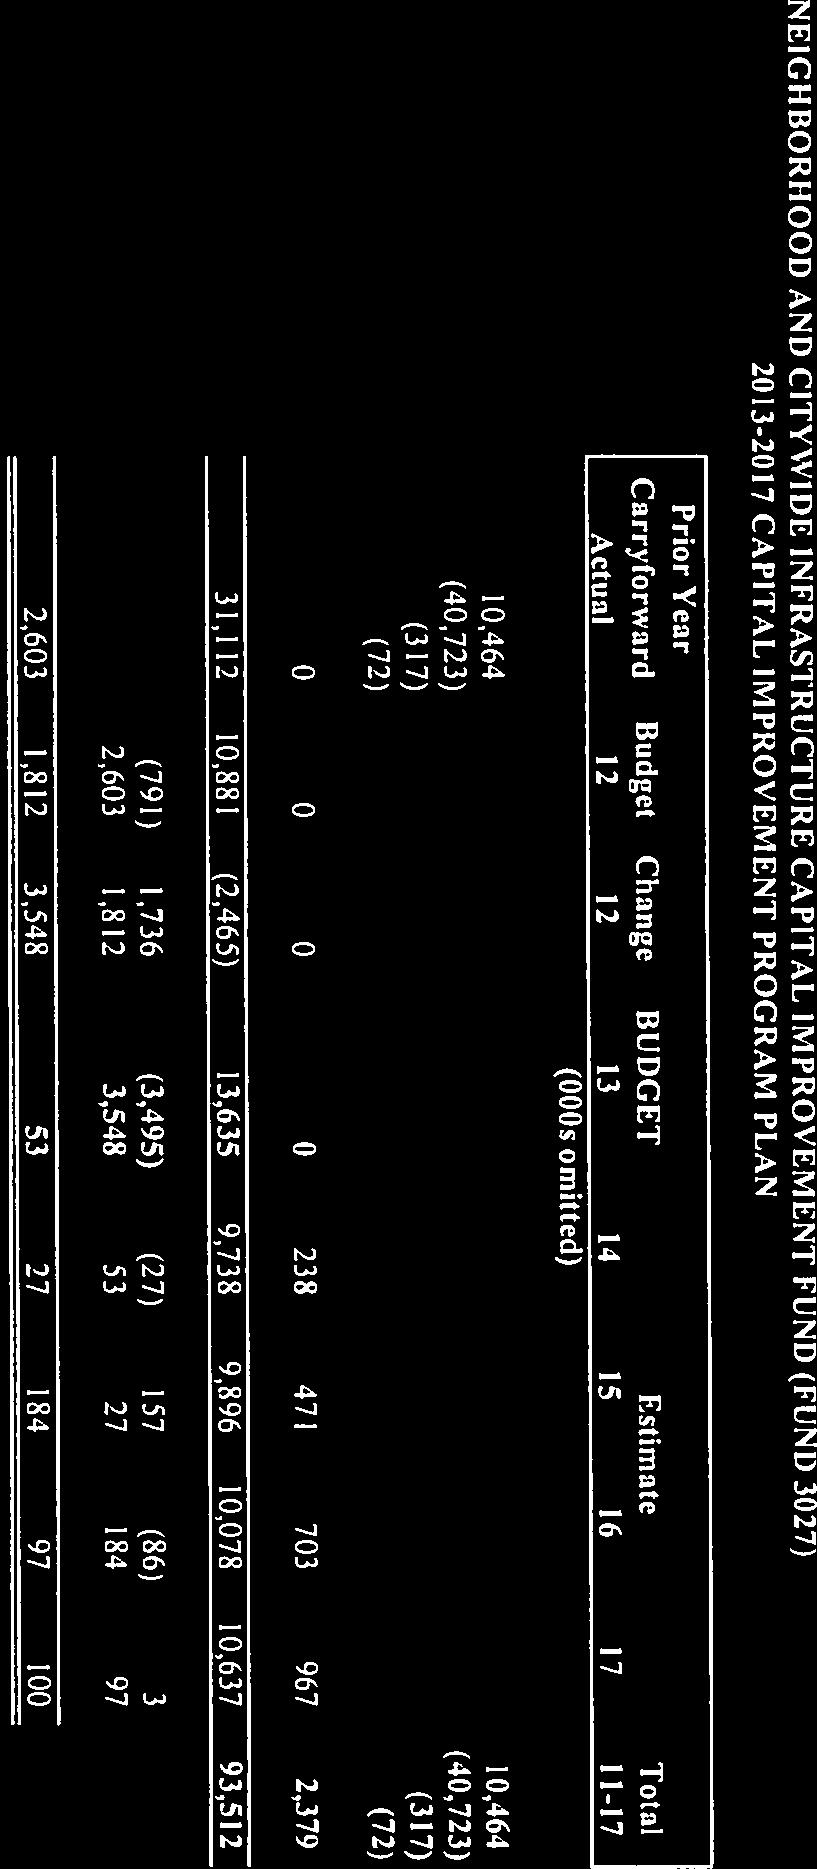
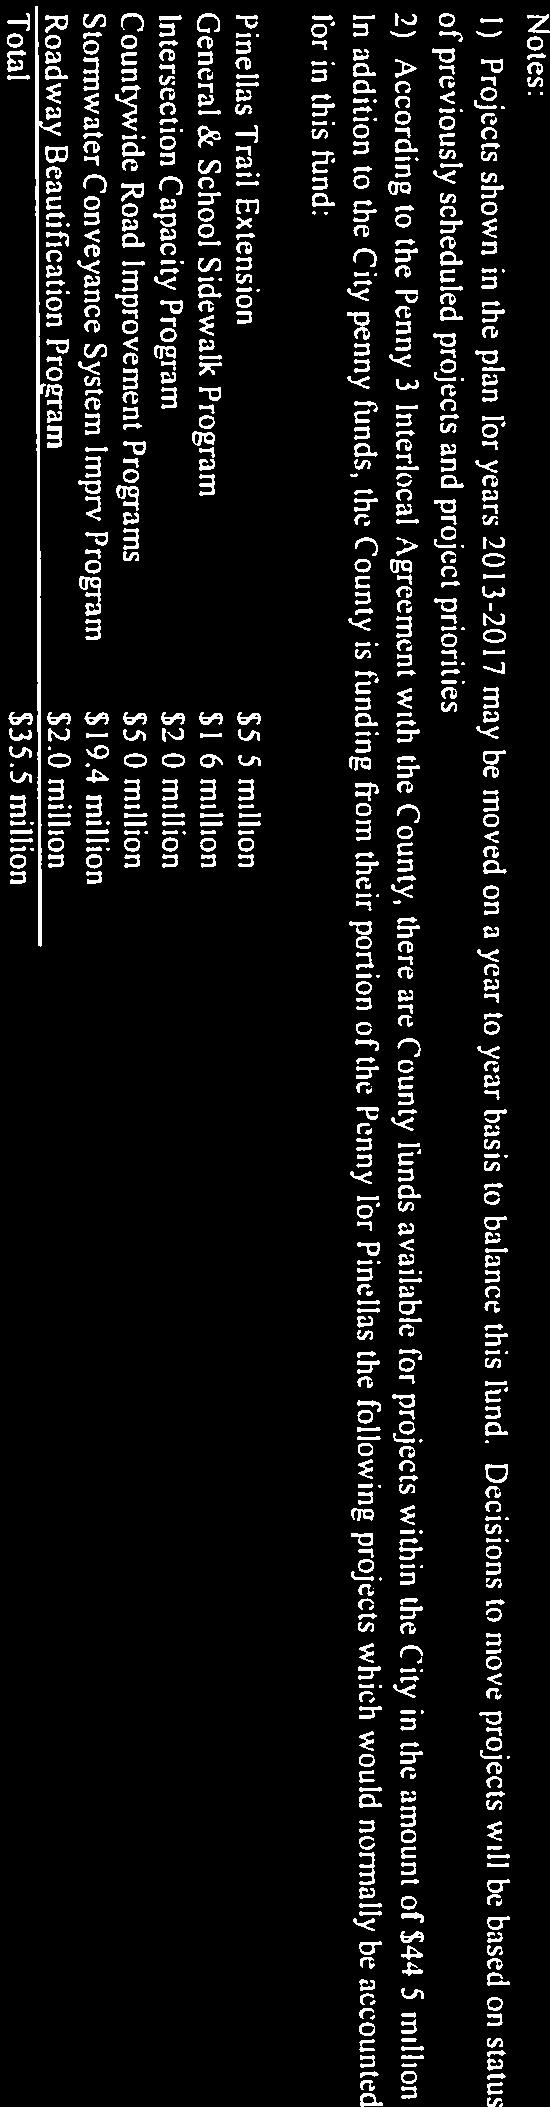
192
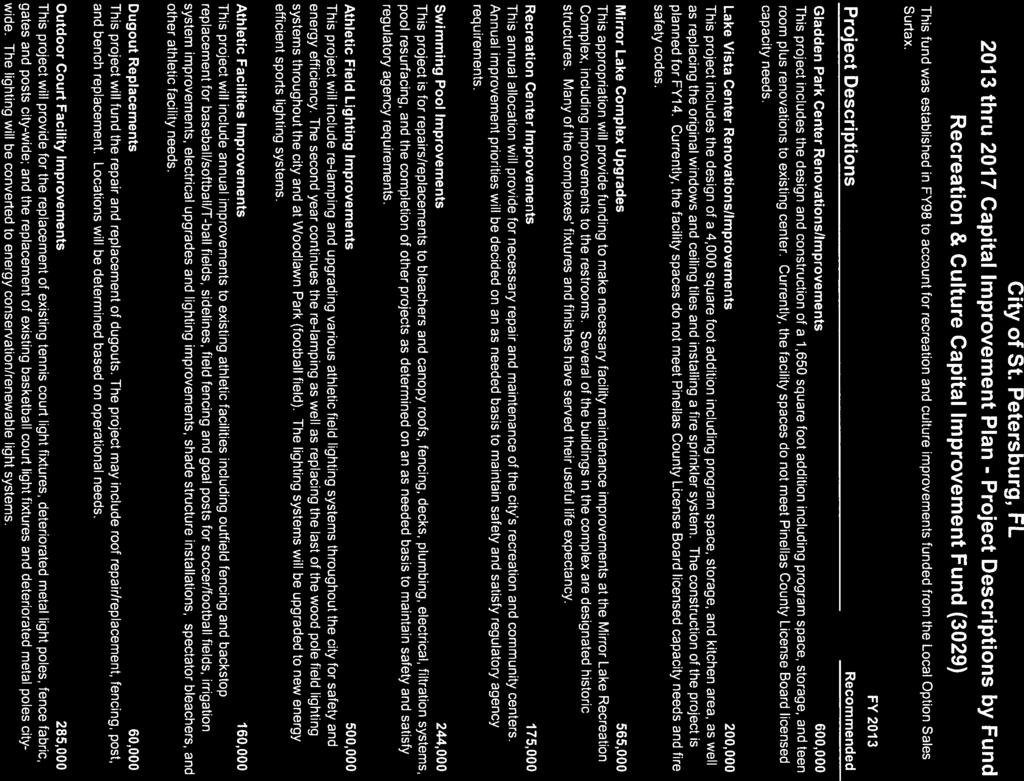
193
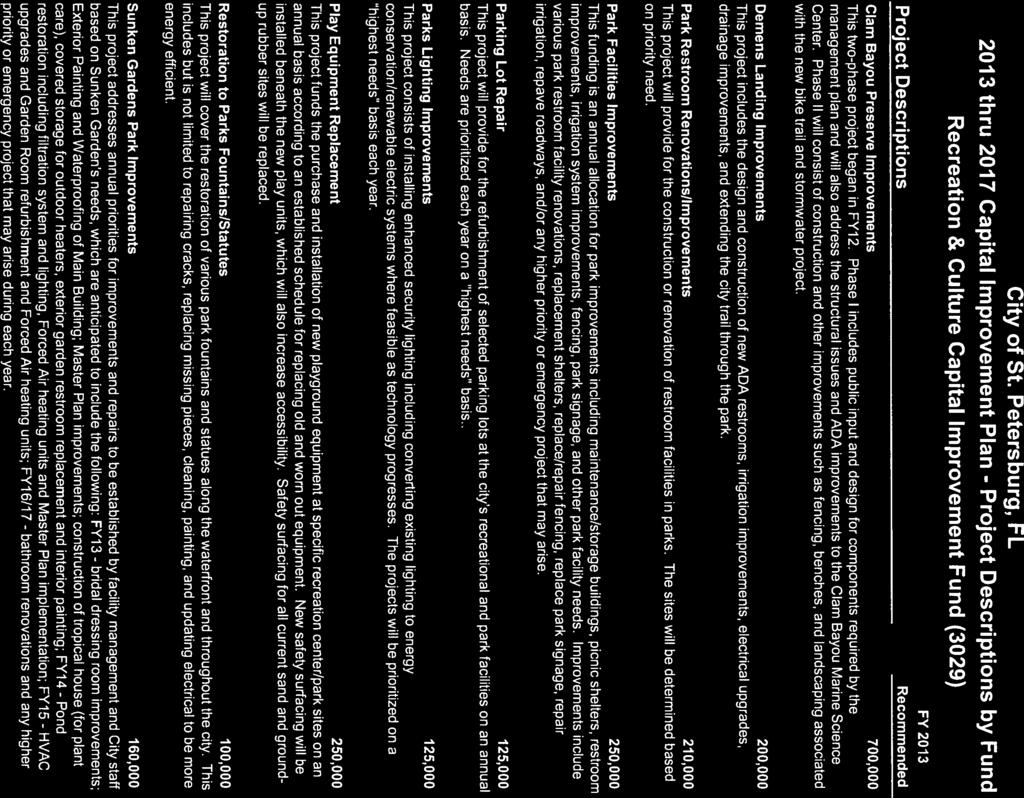
194
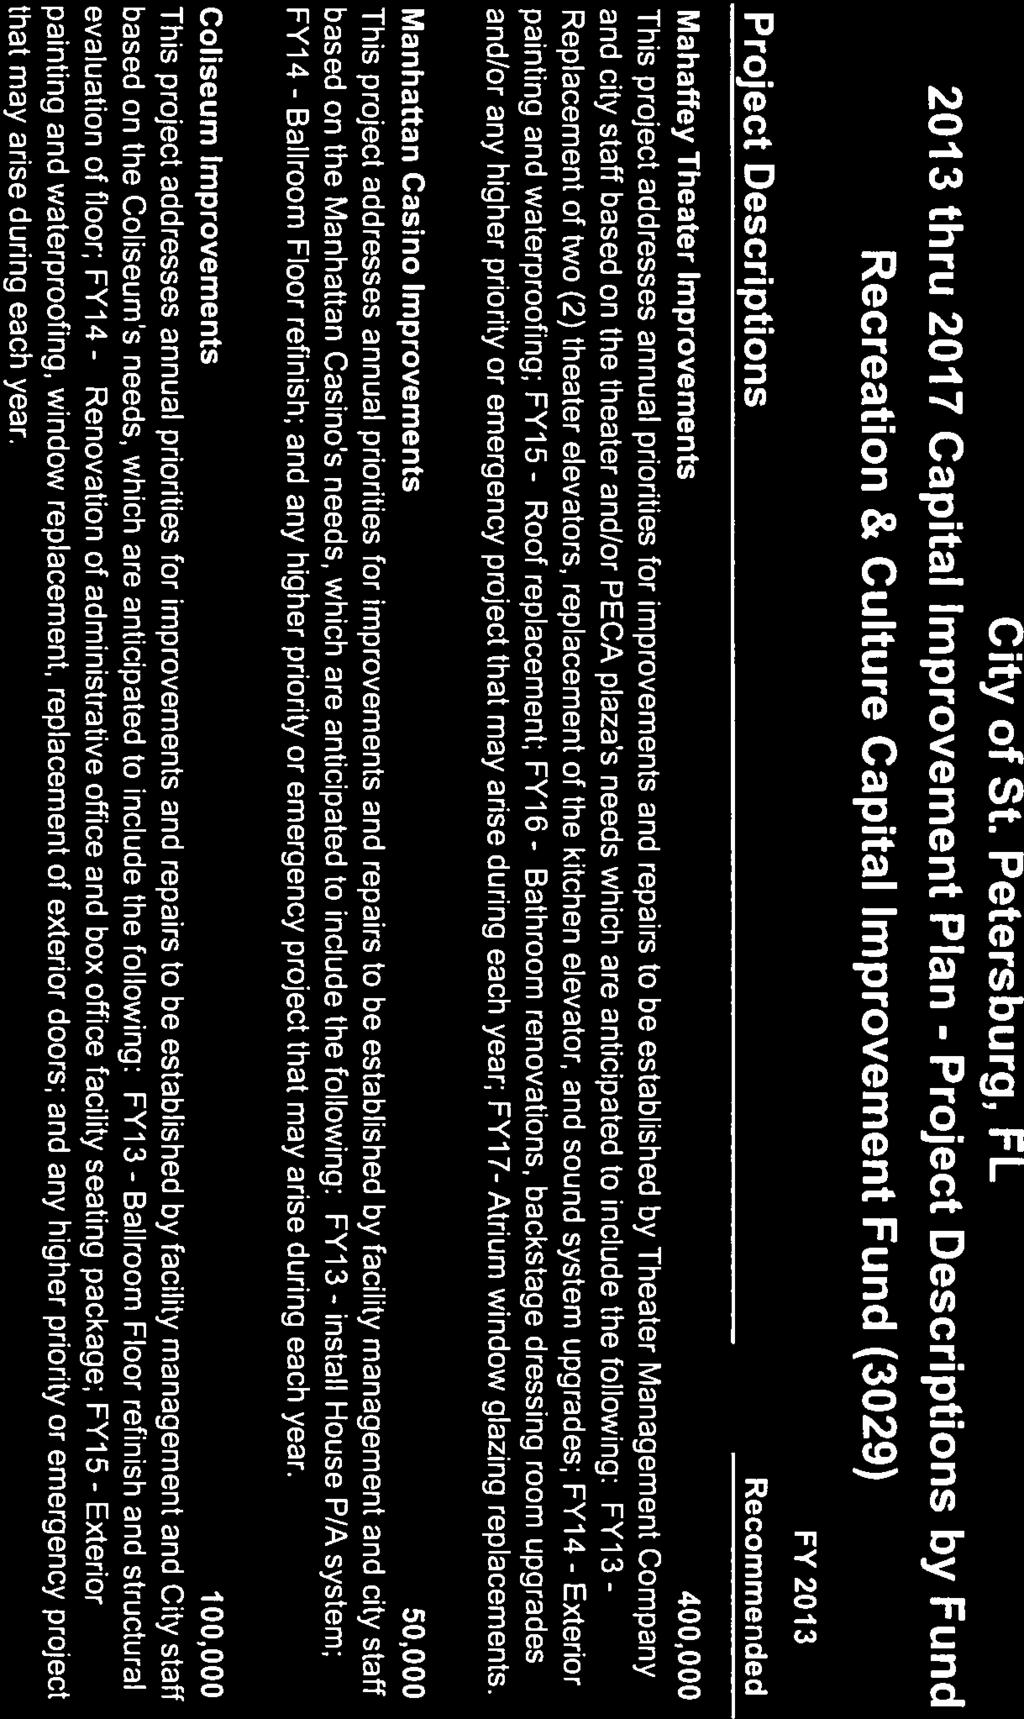
195
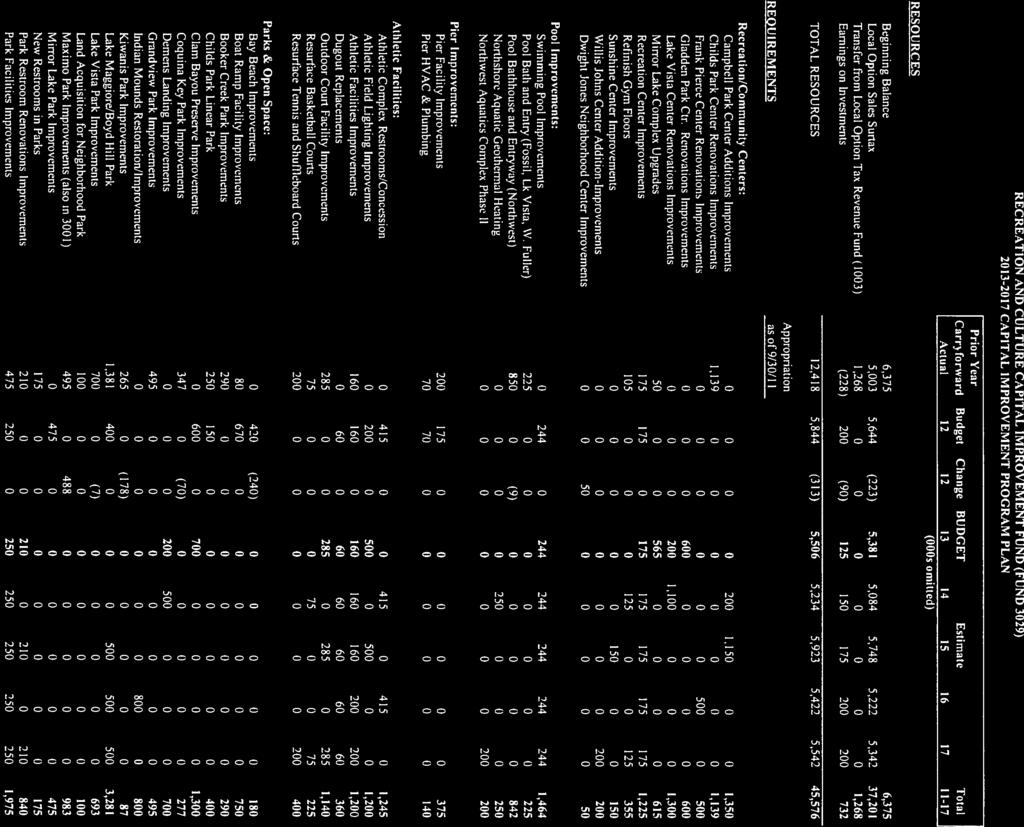
196
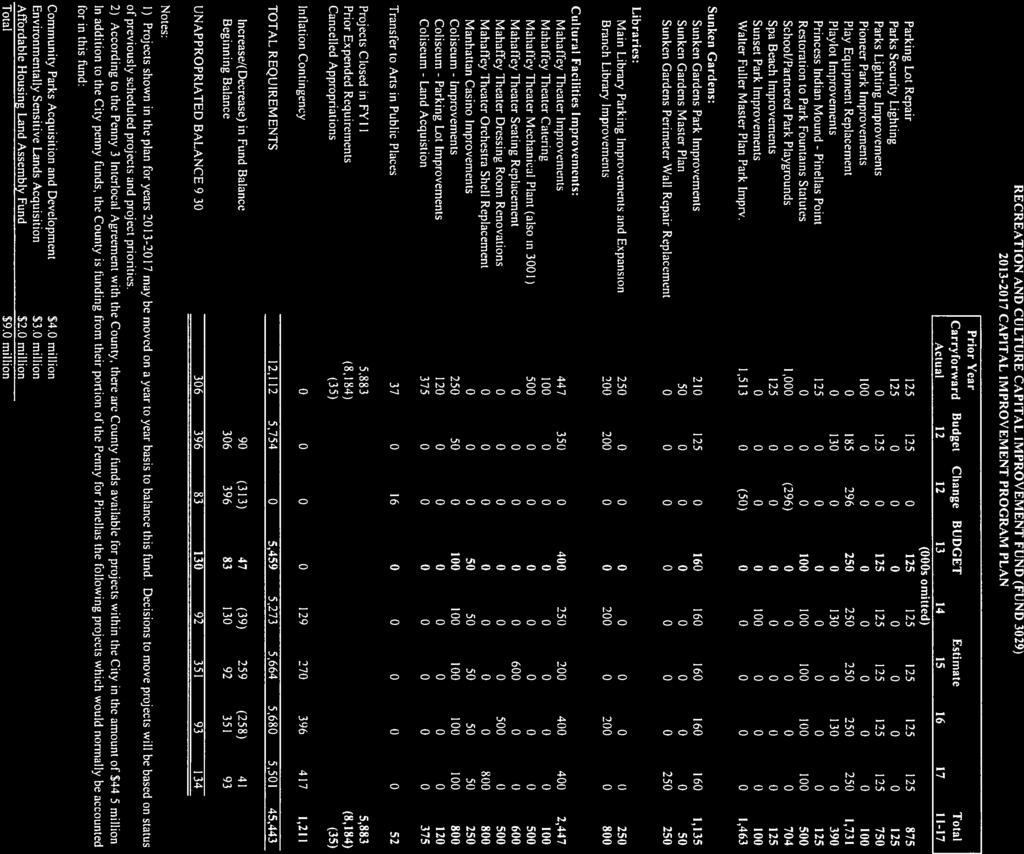
197
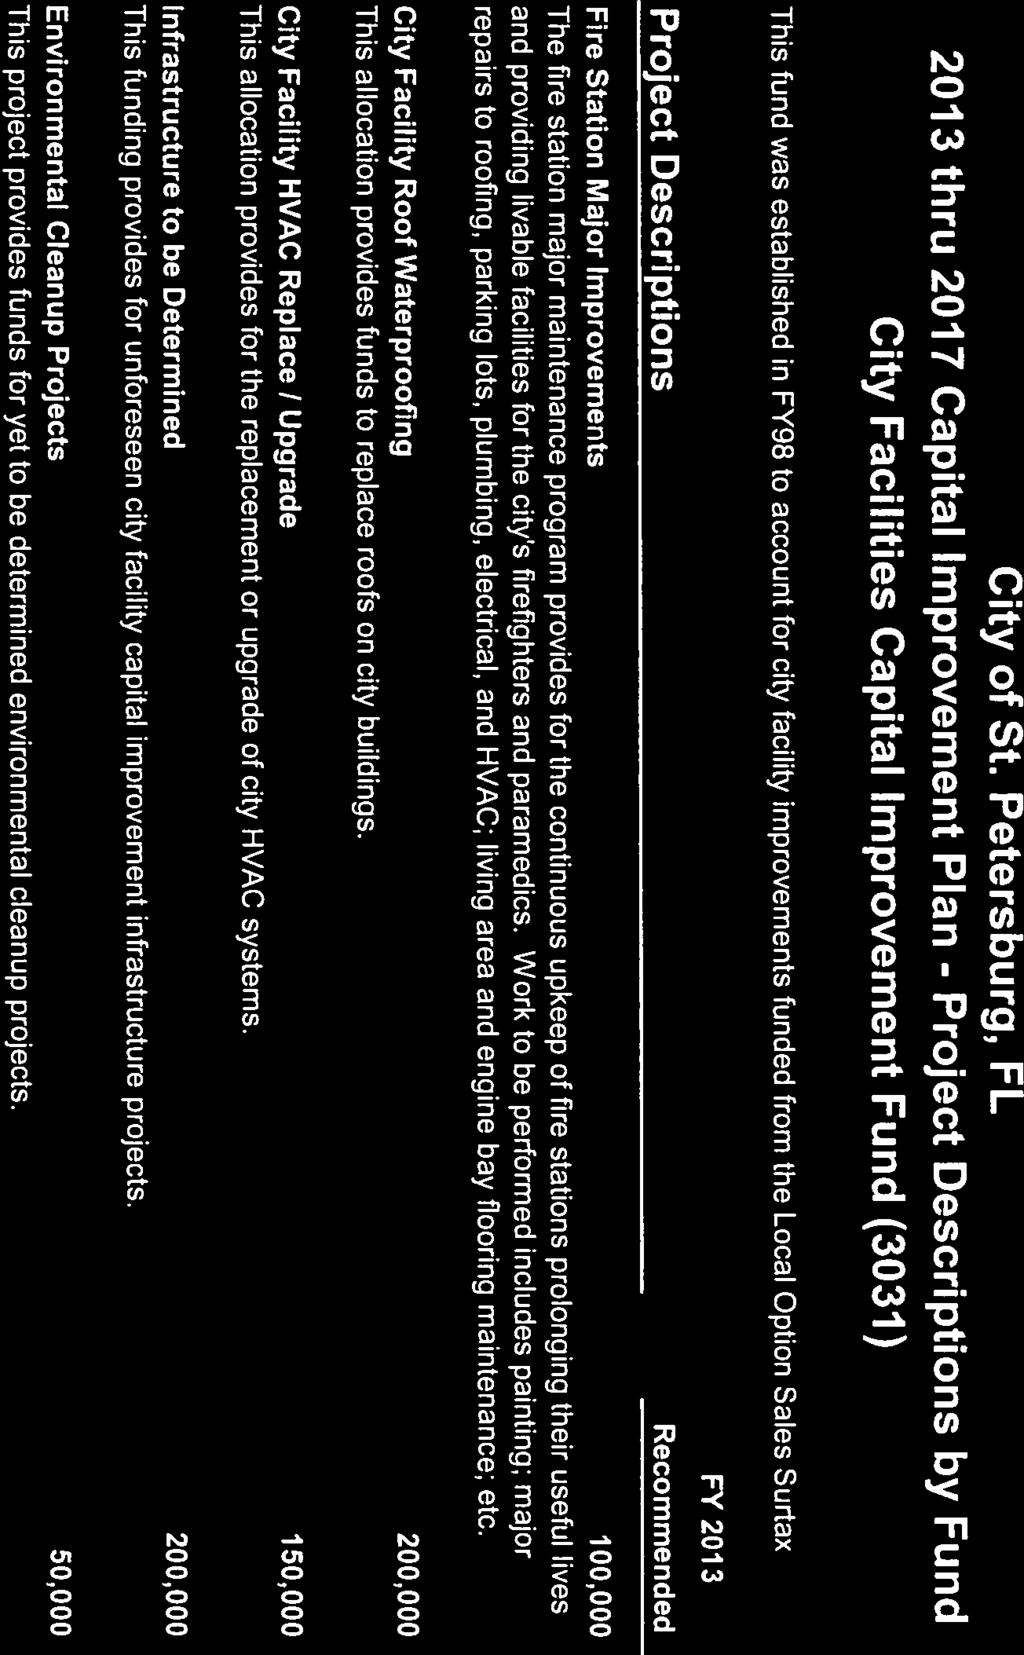
198
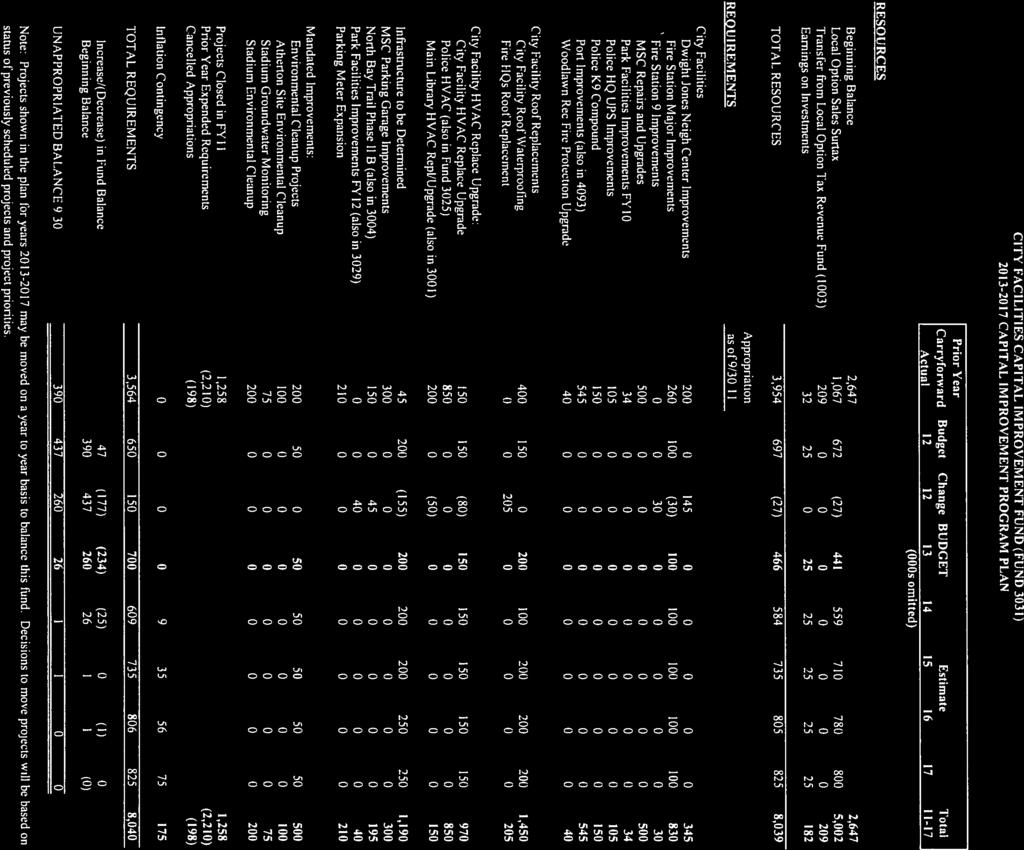
199
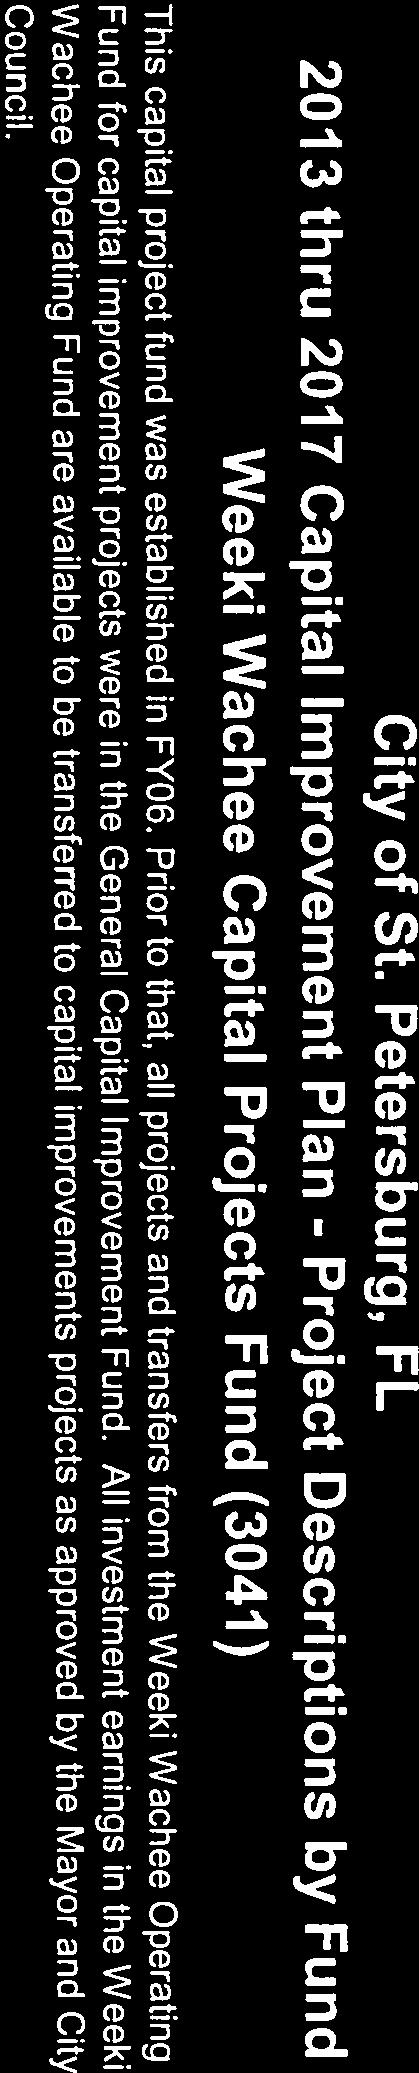
200
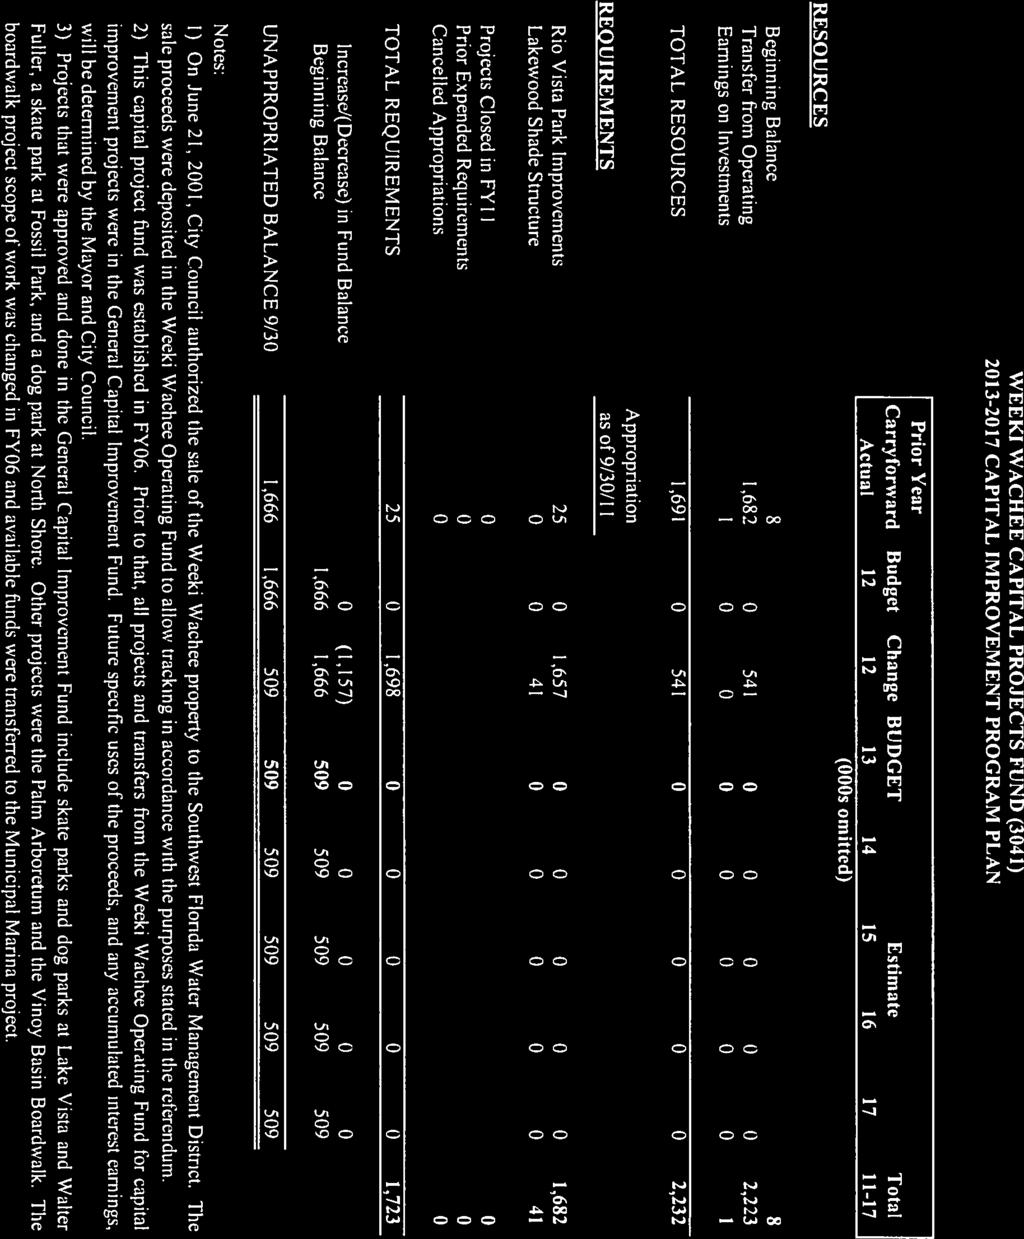
201
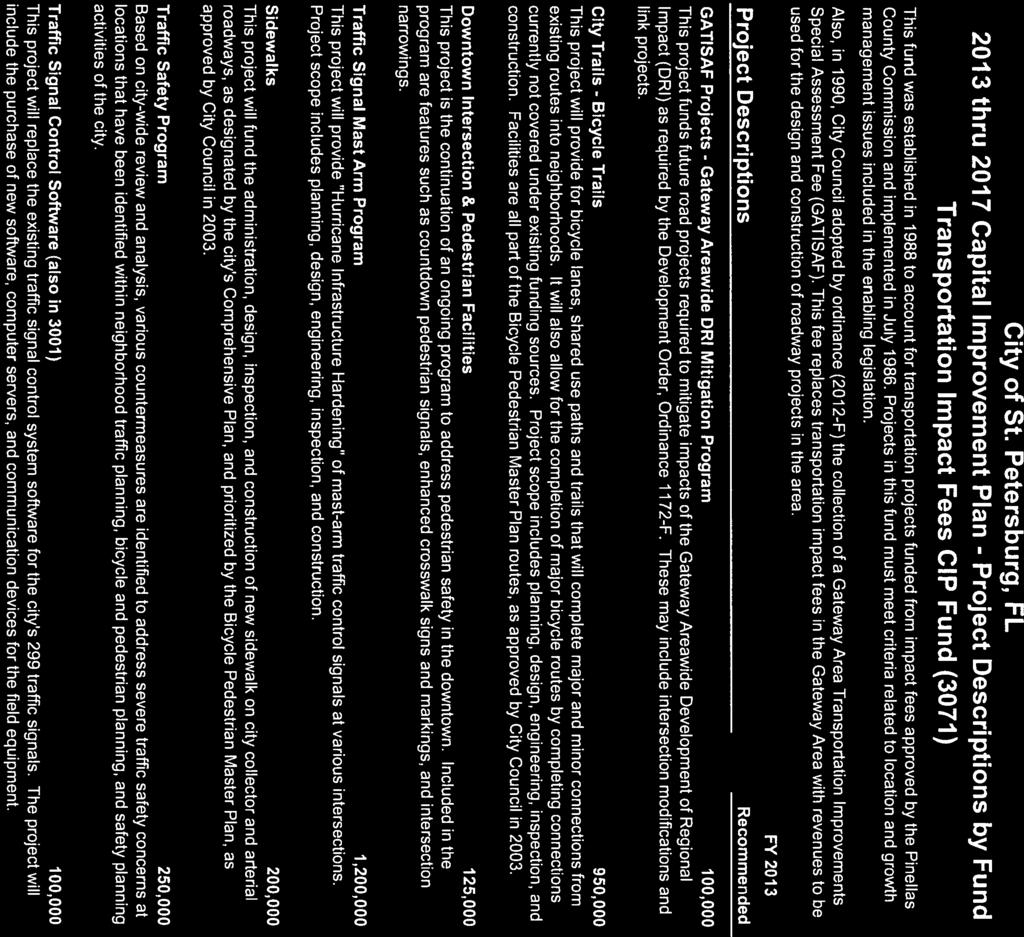
202

203
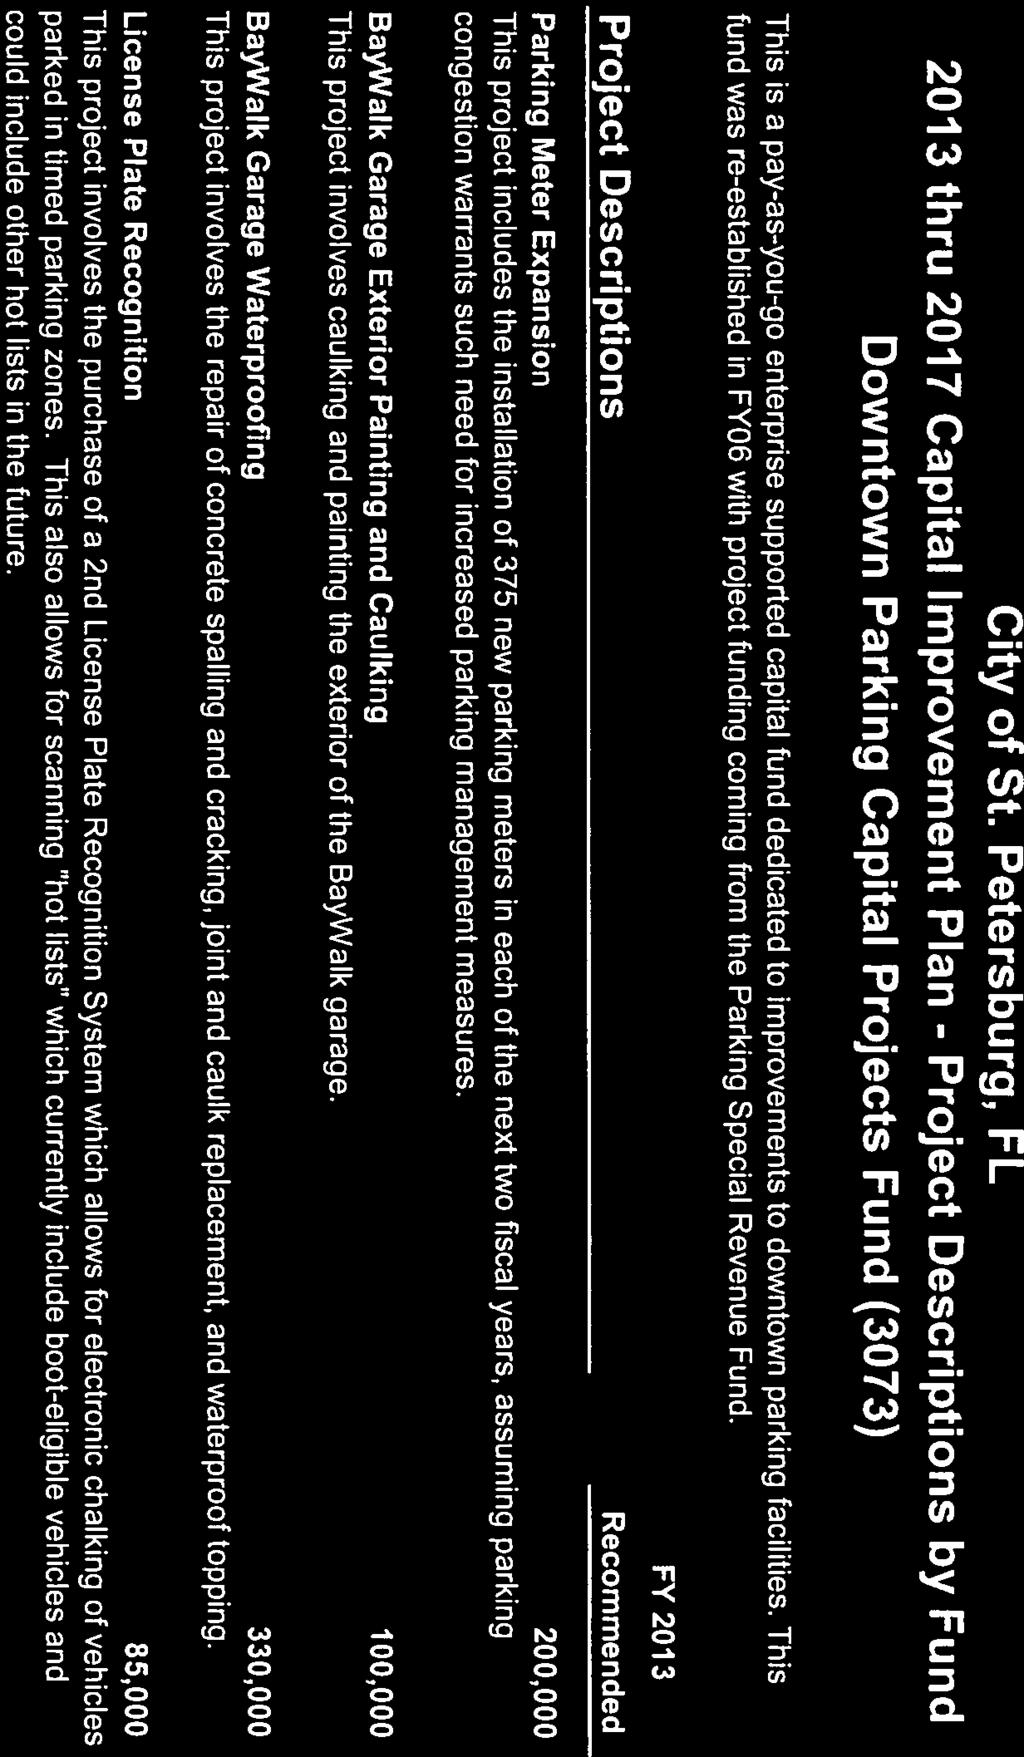
204
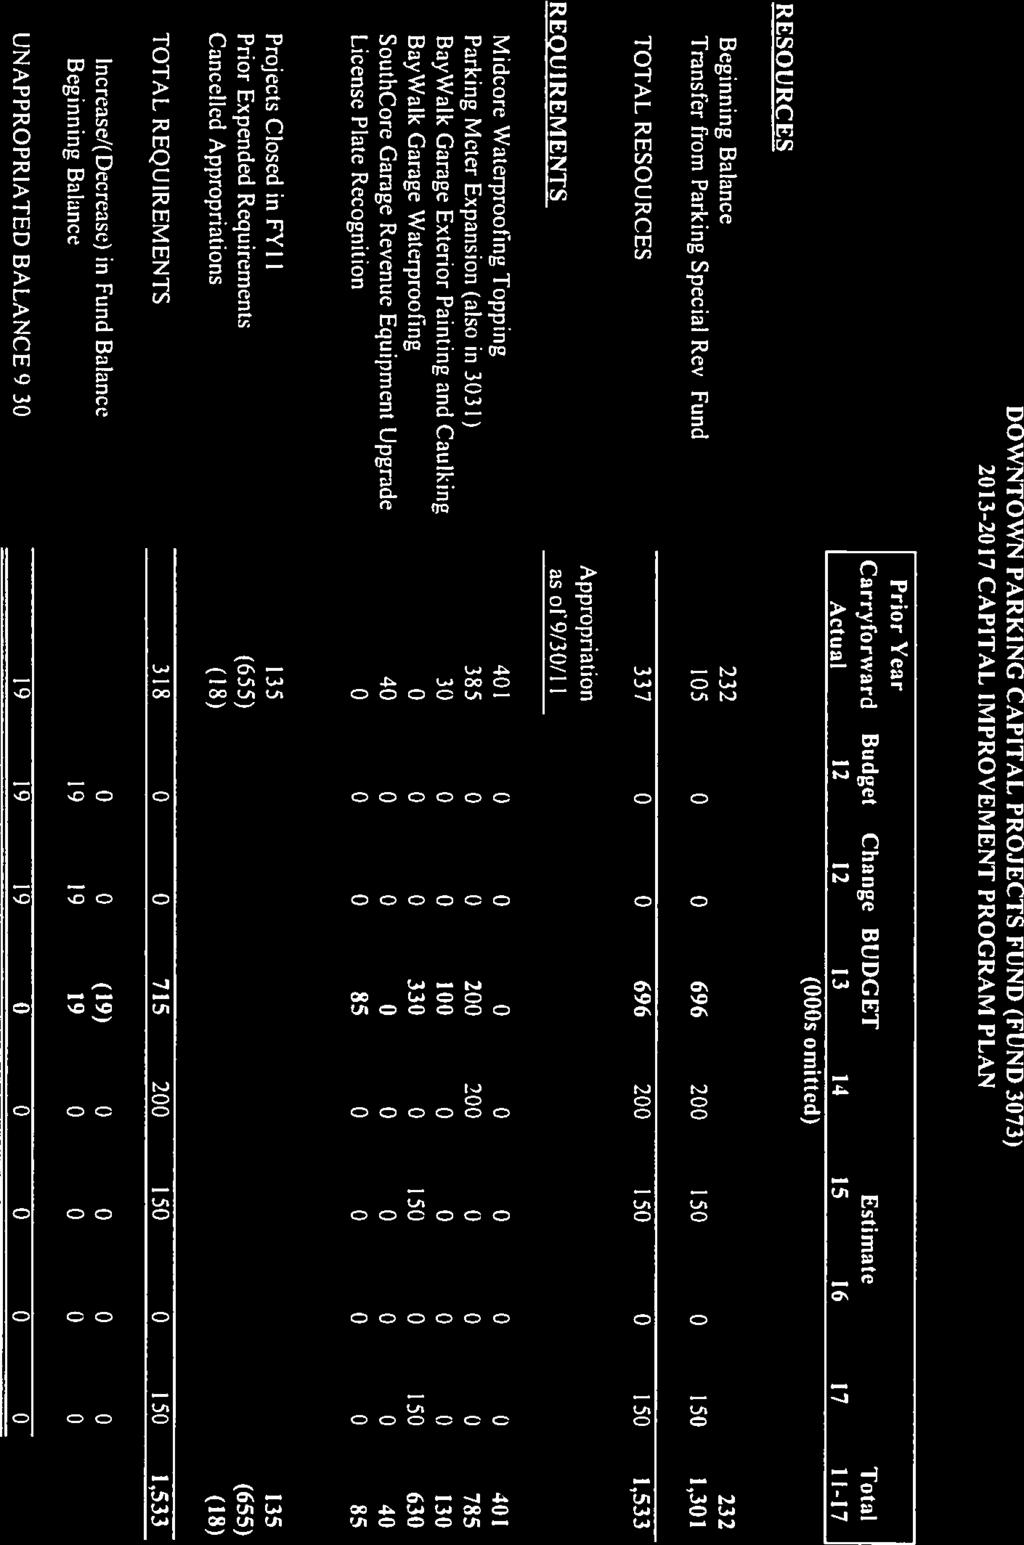
205
206
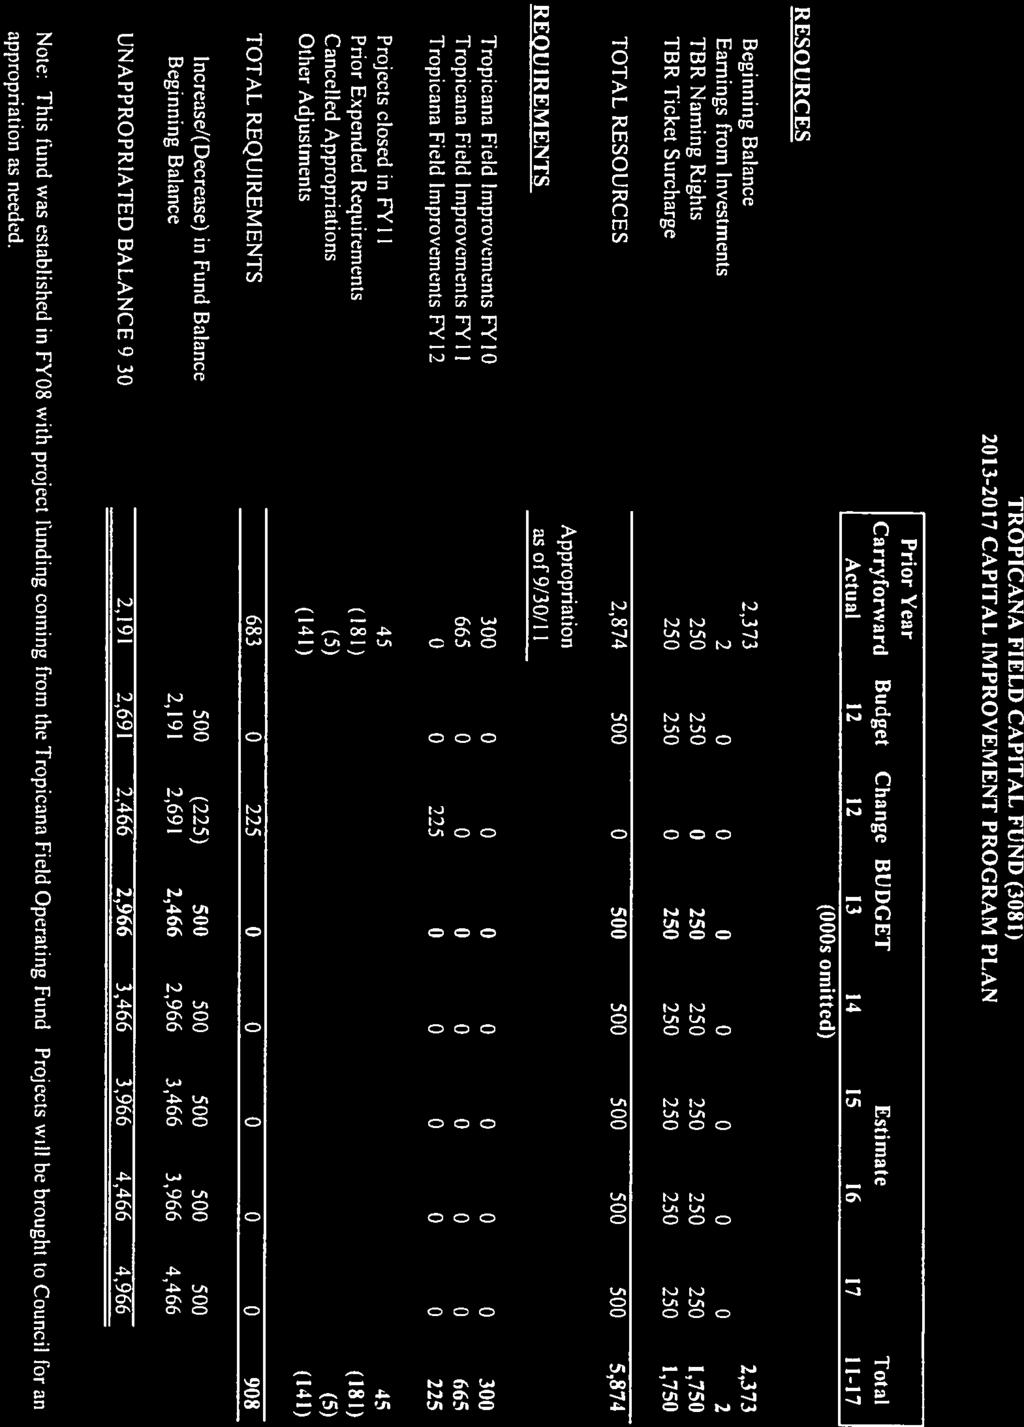
207
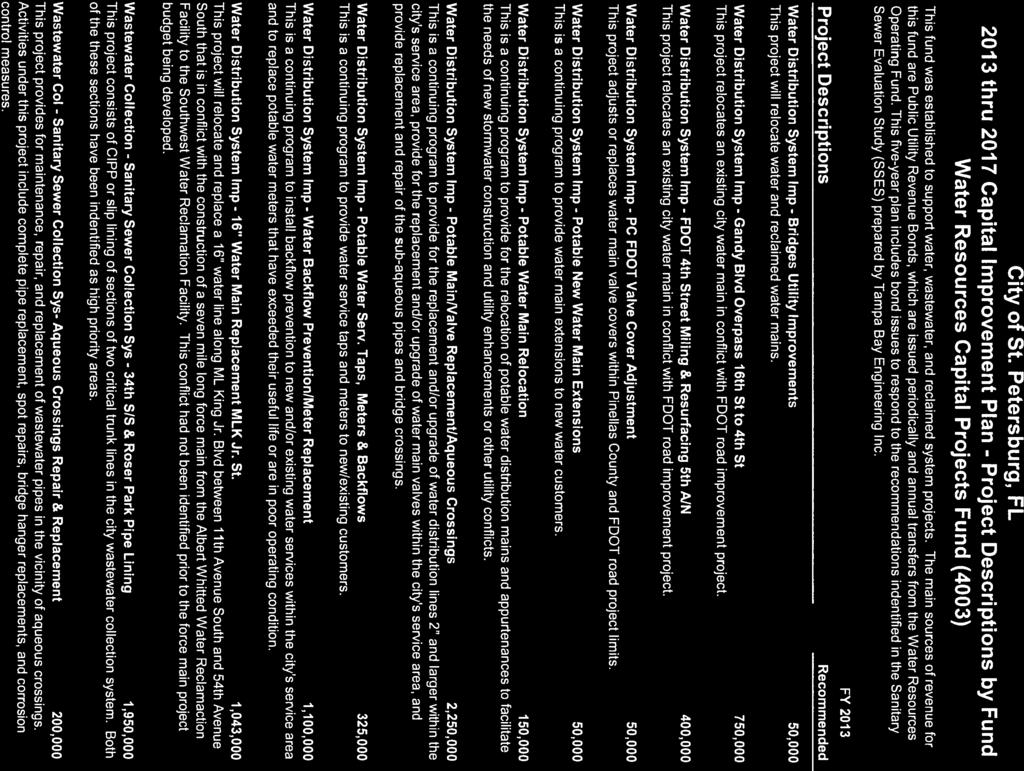
208
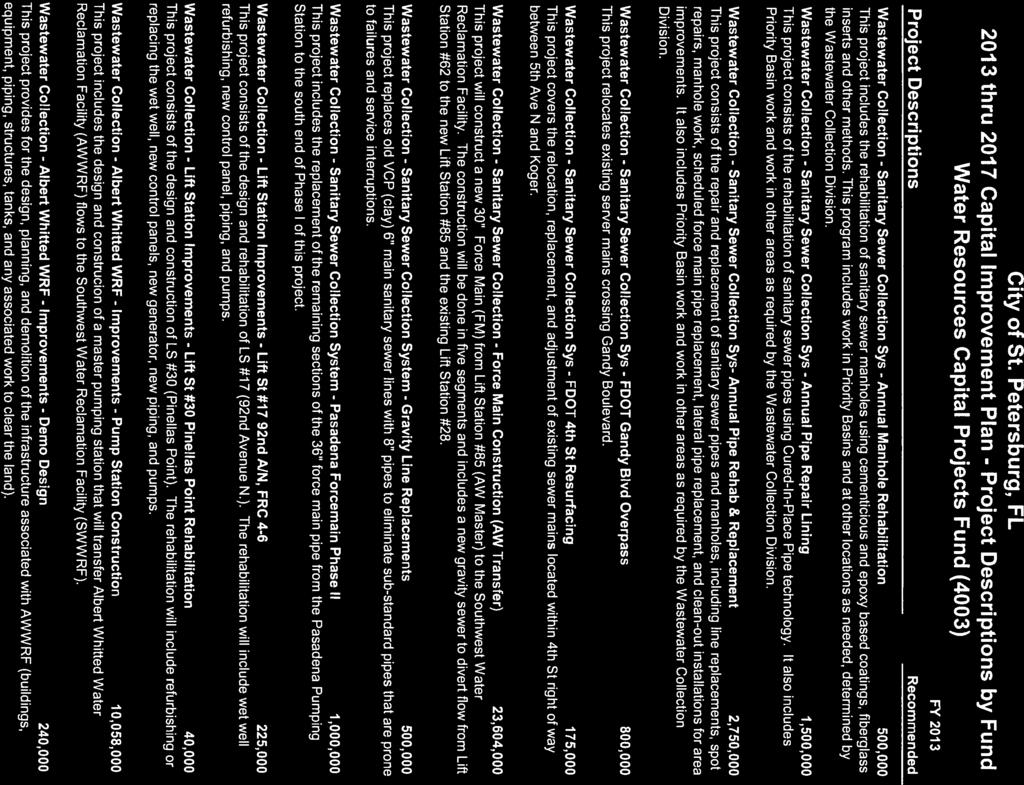
209
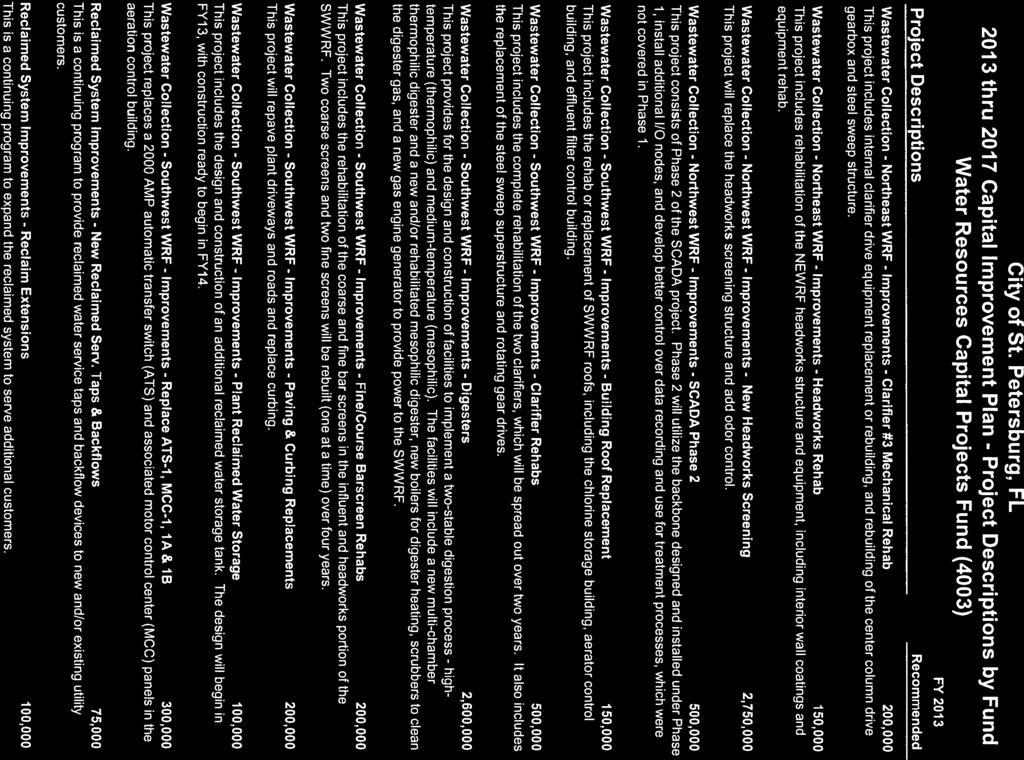
210
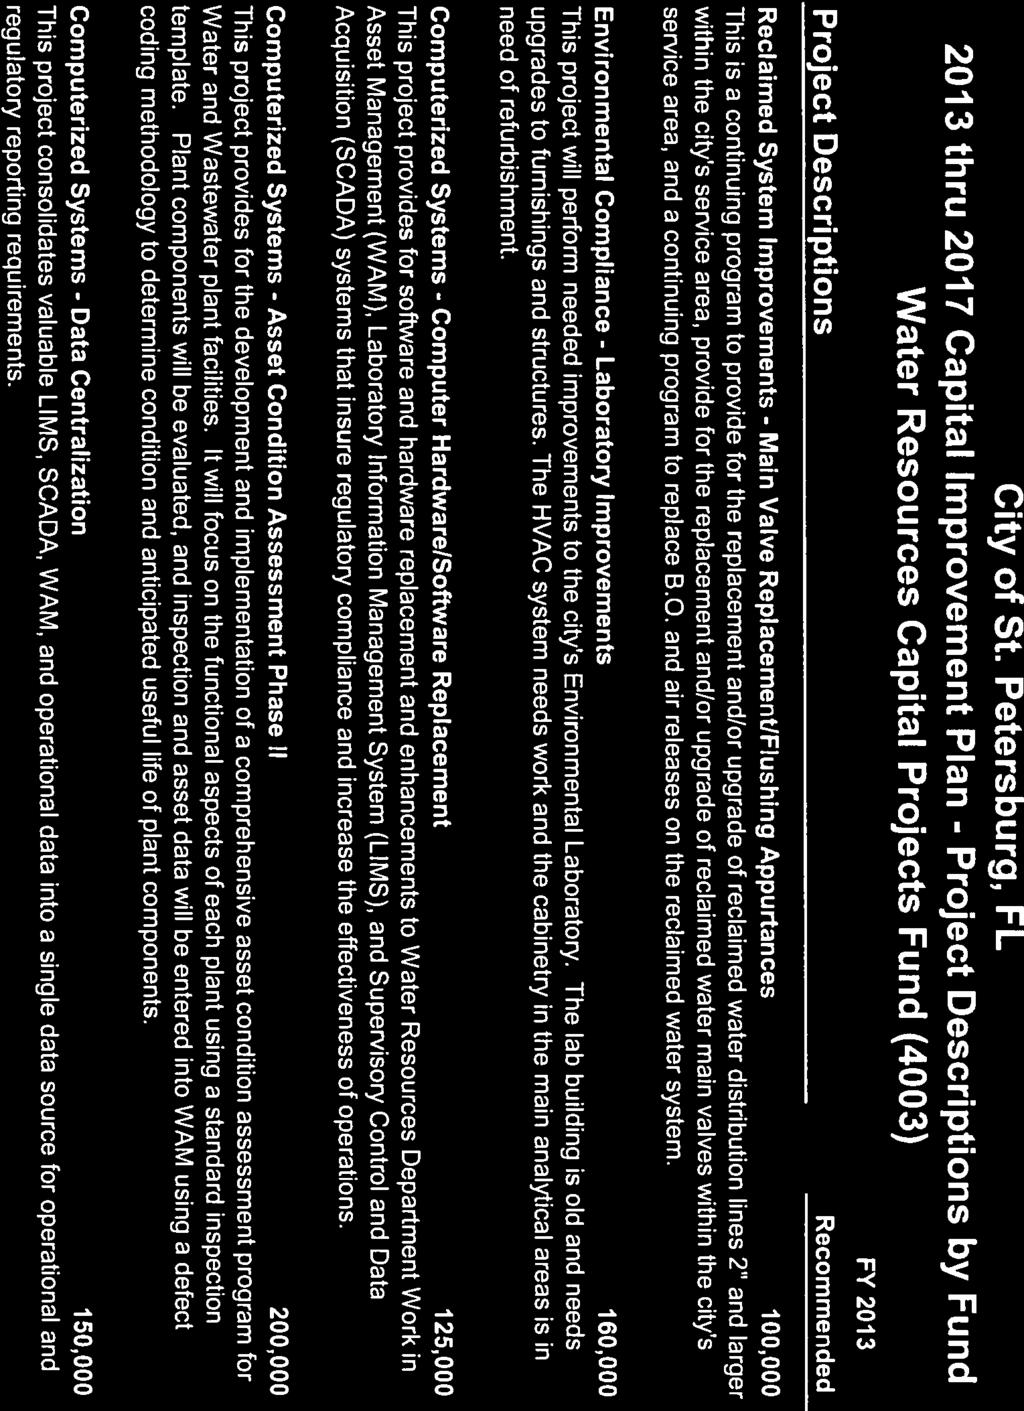
211
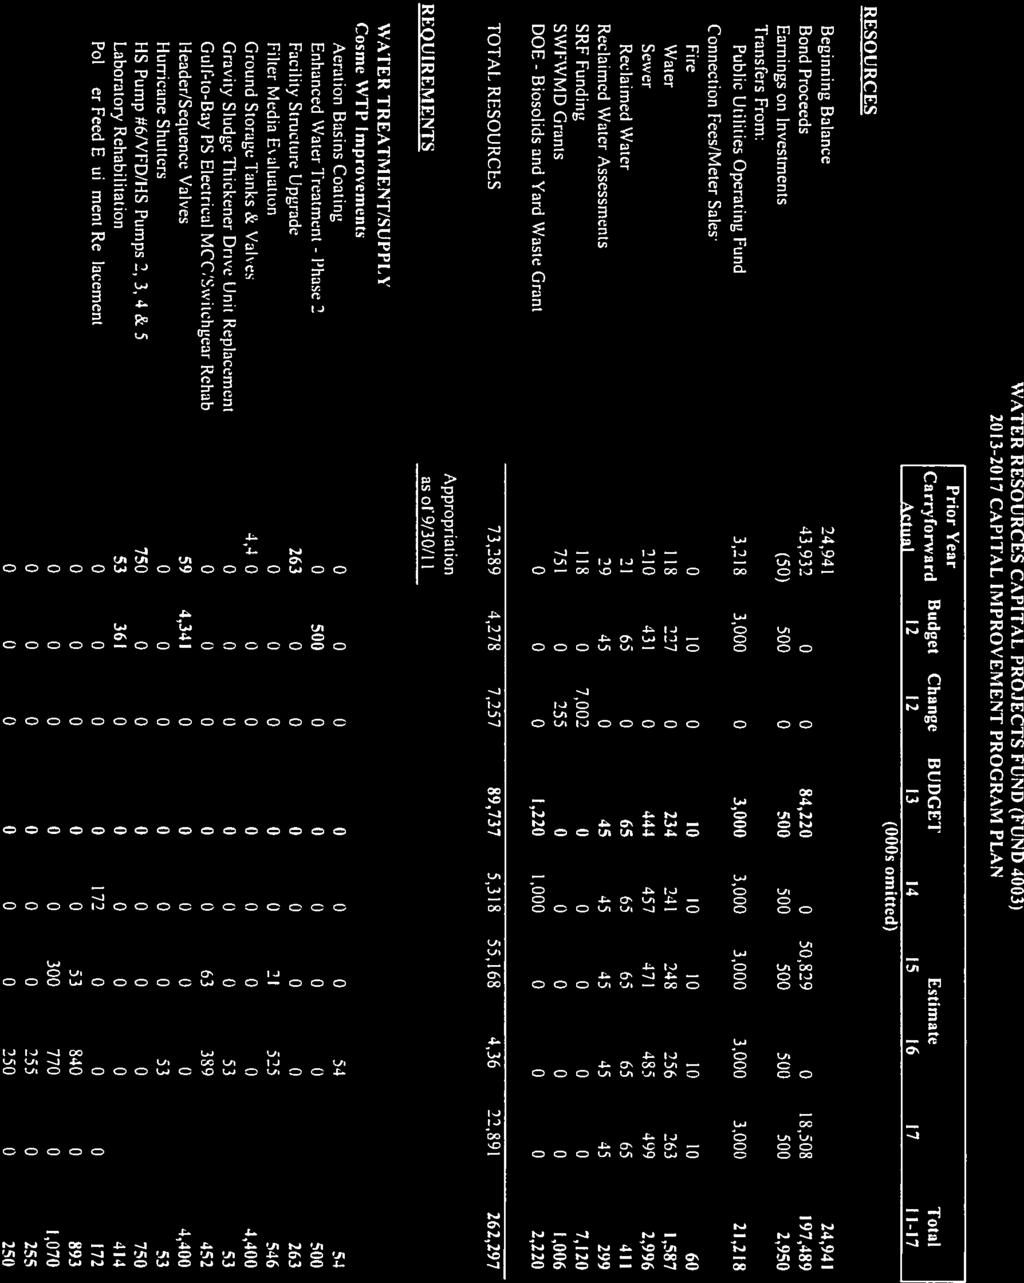
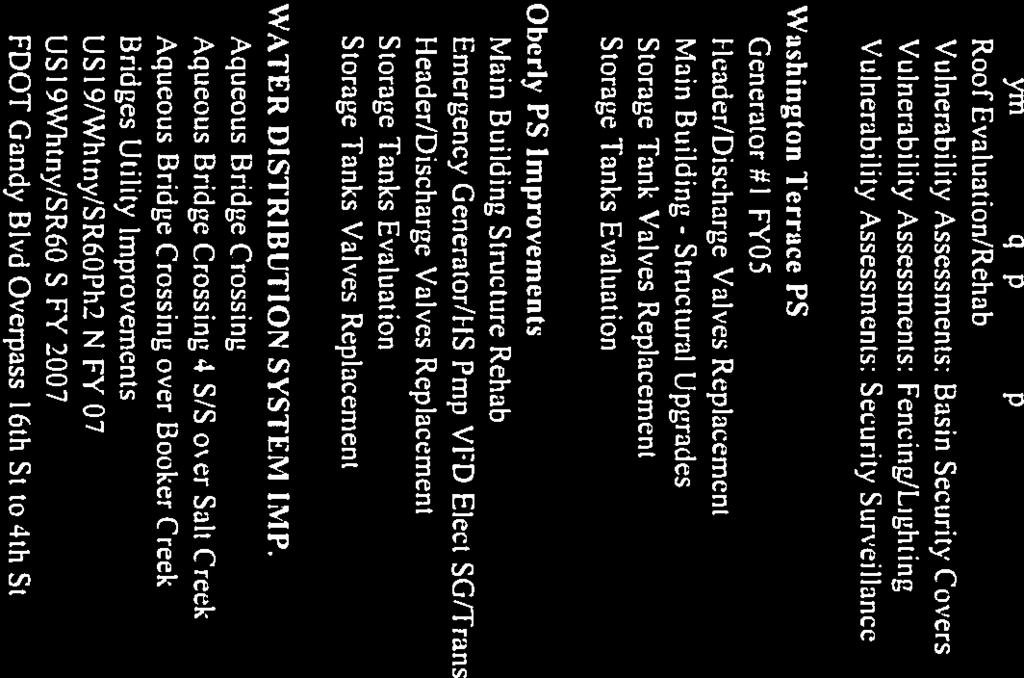
212

213
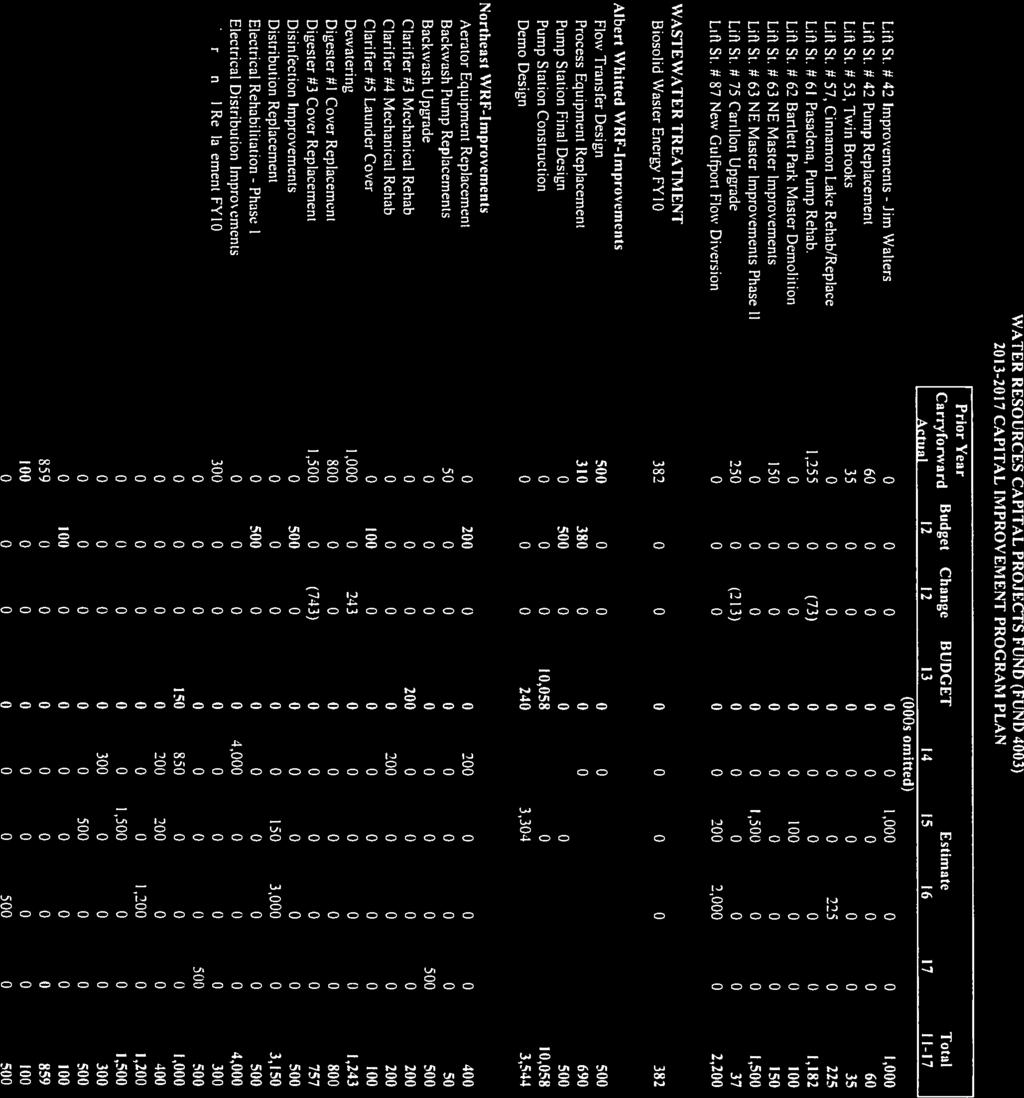
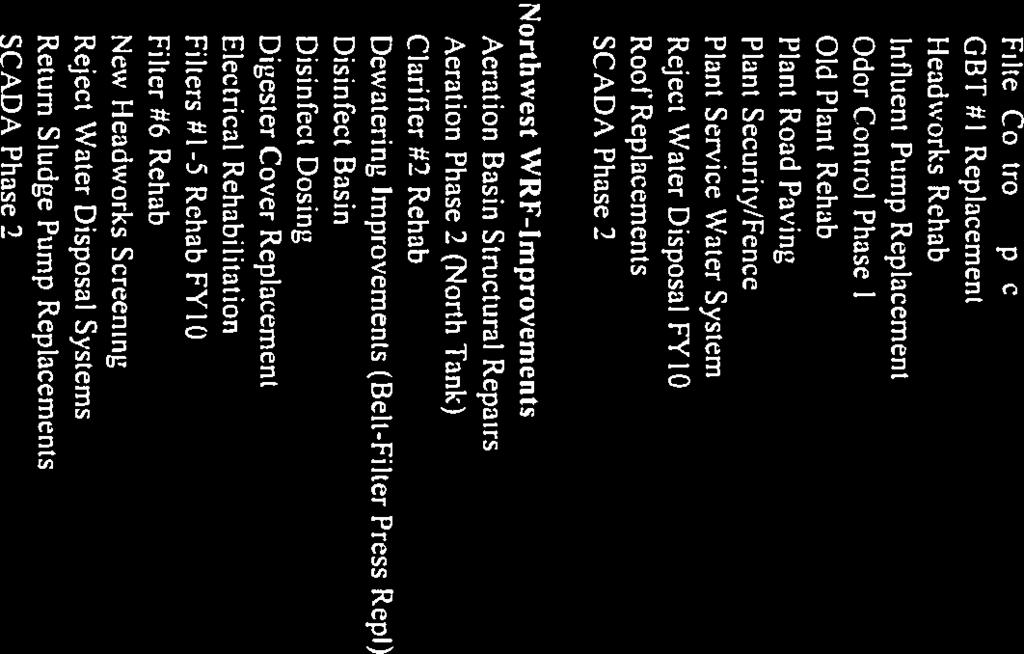
214
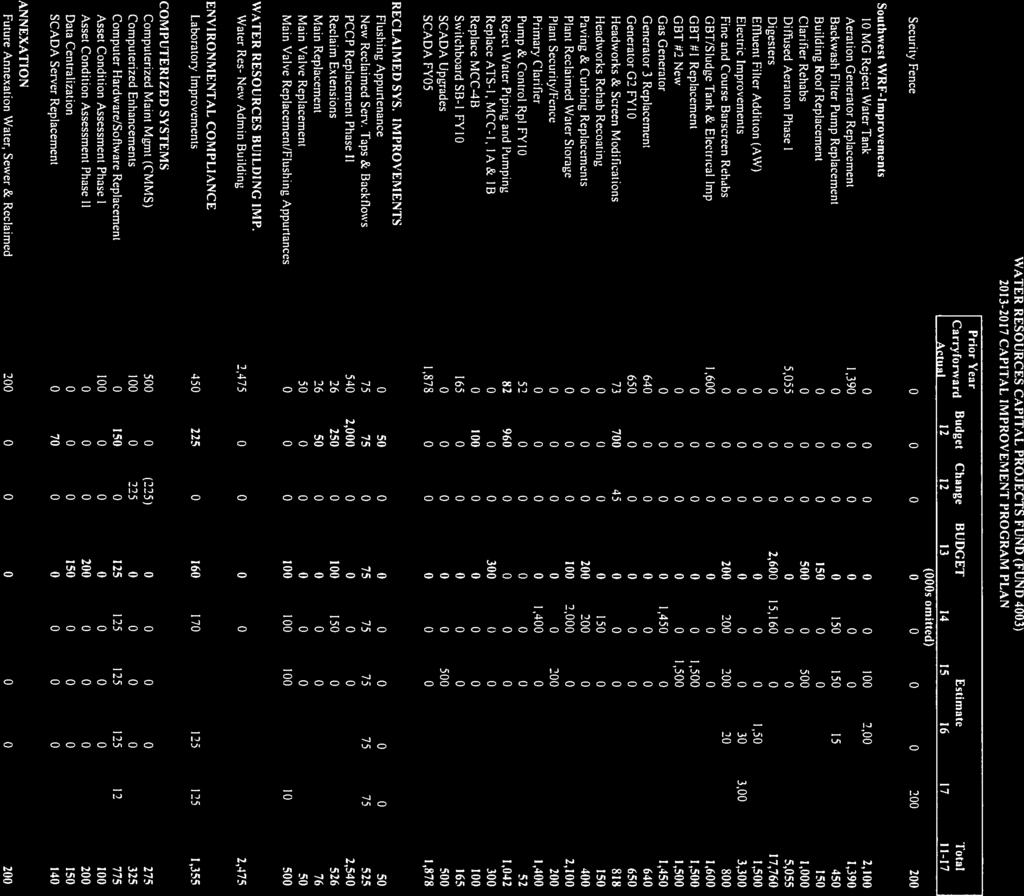
215
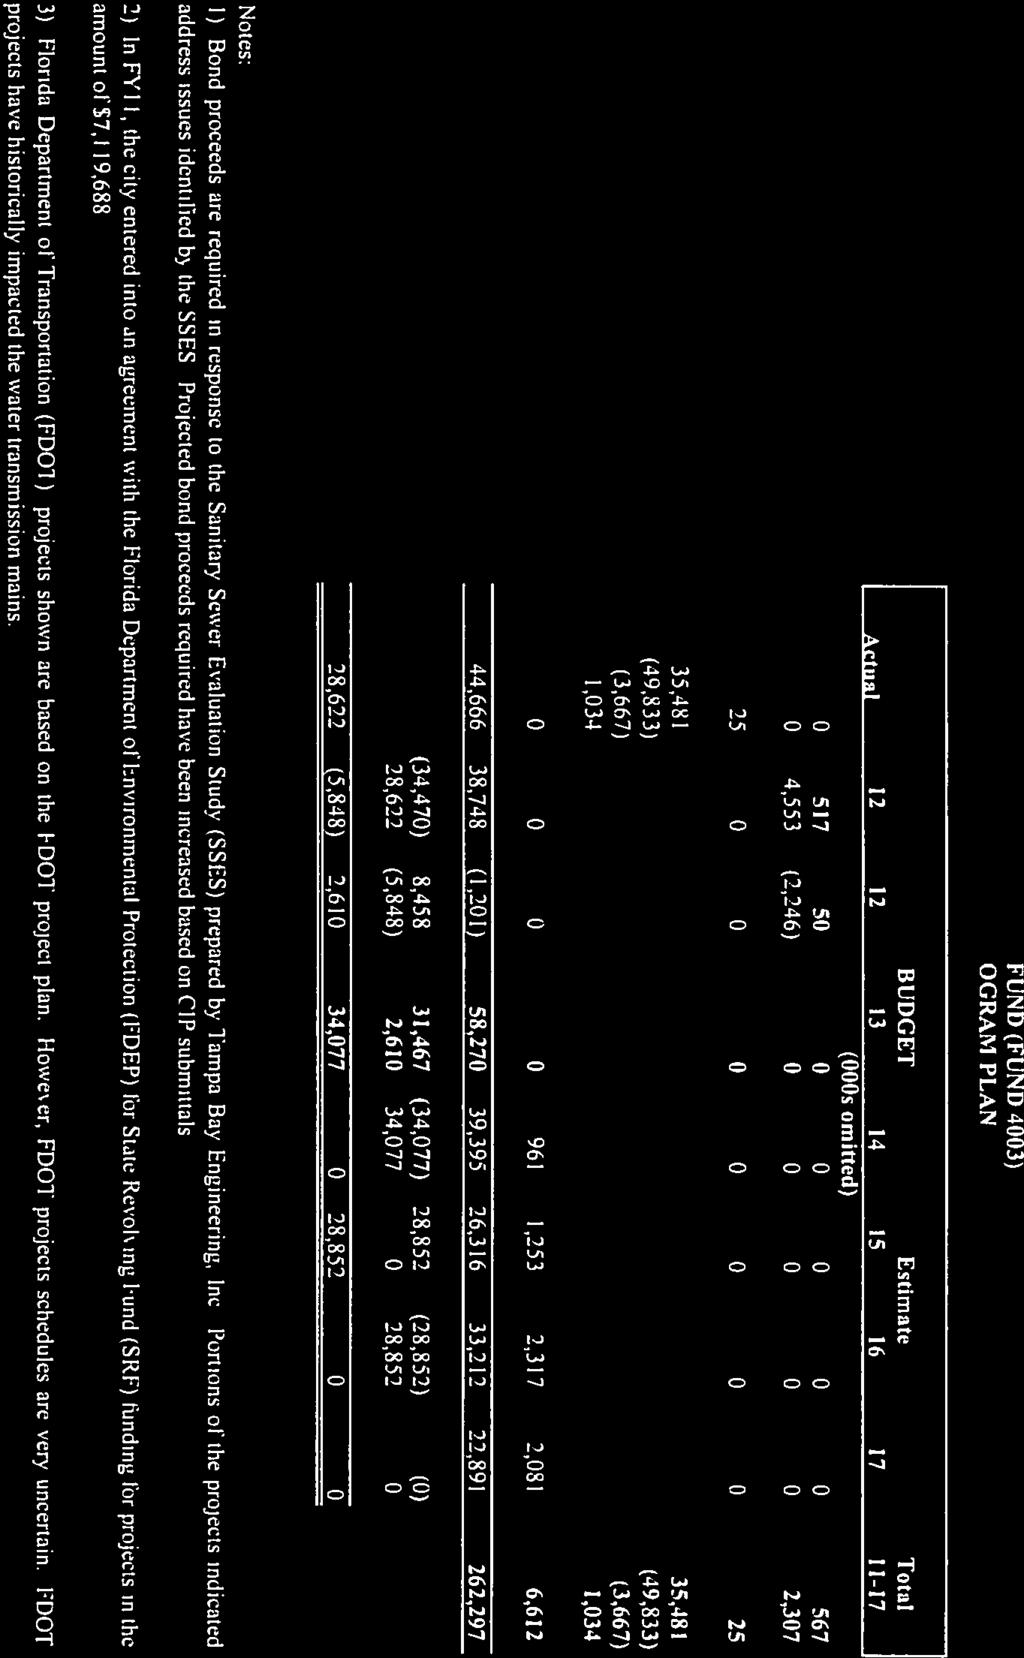

216
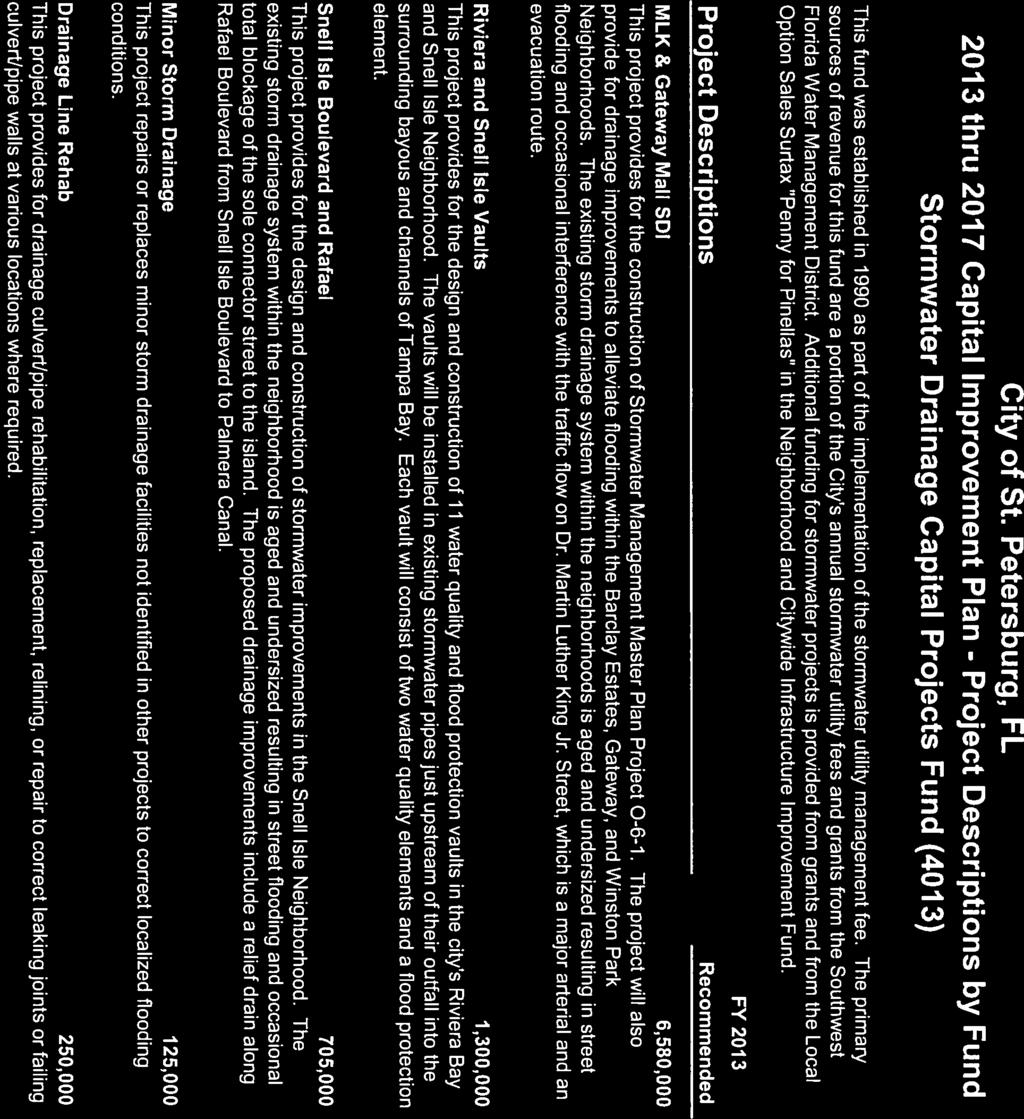
217
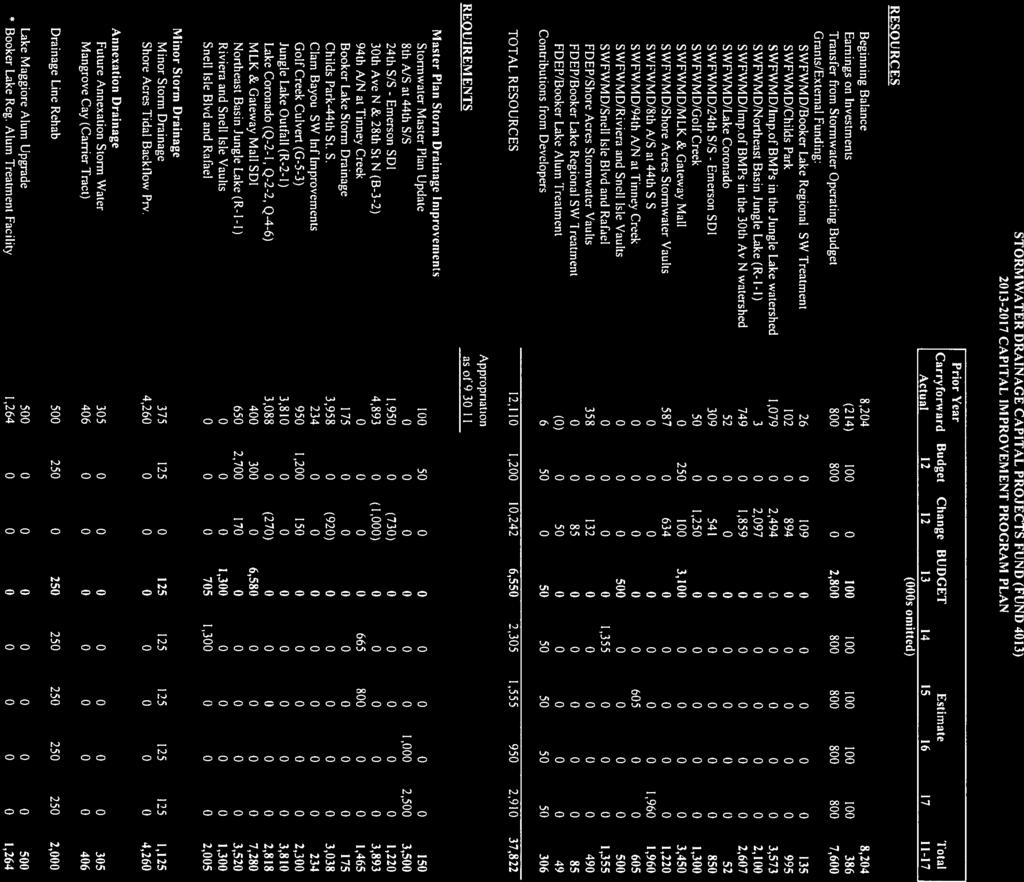
218
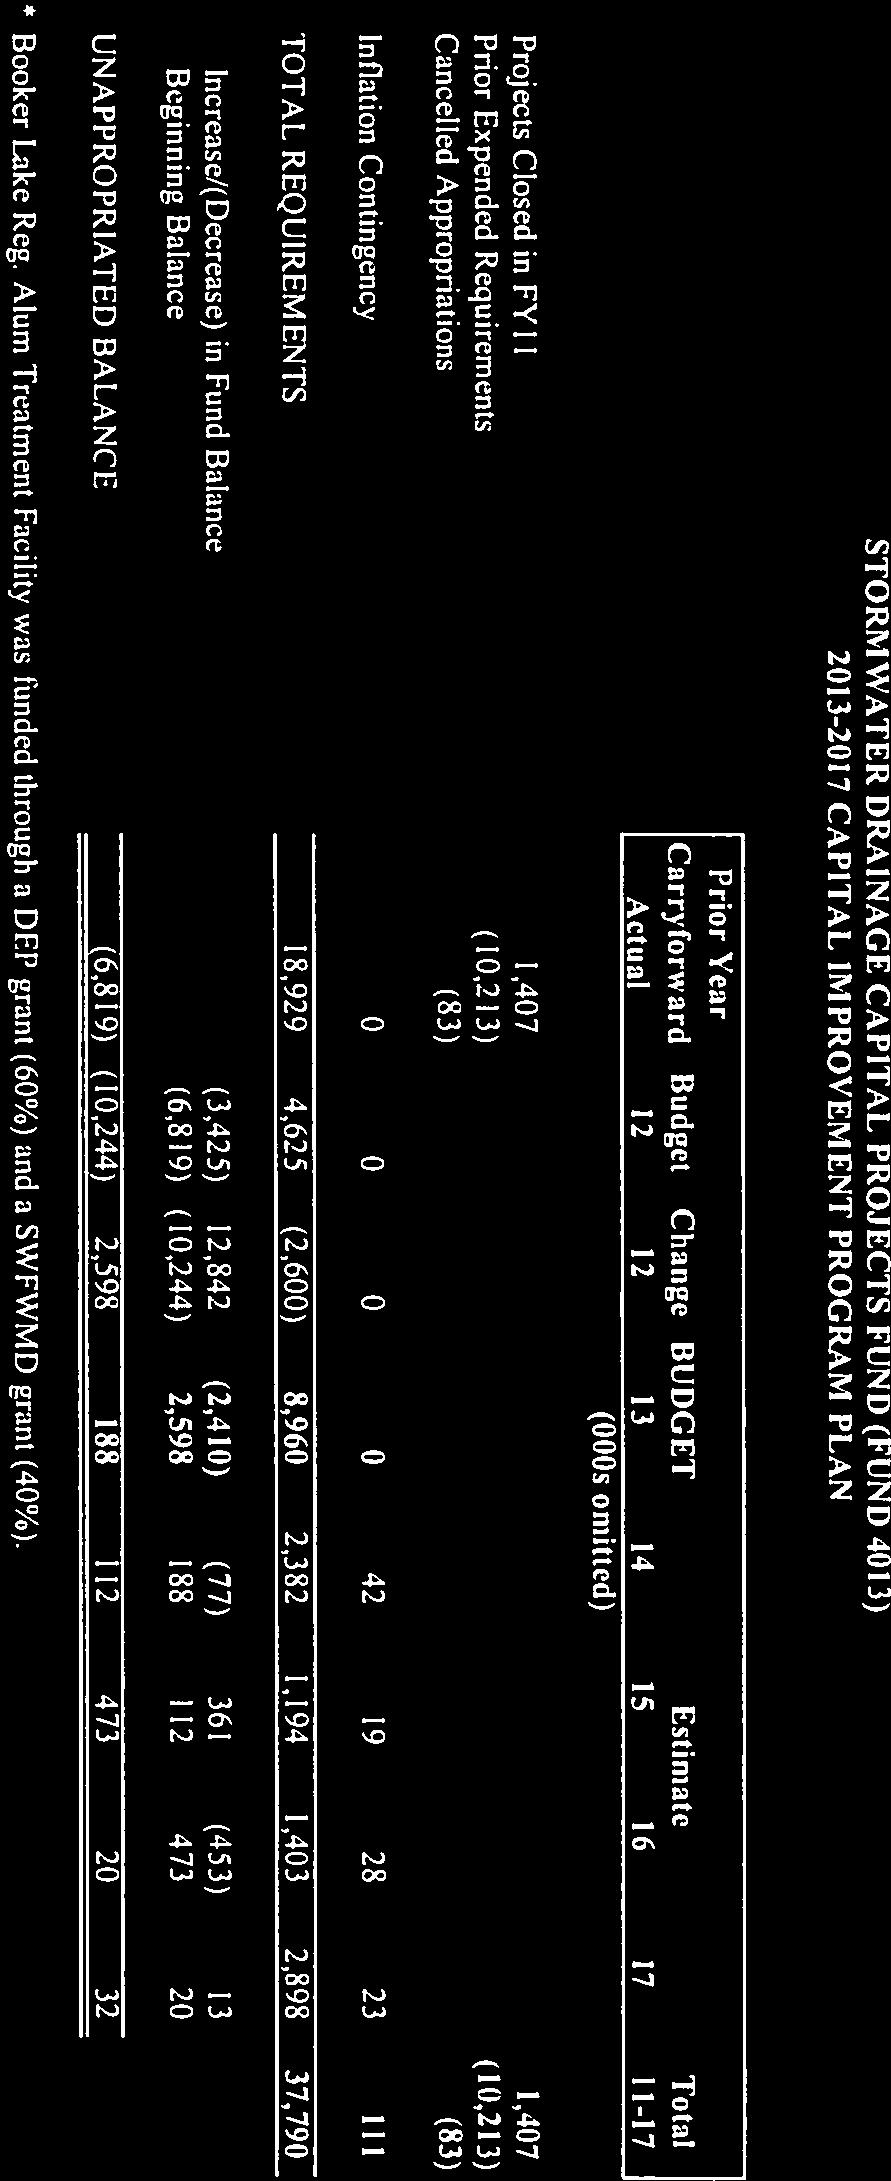
219
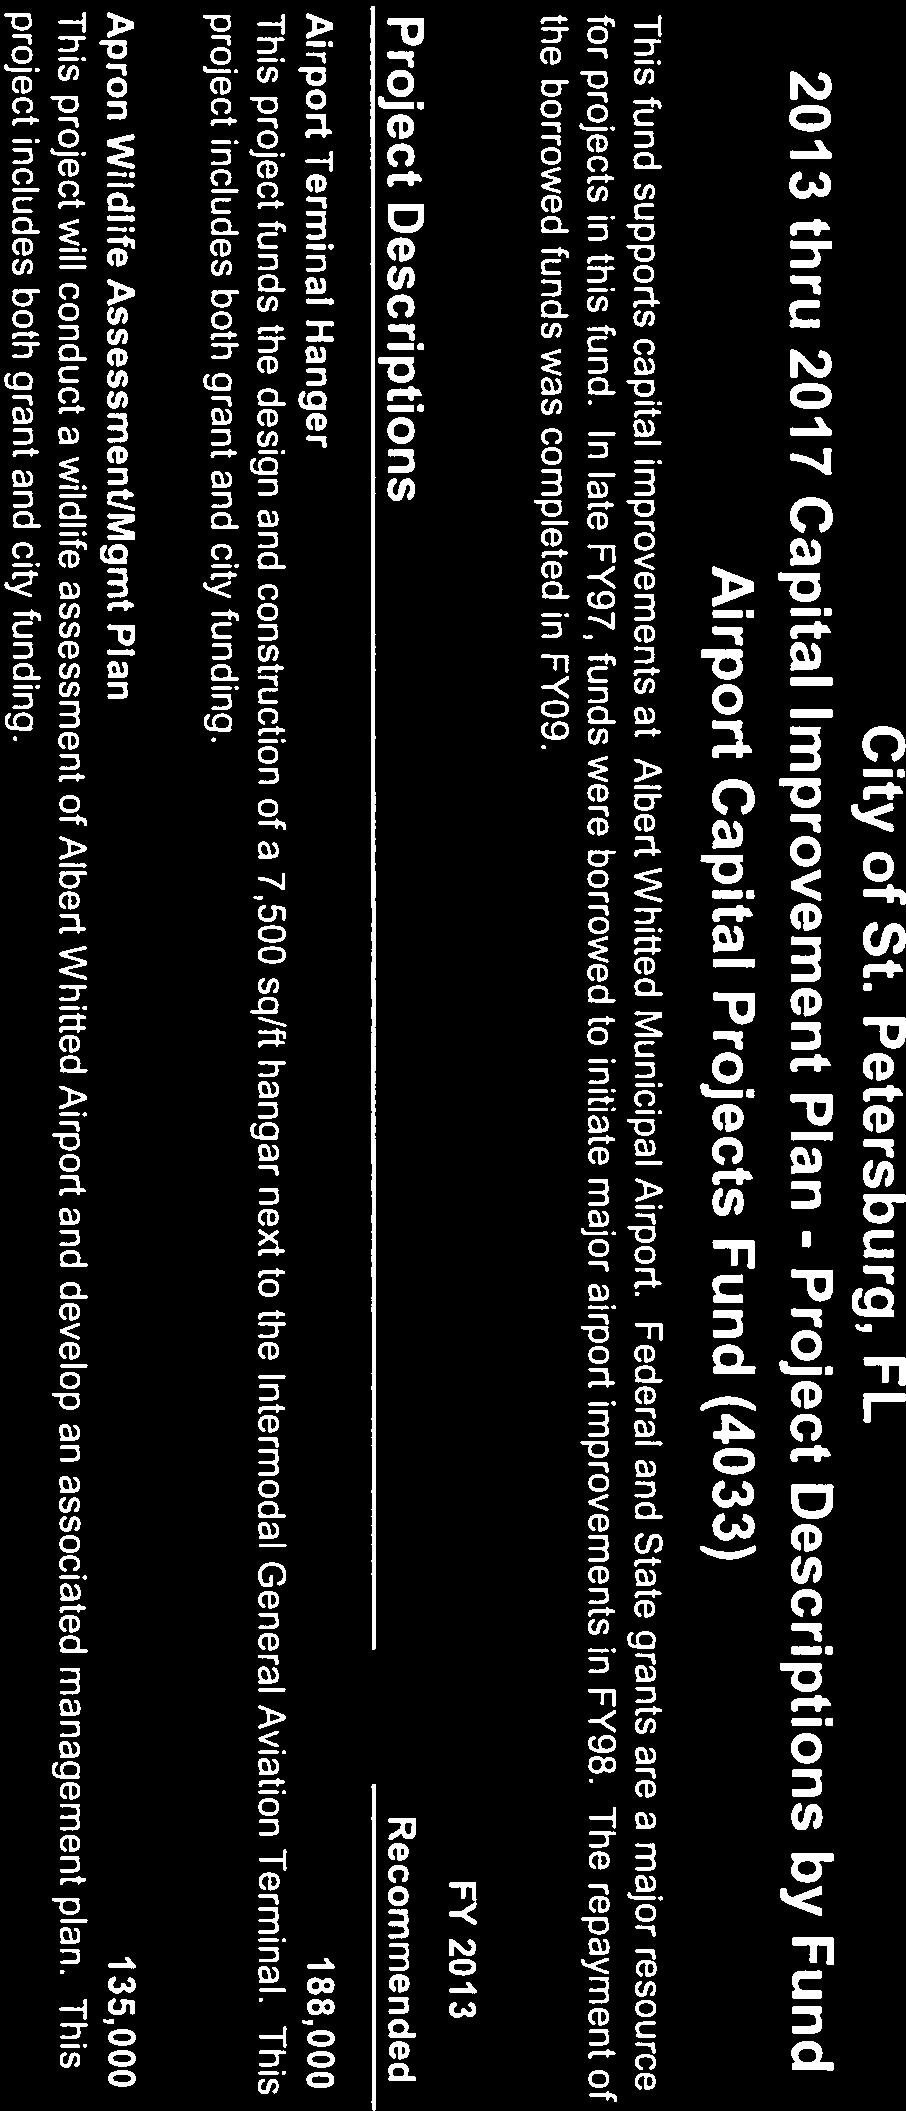
220
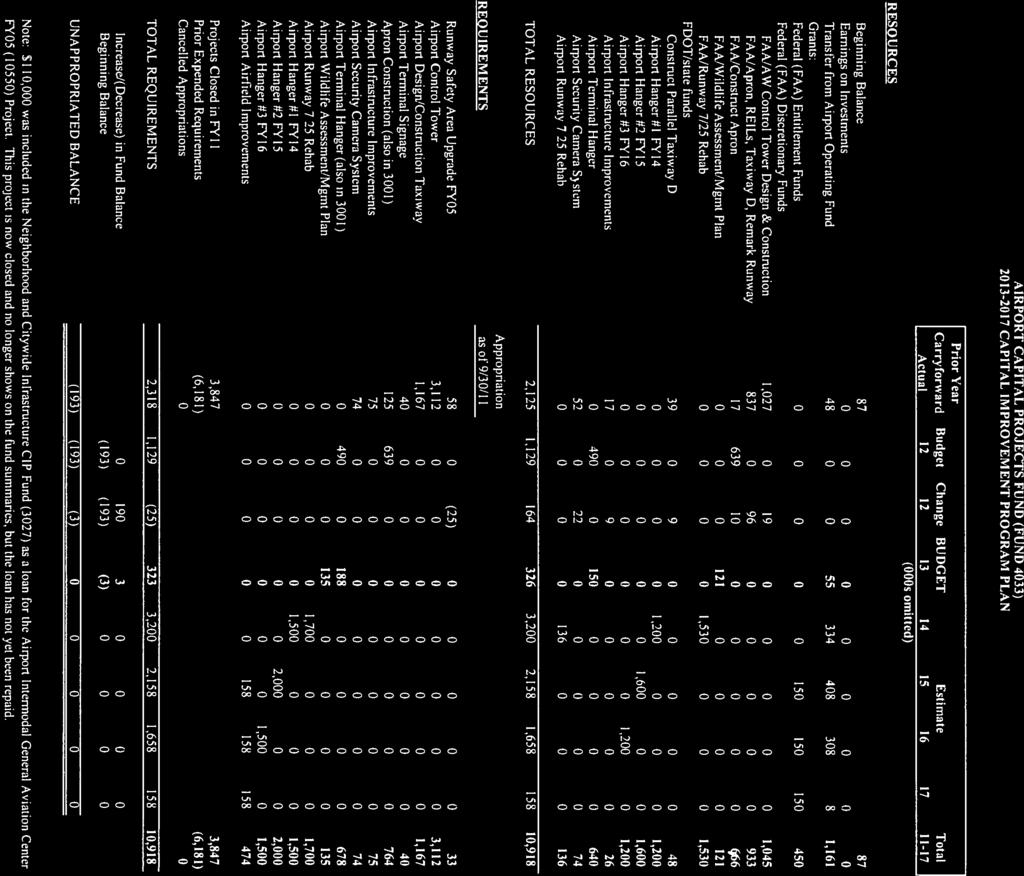
221
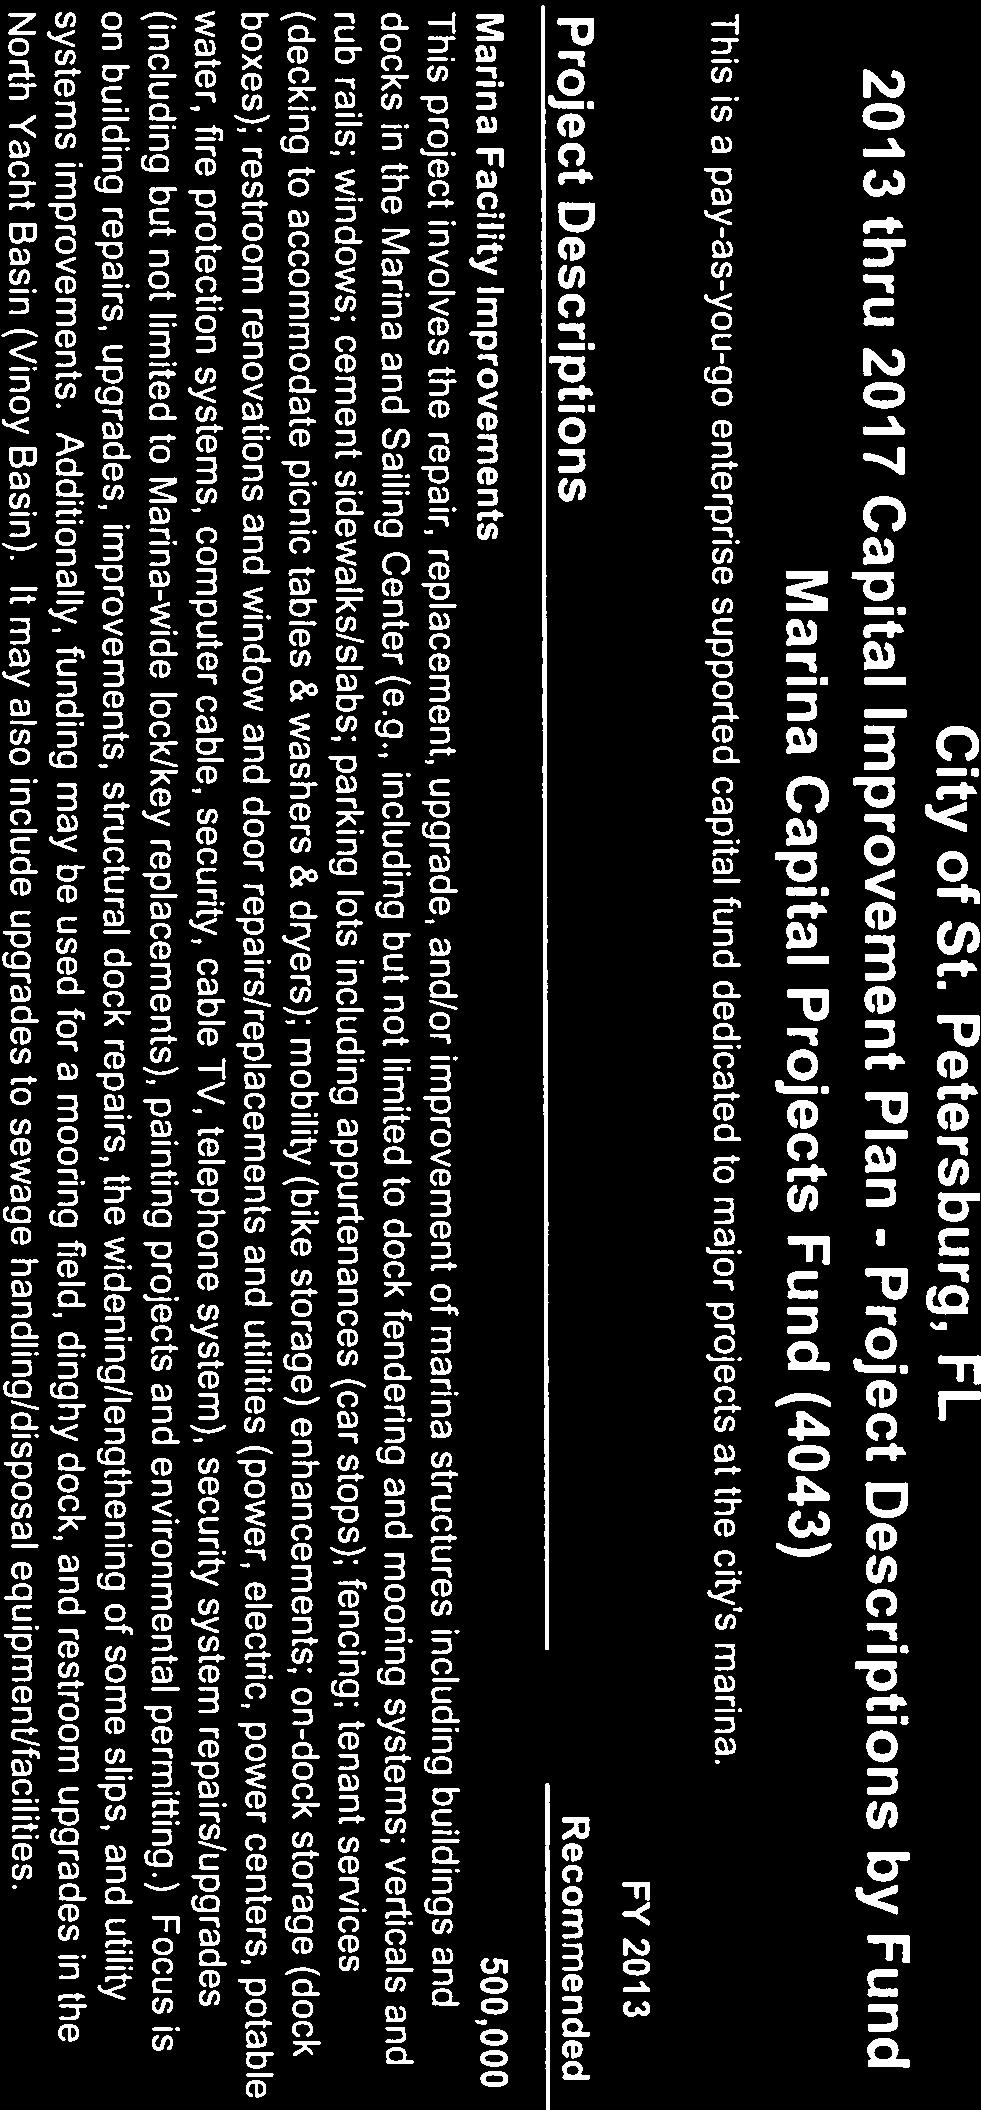
222
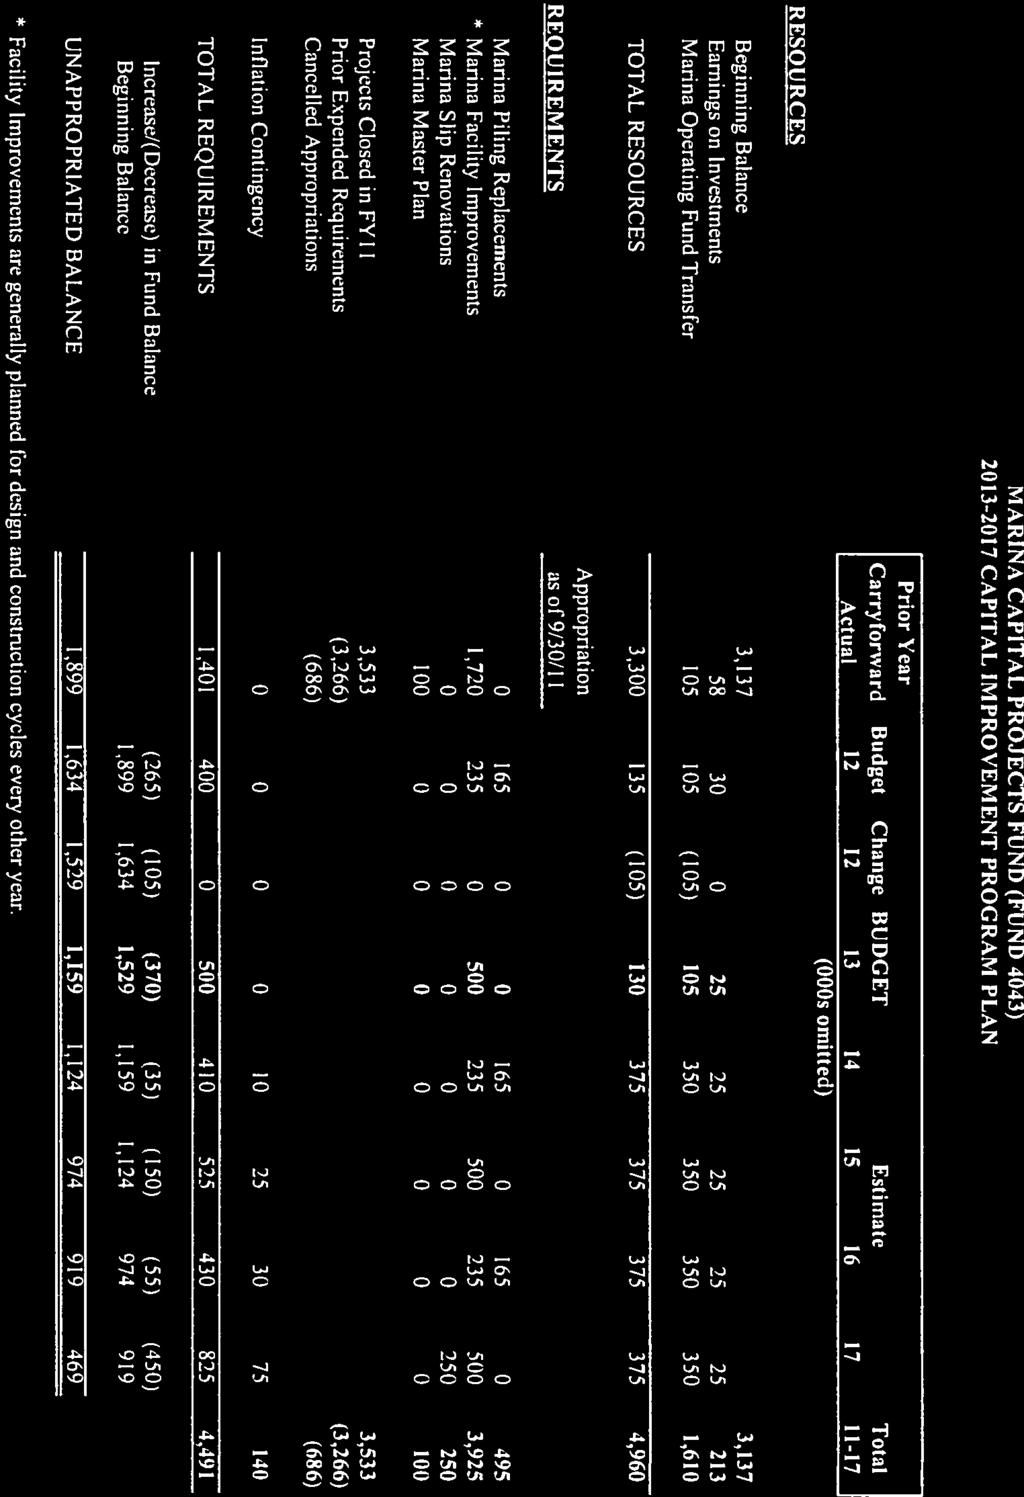
223
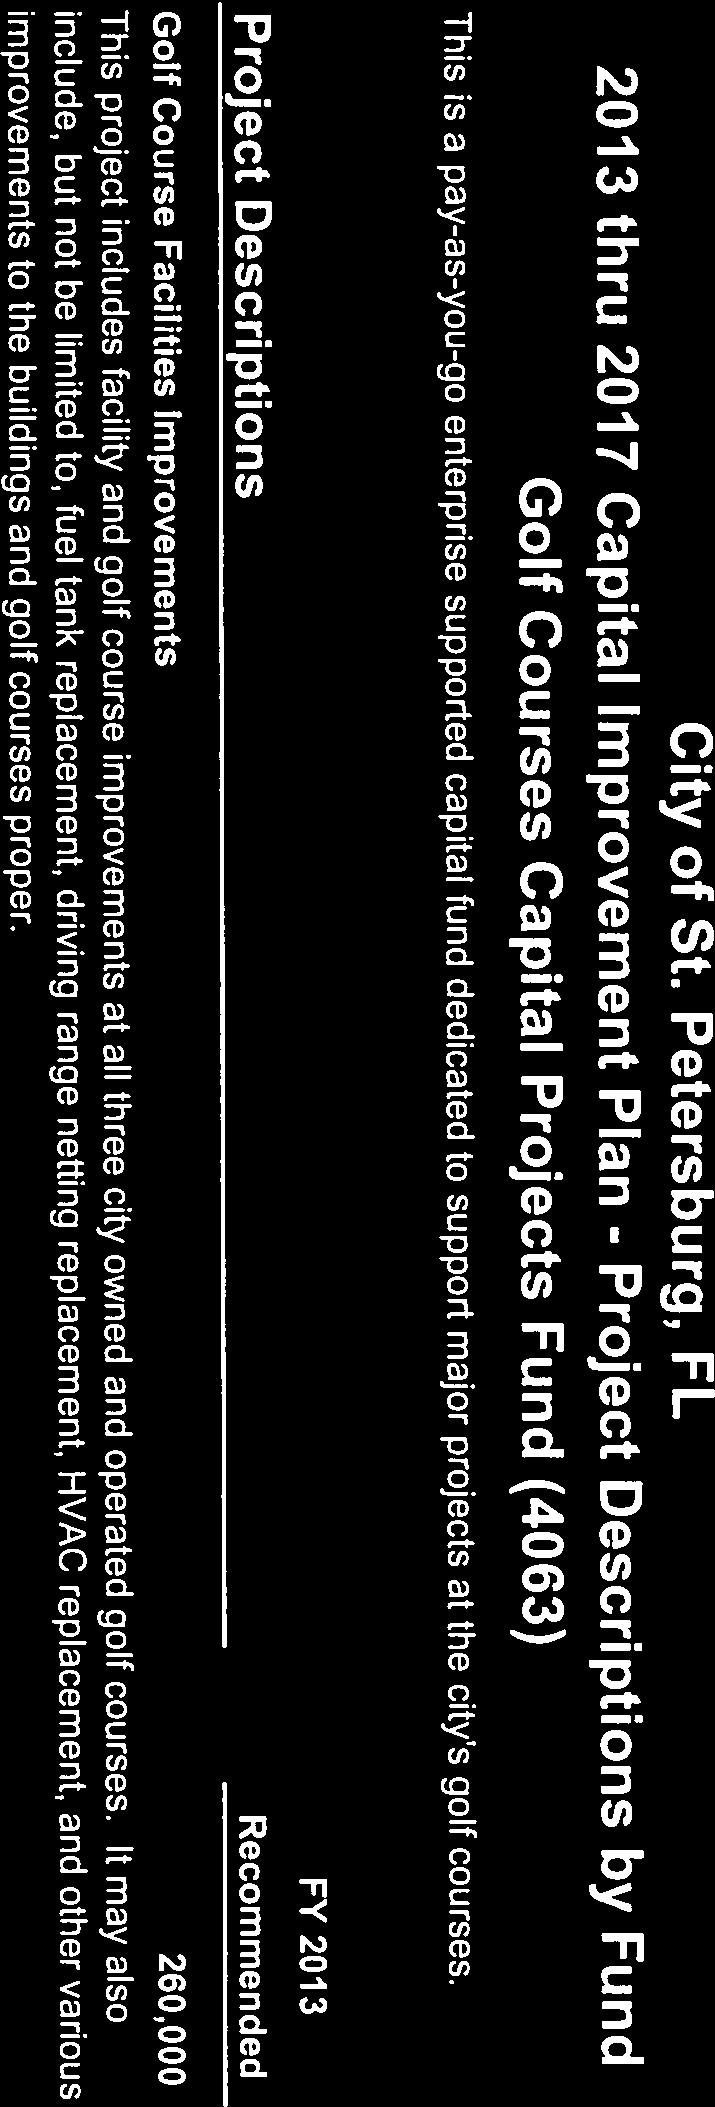
224
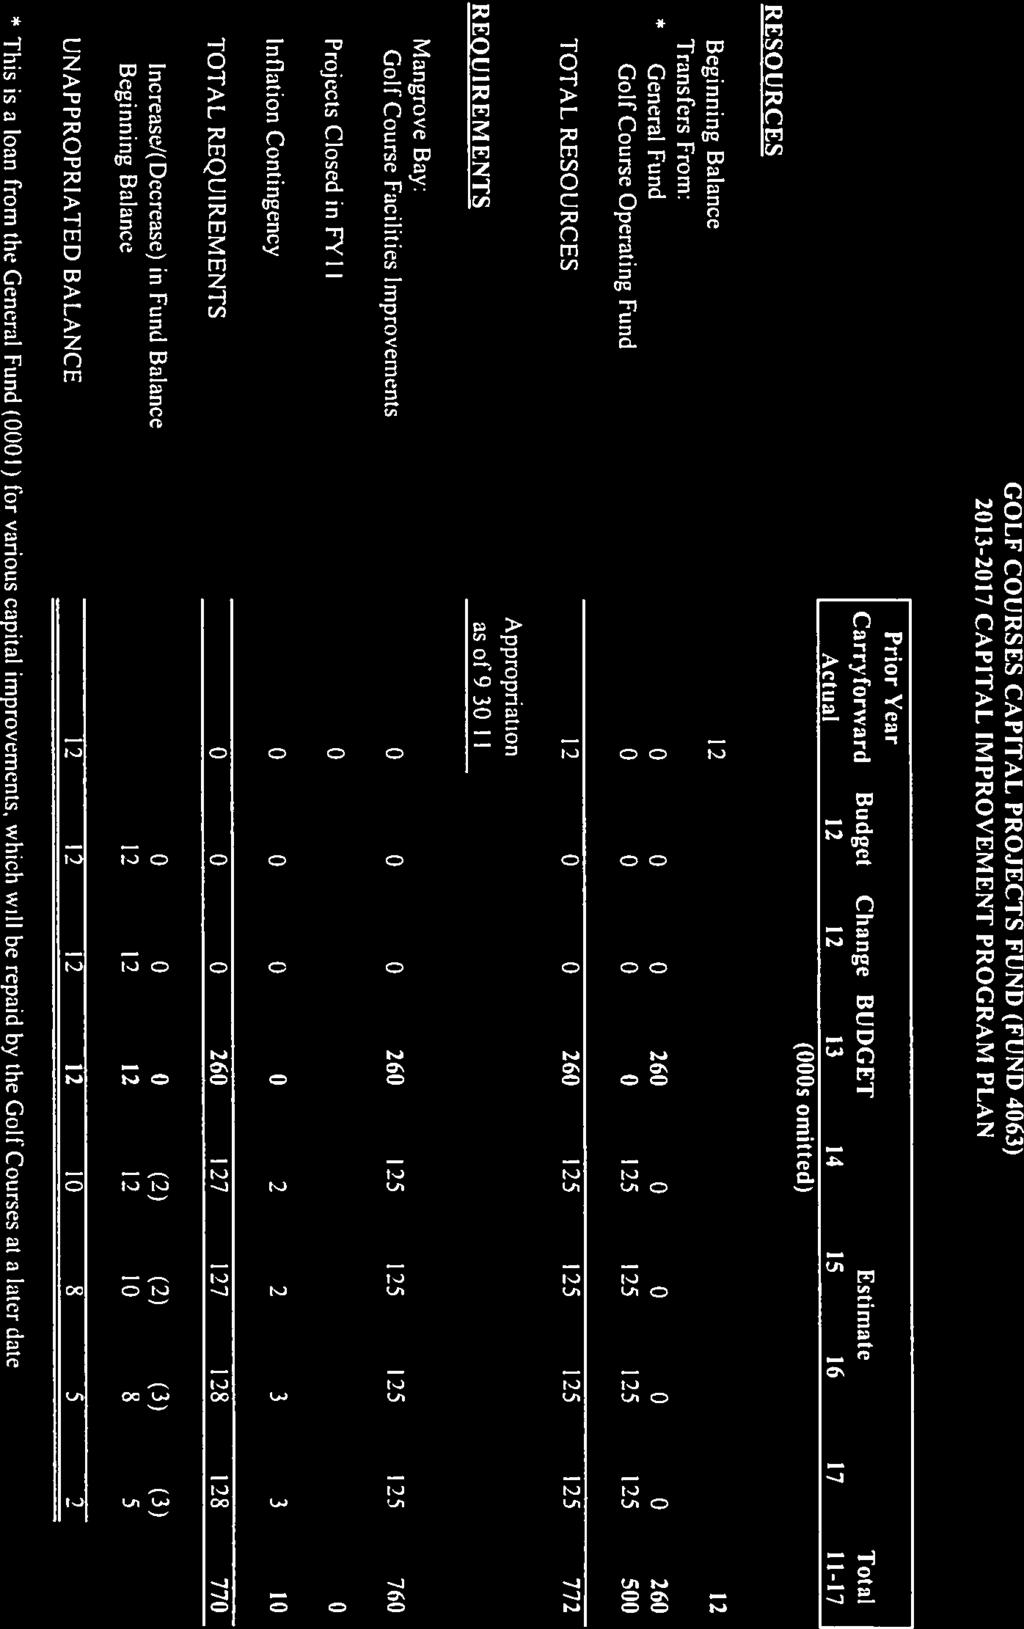
225
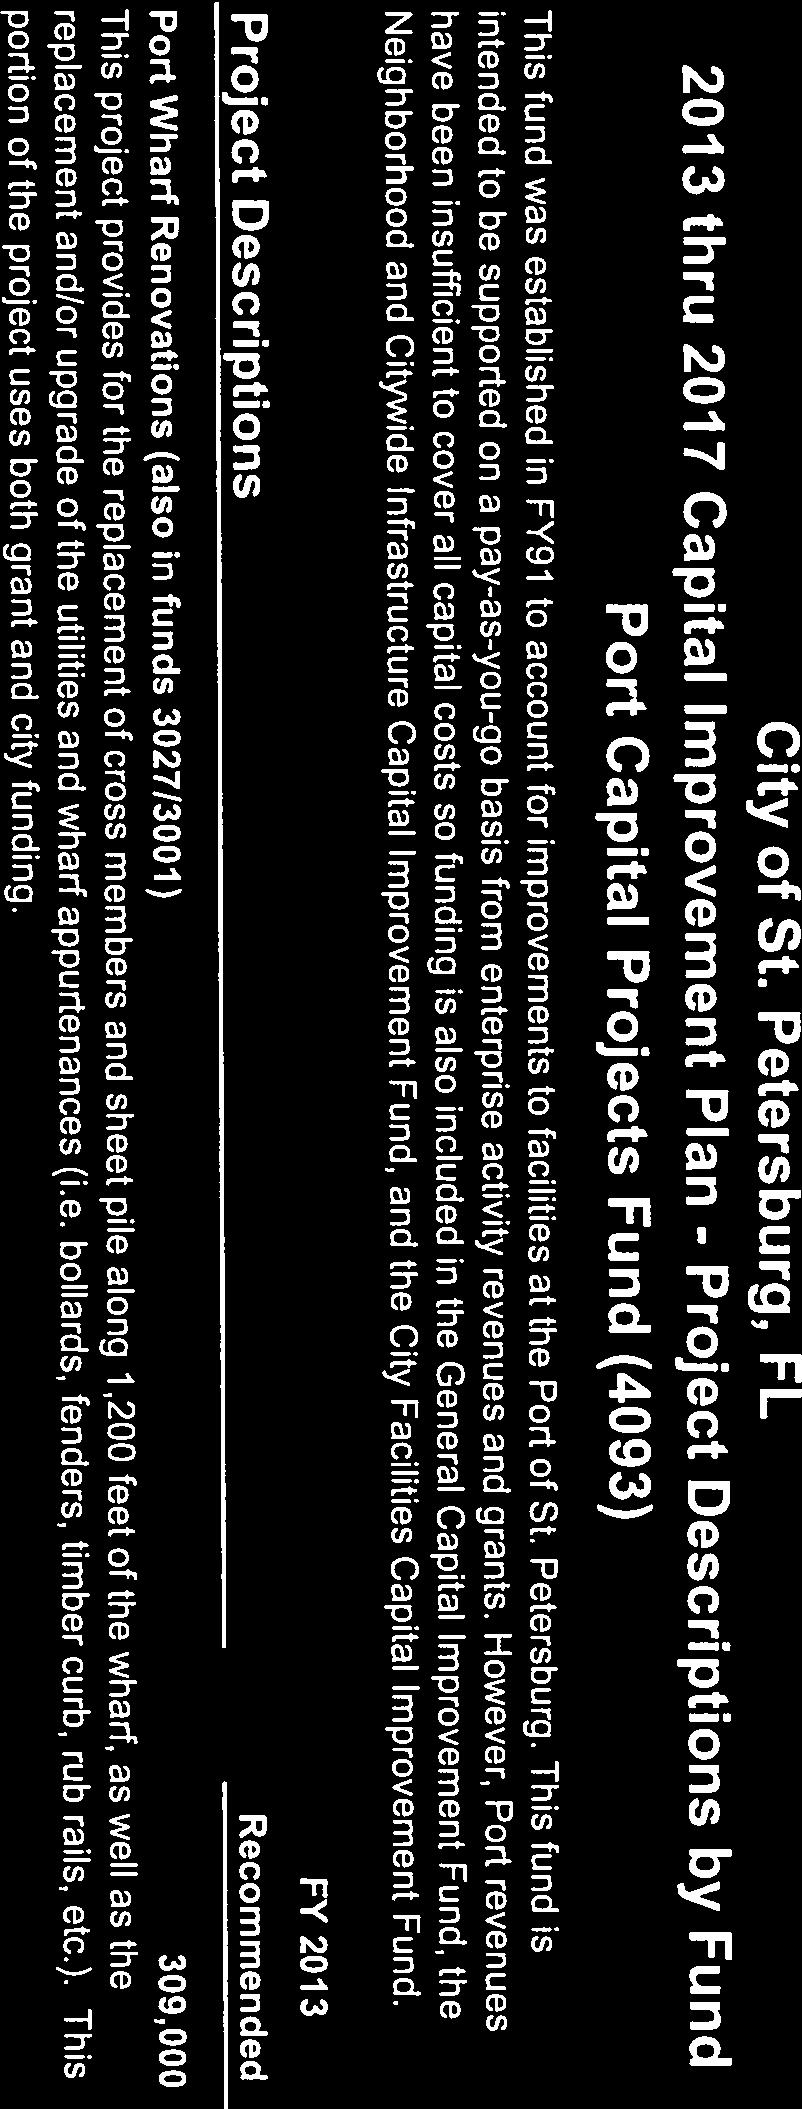
226
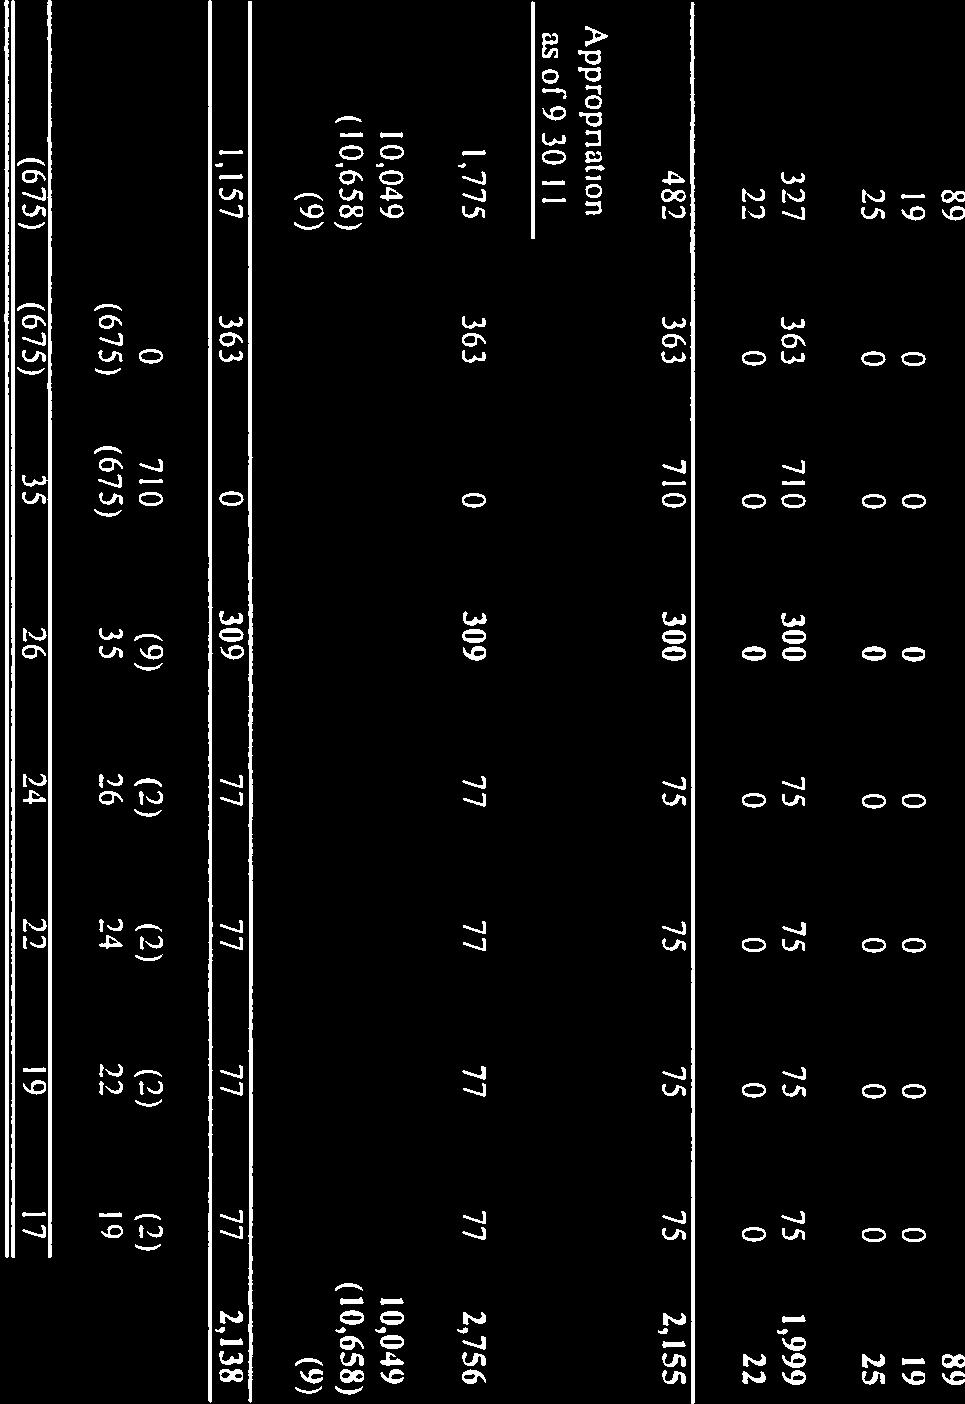
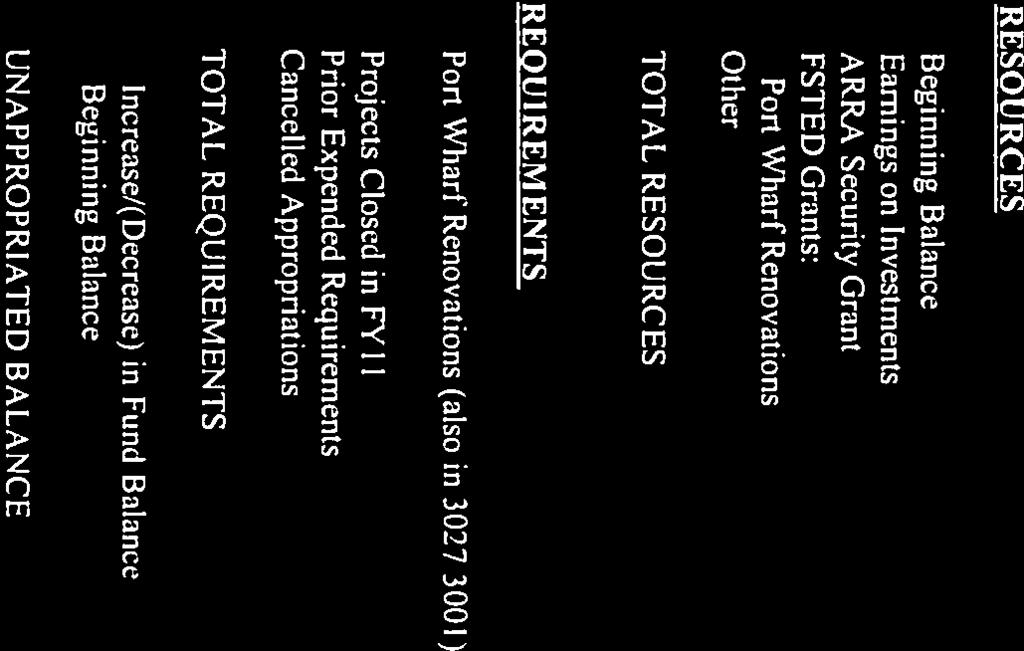
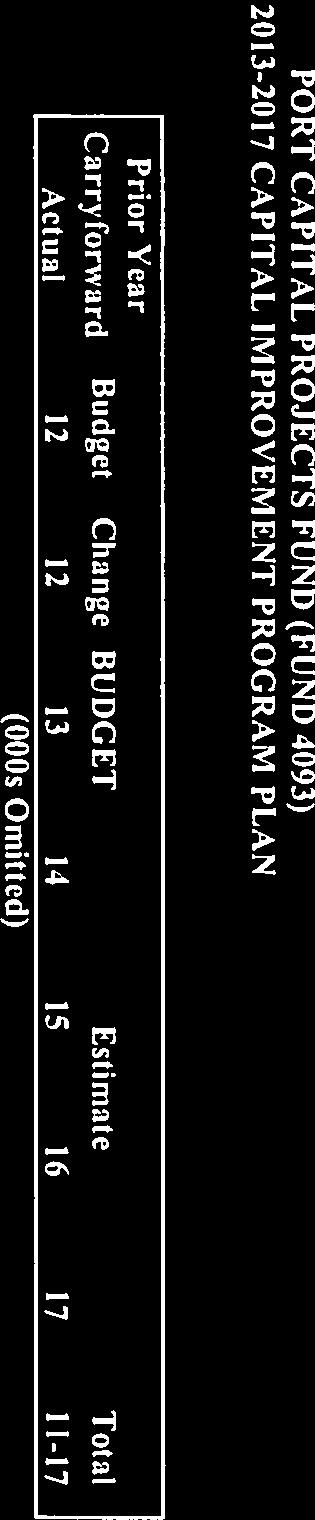
227
City of St. Petersburg FY 2017 Recommended Operating & CIP Budget Table of Contents
 City of St. Petersburg FY 2017 Recommended Operating & CIP Budget Table of Contents INTRODUCTION Executive Summary I. FUND SUMMARIES All Funds Summary... 1 General Fund (0001)... 3 Preservation Fund (0002)...
FUND DESCRIPTIONS GOVERNMENTAL FUNDS
 FUND DESCRIPTIONS The city of St. Petersburg uses funds and account groups to account for its resources as required by the Charter, State Statutes, and the accounting profession. Each of the city funds
City of St. Petersburg. FY 2018 Recommended Budget
 City of St. Petersburg FY 218 Recommended Budget City of St. Petersburg MEMORANDUM To: From: Honorable Darden Rice, Chair & Members of City Council Mayor Rick Kriseman Date: July 12, 217 Subject: RECOMMENDED
Debt Service Overview. Debt Service Forecast
 F. Debt Service Debt Service Overview... F-1 Debt Service Forecast... F-1 Combined Total Debt Requirements by Fiscal Year... F-2 JP Morgan Chase Revenue Notes (2010)... F-3 FFGFC Loan (2011)... F-4 Banc
ST. PETERSBURG ClTY COUNCIL
 ST. PETERSBURG ClTY COUNCIL Meeting of November 24, 2014 TO: SUBJECT: City Council Chair and City Council Members An Ordinance Enacting Year-End Appropriation Adjustments -FY14 Operating Budget & Capital
A. Executive Summary
 A. Executive Summary Introduction The Local Economy... A-1 Goals... A-3 Key Strategic Initiatives for 2014... A-4 Key Long-term Initiatives... A-5 Adoption Process... A-7 Fiscal Year 2014 Adopted Budget...
CITY OF ST. PETERSBURG ADOPTED OPERATING & CAPITAL IMPROVEMENT BUDGET
 CITY OF ST. PETERSBURG ADOPTED OPERATING & CAPITAL IMPROVEMENT BUDGET FISCAL YEAR 2011 October 1, 2010 September 30, 2011 GOVERNMENT FINANC E OFFICERS ASSOCIATION Distinguished Budget Presentation Award
A. Executive Summary
 A. Executive Summary Introduction Our Vision, Our Budget... A-1 Applying the Vision to the FY15 Budget... A-1 Key Strategic Initiatives for Developing the Budget...A-2 Key Long-term Strategic Initiatives...
Budget In Brief Overview
 Budget In Brief Overview Second Public Hearing -- Fiscal Year 2015 Budget This Budget in Brief presents a condensed overview of the fiscal year 2015 budget for the city of St. Petersburg, Florida as recommended
ADOPTED OPERATING & CAPITAL IMPROVEMENT BUDGET FISCAL YEAR 2007 OCTOBER 1, 2006 SEPTEMBER 30, 2007
 CITY OF ST. PETERSBURG ADOPTED OPERATING & CAPITAL IMPROVEMENT BUDGET FISCAL YEAR 2007 OCTOBER 1, 2006 SEPTEMBER 30, 2007 Rick Baker, Mayor David W. Bill Foster, Esq. Council Chair, District 5 Re!e Flowers
FISCAL POLICIES. The fiscal policies are organized under four subject headings:
 B. Fiscal Policies Fiscal Policies... B-1 General Fiscal Policy... B-2 Annual Operating Revenues & Expenses/All Funds... B-3 Specific Guidelines for Individual Funds... B-8 Investments... B-12 Capital
Revenue Account Codes for FY Reporting Account Code
 Account s for FY 13-14 Reporting Account 311000 Ad Valorem Taxes Property Value Taxes Ad Valorem Taxes 312100 Local Option Taxes Local Option, Use and Fuel Taxes General Government Taxes 312300 County
CITY OF GAINESVILLE. General Fund. Financial Plan for FY 2013 & FY 2014 With Comparative Data for Prior Two Years
 SOURCES OF FUNDS: Revenues: Taxes $41,107,080 $41,306,447 $40,135,652 $40,454,509 $40,601,153 Licenses and Permits $784,536 $854,884 $777,146 $866,146 $923,869 Intergovernmental Revenue $10,395,839 $10,947,689
Budget In Brief Overview
 Budget In Brief Overview Mayor s Recommended Fiscal Year 2016 Budget This Budget in Brief presents a condensed overview of the fiscal year 2016 budget for the city of St. Petersburg, Florida as presented
Revenue Account Codes for FY12-13 Reporting
 311000 Ad Valorem Taxes Property Value Taxes Ad Valorem Taxes 312100 Local Option Taxes Local Option, Use and Fuel Taxes General Government Taxes 312300 County Ninth-Cent Voted Fuel Tax Local Option, Use
GENERAL FUND REVENUES BY SOURCE
 BUDGET DETAIL BUDGET DETAIL The Budget Detail gives more information on the budget, than is shown in the Executive Summary. Detail information is provided on the General Fund, Special Revenue Funds, Enterprise
City of Pensacola Revenue Statements For the Budgeted Year Ended September 30, 2018 With Comparative Amounts for 2015 through 2017 (Unaudited)
") City of Pensacola Revenue Statements For the Budgeted Year Ended September 30, 2018 With Comparative Amounts for 2015 through 2017 (Unaudited) Table of Contents Page General Fund 1 CRA Debt Service Fund
City of Pensacola Revenue Statements For the Budgeted Year Ended September 30, 2018 With Comparative Amounts for 2015 through 2017 (Unaudited) Table of Contents Page General Fund 1 CRA Debt Service Fund
City of Phoenix, Arizona. Monthly Financial Report
 City of Phoenix, Arizona Monthly Financial Report March 212 Monthly Financial Report March 212 Executive Summary The budget amounts in this report represent the official adopted budget, as approved by
City of St. Petersburg, FL 2015 thru 2019 Capital Improvement Plan - Project Descriptions by Fund Housing Capital Improvement Fund (3000)
") Fiscal Year 2015 O-1 CIP Housing & General Fund City of St. Petersburg, FL 2015 thru 2019 Capital Improvement Plan - Project Descriptions by Fund Housing Capital Improvement Fund (3000) This fund was established
Fiscal Year 2015 O-1 CIP Housing & General Fund City of St. Petersburg, FL 2015 thru 2019 Capital Improvement Plan - Project Descriptions by Fund Housing Capital Improvement Fund (3000) This fund was established
St. Petersburg City Council BUDGET, FINANCE & TAXATION COMMITTEE AGENDA. Meeting of NOVEMBER 18, :30 AM City Hall Room 100
 St. Petersburg City Council, FINANCE & TAXATION COMMITTEE AGENDA Meeting of NOVEMBER 18, 2013 9:30 AM City Hall Room 100 Members & Alternate: Support Staff: Chair James R. Jim Kennedy, Jr.; ViceChair Charles
RESOLUTION NO A RESOLUTION ACCEPTING CHANGES TO THE FINANCIAL MANAGEMENT POLICIES AND ACCOUNTING METHODOLOGIES
 RESOLUTION NO. 2013- A RESOLUTION ACCEPTING CHANGES TO THE FINANCIAL MANAGEMENT POLICIES AND ACCOUNTING METHODOLOGIES RECITALS: The City of Ashland prepares the budget and financial reports in keeping
City of Ocala. Fiscal Year Proposed General & Ancillary Funds Budget - Summary. Ocala is a great place to live, play, and prosper
 City of Ocala Fiscal Year 217-218 Proposed General & Ancillary Funds Budget - Summary Ocala is a great place to live, play, and prosper TABLE OF CONTENTS Fiscal Year 217-218 General Fund and Ancillary
DEBT SUPPLEMENT REPORT. of the CITY OF ST. PETERSBURG, FLORIDA. for the Fiscal Year Ended September 30, 2012
 DEBT SUPPLEMENT REPORT of the CITY OF ST. PETERSBURG, FLORIDA for the Fiscal Year Ended Prepared by Department of Finance Table of Contents Introductory Section List of Principal Officials... 5 Letter
City of St. Petersburg, FL 2015 thru 2019 Capital Improvement Plan - Project Descriptions by Fund Bicycle/Pedestrian Safety Grants CIP Fund (3004)
") City of St. Petersburg FY15 Adopted Fiscal Plan Fiscal Year 2015 R-1 CIP Other Funds City of St. Petersburg, FL 2015 thru 2019 Capital Improvement Plan - Project Descriptions by Fund Bicycle/Pedestrian
City of St. Petersburg FY15 Adopted Fiscal Plan Fiscal Year 2015 R-1 CIP Other Funds City of St. Petersburg, FL 2015 thru 2019 Capital Improvement Plan - Project Descriptions by Fund Bicycle/Pedestrian
CITY OF WILLISTON, FLORIDA BUDGET WORKSHOP AGENDA
 CITY OF WILLISTON, FLORIDA BUDGET WORKSHOP AGENDA DATE: MONDAY, JULY 17, 2017 TIME: 5:30 P.M. PLACE: WILLISTON CITY COUNCIL ROOM CALL TO ORDER ROLL CALL MEMBERS: Mayor R. Gerald Hethcoat President Charles
City of Williston Fiscal Year 2017/2018 Adopted Budget
 City of Williston Fiscal Year 2017/2018 Adopted Budget (Adopted on September 20, 2017) Table of Contents Page # Budget Summary Budget Comparison by Fund 1-2 Millage Rate Options 3 Team Count by Department
City of Williston Fiscal Year 2014/2015 Adopted Budget
 City of Williston Fiscal Year 2014/2015 Adopted Budget (Adopted on September 23, 2014) Table of Contents Page # Budget Summary Budget Advertisement 1 Budget Summary by Fund 2-3 Budget Comparison by Fund
CITY OF TAMARAC, FLORIDA
 Temp. Ord. #2327 September 24, 2015 Page 1 of 3 CITY OF TAMARAC, FLORIDA NO. O-2015- AN OF THE CITY COMMISSION OF THE CITY OF TAMARAC, FLORIDA, ADOPTING THE OPERATING BUDGET, REVENUES AND EXPENDITURES,
ORDINANCE CITY OF NEW ORLEANS
 ORDINANCE CITY OF NEW ORLEANS CITY HALL: July 31, 2017 CALENDAR NO. 31,982 NO. MAYOR COUNCIL SERIES BY: COUNCILMEMBERS HEAD, WILLIAMS, GUIDRY, CANTRELL, RAMSEY, BROSSETT AND GRAY (BY REQUEST) An Ordinance
CITY OF TAMARAC, FLORIDA ORDINANCE NO. O
 Ordinance O-2018-12 September 20, 2018 Page 1 of 3 CITY OF TAMARAC, FLORIDA ORDINANCE NO. O-2018-12 AN ORDINANCE OF THE CITY COMMISSION OF THE CITY OF TAMARAC, FLORIDA, ADOPTING THE OPERATING BUDGET, REVENUES
CITY OF WILLISTON, FLORIDA BUDGET WORKSHOP AGENDA
 CITY OF WILLISTON, FLORIDA BUDGET WORKSHOP AGENDA DATE: TUESDAY, AUGUST 12, 2014 TIME: 7:00 P.M. PLACE: WILLISTON CITY COUNCIL ROOM CALL TO ORDER ROLL CALL MEMBERS: Mayor R. Gerald Hethcoat President Jason
BUDGET WORKSHOP. FISCAL YEAR 2018 July 10 th
 BUDGET WORKSHOP FISCAL YEAR 2018 July 10 th AGENDA FY2017 Current Budget FY2017 Budget Review Committee Adjustments FY2018 General Fund Budget Summary FY2018 Highlighted Other Funds Budget Summary Next
CITY FUNDS & FUND ACCOUNTING TAB 19
 CITY FUNDS & FUND ACCOUNTING TAB 19 This page intentionally left blank. Special Revenue Funds Special Revenue Funds are used to account for proceeds of specific revenue sources (other than major capital
Indian River County 2030 Comprehensive Plan
 2030 Comprehensive Plan Chapter 6 Adopted:, 2010 DRAFT January 14, 2010 TABLE OF CONTENTS List of Figures... ii List of Tables... ii Introduction... 1 Existing Conditions... 2 Financial Resources... 2
FISCAL YEAR 2019 July 9 th. FY2018 Budget Review Committee Adjustments. FY2019 Highlighted Other Funds Budget Summary
 BUDGET WORKSHOP FISCAL YEAR 2019 July 9 th AGENDA FY2018 Current Fiscal Year Budget FY2018 Budget Review Committee Adjustments FY2019 General Fund Budget Summary FY2019 Highlighted Other Funds Budget Summary
Citizens of Richmond. Mayor and City Council Tom Butt. City Manager
 FY201718 Organizational Chart Citizens of Richmond Mayor and City Council Tom Butt City Clerk City Manager City Attorney Police Commission Agenda Prep Resolutions Ordinances Contracts Program Development
MANAGEMENT S DISCUSSION AND ANALYSIS
 MANAGEMENT S DISCUSSION AND ANALYSIS As Finance Director of the City of St. Petersburg (City), I offer readers of the City s financial statements this narrative overview and analysis of the financial activities
CITY OF MASCOTTE OPERATING BUDGET FISCAL YEAR GENERAL FUND REVENUE & EXPENDITURE SUMMARY BUDGET
 Page 1 of 37 GENERAL FUND REVENUE & EXPENDITURE SUMMARY ACCOUNT TITLE FY2008-2009 REVENUES $ 3,892,462 EXPENDITURES 3,892,462 RESERVES TRANSFERRED IN (OUT) $ - 2008-2009 2009 Fiscal Year budget is balanced,
DEBT SUPPLEMENT REPORT. of the CITY OF ST. PETERSBURG, FLORIDA. for the Fiscal Year Ended September 30, 2010
 DEBT SUPPLEMENT REPORT of the CITY OF ST. PETERSBURG, FLORIDA for the Fiscal Year Ended September 30, 2010 Prepared by Department of Finance CITY OF ST. PETERSBURG, FLORIDA COUNCIL-MAYOR FORM OF GOVERNMENT
Financial Tables BUDGET SUMMARY ACTUAL ADOPTED AMENDED RECOMM. % TOTAL ALL CITY FUNDS - EXPENDITURE BUDGET General 150
 BUDGET SUMMARY 2016-17 ACTUAL ADOPTED AMENDED RECOMM. % TOTAL ALL CITY FUNDS - EXPENDITURE BUDGET General 150,772,063 157,004,711 155,448,503 158,973,765 26% Special Revenue 105,738,661 110,778,338 113,004,933
Funding Sources. Total Revenues
 Funding Sources The City s revenues come from a wide variety of sources. Revenues and expenses are categorized according to the State of Florida Uniform Accounting System chart of accounts. These standard
APPROVED BUDGET Fiscal Year 2018
 APPROVED BUDGET Fiscal Year 2018 I am pleased to present the City of Pensacola Approved Budget for Fiscal Year 2018. This Budget-In-Brief summary highlights important aspects of the budget in a concise
Village of Elwood Budget for FY Fund Summary
 Fund Summary Description Projected Actual Budget Year End Budget 2017-18 2018-19 2018-19 2019-20 GENERAL Beginning Balance $ 1,742,113 $ 1,893,013 $ 1,893,013 $ 2,375,524 Revenues $ 3,482,778 $ 4,473,324
FY 2018 Budget Resolution Summary Gwinnett County, Georgia
 FY General Fund - 001 Taxes 246,171,202 Inter Governmental Revenue 3,584,798 Licenses and Permits 363,300 Charges for Services 27,327,754 Fines and Forfeitures 4,303,648 Investment Income 866,413 Contributions
Indian River County 2030 Comprehensive Plan
 2030 Comprehensive Plan Chapter 6 Supplement #15; Adopted December 5, 2017, Ordinance 2017-015 TABLE OF CONTENTS List of Figures... ii List of Tables... iii Introduction... 1 Existing Conditions... 2 Financial
REVENUE MANUAL PALM BEACH COUNTY Edition February 2018
 REVENUE MANUAL PALM BEACH COUNTY 218 Edition February 218 TABLE OF CONTENTS About this. 2 Index of Revenues Index of Revenues by Revenue Source Code Index of Revenues by Name. 3 4 1 About this The Palm
General Operating Fund
 General Operating Fund Actual Actual Actual Budget 2010 YTD Projected Recommended Projected Projected Revenues 2007 2008 2009 2010 as of 6/30/10 2010 2011 2011 2012 Property Taxes $13,449,730 $13,842,433
CITY. RIALTO W w w. R I a l t o c a. g o v. Fiscal Year 2009/10 Interim Financial Report. 5 months ended November 30, 2009
 CITY of RIALTO W w w. R I a l t o c a. g o v Fiscal Year 2009/10 Interim Financial Report 5 months ended November 30, 2009 To: The Mayor and City Council City Administrator From: Chief Financial Officer
EXHIBIT G 2016 Variance Budget. 39
 With Comparative Actual Amounts for the Year Ended June 30, REVENUES Ad Valorem Taxes Current Year $85,240,413 85,240,413 86,625,224 1,384,811 79,091,212 Prior Years 150,000 150,000 600,917 450,917 709,202
CAPITAL IMPROVEMENT PROGRAM K-1
 Fund # begins with a Fund Type Fund Type Description/Restrictions 1 General The City's principal operating fund, which is supported by taxes and fees and which, generally, has no restrictions on its use.
Vision, Mission, Values and Critical Success Factors
 Approved Budget Vision, Mission, Values and Critical Success Factors The City of Tallahassee, through workshops, surveys and commission retreats has developed the following vision, mission, and target
Budgeted Fund Structure
 I. Fund Type / Name ed Fund Structure as of Percent Change Over 3/31 General Fund and Sub Funds General Fund and Subfunds $ 917,708,943 $ 965,169,687 $ 2,311,394 $ 967,481,081 5.4 % $ 917,708,943 $ 965,169,687
FY 2019 Chairman s Proposed Budget Gwinnett County, Georgia
 FY Chairman s Proposed FY Proposed General Fund - 001 Taxes 254,281,085 Licenses and Permits 363,300 Intergovernmental 3,789,369 Charges for Services 28,434,324 Fines and Forfeitures 3,669,246 Investment
FY 09/10 ADOPTED GENERAL FUND REVENUES $218,840,522
 GENERAL FUND REVENUES FY 09/10 ADOPTED GENERAL FUND REVENUES $218,840,522 State Revenue 11% Transfers Federal Revenue1% 2% Fund Balance 0.1% Other Local Revenue 2% Other Local Taxes 21% Gen. Property Taxes
State of Kansas City. Water & Sewer Utility Fund 14 1,352,556 Gas Utility Fund 15 58,000
 CERTIFICATE 2016 To the Clerk of Cloud, State of Kansas We, the undersigned, officers of of Concordia certify that: (1) the hearing mentioned in the attached publication was held; (2) after the Budget
CITY OF WOODWARD, OKLAHOMA WOODWARD, OKLAHOMA
 WOODWARD, OKLAHOMA ANNUAL FINANCIAL STATEMENTS AND ACCOMPANYING INDEPENDENT AUDITOR'S REPORT FOR THE YEAR ENDED JUNE 30, 2017 The City of Woodward, Oklahoma Table of Contents Year Ended June 30, 2017 INDEPENDENT
 MANAGEMENT S DISCUSSION AND ANALYSIS As management of the City of Gainesville (the City ), we offer readers of the City s financial statements this narrative overview and analysis of the financial activities
FY BEGINNING BALANCE FY PLANNED REVENUES
 BEGINNING BALANCE REVENUES EXPENDITURES ENDING BALANCE $182,017,646 $1,351,193,000 $1,351,193,000 Aviation 14,216,560 144,132,819 144,132,819 14,216,560 Convention and Event Services 33,234,399 108,647,915
FINAL BUDGET FISCAL YEAR CITY OF NORTH LAS VEGAS, NEVADA NORTH LAS VEGAS REDEVELOPMENT AGENCY NORTH LAS VEGAS LIBRARY DISTRICT
 FINAL BUDGET FISCAL YEAR 2015-2016, NEVADA NORTH LAS VEGAS REDEVELOPMENT AGENCY NORTH LAS VEGAS LIBRARY DISTRICT , NEVADA NORTH LAS VEGAS REDEVELOPMENT AGENCY NORTH LAS VEGAS LIBRARY DISTRICT LOCATED IN
SANIBEL CITY COUNCIL MEETING FIRST BUDGET HEARING SATURDAY, SEPTEMBER 10, :00 A. M.
 SANIBEL CITY COUNCIL MEETING FIRST BUDGET HEARING SATURDAY, SEPTEMBER 10, 2011 9:00 A. M. Mayor Ruane called the meeting to order at 9:03 a.m. Members present: Mayor Ruane, Vice Mayor Denham, Councilman
CITY OF WILLISTON General Fund Chart of Accounts - Fiscal Year FY 2013 Annual Budget
 REVENUES 001-311-100 ADVALOREM TAXES $ 521,532 001-311-200 DELINQUENT AD VALOREM TAXES 7,000 001-312-400 LOCAL OPTION TAX: GAS 6C 32,059 001-312-600 LOCAL GOVT INFRTR TX-DISCRETIONARY 179,934 001-314-100
CITY OF LANCASTER FISCAL BUDGET REVENUE SOURCES
 CITY OF LANCASTER FISCAL 2006-07 BUDGET REVENUE SOURCES TAXES The tax raising authority of cities has been severely limited for the past 25 years. Proposition 13 enacted in 1978 amended the California
Council Communication August 2, 2016, Business Meeting
 Council Communication August 2, 2016, Business Meeting 4th Quarterly Financial Report of the 2015-17 Biennium FROM: Lee Tuneberg, Administrative Services/Finance Director, tuneberl@ashland.or.us BACKGROUND
City of Orangeburg City of Orangeburg City of Orangeburg City of Orangeburg City of Orangeburg
 City of Orangeburg Monthly Financial Report FY 2010 2011 For Month Ending June 30, 2011 City of Orangeburg City of Orangeburg City of Orangeburg City of City of Orangeburg City of Financial Management
State of Kansas City. Water & Sewer Utility Fund 15 1,686,031 Gas Utility Fund 16 54,820
 CERTIFICATE 2015 To the Clerk of Cloud, State of Kansas We, the undersigned, officers of of Concordia certify that: (1) the hearing mentioned in the attached publication was held; (2) after the Budget
CITY OF LAKEWOOD General Fund RECEIPTS AND EXPENSES (ESTIMATED AND ACTUAL) AS OF December 31, 2013
 AS OF December 31, 2013") General Fund Page 1 ACTUAL ACTUAL BUDGET AS OF % Budget Used AS OF AS OF 2011 2012 2013 December 31, 2013 Bench Mark 100% Dec. 31, 2012 Dec. 31, 2011 GENERAL FUND #101 Balance - January 1st 3,301,394 4,328,518
General Fund Page 1 ACTUAL ACTUAL BUDGET AS OF % Budget Used AS OF AS OF 2011 2012 2013 December 31, 2013 Bench Mark 100% Dec. 31, 2012 Dec. 31, 2011 GENERAL FUND #101 Balance - January 1st 3,301,394 4,328,518
CITY OF WILLISTON, FLORIDA BUDGET HEARING AGENDA
 CITY OF WILLISTON, FLORIDA BUDGET HEARING AGENDA DATE: TUESDAY, SEPTEMBER 25, 2018 TIME: 6:50 P.M. PLACE: TEMPORARY WILLISTON CITY COUNCIL ROOM 427 WEST NOBLE AVENUE CALL TO ORDER ROLL CALL MEMBERS: Mayor
CITY OF LAKEWOOD General Fund RECEIPTS AND EXPENSES (ESTIMATED AND ACTUAL) AS OF Decemer 31, 2016
 AS OF Decemer 31, 2016") General Fund AS OF Decemer 31, 2016 Page 1 ACTUAL ACTUAL BUDGET AS OF % Budget Used AS OF AS OF GENERAL FUND #101 Balance - January 1st 5,670,409 6,965,231 5,885,034 5,885,034 6,965,231 5,670,409 Property
General Fund AS OF Decemer 31, 2016 Page 1 ACTUAL ACTUAL BUDGET AS OF % Budget Used AS OF AS OF GENERAL FUND #101 Balance - January 1st 5,670,409 6,965,231 5,885,034 5,885,034 6,965,231 5,670,409 Property
CITY OF PARKLAND ANALYSIS OF REVENUES/SOURCES AND EXPENDITURES/USES GENERAL FUND
 GENERAL FUND % Change From 2018 Locally Levied Taxes Property Taxes 16,246,790 17,496,916 17,702,458 21,004,985 3,508,069 20.0% Franchise Fee - Electricity - - 398,767 1,900,000 1,900,000 n/a Franchise
Highlights from the Proposed Budget Fiscal Year
 Highlights from the Proposed Budget Fiscal Year 2018-2019 City of Plant City Florida Budget Highlights KEY BUDGET HIGHLIGHTS: This budget is a responsible, proactive spending plan that will benefit Plant
CAPITAL IMPROVEMENT PROGRAM K-1
 Fund # begins with a Fund Type Fund Type Description/Restrictions 1 General The City's principal operating fund, which is supported by taxes and fees and which, generally, has no restrictions on its use.
New Mexico Department of Finance and Administration Local Government Division Property Valuation Estimate
 New Mexico Department of Finance and Administration Local Government Division Property Valuation Estimate COUNTY: Colfax County Fiscal Year: 2017-2018 ROUNDED TO NEAREST DOLLAR (A) (B) (C) (D) PROPERTY
Revenue Projections. Ask Departments for requests
 Revenue Projections Adjust Final Budget per City Commission s Direction Expenditure Projections Present Proposed Budget to City Commission Meet with City Leaders Determine Proposed Budget Formulate and
FUND SUMMARIES FUND ACCOUNTING
 FUND SUMMARIES Fund Summaries... 14 Net Expenditures by Fund... 17 General Fund Total General Fund Expenditures by Type... 18 Total General Fund Expenditures by Service Area... 19 Total General Fund Resources
CITY OF PALM BAY, FLORIDA MONTHLY FINANCIAL REPORT (UNAUDITED) MARCH Financial Report Summary
 MARCH Financial Report Summary") (UNAUDITED) The City of Palm Bay, Florida s (the City ) monthly financial report presents an overview and analysis of the City s financial activities during the month of. March is the sixth month of the
(UNAUDITED) The City of Palm Bay, Florida s (the City ) monthly financial report presents an overview and analysis of the City s financial activities during the month of. March is the sixth month of the
Revenue vs Expense for December 2017
 General Fund Revenue vs Expense for December 2017 Sales Tax $6,900,000.00 $6,869,780.06 99.56% County Sales Tax $2,000,000.00 $2,017,372.46 100.87% Payment of ACT 9 Taxes $22,000.00 $42,085.50 191.30%
City of Tarpon Springs, Florida
 City of Tarpon Springs, Florida Comprehensive Annual Financial Report Fiscal Year Ended September 30, 2018 CITY OF TARPON SPRINGS, FLORIDA COMPREHENSIVE ANNUAL FINANCIAL REPORT For the Fiscal Year Ended
ARLINGTON COUNTY, VIRGINIA. County Board Agenda Item Meeting of April 22, 2017
 ARLINGTON COUNTY, VIRGINIA County Board Agenda Item Meeting of April 22, 2017 DATE: April 21, 2017 SUBJECT: Fiscal Year 2018 County Budget Resolution and Appropriations Resolution C. M. RECOMMENDATIONS:
City of St. Petersburg, Florida
 Popular Annual Financial Report For the year ended September 30, 2014 Inside this Report: About the City 2 Understanding Property Taxes 3 Where the Money Comes From Where the Money Goes Enterprise Funds
Allocated Costs A method for allocating overhead time and other expenses to activities that provide direct services.
 Accounting System - The total set of records and procedures used to record, classify, and report information on the financial status and operations of an entity. Accrual A method of accounting that matches
THE CITY OF FREDERICK
 THE CITY OF FREDERICK FISCAL YEAR 2012 BUDGET UPDATE Prepared by the Department of Finance M. Katherine Barkdoll, CPA Director of Budget and Purchasing Gerald D. Kolbfleisch, CPFO Director of Finance Member
Section 19 Revenues. Overview
 Section 19 Revenues Overview Local governments generate revenues from a wide range of sources. The authority for generating revenues is derived from the State Constitution, home rule authority, or Florida
CITY OF LAKEWOOD General Fund RECEIPTS AND EXPENSES (ESTIMATED AND ACTUAL) AS OF December 31, 2010
 AS OF December 31, 2010") General Fund Page 1 Adopted ACTUAL December 31, 2010 ACTUAL ACTUAL ACTUAL ACTUAL BUDGET AS OF % Budget Used AS OF AS OF Dec 31, 2008 GENERAL FUND #101 Balance January 1st 339,518 950,690 1,461,598 1,461,598
General Fund Page 1 Adopted ACTUAL December 31, 2010 ACTUAL ACTUAL ACTUAL ACTUAL BUDGET AS OF % Budget Used AS OF AS OF Dec 31, 2008 GENERAL FUND #101 Balance January 1st 339,518 950,690 1,461,598 1,461,598
D E F I N I T I O N S
 D E F I N I T I O N S Actuals vs. Budget/Estimate This document includes analyses of department appropriations and funds based on variances between the 2017-2018 actual revenues/expenditures and either
Quarterly Financial Status Report
 Quarterly Financial Status Report Prepared by the Finance Department Third Quarter Ending March 31, 2011 This report summarizes the City s overall financial position for the period of July 1, 2010 through
EXHIBIT H. (Continued)
") GENERAL FUND SCHEDULE OF REVENUES, EXPENDITURES AND CHANGES IN FUND BALANCE- BUDGET AND ACTUAL EXHIBIT H Variance Revised Favorable Revenues Budget Actual (Unfavorable) City Taxes Real Estate $ 138,809,023
GENERAL FUND SCHEDULE OF REVENUES, EXPENDITURES AND CHANGES IN FUND BALANCE- BUDGET AND ACTUAL EXHIBIT H Variance Revised Favorable Revenues Budget Actual (Unfavorable) City Taxes Real Estate $ 138,809,023
FY Proposed Budget and Plan of Municipal Services. August 12 th, Presented by Robert Camareno, Interim City Manager
 FY 2013-14 Proposed Budget and Plan of Municipal Services August 12 th, 2013 Presented by Robert Camareno, Interim City Manager 1 City Council Policy Direction Budget developed following City Council policy
Fiscal Year Proposed Annual Budget
 Fiscal Year 2017 18 Proposed Annual Budget FUND General $ 14,431,889 $ 14,875,896 $ 17,241,548 $ 16,199,841 Debt Service 6,972,348 3,846,082 3,846,082 3,841,820 Economic Development 8,653,771 2,647,587
CITY OF WILLISTON, FLORIDA BUDGET HEARING AGENDA
 CITY OF WILLISTON, FLORIDA BUDGET HEARING AGENDA DATE: TUESDAY, SEPTEMBER 22, 2015 TIME: 6:50 P.M. PLACE: WILLISTON CITY COUNCIL ROOM CALL TO ORDER ROLL CALL MEMBERS: Mayor R. Gerald Hethcoat President
RESOLUTION NO. 14R-2434
 RESOLUTION NO. 14R-2434 A RESOLUTION OF THE CITY COMMISSION OF THE CITY OF SARASOTA, FLORIDA, APPROVING A BUDGET; AND MAKING APPROPRIATIONS OF SUMS OF MONEY FOR ALL EXPENDITURES OF THE CITY OF SARASOTA,
CITY OF WILLISTON, FLORIDA BUDGET HEARING AGENDA
 CITY OF WILLISTON, FLORIDA BUDGET HEARING AGENDA DATE: TIME: PLACE: TUESDAY, SEPTEMBER 20, 2016 6:50 P.M. WILLISTON CITY COUNCIL ROOM CALL TO ORDER ROLL CALL MEMBERS: Mayor R. Gerald Hethcoat President
Revenue vs Expense for April 2017
 General Fund Sales Tax $6,900,000.00 $2,237,099.61 32.42% County Sales Tax $2,000,000.00 $658,271.51 32.91% Payment of ACT 9 Taxes $22,000.00 $0.00 0.00% Pay in Lieu of Taxes - Util $1,500,000.00 $433,159.26
CITY OF ROSEBURG, OREGON TABLE OF CONTENTS SPECIAL REVENUE FUNDS
 TABLE OF CONTENTS SPECIAL REVENUE FUNDS Public Works Fund History... 74-81 Grant Special Revenue Fund... 82-84 Hotel/Motel Tax Fund... 85-86 Street Lights and Sidewalk Fund... 87-89 Bike Trail Fund...
Fiscal Year Mid-Year Budget Status Report
 Fiscal Year 2009 Mid-Year Budget Status Report Prepared by the Pinellas County Office of Management & Budget May 19, 2009 TABLE OF CONTENTS SECTION PAGE Report Format 3 I. Executive Summary 3 II. Economic
CITY AND COUNTY OF SAN FRANCISCO STATISTICAL SECTION
 Statistical Section STATISTICAL SECTION This section of the City s comprehensive annual financial report presents detailed information as a context for understanding what the information in the financial
Memorandum. First Quarter Budget Review - Amended City Manager's Annual Budget Report
 First Quarter Budget Review Fiscal 2012-13 City Manager's Transmittal Memorandum TO: FROM: COPIES: SUBJECT: Mayor and City Council Bill Horne, City Manager Jill Silverboard, Assistant City Manager Rod
CAPITAL IMPROVEMENT PROGRAM K-1
 Fund # begins with a Fund Type Fund Type Description/Restrictions 1 General The City's principal operating fund that is supported by taxes and fees and which, generally, has no restrictions on its use.
Tentative Budget FISCAL YEAR CITY OF NORTH LAS VEGAS, NEVADA NORTH LAS VEGAS REDEVELOPMENT AGENCY NORTH LAS VEGAS LIBRARY DISTRICT
 Tentative Budget FISCAL YEAR 2017-2018, NEVADA NORTH LAS VEGAS REDEVELOPMENT AGENCY NORTH LAS VEGAS LIBRARY DISTRICT , NEVADA NORTH LAS VEGAS REDEVELOPMENT AGENCY NORTH LAS VEGAS LIBRARY DISTRICT LOCATED
Nonmajor Governmental Funds
 Nonmajor Governmental Funds Special Revenue Funds Special revenue funds are used to account for specific revenues that are legally restricted to expenditures for particular purposes. Special Programs Fund