Indian River County 2030 Comprehensive Plan
|
|
|
- Roy Welch
- 5 years ago
- Views:
Transcription
1 2030 Comprehensive Plan Chapter 6 Adopted:, 2010 DRAFT January 14, 2010
2 TABLE OF CONTENTS List of Figures... ii List of Tables... ii Introduction... 1 Existing Conditions... 2 Financial Resources... 2 Expenditures Existing Outstanding Debt Local Policies and Practices Analysis Analysis of the Timing and Location of Capital Improvements Needs Assessment Fiscal Assessment Fiscal Assessment Summary Concurrency Management Plan Project Applicability Service Standards Demand Availability of Capacity Regulation Monitoring System Applicability Goal, Objectives and Policies Implementation, Evaluation, and Monitoring Implementation Evaluation and Monitoring Procedures APPENDIX A: FIVE-YEAR SCHEDULE OF CAPITAL IMPROVEMENTS APPENDIX B: PRIORITY TRANSPORTATION CAPITAL IMPROVEMENTS PROGRAM APPENDIX C: 2030 ROADWAY IMPROVEMENT PLAN APPENDIX D: SCHOOL DISTRICT OF INDIAN RIVER COUNTY CAPITAL IMPROVEMENT SCHEDULE APPENDIX E: SCHOOL DISTRICT OF INDIAN RIVER COUNTY SUMMARY OF ESTIMATED REVENUE i
3 List of Figures Figure Title Page 6.1 Ad Valorem Tax Revenue Enterprise Fund Revenue User Fees and Charges Special Assessment Revenue Impact Fee Revenue Local Discretionary Sales Surtax Tourist Development Tax Local Option Fuel Tax Franchise Fee/Tax Revenue Half-Cent Local Government Sales Tax County Revenue Sharing Constitutional Fuel Tax Funds County Fuel Tax Alcoholic Beverage License Tax Mobile Home License Tax Distribution of Revenue by Category General Expenditures by Function Future Capital Improvements Expenditures 36 List of Tables ii
4 Table Title Page 6.1 Sources of Funds (FY 07/08) Optional Tourist Taxes on Transient Rental Facilities Local Fuel Tax Rates Indian River General Revenues by Source Expenditures by Function Existing Long Term Debt Overall General Revenue Projection Summary Earmarked Projected Revenue by Comprehensive Plan Element Tax Base and Millage Projections Concurrency Links Report for Transportation Projects Removed from the 5 Year CIP Concurrency Links Report for Priority Transportation Projects with Construction Start Date Extended Future Capital Improvement Expenditures for Indian River County General Expenditures Projection Summary Projected Expenditures for Water, Sewer, and Solid Waste Overall Operating Cost Projections Estimated Ability to Raise Bonds Without 39 Public Vote 6.17 Bond Schedule Service Level Measures for Concurrency Related Facilities Monitoring System Design Monitoring System Tasks Implementation Matrix Evaluation Matrix 64 iii
5
6 Introduction The (CIE) summarizes the needed capital facilities identified in the other comprehensive plan elements and describes the financial means by which these facilities are to be funded. This element demonstrates the economic feasibility of the entire comprehensive plan and prioritizes the funding of all the public facilities identified in the other comprehensive plan elements based on the level of need and the availability of funds. For purposes of this element, a capital improvement is a substantial facility (land, building, or major equipment) that costs at least $25,000 and which is required to maintain adopted level-of-service standards or to meet objectives identified in the county s comprehensive plan. Included in the CIE are an existing conditions section, an analysis section, a concurrency management section, a goals, objectives, and policies section, and an implementation section. Financial resources and existing local policies and practices are discussed in the existing conditions section. The fiscal condition of both the county and its comprehensive plan, as well as other issues concerning capital improvement projects, are assessed in the analysis section of this element. The administrative framework for maintaining public facility service levels is addressed in the concurrency management section, while the county s overall capital improvements strategy is discussed in the goals, objectives and policies section. Finally, a 5-Year Schedule of Capital Improvements, as well as monitoring and evaluation programs, can be found in the implementation section of this element. 1
7 Existing Conditions Financial Resources One of the chief functions of the is to inventory the major sources of revenue available to the county. These revenue sources determine the county's capability to fund needed capital improvements. Table 6.1 lists the county's local, state, and federal revenue sources and indicates the amount of revenue collected from each source during FY 2007/08. Table 6.1 also shows the percentage distribution of total revenue received by for each of the revenue sources. Table 6.1: Revenue Sources (FY 2007/08) Federal Sources State Sources Local Sources Amount ($1,000) % of Total Revenue Amount ($1,000) % of Total Revenue Amount ($1,000) % of Total Revenue Various Grants $18, % Local Government Half-Cent Sales Tax $7, % Ad Valorem Taxes $99, % Total Federal $18, % County Revenue Sharing $2, % Enterprise Funds $44, % Constitutional Fuel Tax $1, % User Fees and Charges $18, % County Fuel Tax $ % Special Assessments $ % Alcoholic Beverage License Tax $ % Impact Fees $5, % Pari-Mutuel Tax $ % Local Discretionary Sales Surtax $13, % Mobile Home License Tax $ % Tourist Development Tax $1, % Various Grants $16, % Local Option Fuel Tax $3, % Total State $29, % Franchise Tax $9, % Interest Income $16, % Other $7, % Total Local $221, % Total All Sources $269, % 2
8 Local Sources Local sources consist of revenues that are levied, collected and disbursed at the local level solely at the discretion of Indian River County. These local sources are shown in table 6.1, and are described in further detail below. Ad Valorem Taxes (Property Taxes) Ad Valorem taxes are taxes levied on the assessed value (net of any exemptions) of real and personal property. This tax is commonly referred to as property tax. Ad valorem taxes are generally assessed in mills; that is, thousandths of a dollar of assessed value. The state mandated millage cap is 10 mills per local government, excluding voted millages. In FY 2007/08, applied an aggregate millage rate of The Board of County Commissioners' policies allow revenue from ad valorem taxes to be used for both operating and capital project expenditures. Figure 6.1: Ad Valorem Tax Revenue $120,000 $100,000 $80,000 $99,687 $99,827 $84,914 $74,179 $70,134 $62,676 $60,000 $40,000 $20,000 $ Revenue (in thousands) Source: Finance Department Figure 6.2: Enterprise Fund Reserve Table 6.1 shows that, in FY 2007/08, Indian River County collected approximately $99,827,000 in ad valorem taxes. Ad valorem taxes represented 37.06% of all revenues collected by in FY 2007/08. $60,000 $50,000 $40,000 $30,000 $20,000 $36,943 $40,447 $50,238 $49,824 $46,114 $44,677 Figure 6.1 displays the ad valorem tax revenue collected by over the last six fiscal years. Over that time period, ad valorem tax revenue increased 59.27%. $10,000 $ Revenue (in thousands) Source: Finance Department 3
9 Enterprise Funds Within governmental entities, various departments often exist that provide goods and services to the public in a manner similar to the private sector. Such departments, classed under the general title enterprise funds, must raise revenues from outside the government sector. Enterprise departments assess a fee to the customer using the goods or services provided by that department. In Indian River County, the Utility System, Solid Waste Disposal District, Golf Course, and Building Division are enterprises. Table 6.1 shows that enterprise fund revenue represented 16.59% of s total source of funds for FY 2007/08. Figure 6.2 displays the enterprise fund revenue collected by Indian River County over the last six fiscal years. Over that time period, enterprise fund revenue increased 20.93%. User Fees and Charges User fees and charges represent revenue received by the county for providing various general services. User fees and charges are necessary because taxes alone cannot totally keep up with the increasing costs of Figure 6.3: User Fees and Charges services. This category includes fees collected by the Tax Collector s Office, the $20,000 $18,152 $18,205 $18,998 $18,679 Clerk of the Circuit Court, the Property $18,000 $16,000 Appraiser s Office, the Sheriff s $13,683 $14,283 $14,000 Department, and the Recreation and Parks $12,000 Department. This category also includes $10,000 other miscellaneous user fees charged by the $8,000 $6,000 county for general services not financed by $4,000 other fund sources. In FY 2007/08, user $2,000 fees and charges represented 6.93% of all $- funds collected by Figure 6.3 displays user fees and charges collected by over the last six fiscal years. Over that time period, revenue from user fees and charges has varied, but overall increased 36.51%. Revenue (in thousands) Source: Finance Department Special Assessments 4
10 Special assessments are compulsory payments levied on real property for specific benefits generated by public investments or services; the assessment levied must fairly reflect the Figure 6.4: Special Assessments Revenue actual costs of the improvements. County revenues which fall under the general category of special assessments consist of $600 $552 $494 street paving assessments, street lighting $500 district assessments, as well as assessments $392 $377 $400 $335 $345 for water, sewer, and drainage improvements. Expenditures of special assessment revenue are restricted to public $300 $200 improvement projects that directly benefit $100 the property owner or payee. For example, $- street paving assessment revenues must be spent on paving streets that directly benefit the payer of the assessment. Special Assessment funds represented 0.20% of county funds for FY 2007/08 as shown in table 6.1. Figure 6.4 displays the revenue collected by through special assessments over the last six fiscal years. Revenue (in thousands) Source: Finance Department Figure 6.5: Impact Fee Revenue Impact Fees An impact fee is a one time charge, fee, or assessment levied as a condition of issuance of subdivision or site plan approval, issuance of a building permit, approval of a certificate of occupancy, or other development or construction approval when any portion of the revenues collected is intended to fund any portion of the costs of capital improvements for any public facilities. $40,000 $35,000 $30,000 $25,000 $20,000 $15,000 $10,000 $5,000 $- $36,297 $24,634 $10,410 $7,007 $4,597 $5, Revenue (in thousands) Source: Finance Department Since 1986, has levied traffic impact fees on new development projects. In June of 2005, began to levy 8 new impact fees. At the same time, the County increased the existing traffic impact fee rates. The current impact fees include: traffic, emergency services, parks and recreation, public schools, solid 5
11 waste, correctional facilities, law enforcement, libraries, and public buildings. Figure 6.5 shows the substantial increase in impact fee revenues related to the addition of the eight new impact fees and the increase in traffic impact fee rates. In FY 2003/04, traffic impact fees represented 5.17% of funds collected by. In contrast, traffic impact fees and the eight additional impact fees represented 14.31% of funds collected by for FY 2004/05. Since FY 2004/05, impact fee funds have dramatically declined with the slowing economy. Local Discretionary Sales Surtax Local governments are authorized to levy numerous types of local discretionary sales surtaxes pursuant to s , F.S. Under the provisions of s , F.S., the local discretionary sales surtaxes apply to all transactions subject to the state tax imposed on sales, services, rentals, admissions, and other authorized transactions. The surtax is computed by multiplying the rate imposed by the county where the sale occurs by the amount of the taxable sale. This sales tax can be levied on most transactions under $5,000. Under this category, is eligible to impose a Local Government Infrastructure Surtax of either 0.5% or 1.0% and a School Capital Outlay Surtax of up to 0.5%. Currently, imposes only the 1.0% Infrastructure Surtax. $18,000 $16,000 $14,000 $12,000 $10,000 $8,000 $6,000 $4,000 $2,000 $- Figure 6.6: Local Discretionary Sales Surtax $11,6 78 $12,850 $15,583 $15,736 Source: Finance Department $14,550 $13, Revenue (in thousands) The Local Government Infrastructure Surtax must be enacted by a majority vote of the Board of County Commissioners and approved by voters in a countywide referendum. This surtax, which may be imposed for a maximum period of fifteen years, was initiated by in April, 1989, and was renewed by voters in November, Generally, the proceeds must be expended to finance, plan, and construct infrastructure; to acquire land for public recreation or conservation or protection of natural resources; and to finance the closure of local government-owned solid waste landfills that are already closed or are required to close by order of the Department of Environmental Protection. Table 6.1 shows that local sales surtax revenue represented 5.09% of all funds collected by Indian River County in FY 2007/08. Figure 6.6 displays the Local Discretionary Sales Surtax revenue 6
12 received by over the last six fiscal years. This local revenue source increased by 17.43% over that period. Distribution of surtax proceeds is based on the specifics of an interlocal agreement or through a formula based on population. In, Local Infrastructure Surtax revenue is distributed to county government and municipal governments through a formula based on population. Twenty-one of the sixty-seven Florida counties levy a Local Government Infrastructure Surtax. Within s region, Brevard, Palm Beach, and St. Lucie counties do not levy the surtax, while Martin County levies a 0.5% infrastructure surtax. Okeechobee County is eligible to levy the infrastructure surtax, but instead levies a Small County Surtax of 1%, which is another local discretionary sales surtax. Tourist Development Tax Any county in the state may, subject to a vote of the citizenry, impose a Tourist Development Tax. The transient rental trade is the primary base for the levy of the tourist tax. Any lodging agreement for six months or less is subject to the tax. $1,800 $1,600 $1,400 $1,200 $1,000 $800 $600 $400 $200 $- Generally, the tourist tax levy is one or two percent. Counties, however, may set an additional one percent above the original tax through an extraordinary vote of the governing board or by referendum. Currently, imposes the original two percent tourist tax as well as an additional one percent tax. Sixty Florida counties out of sixty-seven total counties currently levy a tourist tax. Of those sixty counties, forty-two counties, including, impose an additional one percent tourist tax. Figure 6.7: Tourist Development Tax Revenue Table 6.2 displays the tourist taxes imposed in counties that are geographically proximate to Indian River County. Compared to neighboring counties, imposes a similar level of tourist taxes. Brevard, Palm Beach, and St. Lucie Counties have the highest tourist tax levy of the six counties listed (5.0%). and Martin County each have a tourist tax rate of 4.00%. Okeechobee County has the lowest tourist tax levy. $1,287 $1,082 $1,676 $1,517 Source: Finance Department $1,449 $1, Revenue (in thousands) 7
13 Table 6.2: Optional Tourist Taxes on Transient Rental Facilities County Original Tourist Tax Additional Tax Professional Sports Franchise Facility Tax Additional Professional Sports Franchise Tax Maximum Potential % Levy Total % Levy Brevard 2.00% 1.00% 1.00% 1.00% 5.00% 5.00% Indian River 2.00% 1.00% 1.00% % 4.00% Martin 2.00% 1.00% 1.00% % 4.00% Okeechobee 2.00% 1.00% % 3.00% Palm Beach 2.00% 1.00% 1.00% 1.00% 5.00% 5.00% St. Lucie 2.00% 1.00% 1.00% 1.00% 5.00% 5.00% Shading indicates those counties eligible to impose a particular tax Source: Florida Legislative Committee on Intergovernmental Relations, Local Government Financial Information Handbook. August The Local Option Tourist Tax can be used for the following purposes: (1) Acquire, construct, operate, and promote one or more publicly owned and operated convention centers, such as sports stadiums, coliseums, or auditoriums within the district that the tax is imposed; (2) Promote and advertise tourism nationally, internationally, and in the State of Florida; (3) Fund convention bureaus and other tourist information bureaus as county agencies or by contract with the Chamber of Commerce or similar associations in the county; (4) Finance beach development and restoration as well as shoreline protection and restoration of inland lakes and rivers to which there is public access; (5) Construct, improve, maintain, and promote museums, zoos, fishing piers, or nature centers which are publicly owned and operated either by the county or a not-for-profit organization which opens the facilities to the public (applicable to those counties with a population less than 500,000); (6) Pledge the revenues to secure and liquidate revenue bonds issued by the county, subject to certain limitations. 8
14 Figure 6.7 shows the Tourist Development Tax revenue received by over the last six fiscal years. Over that time period, tourist tax revenue received by fluctuated based on market conditions, but had an overall increase of 23.15%. Local Option Fuel Tax Local governments are authorized to levy up to twelve cents of local option fuel taxes in the form of three separate levies. These levies are: a one to six cent local option fuel tax; a one to five cent local option fuel tax; and a ninth cent fuel tax. $3,400 $3,300 $3,200 $3,100 $3,000 $2,900 $2,800 Figure 6.8: Local Option Fuel Tax Revenue currently imposes the full Revenue (in thousands) six cents of the one to six cent fuel tax. This tax applies to every net gallon of motor and diesel fuel sold within a county. The one to six cent Source: Finance Department fuel tax may be authorized by an ordinance adopted by a majority vote of the governing body or voter approval in a county-wide referendum. Generally, the proceeds may be used to fund transportation expenditures. Table 6.1 shows that local option fuel tax revenue represented 1.13% of all funds collected by Indian River County for FY 2007/08. Figure 6.8 shows that local option fuel tax revenue for the county has decreased overall by.52% from what it was in Fiscal Year Even though local option fuel tax revenues were less in fiscal year 2008 than what they were in fiscal year 2003, the county received a significant increase in local option fuel tax revenue in fiscal years 2004 through This was largely associated with the building boom. All sixty-seven Florida counties levy a portion of the original local option fuel tax. Sixty-five counties levy the full $0.06, while the remaining two counties levy a portion of the tax. Table 6.3 shows the local fuel taxes levied in and in other counties in the region. Saint Lucie, Martin, Okeechobee, and Palm Beach counties levy the highest fuel taxes at $0.12 per gallon. Those four counties impose the Ninth Cent Fuel Tax. is eligible to levy the Ninth-Cent Fuel Tax either by extraordinary vote of the Board of County Commissioners or by voter approval in a countywide referendum, but does not currently levy the tax. Forty-nine of the sixty-seven Florida counties levy the Ninth-Cent Fuel Tax. $3,059 $3,324 $3,367 $3,319 $3,290 $3,
15 Table 6.3: Local Fuel Tax Rates County One to Six Cent Local Option Fuel Tax One to Five Cent Local Option Fuel Tax Ninth Cent Fuel Tax Total Local Fuel Tax Brevard $ $0.06 Indian River $ $0.06 Martin $0.06 $0.05 $0.01 $0.12 Okeechobee $0.06 $0.05 $0.01 $0.12 Palm Beach $0.06 $0.05 $0.01 $0.12 St. Lucie $0.06 $0.05 $0.01 $0.12 Source: Florida Legislative Committee on Intergovernmental Relations, Local Government Financial Information Handbook. August As shown in table 6.3, four counties in the region, Martin County, Okeechobee County, Palm Beach County, and St. Lucie County, levy the entire One to Five Cent Local Option Fuel tax. This second local option fuel tax is a one to five cent levy upon every net gallon of motor fuel sold in a county. Indian River County can levy this second tax through an ordinance adopted by a majority plus one vote of the Board of County Commissioners or by voter approval in a countywide referendum, but does not currently levy the tax. Twentyone of the sixty-seven Florida counties impose at least a portion of the One to Five Cent Local Option Fuel Tax. Figure 6.9: Franchise Fee/Tax Revenue $12,000 $10,000 $8,000 $6,000 $4,000 $2,000 $- $9,733 $9,318 $9,443 $7,941 $6,720 $6, Revenue (in thousands) Franchise Fee/Tax Source: Finance Department Counties and municipalities may exercise their home rule authority to impose a fee upon a utility for the grant of a franchise and the privilege of the utility using the local government s rights-of-way to conduct the utility s business. Franchise fees are typically levied through a franchise agreement negotiated between the local government and the utility provider. receives franchise revenue from electric, water, sewer, garbage, and cable television franchises. 10
16 Table 6.1 shows that franchise fee revenue represented 3.51% of all funds collected by Indian River County in FY 2007/08. Figure 6.9 shows that over the last six fiscal years franchise fee revenue collected by increased 51.77%. Other Miscellaneous Revenue Included in this category are various administrative fees, licenses and permits, fines, interest income, rental income, private contributions, and other miscellaneous revenues. This source of revenue for represented 2.93% of all funds collected in FY 2007/08. Borrowing The county uses borrowing as a financing vehicle to raise money for public purposes that are beyond the realm of current cash reserves, operating revenue and reasonable taxation. Borrowing money to pay for capital improvements can be done through either short-term or long-term financing. Short term financing is usually accomplished by the use of bond pools, notes, private placements with banks, and the public placement of Voted General Obligation debt. Long term financing is usually achieved through the issuance of bonds sold on the public market. The county may sell bonds for capital improvements without a referendum of the voters if the pledge used for the bond is a non-ad valorem revenue source. Conversely, any bond issue pledging ad valorem taxes requires approval through a voter referendum. General Obligation Bonds are bonds that are secured by the full faith and credit of the county. These bonds are secured by a pledge of the issuer's ad valorem taxing power. According to state law, the amount of ad valorem taxes necessary to pay the debt service on general obligation bonds is not subject to the constitutional property tax millage limits. Such bonds constitute debts of the issuer and require approval through a voter referendum prior to issuance. Revenue bonds are bonds payable from a specific source of revenue, where the full faith and credit of the issuer is not pledged to repay the bonds. Because revenue bonds are payable from identified sources of revenue, bond holders may not compel taxation or legislative appropriation of funds for payment of debt service. Pledged revenues may be derived from operation of financed projects, grants, or other specified non-ad valorem taxes. A public referendum is not required prior to issuance or validation of such obligations. In the past, the county has issued revenue bonds to finance improvements to its sanitary sewer, potable water, and golf course facilities. Revenue bonds have been issued by the Housing Authority to help finance the provision of more low-income housing units in the county. Also, revenue bonds have been issued to finance the cost of construction of various capital improvement projects. Deposits from bond revenues are put into the respective bond fund accounts for these projects, 11
17 whereby funds are specifically designated for a particular project, and user charges are used to pay off the debt. Special assessment bonds are bonds issued to pay for capital improvements that impact specific areas or groups of property owners. Proceeds from the assessments levied against benefiting property owners are used to pay off the bond debt. The issuance of these bonds does not need to be approved by voter referendum. Revenue bonds and special assessment bonds are similar in nature, except that special assessment bond debt is paid-off by assessments levied against benefiting property owners and not from ongoing user charges. The county has issued special assessment bonds for solid waste disposal. The issuance of tax anticipation or bond anticipation notes is an example of a short-term (less than five years) method of financing. Notes usually have higher interest rates than bonds and have shorter maturity dates than bonds. Tax anticipation notes are issued in advance of a new fiscal year to cover gaps in the budget before property taxes are received, while bond anticipation notes are issued in anticipation of the receipt by the county of proceeds from the sale of corresponding future bond issues. The county currently has no outstanding tax or bond anticipation notes. Additional Optional Local Revenue Sources Use of additional revenue sources may occasionally be necessary, depending on priorities mandated by the Board of County Commissioners and the availability of existing revenue sources. Indian River County has two options to increase local revenues. These are to implement new taxes that are permitted by state regulation and/or to increase existing taxes and fees that are imposed by the county. Additional local revenue sources available to include the Ninth Cent Fuel Tax, the One to Five Cent Local Option Fuel Tax, and the Professional Sports Franchise Facility Tax. Both the Ninth Cent Fuel Tax and the One to Five Cent Local Option Fuel Tax are taxes on the purchase of fuel. With the Ninth Cent Fuel Tax, a one cent per gallon tax on motor fuel and special fuel can be levied on fuel purchases in the county. Revenue from the Ninth Cent Fuel Tax may be shared with municipalities, but counties are not required by law to share the proceeds. Authorized uses for revenue collected from the Ninth Cent Fuel Tax include paying the costs and expenses of establishing, operating, and maintaining a transportation system and related facilities. Additional uses include funding the acquisition, construction, reconstruction, and maintenance of roads. The One to Five Cent Local Option Fuel Tax is a one to five cents tax that can be levied upon every gallon of motor fuel sold in. Revenues from this fuel tax must be shared among all eligible jurisdictions in the county as a result of an interlocal agreement or by an historical transportation expenditures formula. Authorized uses for revenue collected from the One to Five 12
18 Cent Fuel Tax include transportation expenditures needed to meet the requirements of the Capital Improvements Element of the Comprehensive Plan. A Professional Sports Franchise Facility Tax is a levy of up to 1% on any lodging agreement for six months or less, within. Revenue from this tax may be used to pay the debt service on bonds issued to finance the construction, reconstruction, or renovation of a professional sports franchise facility. State Sources Revenue classified as state sources may be generated locally but collected by the state and returned to the county. For example, state sources may originate from state general revenues and be shared by the state according to state revenue allocation formulas. Table 6.1 displays the state revenue sources applicable to. These sources are described in further detail below. Figure 6.10: Half Cent Sales Tax Revenue Local Government Half-Cent Sales Tax The Local Government Half Cent Sales Tax Program allocates 8.814% of net sales tax proceeds remitted by sales tax dealers in a county to a special account administered by the Department of Revenue; this account is the Local Government Half Cent Sales Tax Clearing Trust Fund. These funds are then earmarked for distribution to the governing body of the county and each municipality within the county. Distribution of these monies within the county is determined by a formula that uses a weighting factor based on $10,000 $9,000 $8,000 $7,000 $6,000 $5,000 $4,000 $3,000 $2,000 $1,000 $- the population of the incorporated and unincorporated areas and multiplies this factor by 8.814% of the sales tax proceeds received for the county. In FY 2007/08, received $7,588,000 through the half-cent sales tax. As shown in table 6.1, that amount represented 2.82% of all funds collected by during the 2007/08 fiscal year. Figure 6.10 displays the funds made available to through the half-cent local government sales tax over the last six fiscal years. Over those six fiscal years, s half-cent sales tax revenue increased 8.37%. Occasionally, governments can receive supplemental distributions by meeting special eligibility criteria; however, in no case can the total supplemental and ordinary distribution exceed the $7,002 $7,564 $8,747 $8,777 Source: Finance Department $8,123 $7, Revenue (in thousands) 13
19 maximum per capita amount allowed by law. Governments are allowed wide latitude in using the half cent sales tax. For counties, the law provides only that half cent sales tax revenue be used for countywide tax relief or countywide programs. County Revenue Sharing The current structure of the county revenue sharing program consists of two revenue sources. These sources include 2.90% of net cigarette tax collections and 2.044% of sales and use tax collections. Proceeds are collected by the state and then distributed to eligible counties based on an allocation formula. There are no use restrictions on the distributed revenue; however, there are some statutory limitations regarding these funds being used as a pledge for indebtedness. To receive distribution proceeds through the county revenue sharing program, counties must meet the following criteria: (1) That law enforcement officers and firefighters are certified and meet state requirements; (2) That certification of taxable value for a property tax levy is made in a timely and correct manner to the Department of Revenue; (3) That the county s most recent financial reports have been sent to the Department of Banking and Finance, and post audits of these statements and accounts have been provided. Table 6.1 shows that county revenue sharing Figure 6.11: County Revenue Sharing $3,500 $3,000 $2,500 $3,118 $3,084 $2,894 $2,835 $2,850 $2,452 $2,000 $1,500 $1,000 $500 $ Revenue (in thousands) Source: Finance Department FIGURE 6.12: Constitutional Fuel Tax Revenue $1,800 $1,750 $1,700 $1,650 $1,600 $1,763 $1,729 $1,716 $1,664 $1,618 $1,601 $1,550 $1, Revenue (in thousands) Source: Finance Department 14
20 funds represented 1.06% of all funds collected by in FY 2007/08. Figure 6.11 shows that, over the last six fiscal years, county revenue sharing proceeds received by Indian River County varied over time, but overall increased by 16.23%. Constitutional Fuel Tax Constitutional fuel tax is defined as an excise or license tax of two cents per gallon imposed upon the first sale or first removal from storage (after importation into Florida) of motor fuel. Revenues from this levy become state funds at the time of collection by the refiner, importer or wholesaler. In its current form, the constitutional fuel tax is a state-shared revenue source for counties only. Applying a distribution formula, the state allocates proceeds to counties to the extent necessary to comply with all obligations to or for the benefit of holders of bonds, revenue certificates, and tax anticipation certificates or any refunds secured by any portion of the tax proceeds. After complying with the necessary debt service obligations, the state distributes a county s surplus funds to its governing body. Table 6.1 shows that revenue received from the constitutional fuel tax levy represented 0.60% of total revenue received by Indian River County in FY 2007/08. Figure 6.12 shows that, over the last six fiscal years, constitutional fuel tax revenue received by increased 1.06%. County Fuel Tax The county fuel tax is levied on motor fuel at the rate of one cent per net gallon. The legislative intent of this tax is to reduce a county s reliance on ad valorem taxes. Funds received from this tax can be used by a county for transportation-related expenses, including the reduction of bond indebtedness incurred for transportation purposes. $800 $780 $760 $740 $720 Figure 6.13: County Fuel Tax $779 $780 $757 $742 $713 $710 $700 $680 $ Revenue (in thousands) Source: Finance Department Table 6.1 shows that funds received through the county fuel tax levy represented 0.26% of all revenue collected by in FY 2007/08. Figure 6.13 shows that, over the last six fiscal years, county fuel tax revenue received by decreased 0.42%. Alcoholic Beverage License Tax 15
21 Alcoholic beverage license taxes are levied on manufacturers, distributors, vendors, and sales agencies of alcoholic beverages in Florida. The tax is administered, collected, enforced, and distributed to local governments by the Division of Alcoholic Beverages and Tobacco within the Department of Business and Professional Regulation. Twenty-four percent of the license taxes imposed on the sale of beer, wine and liquor collected within a county is returned to the county Tax Collector. The remaining funds are used to operate the division and contribute to the operation of the Office of the Secretary of Business Regulation. Table 6.1 shows that the county received approximately $49,000 from this tax in FY 2007/08, 0.02% of all revenue received by Indian River County. Figure 6.14 shows that, over the last six fiscal years, alcoholic beverage license tax revenue received by fluctuated, but overall remained about the same. $60 $50 $40 $30 $20 $10 $- Figure 6.14: Alcoholic Beverage License Tax $44 $50 $51 $44 Source: Finance Department $54 $ Revenue (in thousands) Pari-Mutuel Tax Revenue generated through license fees and taxes related to Pari-Mutuel betting is deposited into the Pari-Mutuel wagering trust fund. According to Florida Statutes, a guaranteed entitlement of $29,915,500 is deducted from the trust fund for equal distributions among Florida s sixty-seven counties, providing each county s general revenue fund with $446,500. Table 6.1 shows that revenue received from the Pari-Mutuel tax represented 0.17% of revenues received by in FY 2007/08. Uses for this revenue are determined by the Board of County Commissioners. Mobile Home License Tax An annual license tax is levied on all mobile homes and park trailers, and on all travel trailers and fifth-wheel trailers exceeding thirty-five feet in body length. The license taxes, ranging from $20 to $80 depending on body length, are collected in lieu of ad valorem taxes. The taxes are collected by the county tax collectors and remitted to the Department of Highway Safety and Motor Vehicles. 16
22 From each license, two deductions are made. The first is a deduction of $1.50 by the Department of Highway Safety and Motor Vehicles with proceeds deposited into the State General Revenue Fund. The second is a deduction of $1.00 with proceeds deposited into the Florida Mobile Home Relocation Trust Fund. The remaining balance is deposited into the License Tax Collection Trust Fund for distribution to units of local government. A county government is eligible to receive proceeds from this tax if taxable mobile home units are located in its unincorporated area. An authorized use of the proceeds is not specified in the current law. Figure 6.15: Mobile Home License Tax Revenue $160 $140 $120 $100 $80 $60 $40 $20 $- $105 $143 $101 $105 $105 $ Revenue (in thousands) Table 6.1 shows that funds received through Source: Finance Department the mobile home license tax represented 0.04% of all revenue received by in FY 2007/08. Figure 6.15 shows that, over the last six fiscal years, mobile home license tax revenue received by remained the same. Various Grants Table 6.1 shows that funds received in the form of state grants represented 6.03% of funds received by the county in FY 2007/08. State grant funds received by the county in FY 2007/08 originated from the State of Florida Department of Community Affairs, the Florida Housing Finance Agency, the State of Florida Department of Environmental Protection, the State of Florida Department of State Division of Library Services, the State of Florida Department of Transportation, the State of Florida Commission for the Transportation Disadvantaged, the State of Florida Department of Management Services, the State of Florida Department of Revenue, the Department of Health, Department of Law Enforcement, and the Department of Agriculture and Consumer Services. Federal Sources Federal funds are either granted directly to local governments or passed through state agencies for administration and monitoring. These grants are usually distributed on a competitive basis rather than by formula allocations, thereby making projections of future revenues difficult. For the purpose of revenue projections, these sources will be assumed to remain constant. 17
23 During FY 2007/08, the county received approximately $18,567,000 in federal funds. These funds represented 6.89% of all funds received by in FY 2007/08. Overall Revenue Sources As mandated by state statute, the financial resources of the county are categorized according to the state Chart of Accounts. These categories include taxes, licenses and permits, intergovernmental revenue, charges for services, fines and forfeitures, interest, and miscellaneous revenues. Table 6.4 identifies the total amount of historic revenue generated from these sources for fiscal years 2002/2003 through 2007/08. Fiscal Year Taxes Table 6.4: General Revenues By Source Licenses & Permits Intergovernmental Revenue Charges for Services Fines & Forfeitures Miscellaneo us Revenues 2002/03 $86,120,084 $567,403 $35,213,140 $13,683,108 $1,584,737 $9,703,817 $146,872, /04 $95,675,370 $1,033,394 $26,588,303 $14,282,587 $1,508,786 $14,545,961 $153,634, /05 $104,012,925 $1,354,282 $35,973,818 $18,151,546 $1,715,875 $42,170,294 $203,378, /06 $116,088,548 $1,274,638 $38,261,489 $18,204,600 $2,069,593 $40,182,777 $216,081, /07 $130,158,069 $896,612 $54,252,074 $18,997,529 $2,403,093 $26,773,753 $233,481, /08 $119,915,640 $9,904,590 $49,065,955 $18,678,544 $2,137,413 $18,486,026 $218,188,168 Source: Comprehensive Annual Financial Report, 2008 Figure 6.16 displays the distribution of revenue by the same categories listed in table 6.4 for each of the last six fiscal years. Totals 18
24 Figure 6.16: Distribution of General Revenues By Category % % 58.64% 51.14% 1.08% 9.32% 23.98% 0.39% 9.47% 0.98% 9.30% 17.31% 0.67% 20.73% 0.84% 8.92% 17.69% 0.67% % 55.75% % 54.96% % 18.60% 0.96% 8.42% 0.59% 17.71% 11.47% 1.03% 8.14% 23.24% 8.47% 0.98% 8.56% 22.49% Taxes Licenses & Permits Intergovernmental Revenue Charges for Services Fines & Forfeitures Miscellaneous Revenues Expenditures In the previous sub-section, the various revenue and income sources currently utilized by Indian River County were reviewed. This sub-section of the identifies how those monies are allocated to meet the county s needs. Table 6.5 presents the county s overall general expenditures by category for fiscal years 2002/2003 through 2007/08. Table 6.5: General Government Expenditures By Function Fiscal Year 2002/ / / / / /08 General Government $23,785,570 $26,473,300 $26,797,183 $56,232,514 $59,527,672 $27,701,150 Public Safety $47,565,048 $55,792,130 $57,161,390 $66,984,420 $73,275,110 $74,038,252 Physical Environment $18,587,122 $3,305,670 $4,573,196 $9,498,973 $35,044,820 $33,806,207 Transportation $20,120,969 $23,038,234 $22,369,128 $31,966,926 $55,039,978 $53,489,116 Economic Environment $583,850 $627,914 $712,517 $1,054,239 $968,227 $4,579,574 Human Services $6,540,673 $7,197,342 $7,279,582 $12,470,222 $13,862,463 $12,619,575 Culture/Recreation $23,253,841 $15,022,196 $21,359,218 $16,919,464 $24,904,678 $21,299,763 Court Related $5,998,260 $6,210,614 $5,630,734 $5,915,727 $6,649,724 $6,940,682 Debt Service $4,520,637 $3,727,534 $3,495,500 $4,406,090 $8,126,643 $7,873,176 TOTAL $150,955,970 $141,394,934 $149,378,448 $205,448,575 $277,399,315 $242,347,495 Source: Comprehensive Annual Financial Report,
25 Table 6.5 shows expenditures in nine categories. Depending on the county s activities in any given fiscal year, the level of expenditures may fluctuate for certain categories. Figure 6.17 displays the percentage distribution of s general expenditures over the last six fiscal years. General Government A major classification of services provided by, the general government expenditure category, includes activities undertaken by the legislative and administrative branches of the county government. Departments such as the Board of County Commissioners, County Administrator, Personnel, and Purchasing fall into this category as do all Constitutional Officers, except the Sheriff. As shown in table 6.5, $27,701,150 was spent on general government services in FY 2007/08. Between fiscal years 2002/03 and 2007/08, general government expenditures increased by 16.46%. General government services represented 11.43% of all county expenses in FY 2007/08. The significant increase in general government expenditures in Fiscal Years 2005/06 and 2006/07 was due to the construction of new public buildings, including the construction of the new county administration building and the expansion of the jail. Public Safety The Sheriff s Department, Fire Services, Advanced Life Support, Emergency Management, and the Medical Examiner fall under the category of Public Safety. As shown in table 6.5, the county, in FY 2007/08, spent $74,038,252 for public safety services. Between fiscal years 2006/07 and 2007/08, public safety expenditures increased by 1.04%. Since FY 2002/03, public safety expenditures have increased by 55.66%. Public safety represented 30.55% of all county expenses in FY 2007/08. Physical Environment This classification encompasses the county s water and waste water utilities, the Solid Waste Disposal District (SWDD), the Soil Conservation District, and the Environmentally Sensitive Land Acquisition Fund. Table 6.5 shows that $33,806,207 was spent on these activities in FY 2007/08. Between fiscal years 2006/07 and 2007/08, physical environment expenditures decreased by 3.53%. Since FY2002/03, physical environment expenditures have increased by 81.88%. Physical environment services represented 13.95% of all county expenses in FY 2007/08. Transportation Departments under this category include Road and Bridge, County Engineering, Secondary Roads Construction, and Traffic Engineering. These departments are responsible for designing, constructing, overseeing, and maintaining the county s roads and drainage systems. As shown in table 6.5, the county spent $53,489,116 on transportation facilities in FY 2007/08. Since FY 2002/03, 20
26 transportation expenditures have increased by %. Transportation expenses represented 22.07% of all county expenses in FY 2007/08. Economic Environment Included in this category are the costs of providing services which develop and improve the economic condition of the community and its citizens. Veteran Services, the Housing Authority, and the Economic Development Division of the Chamber of Commerce undertake this function. Table 6.5 shows that those agencies spent $4,579,574 on economic environment services in FY 2007/08. Between fiscal years 2006/07 and 2007/08, economic environment expenditures increased by %. Since FY 2002/03, economic environment expenditures have increased by %. Economic environment expenses represented 1.89% of all county expenses in FY 2007/08. Figure 6.17: General Government Expenditures by Function % 15.8% 3.0% 4.0% 15.4% 12.3% 13.3% 0.4% 4.3% 18.7% 2.6% 4.4% % 2.3% 16.3% 10.6% 5.1% 0.4% 17.9% 2.3% 3.8% % 14.3% 4.9% 0.5% 3.1% 15.0% 27.4% 2.1% 2.9% % 8.2% 32.6% 4.6% 15.6% 0.5% % 21.5% 2.9% 2.4% 9.0% 5.0% 0.3% 12.6% 19.8% 30.6% % 3.2% 2.9% 8.8% 5.207% 13.9% 22.1% 1.9% General Government Public Safety Physical Environment Transportation Economic Environment Human Services Culture/Recreation Court Related Debt Service Human Services Human Services cover the cost of providing services for the care, treatment, and control of human illness, injury or disabilities, and for the welfare of the community as a whole and its individuals. The Health Department, Welfare, Medicaid, and Children s Services fall into this category. Table 6.5 shows that the county spent $12,619,575 on human services in FY 2007/08. Between fiscal years 21
27 2006/07 and 2007/08, human services expenditures decreased by 8.97%. Since FY 2002/03, human services expenditures have increased by 92.94%. Human services represented 5.21% of all county expenses in FY 2007/08. Culture/Recreation All costs associated with providing and maintaining cultural and recreational facilities and activities for the benefit of citizens and visitors fit into this category. County libraries, parks, recreation operations, and the golf course are included here. As shown in table 6.5, the county spent $21,299,763 on these services in FY 2007/08. Between fiscal years 2006/07 and 2007/08, cultural/recreation expenditures decreased by 14.47%. Since FY 2002/03, cultural/recreation expenditures have decreased by 8.4%. Culture/recreation expenses represented 8.79% of all county expenses in FY 2007/08. Court Related All costs of operating the judicial branch of Government are classified here. This category includes the County Court, Circuit Court, State Attorney s Office and Public Defender. As shown in table 6.5, expenditures from this category totaled $6,940,682 in FY 2007/08. Between fiscal years 2006/07 and 2007/08, Court Related expenditures increased by 4.38%. Beginning in FY 1997/1998, the State of Florida mandated that the county begin recording Court Related costs as a separate expenditure item. Court Related costs represented 2.86% of all county expenses in FY 2007/08. Debt Service Debt service consists of interest and payments made by the county on its debt. This figure includes principal retirement, interest and other miscellaneous debt service. As table 6.5 indicates, total county debt service expenditures were $7,873,176 in FY 2007/08. Between fiscal years 2006/07 and 2007/08, debt service expenditures decreased by 3.12%. Since FY 2002/03, debt service expenditures have increased by 74.16%. Debt service expenses represented 3.25% of all county expenses in FY 2007/08. Existing Outstanding Debt At the end of FY 2008/09, s outstanding debt, comprised of revenue bonds and general obligation bonds, stood at $117,510,000. This is shown in table 6.6. In 1993, the county took advantage of lower interest rates and refunded any debt that had reasonable future economic savings. Enterprise Funds support 57.9% of the overall debt (Utility Dept 44.17%; and Golf Course 13.74%), leaving $57,160,000 in bonds paid from general governmental funds. In November 2001, Indian River County issued the remaining $11,000,000 of the $26,000,000 Environmentally Sensitive Land 22
28 Acquisition general obligation bonds originally approved by voters in Also in 2001, the County issued $16,810,000 in Spring Training Facility Bonds to finance the acquisition and expansion of the Dodgertown spring training facility. Two bonds were refinanced in 2003 to take advantage of lower interest rates: the 1993 Series Refunded Recreational Revenue Bonds and the 1995 Series Environmental Lands Acquisition Bonds. In 2004, voters approved the issuance of up to an additional $50,000,000 in Environmentally Sensitive Land Acquisition general obligation bonds. As a result, issued $48,600,000 in Environmentally Sensitive Land Acquisition general obligation bonds in Finally, the county refinanced its 1996 Series Water and Sewer Bonds in 2005 and the majority of its 1993 Series A Water and Sewer Bonds in The County kept a portion of the 1993 Series A Water and Sewer Bonds with a maturity of 2011 because it was more cost efficient than rolling the entire amount into the 2009 Water and Sewer Bonds. Table 6.6: Existing Long Term Debt Initial Amount Amount Average Interest Rate Final Maturity Bond Rating Security Pledge Water & Sewer Revenue Bonds: 1993 A Series $47,190,000 $3,030, % 2011 AAA/FGIC (Insured) Water & Sewer Revenues 2005 Series $27,675,000 $23,320, % 2022 AAA/FGIC (Insured) 2009 Series $26,370,000 $26,370, % 2024 AA+/AA Water & Sewer Revenues Water & Sewer Revenues Recreation Revenue Bonds 2001 Series Spring Training Facility $16,810,000 $12,895, % 2031 AAA/FGIC (Insured) State Funds, ½ Cent Sales Tax, Tourist Tax 2003 Series Refunding Recreational Revenue $6,455,000 $3,685, % 2016 AAA/AMAC (Insured) Golf Course Net Income, Fronton Revenue and Subordinate Lien on One Half Cent Sales Tax Voted G.O. Bonds Environmental Lands Acquisition 2001 Series $11,000,000 $5,955, % 2016 AAA/FSA (Insured) General Obligation Environmental Lands Acquisition 2003 Series $7,800,000 $1,210, % 2010 AAA/AMAC (Insured) General Obligation Environmental Lands Acquisition 2006 Series $48,600,000 $41,045, % 2021 AAA/MBIA (Insured) General Obligation 23
29 Table 6.6: Existing Long Term Debt Initial Amount Amount Average Interest Rate Final Maturity Bond Rating Security Pledge Total Bonds Outstanding $117,510,000 Source: Budget 2009/10. Local Policies and Practices As part of the capital improvements planning process, it is important to do an inventory of current policies and practices that guide the timing, location, expansion, or increase in capacity of capital facilities. These policies and practices relate to the county's existing level-ofservice standards, impact fee programs, comprehensive plan, and enterprise fund accounts. Existing Level-of-Service Standards Level-of-service (LOS) standards are indicators of the extent or degree of service provided by, or proposed to be provided by, a facility based on and related to the operational characteristics of the facility. Level-of-service standards indicate the capacity per unit of demand of each public facility. Level-of-service standards can affect the timing and location of development by guiding development to areas where facilities may have excess capacity. has level-of-service standards for capital facilities as follows: Correctional Facilities (Countywide) 4.5 beds per 1,000 permanent plus weighted peak seasonal population Fire/EMS (Countywide, excluding Indian River Shores).089 Stations per 1,000 permanent plus weighted peak seasonal population Law Enforcement (Unincorporated County) 2.09 officers per 1,000 permanent plus weighted peak seasonal population Libraries (Countywide) 580 building square feet per 1,000 permanent plus weighted peak seasonal population 3,200 library material items per 1,000 permanent plus weighted peak seasonal population 0.7 computers per 1,000 permanent plus weighted peak seasonal population 0.2 other library equipment items per 1,000 permanent plus weighted peak seasonal population 24
30 Potable Water (County Service Area) 250 gallons per day per equivalent residential unit Public Buildings (Countywide) 1.99 building square feet per capita for permanent plus weighted peak seasonal population Parks/Recreation (Unincorporated County) 6.61 acres per 1,000 permanent plus weighted peak seasonal population Sanitary Sewer (County Service Area) 250 gallons per day per equivalent residential unit Schools (School Service Area): 100 percent of Florida Inventory of School Houses (FISH) capacity for each public school type (elementary, middle, and high). Solid Waste (Countywide) 2.2 tons per capita per year or 3.67 cubic yards per capita for permanent plus weighted peak seasonal population per year Stormwater Management New drainage systems shall mitigate the impacts of a 25 year/24 hour design rainfall event Minimum road crown elevation for existing roads shall be raised during resurfacing/rebuilding to the flood elevation resulting from the 2 year/24 hour storm event on local roads The center two lanes of rebuilt roads must be at or above flood levels resulting from a 10 year/24 hour storm event on Arterial and Collector roads All drainage basins will meet the following level-of-service standards: By year/24 hour storm event By year/24 hour storm event By year/24 hour storm event Transportation (Roadways) Level-of-Service D during peak hour, peak season, and peak direction conditions on all TRIP grant funded roads as well as all freeway, arterial, and collector roadways, with the exception of the following two, which will operate at level of service E plus 20%: 27 th Ave South County Line to SR rd Ave - Oslo Road to 16 th Street 25
31 For SIS/Florida Intrastate Highway System roadways, level of service B is adopted for rural areas, and level of service C is adopted for urban areas. Transit One-hour headways shall be maintained on all fixed transit routes Level-of-service standards are discussed in further detail in each individual Comprehensive Plan Element. Capital Improvements Program A capital improvements program (CIP) is a program for capital expenditures to be incurred each year over a fixed period of years to meet anticipated capital needs. In, the CIP identifies the projects that the county plans to undertake in the next five years and presents an estimate of the costs and the resources needed to finance the projects. Revenue sources within the first year of the CIP reflect current fund balances as well as anticipated annual revenue collection. Within the first three years of the CIP, projects are funded entirely with committed revenue sources. Committed revenue sources are revenue sources that currently exist. Projects in years four and five of the CIP are funded partially through planned revenue sources. Planned revenue sources are sources available to the County that have not been utilized. In this case, the one planned revenue source programmed in the CIP is the imposition of an additional six cents of local option gas tax. The (CIE) itself consolidates the capital improvements needs of all elements of the Comprehensive Plan into an overall five-year Capital Improvements Schedule. The overall program lists the needs, costs, timeframes, priorities, and the necessary financial resources to implement the identified capital improvement projects in the various elements of the plan in the next five years. Impact Fees/Capacity Charges Impact fees are charges to developers for off-site improvements that must be provided by the local government to serve new development. This financing technique is one strategy that the county uses for implementing the CIE. Currently, the county has nine impact fees in place; these are traffic impact fees, which became effective in 1986, and eight additional impact fees which became effective in June of Those eight impact fees are assessed for the following service delivery categories: solid waste, public schools, fire/ems, parks and recreation, correctional facilities, law enforcement, libraries, and public buildings. In October 1999, the county s water and sewer impact fees were reclassified as capacity charges. A capacity charge is a fee charged to the direct beneficiaries of water and sewer improvements in order 26
32 to fund the capital cost incurred by the water and wastewater utility to provide capacity to serve new utility customers. Enterprise Funds Enterprise funds are used to account for operations financed and operated in a manner similar to private business enterprises, when the intent of the governing body is that the full costs of providing the service to the general public on a continuing basis be financed or recovered primarily through user charges. Currently, the county operates its solid waste services, golf course facility, building department services, and utility services as enterprise funds. As a tool for affecting the timing and location of development, user charges may be designated to vary with the quantity and location of the service provided. Thus, charges could be greater for providing services further from urban areas, and less for distances closer to urban areas. In this way, user charges could affect the economics of development locating further away from urban areas. Analysis The analysis section of this element assesses the county's historic and projected revenue and expenditure patterns to determine the county s fiscal ability to provide adequate capital improvements. These capital improvements have been identified in other comprehensive plan elements and are needed to meet the demands of existing and future development. As part of this analysis, revenue and expenditure projections are identified and analyzed, and a fiscal assessment of needs (costs) versus projected available revenue is included. Analysis of the Timing and Location of Capital Improvements Objectives and polices from the Future Land Use Element, Potable Water Sub-Element, Sanitary Sewer Sub-Element, Recreation and Open Space Element, Public School Facilities Element, and the Transportation Element, as well as policies followed by the Sheriff s office and County departments such as Emergency Management, Corrections, Libraries, and Solid Waste, have the most direct effect on the timing and location of capital improvements. Through planning for future improvements to the transportation system, the Transportation Element directly affects the development potential of property. Also affecting the development potential of property are the water and sewer connection requirements and the availability of public school capacity. Within the Future Land Use Element (FLUE), the assignment of land use density and intensity, as well as the urban service area regulations, affect the timing and location of capital improvements. Consistent with the FLUE and urban service area requirements in the county s comprehensive plan, the county provides public facilities and services to promote compact development by emphasizing 27
33 infill development in urban areas and maximizing the efficiency of existing facilities and services in under utilized areas. The FLUE also limits urban sprawl and ensures that adequate facilities will be present to accommodate future growth. Maximizing the use of existing facilities and controlling urban sprawl will contribute to a cost-effective and efficient service delivery system. Using the county s official Future Land Use Map and Future Thoroughfare Plan Map, as well as the county s water and wastewater connection matrix, in planning for future locations of facilities provides for efficient and orderly expansion of public facilities, provides for efficient growth in desired areas, discourages growth in undesirable areas, and protects environmentally sensitive lands. Consistent with that policy, development orders are issued only after a determination that adequate public facilities and services will be available to meet the demand of the new development. Overall, the objectives of the FLUE, Transportation Element, Parks and Recreation Element, Potable Water Sub-Element, Sanitary Sewer Sub-Element, and the Public School Facilities Element are furthered by the extension of facilities and services in a logical and efficient manner. This is accomplished by implementing and enforcing the adopted and its corresponding Schedule of Capital Improvements. Successful and efficient implementation of those items ensures that facilities and services will be in place concurrent with future development. If a capital improvements project is not included in the adopted Schedule of Capital Improvements and the improvement is required to maintain adopted level-of-service standards, future development will be prohibited until the necessary facilities are in place. This, in effect, indirectly controls the timing and location of future development and, in turn, furthers the implementation of the Future Land Use Element and Transportation Element objectives. Appendix A constitutes the county s five year schedule of capital improvements. This CIP is important to ensure that improvements to existing facilities and construction of new facilities are completed as needed. By implementing the five year schedule of capital improvements, the county will ensure that appropriate areas will be served by needed facilities, thus maintaining adopted levels of service. Besides implementing the components of this element, the county coordinates with the St. Johns River Water Management District (SJRWMD) and the various state agencies, such as the Florida Department of Transportation, when those agencies program facility or service improvements within. The continuation of this coordination will ensure that the plans of state agencies and the SJRWMD will be consistent with the Comprehensive Plan and the timing and location of capital improvements as identified in the CIE. Projected Revenues In order to develop a financially feasible schedule of capital improvements, projected revenues over the five-year CIP time period have been calculated. These revenues are then compared to 28
34 anticipated expenditures on capital improvements. For the first three years of the plan, only committed and available revenue sources are utilized. In developing revenue estimates for this process, historic revenue trends, current and anticipated economic conditions, population and growth trends, legislative changes, and any other factors that may impact future revenue streams were considered. This analysis is far more complex than projecting prior trends into the future. This is evident in the forecasted revenues shown in this section. While the historical data show a solid increase in most revenue sources in the most recent five-year period, estimates going forward show a decrease for the first couple years followed by moderate increases. This is consistent with an anticipated economic slowdown in the near future followed by a moderate recovery thereafter. Many of the revenue sources identified in the CIP have unique characteristics. For example, sales taxes react differently than gas taxes to similar circumstances. The analysis accounts for such differences. Because gas taxes are levied on a per gallon basis rather than a percentage basis like the sales tax, gas taxes do not increase as a result of rising prices the way sales taxes do. Further, gas taxes do not typically decline as significantly as sales taxes during economic slowdowns. Property taxes, impact fees, user fees, interest earnings, and other revenues have additional behavioral characteristics that were considered in estimating future receipts. All such estimates were developed with the use of professionally accepted methodologies. To ensure a financially balanced CIP (see Appendix A), scheduled expenditures were constrained by projected revenues. As part of this capital improvements element, the county's general revenues have been projected for fiscal years 2009/10 through 2013/14. This section addresses general revenues and earmarked projected revenues as well as the county's tax base and millage rate projections. Overall Projected Revenues Table 6.7 summarizes the county's projected overall revenues for fiscal years 2009/10 through 2013/14. These revenues include the county's general governmental funds, enterprise funds, and internal funds. As table 6.7 shows, general revenue collected by the county is projected to decrease slightly over the next few fiscal years and increase by only 3.01% by fiscal year 2013/14. General revenue is projected to increase from $320,680,692 in FY 2009/10 to $330,339,507 in FY 2013/14. FY Table 6.7: Overall General Revenue Projection Summary 2009/ / / / /14 TOTAL Taxes $107,466,450 $100,034,202 $100,034,000 $105,211,000 $154,026,137 $566,771,789 29
35 FY Table 6.7: Overall General Revenue Projection Summary 2009/ / / / /14 TOTAL Licenses & Permits $23,278,151 $21,416,000 $21,416,000 $21,951,000 $22,500,000 $110,561,151 Intergovernment $17,169,945 $15,796,000 $23,546,000 $24,135,000 $24,738,000 $105,384,945 Charges for Services $79,890,835 $77,126,877 $82,001,239 $89,401,400 $100,283,000 $428,703,351 Fines & Forfeitures $358,000 $329,000 $329,000 $337,000 $345,000 $1,698,000 Interest & Misc. $26,130,217 $24,040,000 $24,040,000 $24,641,000 $25,257,000 $124,108,217 Other Sources $66,387,094 $46,414,474 $53,248,311 $66,513,995 $3,190,370 $235,754,244 TOTAL $320,680,692 $285,156,553 $304,614,550 $332,190,395 $330,339,507 $1,572,981,697 Source: Office of Management and Budget. Earmarked Projected Revenues Earmarked revenues are revenues that are restricted in terms of use. Such revenues may be found in the Transportation Element, Sanitary Sewer Sub-Element, Potable Water Sub-Element, and Solid Waste Sub-Element. Table 6.8 provides a summary of earmarked revenue projections by applicable comprehensive plan element for fiscal years 2009/10 through 2013/14. As shown in table 6.8, projected transportation revenues are broken down by their sources. Earmarked projected transportation revenues are expected to increase by 36.75% over the next five fiscal years, from $20,532,337 in FY 2009/10 to $28,077,000 in FY 2013/14. Although transportation revenues are expected to increase from FY 09/10 to FY 13/14, it is important to note that FY 09/10 transportation revenue is $34,258,364 less than FY 2004/05 transportation revenue. This reflects the substantial decrease in traffic impact fee revenue from the housing boom years to the present. Part of the transportation revenue increase for fiscal year 2012/13 and fiscal year 2013/14 is from a planned 6 cent per gallon tax increase on gasoline (Local Option Gas Tax). In fiscal year 2013/14, the proposed additional 6 cent per gallon gas tax plus the county s current 6 cent per gallon gas tax (total of 12 cents per gallon) will be bonded to produce a significant revenue increase in FY 2013/14. For potable water and sanitary sewer, earmarked revenue is expected to increase by.97% over the next five fiscal years, from $41,368,779 in FY 2009/10 to $41,769,000 in FY 2013/14. Over the next five years, earmarked revenue for solid waste is expected to increase by.98% from $10,869,504 in FY 2009/10 to $10,976,000 in FY 2013/14. 30
36 Table 6.8: Earmarked Projected Revenue by Comprehensive Plan Element Fiscal Year Local Option Gas Tax Constitutional Gas Tax County Gas Tax Transportation Traffic Impact Fee 1 cent optional sales tax Interest on Gas Tax Total Potable Water & Sanitary Sewer Solid Waste 2009/ / / / /14 $3,012,000 $1,514,477 $667,860 $1,600,000 $13,323,000 $415,000 $20,532,337 $41,368,779 $10,869,504 $2,952,000 $1,484,000 $655,000 $2,200,000 $12,657,000 $500,000 $20,448,000 $40,541,000 $10,652,000 $2,982,000 $1,499,000 $662,000 $3,500,000 $12,657,000 $500,000 $21,800,000 $40,946,000 $10,759,000 $5,658,000 $1,514,000 $669,000 $5,000,000 $12,657,000 $500,000 $25,998,000 $41,355,000 $10,867,000 $5,715,000 $1,529,000 $676,000 $7,000,000 $12,657,000 $500,000 $28,077,000 $41,769,000 $10,976,000 Source: Office of Management and Budget. Tax Base, Assessment Ratio, Millage Rate Table 6.9 summarizes the county's tax base projections which are categorized by fund through FY 2013/14. Overall, the countywide ad valorem tax base is the same as the general fund category identified in table 6.9. Table 6.9: Tax Base and Millage Projections Fiscal Year General Fund M.S.T.U. Emergency Services District Environmental Land Acquisition Tax Base Millage Tax Base Millage Tax Base Millage Tax Base Millage 2009/10 $15,917,623, $9,038,817, $13,391,098, $15,917,623, /11 $14,644,214, $8,315,712, $12,319,810, $14,644,214, /12 $14,644,214, $8,315,712, $12,319,810, $14,644,214, /13 $15,010,319, $8,523,605, $12,627,805, $15,010,319, /14 $15,385,577, $8,736,695,506 Source: Office of Management and Budget $12,943,500, $15,385,577, As shown in table 6.9, the county has a Municipal Service Taxing Unit (MSTU) and an emergency services district, each with a separate millage. Changes to the Capital Improvements Program 31
37 With the ongoing depressed housing market, challenges in the national and global financial markets, and the reduction in building permit activity, county revenue again decreased and is expected to remain lower than projected in the prior year s Capital Improvements Program (Fiscal Years 2008/09 through 2012/13). As a result of the decrease in projected revenue and the associated decrease in projected demand for public facilities, the overall Capital Improvements Program has been scaled back. Consequently, a number of projects within the 2008/09 through 2012/13 CIP have either had their costs modified, have been deferred, or have had their time frame extended. None of the changes will impact development project concurrency reservations, and only a few changes to the transportation section of the CIP directly impact capacities within the county s concurrency management system. Because of the downturn in the housing market, financial markets, and construction activity, it is anticipated that the capacity associated with these projects will not be needed until later dates. The specific concurrency related projects removed from the transportation section of the CIP are detailed in Table 6.10 and include roadway segments only on 27 th Avenue. For these projects, funds were to come from the county s gas tax, optional sales tax and impact fees. Even though these projects are being deleted, portions of 27 th Avenue will still be built with the Oslo Road improvement projects. Of the projects being deleted from last year s CIP and shown in Table 6.10, none have had their added capacity relied upon for vesting development projects for concurrency. On links that are associated with the deleted projects listed in Table 6.10, the available capacity ranges from available peak hour, directional trips to almost 600 available peak hour, directional trips. While the County s current Concurrency Links Report shows that existing available capacity on 27 th Avenue is minimal, it is expected that the available capacity will soon increase due to a number of factors. With the depressed housing market, there are some development projects that previously had trips vested for concurrency, but because of expiring concurrency certificates will now have or will soon have their reserved trips removed from the concurrency management system. Also, traffic counts conducted by the County this year indicate a further reduction in traffic volume on most roadways. These new traffic counts will also soon be added to the County s concurrency management system. Both the increased capacity and decreased demand will add additional available capacity back to County roadways and will likely further decrease the need for scheduling, financing, and constructing transportation projects in the County s CIP. By deleting the transportation projects as shown, the county can utilize its limited resources to complete priority concurrency related projects within the overall capital improvements program. In effect, the county needs to delete some projects so that other projects will remain fundable with a diminishing county budget. By funding only necessary projects, the County is also maintaining a financially feasible capital improvements element. 32
38 Table 6.10: Concurrency Links Report for Transportation Projects Removed from the 5 Year CIP Link # Link Description Capacity* Total Available* Demand* 2420N 27 th Avenue, Oslo Rd. to 4 th Street 1, S 27 th Avenue, Oslo Rd. to 4 th Street 1, N 27 th Avenue, 4 th Street to 8 th Street 1, S 27 th Avenue, 4 th Street to 8 th Street 1, N 27 th Avenue, 8 th Street to 12 th Street 1, Transportation Project Removed from CIP 27th Avenue, 12th Street to 5th St. SW, four lanes (2 miles)** 27th Avenue- 12th Street to SR 60** 27th Ave, 5th ST SW to 13th St SW (four lanes (2 miles)** 2440S 27 th Avenue, 8 th Street to 12 th Street 1, N 27 th Avenue, 12 th Street to S. VB City Limits 1, S 27 th Avenue, 12 th Street to S. VB City Limits 1, N 27 th Avenue, S. VB City Limits to 16 th Street 1, S 27 th Avenue, S. VB City Limits to 16 th Street 1, N 27 th Avenue, 16 th Street to S.R. 60 1, S 27 th Avenue, 16 th Street to S.R. 60 1, N 27 th Avenue, S. County Line to Oslo Road 1, S 27 th Avenue, S. County Line to Oslo Road 1, , N 27 th Avenue, Oslo Rd. to 4 th Street 1, S 27 th Avenue, Oslo Rd. to 4 th Street 1, *Peak hour, directional trips ** Capacity for these links reflects the adopted level of service standard of E+20 Several nonconcurrency related projects within the various other CIP categories have also either had their costs modified, have been deferred, or have had their timeframe extended. These projects include: Archie Smith Fish House (Conservation and Aquifer Recharge category), 800 MHz Radio Expansion (Emergency Services category), New Courtroom Facilities (General Services category), Oslo Boat Ramp and Parking (Parks and Recreation category), and several convenience center expansions (Solid Waste category). Priority Transportation Capital Improvements Program (Appendix B) The Priority Transportation Capital Improvements Program (Appendix B) is a list of transportation projects for which a specific start date and a specific completion date are listed. As allowed by state law, the County considers the additional capacity which these roadway improvement projects will produce as available now for development projects where the roadway improvement project will be under construction no later than three years after issuance of the first building permit for the development project. Within the Priority Transportation Capital Improvements Program, seven projects have been removed. Three of those projects were removed because they are currently under construction or are now completed. Those projects are: CR 512, from Sebastian Middle School to I-95; State Road 60, from West of I-95 to 82 nd Avenue (started utilities relocation); and 16 th /17 th Street, from 500 west of 14 th Avenue to west of U.S. 1. The other four projects were removed from the Priority Transportation Capital Improvements Program because they have had their construction dates moved out to beyond three years. Those projects are: CR510, from CR512 to 75 th Court; CR 510, from 75 th Court to 61 st 33
39 Drive; CR 510, from 61 st Drive to Indian River; and 43 rd Avenue, from 12 th Street to Oslo Road. In all cases, the added road capacity from these projects is no longer necessary to maintain concurrency for previously approved development projects. The four remaining projects within the Priority Transportation Capital Improvements Program have had their construction start dates modified. While construction on 43 rd Avenue, from 18 th Street to 26 th Street, will start approximately six months sooner than anticipated, construction on the three remaining projects will start approximately 1 to 1 ½ years later than previously anticipated. These projects and their available peak hour, directional trip capacity are listed in Table 6.11.All of the transportation projects listed in the table have sufficient available peak hour, directional trip capacity to accommodate already approved developments. Altering the start date of construction, therefore, does not impact already approved developments. Table 6.11: Concurrency Links Report for Priority Transportation Projects with Construction Start Date Extended Transportation Project Description Listed in CIP Link # Link Description Capacity with Project* Total Demand* Available* 43rd Avenue, 12th Street to 18th Street, 2925N 43 rd Avenue, 12 th Street to 16 th Street 1, , four lanes (1 mile) 2925S 43 rd Avenue, 12 th Street to 16 th Street 1, , N 43 rd Avenue, 16 th Street to S.R. 60 1, , S 43 rd Avenue, 16 th Street to S.R. 60 1, , rd Avenue,18th Street to 26 th Street, 2935N 43 rd Avenue, S.R. 60 to 26 th Street 1, , four lanes 2935S 43 rd Avenue, S.R. 60 to 26 th Street 1, , Oslo Road, 27th Avenue to 43rd 2550E Oslo Road, 43 rd Avenue to 27 th Avenue 1, Avenue, four lanes (1 mile) 2550W Oslo Road, 43 rd Avenue to 27 th Avenue 1, , Oslo Road, 43rd Avenue to 58th 2540E Oslo Road, 43 rd Avenue to 58 th Avenue 1, , Avenue, four lanes (1 mile) 2540W Oslo Road, 43 rd Avenue to 58 th Avenue 1, , *Peak hour, directional trips Needs Assessment Based on public facility requirements identified in the other comprehensive plan elements, this needs assessment identifies the capital improvements required to provide sufficient infrastructure to meet proposed levels of service for existing and new development. For purposes of the CIE, a capital improvement is a substantial facility (land, building or major equipment) that costs at least $25,000 and may be paid for in phases. Table 6.12 identifies capital improvement needs through fiscal year 2013/14 for conservation & aquifer recharge, emergency services, general services, law enforcement & corrections, recreation and open space, stormwater management, sanitary sewer and potable water, solid waste, transportation, and public schools. Appendix A provides a detailed list of projects associated with each of the comprehensive plan elements as well as those projects associated with individual department capital improvements programs. Not included in Appendix A are projects associated with the Public School Facilities Element. Those projects are found in Appendix D. Detailed capital improvement schedules, which list each improvement project, are provided in each applicable Comprehensive Plan Element or within individual master plans for the respective governmental service. 34
40 Table 6.12: Future Capital Improvement Expenditures for & School District Element or Category 2009/ / / / /14 Conservation & Aquifer Recharge $925,000 $400,000 $100,000 $0 $0 Emergency Services $5,386,705 $0 $ 0 $2,200,000 $0 General Services $300,000 $0 $4,100,000 $0 $0 Law Enforcement & Corrections $1,483,060 $0 $0 $4,320,400 $740,800 Recreation & Open Space $4,193,545 $2,205,000 $4,975,000 $4,375,000 $1,575,000 Sanitary Sewer & Potable Water $11,128,277 $3,246,877 $3,394,239 $3,305,400 $1,925,000 Solid Waste $6,882,000 $380,000 $1,480,000 $2,045,000 $6,722,000 Stormwater Management $1,050,000 $650,000 $8,300,000 $10,050,000 $8,550,000 Transportation $46,287,000 $31,604,843 $29,458,888 $46,800,262 $45,285,194 Total $77,635,587 $38,486,720 $51,808,127 $73,096,062 $64,797,994 Public School Facilities* $34,281,614 $9,862,021 $28,962,000 $9,466,996 $27,472,089 *The School District of has the fiscal responsibility for capital improvement expenditures for public school facilities. Figure 6.18 graphically displays the projected capital improvements expenditures for the county during the next five fiscal years. As indicated, the sum of the total projected costs for each of the elements for the five year period is $305,824,490. Within the first fiscal year, projects are funded from current fund balances as well as anticipated annual revenues. For the first three years of the CIP, projects are funded entirely with committed revenue sources. Committed revenue sources are revenue sources that currently exist. Projects in years four and five of the CIP are funded partially through planned revenue sources. Planned revenue sources are sources available to the County that have not been utilized. In this case, the one planned revenue source programmed in the CIP is the imposition of an additional six cents of local option gas tax. Some public facilities, such as public education and health systems, are provided countywide, and the county itself does not have fiscal responsibility for these systems. The County, however, is required by State Statutes to provide some funds to the Health Department (IRCHD). 35
41 Consistent with State law, the Florida Department of Children and Family Services appoints the management of the IRCHD, maintains the financial records, and prepares its own financial report separate from the county. In the Future Land Use and Introductory Elements of the county s comprehensive plan, there is an analysis and description of public schools and health centers. Based on general locational criteria for public schools and health centers, it is assumed that any new facilities which may be constructed in the county by 2013/14 will be located within existing infrastructure service areas or designated expansion areas. Therefore, these systems may be considered to be adequately served by appropriate infrastructure. $50,000,000 Figure 6.18: Future Capital Improvement Expenditures $40,000,000 $30,000,000 $20,000,000 $10,000,000 $0 FY 2009/10 FY 2010/11 FY 2011/12 FY 2012/13 FY 2013/14 Conservation & Aquifer Recharge Emergency Services General Services Law Enforcement & Corrections Recreation & Open Space Sanitary Sewer & Potable Water Solid Waste Stormwater Management Transportation Fiscal Assessment This section examines the county's ability to fund the capital improvements listed in table 6.12, with the exception of public school facilities, and assesses whether sufficient revenue will be available within the existing budget framework utilized by the county to fund the needed improvements at the time that those improvements will be required. The School District of is responsible for funding the capital improvements for public school facilities listed in table The School District s adopted Summary of Capital Improvement Program (Appendix D) and Summary 36
42 of Estimated Revenue (Appendix E) provide a detailed review of the financial feasibility of the School District s Five Year Capital Plan. The assessment process consists of projecting future receipts of revenues and comparing these receipts against anticipated expenditures. Using this process, it is possible to quantify annual revenue surpluses and shortfalls, providing a basis for examining opportunities for financing the needed capital improvements. The expenditure estimates include the operating costs. Projected Expenditures Table 6.13 shows the county's projected expenditures for fiscal years 2009/10 through 2013/14. By fiscal year 2013/14, the county is projected to have annual expenditures totaling $330,339,507. In FY 2013/14, the category projected to have the largest expenditures is the Enterprise Funds/Other category. For the five-year period beginning in fiscal year 2009/10 and ending in fiscal year 2013/14, the county's expenditures are projected to increase by 3.01%. Table 6.13: Overall General Expenditures Projection Summary FY 2009/ / / / /14 General Gov t. Services $26,242,373 $26,332,000 $31,090,000 $27,665,000 $28,357,000 Public Safety $72,529,735 $66,645,000 $68,311,000 $76,539,400 $72,509,800 Physical Environment $2,238,838 $1,318,000 $8,675,000 $10,332,000 $8,839,000 Transportation $48,216,910 $33,563,843 $31,466,888 $48,858,262 $47,394,194 Economic Environment $499,543 $507,000 $520,000 $533,000 $546,000 Human Services $7,000,722 $7,106,000 $7,284,000 $7,466,000 $7,653,000 Culture/Recreation $26,052,173 $24,392,000 $27,717,000 $27,686,000 $25,469,000 Debt Service $1,242,233 $1,238,833 $1,238,423 $1,236,333 $1,237,513 Enterprise Funds $99,473,523 $86,311,877 $89,626,239 $92,221,400 $97,690,000 Other $37,184,642 $37,742,000 $38,686,000 $39,653,000 $40,644,000 TOTAL $320,680,692 $285,156,553 $304,614,550 $332,190,395 $330,339,507 Source: Office of Management and Budget. Earmarked Projected Expenditures Table 6.14 identifies the projected expenditures for the water, sewer, and solid waste enterprise funds for fiscal years 2009/10 through 2013/14. These expenditures include operating expenses and other expenses for each year. 37
43 All revenues from capacity charges must be spent on infrastructure that benefits the payer of the capacity charge. Therefore, the amount of revenues and expenditures increases and decreases with development. For this reason, projecting capacity charge revenues and expenditures is difficult. This system, however, ensures that new development will not reduce levels of service below county minimums. Table 6.14: Projected Expenses for Water, Sewer, and Solid Waste Fiscal Year Potable Water & Sanitary Sewer Solid Waste 2009/10 $41,368,779 $10,869, /11 $40,541,000 $10,652, /12 $40,946,000 $10,759, /13 $41,355,000 $10,867, /14 $41,769,000 $10,976,000 Source: Office of Management and Budget. In FY 2013/14, the projected expenses for potable water and sanitary sewer services are expected to be $41,769,000. That is an increase of.97% from the 2009/10 projected expenses of $41,368,779. Table 6.14 shows that, in FY 2013/14, the projected expenses for solid waste services are expected to be $10,976,000. That is an increase of.98% from the 2009/10 projected figure of $10,869,504. Operating Cost Projections Table 6.15 provides projections of overall operating costs for the county for fiscal years 2009/10 through 2013/14. In fiscal year 2013/14, the county is projected to incur approximately $264,872,395 in operating costs. Based on the figures shown in table 6.15, the county's operating costs are projected to increase 18.31% between 2009/10 and 2013/14. Table 6.15: Overall Operating Cost Projections Fiscal Year Total Operating Costs 2009/10 $223,870, /11 $212,554, /12 $218,994, /13 $224,791, /14 $233,544,513 Source: Office of Management and Budget Projected Debt Capacity 38
44 Debt Financing, which involves borrowing money using the county's assets as collateral, is one way that the county has provided for its capital facility needs. The primary rationale for providing capital facilities through indebtedness is that it spreads the cost of a facility over its useful life and thus is paid for by those who will use the facility. Table 6.16 provides a summary of the county's estimated ability to raise bonds without a public vote. The county's bonding capacity is identified for 10, 20, and 30 years. As table 6.16 indicates, the county's available bonding capacity for the next 10 years is $152,000,000, with an additional potential of $293,000,000. Table 6.16: Estimated Ability to Raise Bonds Without A Public Vote Ten Years Twenty Years Thirty Years Pledge Sources (Bond Interest (Bond Interest (Bond Interest 2.95%) 3.99%) 4.37%) Half Cent Sales Tax $44,800,000 $76,300,000 $92,500,000 Gas Taxes $45,900,000 $73,100,000 $85,800,000 Tourist Tax $9,300,000 $14,800,000 $17,400,000 First Guaranteed Entitlement $1,800,000 $2,800,000 $3,300,000 Second Guaranteed Entitlement $3,600,000 $5,800,000 $6,800,000 Sub-Total $105,400,000 $172,800,000 $205,800,000 Possible Pledge Sources Franchise Fees $38,300,000 $60,900,000 $71,600,000 Road Impact Fees $8,300,000 $13,300,000 $15,600,000 Sub-Total $46,600,000 $74,200,000 $87,200,000 TOTAL $152,000,000 $247,000,000 $293,000,000 Source: Office of Management and Budget. Debt Service Obligations The county's debt service obligations for current and anticipated bond issues are summarized in table Debt service is payment of principal and interest on obligations resulting from the issuance of bonds. As table 6.17 indicates, the county's major anticipated outstanding debts are for water and 39
45 sewer revenue bonds, environmentally sensitive land acquisition bonds, recreational revenue bonds, and spring training facility revenue bonds. Table 6.17: Bond Schedule FY Ending Water & Sewer Revenue Refunding Bonds 1993 A Series 5.755% $47,190,000 Water & Sewer Revenue Refunding Bonds Recreational Revenue Refunding Bonds Environmentally Sensitive Land Acquisition Environmentally Sensitive Land Acquisition Environmentally Sensitive Land Acquisition Water & Sewer Revenue Refunding Bonds Spring Training Facility Revenue Bonds 2009 Series 3.68% $26,370, Series 3.65% $6,455, Series 3.89% $11,000, Series 2.05% $7,800, Series 4.22% $48,600, Series 3.94% $27,675, Series 4.87% $16,810,000 Interest $1,745,350 $148,638 $266,492 $71,400 $1,945,463 $1,053,150 $664,633 Principal $1,395,000 $490,000 $720,000 $1,170,000 $2,670,000 $1,350,000 $560,000 Total $3,140,350 $638,638 $986,492 $1,241,400 $4,615,463 $2,403,150 $1,224, Balance $3,030,000 $26,370,000 $3,685,000 $5,955,000 $1,210,000 $41,045,000 $23,320,000 $12,895,000 Interest $1,668,625 $1,331,610 $135,164 $240,573 $36,300 $1,838,662 $1,012,650 $642,233 Principal $1,475,000 $0 $510,000 $745,000 $1,210,000 $2,775,000 $1,395,000 $585,000 Total $3,143,625 $1,331,610 $645,164 $985,573 $1,246,300 $4,613,662 $2,407,650 $1,227, Balance $1,555,000 $26,370,000 $3,175,000 $5,210,000 $0 $38,270,000 $21,925,000 $12,310,000 Interest $1,587,500 $1,268,200 $119,864 $213,007 $1,727,663 $970,800 $618,833 Principal $1,555,000 $0 $520,000 $780,000 $2,885,000 $1,435,000 $605,000 Total $3,142,500 $1,268,200 $639,864 $993,007 $4,612,663 $2,405,800 $1,223, Balance $0 $26,370,000 $2,655,000 $4,430,000 $35,385,000 $20,490,000 $11,705,000 Interest $1,268,200 $102,964 $183,368 $1,612,262 $925,250 $593,423 Principal $1,610,000 $535,000 $810,000 $3,000,000 $1,480,000 $630,000 Total $2,878,200 $637,964 $993,368 $4,612,262 $2,405,250 $1,223, Balance $24,760,000 $2,120,000 $3,620,000 $32,385,000 $19,010,000 $11,075,000 Interest $1,203,800 $83,169 $151,777 $1,492,263 $877,150 $566,333 Principal $1,675,000 $555,000 $845,000 $3,120,000 $1,530,000 $655,000 Total $2,878,800 $638,169 $996,777 $4,612,263 $2,407,150 $1,221, Balance $23,085,000 $1,565,000 $2,775,000 $29,265,000 $17,480,000 $10,420,000 Interest $1,136,800 $62,356 $117,978 $1,367,462 $800,650 $537,513 Principal $1,745,000 $580,000 $885,000 $3,255,000 $1,605,000 $685,000 Total $2,881,800 $642,356 $1,002,978 $4,622,462 $2,405,650 $1,222, Balance $21,340,000 $985,000 $1,890,000 $26,010,000 $15,875,000 $9,735,000 Interest $1,067,000 $39,881 $80,807 $1,204,713 $736,450 $501,550 Principal $1,815,000 $600,000 $925,000 $3,390,000 $1,670,000 $725,000 Total $2,882,000 $639,881 $1,005,807 $4,594,713 $2,406,450 $1,226, Balance $19,525,000 $385,000 $965,000 $22,620,000 $14,205,000 $9,010,000 Interest $976,250 $15,881 $41,495 $1,035,212 $652,950 $463,488 Principal $1,905,000 $385,000 $965,000 $3,545,000 $1,750,000 $760,000 Total $2,881,250 $400,881 $1,006,495 $4,580,212 $2,402,950 $1,223, Balance $17,620,000 $0 $0 $19,075,000 $12,455,000 $8,250,000 40
46 Interest $881,000 $893,413 $565,450 $423,588 Principal $2,000,000 $3,705,000 $1,840,000 $795,000 Total $2,881,000 $4,598,413 $2,405,450 $1,218, Balance $15,620,000 $15,370,000 $10,615,000 $7,455,000 Interest $781,000 $745,212 $473,450 $381,850 Principal $2,100,000 $3,890,000 $1,930,000 $840,000 Total $2,881,000 $4,635,212 $2,403,450 $1,221, Balance $13,520,000 $11,480,000 $8,685,000 $6,615,000 Interest $676,000 $550,713 $376,950 $337,750 Principal $2,205,000 $4,085,000 $2,025,000 $890,000 Total $2,881,000 $4,635,713 $2,401,950 $1,227, Balance $11,315,000 $7,395,000 $6,660,000 $5,725,000 Interest $565,750 $346,462 $275,700 $291,025 Principal $2,315,000 $4,290,000 $2,130,000 $930,000 Total $2,880,750 $4,636,462 $2,405,700 $1,221, Balance $9,000,000 $3,105,000 $4,530,000 $4,795,000 Interest $450,000 $131,963 $186,750 $242,200 Principal $2,430,000 $3,105,000 $2,220,000 $980,000 Total $2,880,000 $3,236,963 $2,406,750 $1,222, Balance $6,570,000 $0 $2,310,000 $3,815,000 Interest $328,500 $92,400 $190,750 Principal $2,550,000 $2,310,000 $305,000 Total $2,878,500 $2,402,400 $495, Balance $4,020,000 $0 $3,510,000 Interest $201,000 $175,500 Principal $2,680,000 $320,000 Total $2,881,000 $495, Balance $1,340,000 $3,190,000 Interest $67,000 $159,500 Principal $1,340,000 $340,000 Total $1,407,000 $499, Balance $0 $2,850,000 Interest $142,500 Principal $355,000 Total $497, Balance $2,495,000 Interest $124,750 Principal $375,000 Total $499, Balance $2,120, Interest $106,000 Principal $390,000 Total $496,000 41
47 Balance $1,730,000 Interest $86,500 Principal $410,000 Total $496, Balance $1,320,000 Interest $66,000 Principal $430,000 Total $496, Balance $890,000 Interest $44,500 Principal $455,000 Total $499, Balance $435,000 Interest $21,750 Principal $435,000 Total $456, Balance $0 Fiscal Assessment Summary This section provides an analysis of the county's revenues and expenditures for its capital improvement needs for the five-year period beginning in FY 2009/10 and ending in FY 2013/14. While Appendix A details all of the capital improvement projects for the next five fiscal years for each individual comprehensive plan element by cost, timeframe, and revenue source(s), Table 6.7 provides general revenue projections for the county through fiscal year 2013/14. As shown in Table 6.7, the County will generate $1,572,981,697 in revenues from general funds, enterprise funds, and internal funds from fiscal year 2009/10 to fiscal year 2013/14. Sources of these funds include sales taxes, property taxes, grants, impact fees, and other revenues. Portions of the money needed for the capital improvements listed within Appendix A will come from the $1,572,981,697. Overall, the county will have enough revenue to cover costs associated with the five year capital improvements program. The total estimated cost of all projects contained within the County s Capital Improvements project list is $305,824,490 for the next five fiscal years. This is 19.44% of the overall general fund revenues for the same time period. Concurrency Management Plan To ensure that level-of-service standards are maintained, it is necessary to have a system in place which provides the criteria for measuring facility capacity, assessing development demand on applicable facilities, and monitoring service levels for applicable facilities. This system will set the parameters for issuing development orders consistent with level-of-service standards. 42
48 While this concurrency management plan sets policies and establishes a process, the specific application of this system is through the county's land development regulations. As per state requirements, these regulations define the details of the concurrency management system and establish its administrative requirements. The major purpose of the concurrency management system is to detail the specifics of implementing the county's level-of-service standards. For that reason, the concurrency management system must apply to all development activity in the county. The system must then identify the applicable standards for each facility, the geographic scope of each facility, and the method of monitoring facility capacity changes. Most importantly, this system must specify when facilities are considered available. Project Applicability All development orders issued by the county must comply with the concurrency management plan and meet level-of-service standards. Development orders are county approvals for construction and/or land development activity. Specifically, development orders consist of the following: comprehensive plan amendments, rezonings, site plan approvals, preliminary plat approvals, development of regional impact (DRI) approvals, planned development preliminary approvals, and building permit approvals for single-family homes located in subdivisions which were approved after February 13, 1990, the original adoption date of the county s comprehensive plan. According to Section (6), F.S., the impact from the construction of a single family home on an existing lot may constitute a de minimus impact on public facilities. State law allows such de minimus projects to be exempt from the concurrency requirement. shall apply the single family de minimus allowance to single family building permits in subdivisions platted before February 13, Currently, all county maintained roads are operating below the adopted level of service and have additional capacity to accommodate future growth. Service Standards Level-of-service standards for concurrency related facilities are established in this plan for the following facilities: sanitary sewer, potable water, solid waste, stormwater management, recreation, public schools, and transportation. These are explained in detail in the applicable comprehensive plan elements. For each facility, level-of-service is a measure of the relationship between demand for the service and the capacity of the facility. Capacity, however, is measured differently for each type of facility. Table 6.18 identifies both the capacity and demand measures for each public facility. These measures are addressed in detail, and existing capacities are identified in the applicable Comprehensive Plan Elements. 43
49 Table 6.18: Service Level Measures for Concurrency Related Facilities Public Facility Category Specific Facility Capacity Measure Demand Measure Geographic Scope Transportation Roadway Volume of cars accommodated over time Peak Season/Peak Direction/Peak Hour Trips Affected Roadways Sanitary Sewer Treatment Plant Treatment design Capacity (GPD) Generation Rate (GPD) Service Area Potable Water Treatment Plant Treatment Design Capacity (GPD) Generation Rate (GPD) Service Area Solid Waste Landfill Volume in active cell (cubic yards) Generation Rate (tons per capita per year) Entire County Recreation Parks Acres of park land Acres of parks per thousand population Entire County Stormwater Management Drainage conveyances Volume of water Volume of stormwater outfalling for design storm Education* Public Schools (K- Number of Children Enrolled Students/ Future 12) accommodated over time Student Generation *Limited to participating Schools owned and operated by the School District Basin Service Area Concurrency requires that each facility within the geographic scope of a proposed project s impact area have sufficient capacity to accommodate the project's demand. If that capacity is not available, the project cannot be approved. The principal function of the concurrency management system then is to provide a mechanism whereby demand and capacity measures can be compared on a project by project basis. Table 6.18 provides the criteria for establishing a demand to capacity comparison for a proposed project. While most of the characteristics are self-explanatory, one needs clarification; this is the geographic scope for the traffic public facility category. For concurrency purposes, affected roadways will be those roadways impacted by a project's traffic. All projects, regardless of size, impact the roadway on which the project fronts. In addition, other roadways further removed from the project are impacted. For concurrency purposes, roadways that gain 5% or more of the project s traffic or 50 or more of the project s generated trips, whichever is less are included. Level-of-service standards for concurrency related facilities are to apply to all requests for development orders and permits. Level-of-service standards are measurements based on peak-hour trips and based on volume ranges or average travel speed for the peak hour. Demand Demand is an important component of the concurrency management system. Essentially, demand is a measure of facility use. When compared to facility capacity, demand can indicate the level-of-service for the facility. 44
50 As depicted in Table 6.18, demand can be measured quantitatively for each public facility category. While the demand function for each facility consists of applying a rate to the number of facility users, estimation of total demand is more complex. For concurrency management purposes, demand can be divided into three types: existing, committed, and projected. Each must be considered separately for purposes of concurrency management. Existing Demand Existing demand is simply the current level of use for a facility. For a roadway, it is the number of peak hour/peak season/peak direction trips; for a school, it is the number of full-time enrolled students; for water and wastewater treatment plants, it is the existing flow volume measured in gallons per day. These figures are included within applicable plan elements. Existing demand then reflects the use of a facility by the current population. When compared to capacity, existing demand can show if the facility has unused capacity or if it is functioning over capacity. Existing demand, however, is not static. As population increases and dwelling units come on-line, existing demand increases. These increases in existing demand can be identified through facility use measurements. For example, regular traffic counts done on roads or treatment plant flow records are examples of facility use measurements indicating existing demand levels. As existing demand levels for facilities are updated, committed demand levels must be reduced if projects representing committed demand have come on-line. Committed Demand Committed demand is a measure of the impact that approved development projects with reserved capacity will have on facilities. When added to existing demand for a facility, the committed demand for that facility will produce a more accurate estimate of unused capacity. This estimate of unused capacity represents the amount of capacity that can realistically be allocated to new projects. Committed demand must be determined by identifying all projects for which capacity has been reserved through issuance of initial concurrency certificates which are still valid. Then the specific facilities that will be impacted by these projects with reserved capacities must be determined; these facilities will be roadways and the landfill, and they may be treatment plants, drainage conveyances, and recreation facilities. Finally, the total demand on each facility attributable to committed demand will be determined. Applicable elements of the plan identify the rates to be applied to each project to determine facility demand. Traffic volumes, for example, can be derived by applying a trip rate to the size of the project. Sanitary sewer and potable water both have rates of 250 gallons per day per equivalent 45
51 residential unit. Other public facility rates are discussed fully in their applicable Comprehensive Plan Element. Like existing demand, committed demand must be determined on a facility by facility basis. For example, both existing demand and committed demand must be determined for each major roadway, each school, each treatment plant, each major drainage conveyance, and the active cell in the landfill. Also, like existing demand, committed demand estimates must be modified as projects are completed; committed demand estimates must also be modified as new development orders are approved and old development orders are terminated. Projected Demand The third type of demand is projected demand. This consists of two types. One is noncommitted/non-reserved, single-family lot demand for all subdivisions platted after February 13, 1990, while the other is new project demand. Non-committed/non-reserved single-family lot projected demand relates to the facility impacts associated with construction on single-family lots in subdivisions platted after February 13, 1990 and construction on single-family unplatted lots and acreage. Since this type of construction will impact facilities, the demand anticipated from this type of activity must be considered in facility expansion plans. For this reason, it is necessary to maintain an accurate inventory of unbuilt, platted lots and consider the impacts of construction on these lots. The second type of projected demand is new project demand. For each new project, demand estimates must be made on a facility by facility basis. Only if sufficient available capacity exists for each facility to be impacted can the project be approved and a development order issued. Upon issuance of a development order, the estimated impacts on each facility would be considered as committed demand. Availability of Capacity Facility capacity can be assessed two different ways. First, facility capacity can be determined by facilities that are existing and available; examples would be existing treatment plants and existing roadways with a set number of lanes. The second manner for assessing facility capacity is to consider both existing, in-the-ground facilities as well as facility expansions or new facilities which are programmed but not yet existing. According to Chapter 9J (3), Minimum Requirements For Concurrency, Florida Administrative Code, the capacity of existing, in-the-ground facilities will be considered in all cases. Programmed facilities will be considered in assessing capacity for each public facility category when the following conditions are met: 46
52 For sanitary sewer, potable water, solid waste and drainage facilities: 1. A development order or permit is issued subject to the condition that, at the time of the issuance of a certificate of occupancy or its functional equivalent, the necessary facilities and services are in place and available to serve the new development; or 2. At the time the development order or permit is issued, the necessary facilities and services are guaranteed in an enforceable development agreement, pursuant to Section , F.S., or an agreement or development order issued pursuant to Chapter 380, F.S., to be in place and available to serve new development at the time of the issuance of a certificate of occupancy or its functional equivalent. [Section (2)(a), F.S.] For parks and recreation facilities: 1. At the time the development order or permit is issued, the necessary facilities and services are in place or under actual construction; or 2. A development order or permit is issued subject to the condition that, at the time of the issuance of a certificate of occupancy or its functional equivalent, the acreage for the necessary facilities and services to serve the new development is dedicated or acquired by the local government, or funds in the amount of the developer s fair share are committed; and a. A development order or permit is issued subject to a condition that the necessary facilities and services needed to serve the new development are in place or under actual construction not more than one year after issuance of a certificate of occupancy or its functional equivalent; or b. At the time the development order or permit is issued, the necessary facilities and services are the subject of a binding executed agreement which requires the necessary facilities and services to serve the new development to be in place or under actual construction not more than one year after issuance of a certificate of occupancy or its functional equivalent; or c. At the time the development order or permit is issued, the necessary facilities and services are guaranteed in an enforceable development agreement, pursuant to Section , F.S., or an agreement or development order issued pursuant to Chapter 380, F.S., to be in place or under actual construction not 47
53 more than one year after issuance of a certificate of occupancy or its functional equivalent. [Section (2)(b), F.S.] Transportation supply (capacity). Transportation supply shall be determined on a segment by segment basis. For concurrency purposes, all segments on the county's thoroughfare plan shall be considered. Capacity for segments will be based either on FDOT's generalized capacity tables or individual segment capacity studies approved by the public works director pursuant to the criteria specified in Chapter 952, Traffic. Transportation supply for each segment is: 1. The segment's existing peak hour, peak season, peak direction capacity; or 2. The segment's new roadway capacity if facility expansion for the segment is proposed and if: a. At the time a development order or permit is issued, the necessary facilities and services are in place or under construction; or b. A development order or permit is issued subject to a condition that the facility expansion needed to serve the new development is included in the county s adopted five-year schedule of capital improvements and is scheduled to be in place or under actual construction not more than three years after issuance of the project s first building permit or its functional equivalent. The schedule of capital improvements may recognize and include transportation projects included in the first three years of the adopted Florida Department of Transportation five year work program. In order to apply this provision to a facility expansion project, the must include the following policies: i. The estimated date of commencement of actual construction and the estimated date of project completion (for, this is included in policy 5.11 of this element and within Appendix B of this element). ii. A provision that a plan amendment is required to eliminate, defer, or delay construction of any road or mass transit facility or service which is needed to maintain the adopted level of service standard and which is listed in the five-year schedule of capital improvements (for Indian River County, this is included in Policy 1.2 of this Element); or 3. At the time a development order or permit is issued, the facility is the subject of a binding executed agreement which requires the facility to be in place or under actual 48
54 construction no more than three years after the issuance of the project s first building permit or its functional equivalent; or 4. At the time a development order or permit is issued, the facility is guaranteed in an enforceable development agreement, pursuant to Section , F.S., or an agreement or development order issued pursuant to Chapter 380, F.S., to be in place or under actual construction not more than three years after issuance of a building permit or its functional equivalent. [Section (2)(c), F.S.] 5. The segment s new roadway capacity if facility expansion for the segment is the subject of a proportionate fair-share agreement. In such case, the segment capacity increase reflected in the proportionate fair share agreement shall be available only to the party or parties to the proportionate fair share agreement. For school facilities: Regulation A residential development order or permit shall be issued only if the needed capacity for the particular service area is available in one or more contiguous service areas as defined in Section (13)(c), F.S. No development order shall be issued for any project where the project's demand in conjunction with existing demand and committed demand will exceed the capacity of a facility at the service level established in this plan. Level-of-service analysis will be undertaken during the review of each project for which development order approval is required. Monitoring System To effectively implement the concurrency requirement, it is necessary to maintain an estimate of available capacity for each public facility subject to level-of-service requirements. By maintaining an accurate and current available capacity estimate for each facility, projected demand from development applications can be compared to the available capacity for the facility to determine if the project can be approved. The purpose of the monitoring program is to maintain a current estimate of available capacity for each facility. With the exception of public schools, the monitoring system portion of the concurrency management plan is maintained by the county s planning division. Effective July 1, 2008, the School District initiated and now maintains the monitoring system portion of the concurrency management plan for 49
55 public schools. Using a network computer system and data base management software, records were developed and are maintained for each specific facility. Based upon information in the specific comprehensive plan elements, total capacity figures for each applicable facility are maintained in data base files established for each public facility category. Capacity figures are modified as facilities are expanded or as criteria specified in the availability of capacity section are met, thereby allowing a programmed expansion to be considered for capacity determination purposes. Through contact with other county departments, planning staff are able to modify capacity estimates as soon as facility characteristics are changed. Table 6.19 depicts the general structure of the monitoring system data base file for each public facility category. This table shows that available capacity for each specific facility is a function of total capacity less existing demand and less committed demand. The demand section of this concurrency management plan identifies the methodology for assessing demand. Table 6.19: Monitoring System Design Public Facility Category Specific Facilities Total Capacity Existing Demand Committed Demand Available Capacity Traffic Roadways Peak season/ peak direction/ peak hour (LOS D) Annual count (average) (peak season/peak direction/peak hour) Volume estimated from approved Development Orders (DO) (Total Capacity) - (Existing Demand) - (Committed Demand) Sanitary Sewer Treatment Plants Design flows Existing flows Volume estimated from approved DO s (Total Capacity) - (Existing Demand) - (Committed Demand) Potable Water Treatment Plants Design flows Existing flows Volume estimated from approved DO s (Total Capacity) - (Existing Demand) - (Committed Demand) Solid Waste Landfill Active cell design capacity Recreation Parks Park Acreage Active cell volume used (Acres per thousand population) X (existing population) Volume estimated from approved DO s (Acres per thousand population) X (projected population for approved DO s) (Total Capacity) - (Existing Demand) - (Committed Demand) (Total Capacity) - (Existing Demand) - (Committed Demand) Drainage Education Drainage conveyances Public Schools(K- 12) Volume Permanent Student Stations (FISH) Existing flows Annual Enrollment Count (FTE) Volume of stormwater allowed to outfall for approved DO s Students estimated from approved residential Development Orders) (Total Capacity) - (Existing Demand) - (Committed Demand) (Total Capacity) - (Existing Demand) - (Committed Demand) To implement the monitoring system, the following actions shown in table 6.20 will be necessary. 50
56 Table 6.20: Monitoring System Tasks Action Responsible Department Timing Do quarterly traffic counts for thoroughfare plan roads to determine existing demand Engineering Annually Compile quarterly ridership statistics for all fixed routes MPO Annually Identify existing flows for each water and sewer treatment plant Utilities Annually Estimate Landfill (active cell) volume used Utilities Annually Estimate population and apply park standard to determine park existing demand Planning Annually Estimate existing flows for drainage conveyances Engineering Annually Enter data received from other departments into computer Planning Ongoing Do annual student counts (FTE) for public schools to determine existing demand School District Annually Add estimated demand for new projects to committed demand total upon issuance of DO Planning Ongoing Maintain records of units/projects receiving a certificate of occupancy, maintain demand estimates from those units/projects, subtract estimated demand for those units/projects for committed demand once existing demand is updated Applicability Planning Ongoing The concurrency management plan monitoring system has applicability to more than just level-ofservice measurement. It also provides the basis for assessing facility expansion needs and therefore capital improvements programming. By maintaining an accurate and up-to-date estimate of available capacity, the need for facility expansion can be recognized before all capacity is used. By incorporating the monitoring system into the capital improvements programming process, capital budgets can be prepared based on reliable information and valid estimates of need. 51
57 Goal, Objectives and Policies Goal It is the goal of to provide needed capital improvements through the use of sound fiscal decision making. Objectives and Policies Objective 1: Construction of Capital Facilities By 2015, the county will have completed those capital improvements schedule projects that replace obsolete or worn-out facilities, have eliminated existing deficiencies, or accommodated desired future growth, and replaced obsolete or worn-out facilities. Policy 1.1: The county shall maintain a five-year capital improvement program and pursuant to Section (3)(b) F.S. evaluate and update that program every year to reflect existing and future public facility needs of the county. This capital improvement program will ensure that the plan is financially feasible and that the adopted level-of-service standards are achieved and maintained. Policy 1.2: The county and the School District shall undertake only those capital improvements included within this element s adopted capital improvements program. Pursuant to Section (3)(b) F.S., the will be reviewed every year. Consistent with Section 9J-5 of the Florida Administrative Code, if any facility identified in the Schedule of Capital Improvements is delayed or deferred in construction, or is eliminated from the capital improvements program, and this delay, defer, or elimination will cause the level-of-service to deteriorate below the adopted minimum level of service standard for the facility, a comprehensive plan amendment will be required to adjust the Schedule of Capital Improvements. The annual update of the capital improvement element shall be done with a single public hearing before the Board of County Commissioners and a copy of the ordinance amending the shall be transmitted to DCA. Policy 1.3: The county shall evaluate and prioritize its capital improvement projects based on following criteria. These criteria are ranked in order of importance. Preservation of the health and safety of the public by eliminating public hazards; Compliance with all mandates and prior commitments; Elimination of existing deficiencies; Maintenance of adopted level-of-service standards; Provision of infrastructure concurrent with the impact of new development; Protection of prior infrastructure investments; Consistency with the county plan and plans of other agencies; Accommodation of new development and redevelopment facility demands; 52
58 Consistency with plans of state agencies and water management districts that provide public facilities within the local government's jurisdiction; Promotion of compact development by discouraging growth outside of urban service areas; Demonstration of linkages between projected growth and facility location; Utilization of the economies of scale and timing of other improvements; Reduction of operating costs; Adjustment for unseen opportunities, situations, and disasters. Policy 1.4: The county shall implement the policies of the Potable Water, Sanitary Sewer, and Solid Waste sub-elements of the Comprehensive Plan. Since these are enterprise account funded elements, capital expenditures identified in these elements shall be funded principally from revenues derived from the applicable systems. Policy 1.5: The county shall prioritize and implement the programs identified in the Transportation, Recreation and Open Space, Stormwater Management, Conservation, and Future Land Use Elements of the Comprehensive Plan. Policy 1.6: The county shall not eliminate or reallocate budgeted appropriations for road improvement projects required to meet the adopted level-of-service standards unless the applicable projects will be constructed by other means and remain concurrent with the county s Schedule of Capital Improvements. Policy 1.7: The county shall continue to allocate funds for the replacement and the renewal of infrastructure in an amount which will minimize the operating costs of the infrastructure and maximize the life of the infrastructure. Policy 1.8: The county shall manage its long-term general obligation debt in such a manner that the ratio of the debt service millage to the countywide operating millage does not exceed 20%. Policy 1.9: The county hereby defines a capital improvement as an improvement with a cost that exceeds $25,000. Policy 1.10: The Schedule of Capital Improvements shall contain a mix of capital expenditures, including projects to eliminate existing deficiencies, to upgrade and replace existing facilities, and to construct new facilities. Policy 1.11: The county shall maintain a procedure in its annual budget review requiring each county department to include in its annual budget request applicable expenditures as identified in the capital improvements program of the appropriate Comprehensive Plan Element as well as department s capital improvements. 53
59 Policy 1.12: The county shall adopt School District of Five-Year Capital Improvement Schedule from the School District s adopted Five Year Capital Plan pursuant to Section (3)(a)(5) F.S. The Capital Improvement Schedule with be evaluated and updated annually to reflect existing and future public school facility needs of the county. This will ensure that the School District s Five-Year Capital Plan is financially feasible and that the adopted level-ofservice standard for public schools is achieved and maintained. Objective 2: Development in Coastal High Hazard Areas Through 2030, development in coastal high hazard areas will not increase beyond the density or intensity levels indicated on the current Future Land Use Map. Policy 2.1: The coastal high hazard area is defined as the area of the county designated as evacuation zones for a category one hurricane. Policy 2.2: The county shall not increase land use density and intensity, in the coastal high hazard area, beyond that reflected in the county s current Future Land Use Map. Policy 2.3: The county shall make appropriations for infrastructure in coastal high hazard areas only to maintain the adopted level-of-service standards. Policy 2.4: The county shall ensure that the replacement of infrastructure in the coastal high hazard area will be limited to maintaining the adopted level-of-service standards. Policy 2.5: The county shall require that all developments and all single-family units in coastal high hazard areas fully pay the cost for required infrastructure improvements through impact fees, capacity charges, developer dedications, assessments, and contributions. Policy 2.6: The county shall not use public funds to subsidize increased density or intensity of urban development in coastal high hazard areas; however, public beach, shoreline access, resource restoration, or similar projects may be constructed. Objective 3: Maintenance of Established Level-of-Service Standards Through 2030, adopted levels-of-service will be maintained for all concurrency facilities. Policy 3.1: The county hereby adopts the concurrency management system as described within this element. The county shall maintain Land Development Regulation (LDR) Chapter 910, Concurrency Management System, which implements the plan s concurrency management system. In accordance with the concurrency management system of this plan and LDR Ch. 910, the county will not approve any development project where the impacts of such a project would lower the existing level-of-service on any facility below that facility s adopted minimum level-of-service standard. 54
60 Policy 3.2: The county shall approve development only in accordance with the utility connection matrix identified in the Sanitary Sewer and Potable Water Sub-Elements. Policy 3.3: The county shall, concurrent with the impact of new development, provide the infrastructure necessary to maintain the levels-of-service identified in the various elements of the Comprehensive Plan. Where development is proposed and is consistent with all applicable regulations but one or more public facilities is/are operating at an inadequate service level, the applicant may at his expense make facility improvements to increase facility capacity when such improvements are consistent with county plans and receive county approval. Policy 3.4: The county shall make land use decisions based on the planned availability of facilities to maintain adopted level-of-service standards. Policy 3.5: The county hereby adopts Concurrency Management level-of-service standards for public facilities that are established in the other Comprehensive Plan Elements and which are stated below: Stormwater Management: The county hereby adopts the following level-of-service standard for all new drainage systems within the unincorporated county: New development requiring major site plan approval or subdivision platting shall construct a complete drainage system to mitigate the impacts of a 25 year/24 hour design rainfall event using the soil conservation service type 2 modified rainfall curves. Post development runoff for any drainage basin shall not exceed pre-development runoff unless a maximum discharge rate has been adopted and the discharge does not exceed that rate. If a maximum discharge rate has not been adopted for a basin, post development discharge may not exceed pre-development discharge. By 2010, all existing roadways in the county shall be improved to meet the following level-of-service standards: Minimum road crown elevation for existing roads shall be raised during resurfacing/rebuilding to the flood elevation resulting from the 2 year/24 hour storm event on local streets. The center two lanes of rebuilt roads must be at or above flood levels resulting from a 10 year 24 hour storm event on Arterial and Collector roads. All drainage basins will meet the following level of service standards: By Year/24 Hour Storm Event By Year/24 Hour Storm Event 55
61 The county hereby adopts the following water quality level-of-service standard: As a minimum, retention of the first one inch of rainfall is required prior to offsite discharge. An additional 50% treatment is required for all direct discharge into the Sebastian River and into the Indian River Lagoon due to its designation as an outstanding Florida water, as required by state law. Potable Water The following level-of-service standard is adopted for the county's potable water facilities, and shall be utilized for determining the availability of facility capacity and demand generated by a development: Countywide level-of-service standard of 250 gallons per day per equivalent residential unit. Solid Waste The following level-of-service standard is adopted for solid waste facilities in the county, and shall be used as the basis for determining the availability of facility capacity and demand generated by a development: Countywide level-of-service standard of 2.2 tons or 3.67 cubic yards per capita for permanent plus weighted peak seasonal population per year. Sanitary Sewer The following level-of-service standard is adopted for the county's sanitary sewer facilities, and shall be utilized for determining the availability of facility capacity and demand generated by a development: Countywide level-of-service standard of 250 gallons per day per equivalent residential unit with a peak monthly flow factor of Recreation & Open Space The county adopts the following recreation level-of-service standard: County wide level-of-service standard of 6.61 recreation acres/1,000 permanent plus weighted peak seasonal population. Transportation The county adopts traffic circulation level-of-service standards as follows: 56
62 Level-of-Service D during peak hour, peak season, peak direction conditions, on all TRIP grant funded roads as well as all freeway, arterial, and collector roadways, with the exception of the following two, which will operate at level of service E plus 20%. 27 th Ave South County Line to SR rd Ave Oslo Road to 16 th Street For SIS/Florida Intrastate Highway System roadways, level of service B is adopted for rural areas, and level of service C is adopted for urban areas. Policy 3.6: The county hereby adopts level-of-service standards for selected public facilities as follows: Correctional Facilities The county adopts the following correctional facilities level-of-service standard: County wide level-of-service standard of 4.5 beds/1,000 permanent plus weighted peak seasonal population Fire/EMS The county adopts the following Fire/EMS level-of-service standard: County wide (excluding Indian River Shores) level-of-service standard of.089 Stations per 1,000 permanent plus weighted peak seasonal population Law Enforcement The county adopts the following Law Enforcement level-of-service standard: Unincorporated County level-of-service standard of 2.09 officers per 1,000 permanent plus weighted peak seasonal population Libraries The county adopts the following Libraries level-of-service standards: County wide level-of-service standard of 580 building square feet per 1,000 permanent plus weighted peak seasonal population County wide level-of-service standard of 3,200 library material items per 1,000 permanent plus weighted peak seasonal population County wide level-of-service standard of 0.7 computers per 1,000 permanent plus weighted peak seasonal population 57
63 County wide level-of-service standard of 0.2 other library equipment items per 1,000 permanent plus weighted peak seasonal population Public Buildings The county adopts the following Public Buildings level-of-service standard: County wide level-of-service standard of 1.99 building square feet per capita for permanent plus weighted peak seasonal population. Schools The county adopts the following Schools level-of-service standard: Schools (School Service Areas): 100 percent of Florida Inventory of School Houses (FISH) capacity for each public school type (elementary, middle, and high). Transit The County adopts the following transit level-of-service standard: One-hour headways shall be maintained on all fixed transit routes. Objective 4: Future Development's Share of Capital Costs Through 2030, new developments will bear a proportionate share of the cost required to maintain adopted level-of-service standards. Policy 4.1: The county shall use impact fees, capacity charges, assessments, developer dedications and contributions, to pay for infrastructure improvements and services needed to satisfy future needs while maintaining adopted level-of-service standards. Policy 4.2: The county shall conduct research to identify new sources of revenue for funding capital improvement projects. Objective 5: Local Government s Ability to Provide Required Services and Facilities Through 2030, the county will ensure that it is able to fund and provide required services and facilities. 58
64 Policy 5.1: The county shall not approve land use amendment requests unless those requests are consistent with the concurrency management system requirements of this element. Policy 5.2: In the event that the planned capacity of public facilities is insufficient to serve all applicants for development orders, the county shall schedule capital improvements to serve developments in the following order of priority: Single-family units in existing platted subdivisions or on existing legal, buildable parcels Affordable housing projects New development orders permitting redevelopment New development orders permitting new developments where the applicant funds the infrastructure expansion in exchange for future reimbursement New development orders permitting new developments without developer participation Policy 5.3: The county shall extend facilities and services to serve areas only within the existing Urban Service Area or as allowed by Policy 5.7 of the Potable Water Sub-Element and Policy 5.8 of the Sanitary Sewer Sub-Element of the Comprehensive Plan. Policy 5.4: The county shall coordinate with other local, state, and federal agencies as well as private entities to create an efficient capital improvements schedule that provides the following general benefits while minimizing the financial burden of providing facilities and services: Reduction of overall capital and operating expenditures by the development of multi-use facilities; More efficient land use patterns and phasing; Reduction of overlapping, duplicating, and administrative procedures; Implementation of adopted physical, social, and economic goals and policies in a least-cost manner; Better coordination of public capital investment with private capital expenditures. Policy 5.5: The county shall continue utilizing enterprise funds for the provision of Sanitary Sewer, Potable Water, and Solid Waste facilities. The debt for enterprise funds is to be paid by user fees, capacity charges, and other appropriate sources. Policy 5.6: The county shall finance the capital cost of non-enterprise fund supported public facilities (e.g., roads, stormwater management, and parks) from current revenue, bond issues, impact fees, capacity charges, assessments, and other appropriate sources. Policy 5.7: The county shall use general obligation bonds and other sources to raise the funding required to provide those public facilities that cannot be constructed with user fees, revenue bonds, impact fees, capacity charges, or other dedicated revenue sources. 59
65 Policy 5.8: Developments, which require public facility infrastructure improvements that will be financed by county debt, shall have their development orders conditioned on the issuance of the county debt or the substitution of a comparable amount of non-debt revenue. Policy 5.9: Pursuant to state law, the Schedule of Capital Improvements may be adjusted by ordinance and not deemed to be an amendment to the Comprehensive Plan when the amendment relates to corrections, updates, or modifications concerning costs, revenue sources, acceptance of facilities pursuant to dedications which are consistent with the Comprehensive Plan, or the date of construction of any facility except transportation facilities enumerated in the Schedule of Capital Improvements. For transportation facilities, a delay in construction of a facility which causes the level-of-service of that facility to deteriorate below the adopted minimum level-of-service standard for the roadway will require a comprehensive plan amendment. Policy 5.10: The county shall ensure that all capital improvements identified in the various elements of the Comprehensive Plan are completed according to schedule. The only acceptable delays will be those which are subject to one of the following: Projects providing capacity equal to, or greater than, the delayed project are accelerated within or added to the Schedule of Capital Improvements; Modification of development orders issued conditionally or subject to the concurrent availability of public facility capacity provided by the delayed project. Such modification shall restrict the allowable amount and schedule of development to that which can be served by the capacity of public facilities according to the revised schedule; or Amendment of the plan to reduce the adopted standard for the level-of-service for public facilities until the fiscal year in which the delayed project is scheduled to be completed. Policy 5.11: The county hereby adopts Appendix B as the County s Priority Transportation Capital Improvements Schedule. This schedule provides the project description, estimated date of commencement of actual construction, estimated date of completion, and estimated cost for projects that will increase roadway capacity on priority facilities. Implementation, Evaluation, and Monitoring Implementation 60
66 An important part of any plan is its implementation. Implementation involves execution of the plan's policies. It involves taking actions and achieving results. For the, implementation involves various activities. While some of these actions will be ongoing, others are activities that will be taken by certain points in time. For each policy in this element, table 6.21 identifies the type of action required, the responsible entity for taking the action, the timing, and whether or not the policy necessitates a capital expenditure. To implement the, several different types of actions must be taken. These include: development of mechanisms for funding new facilities, adoption of land development regulations and ordinances, execution of interlocal agreements, coordination, and preparation of studies and evaluation and monitoring reports. Overall, the implementation responsibility will rest with the Office of Management and Budget. Besides its responsibilities as identified in table 6.20, the planning department has the additional responsibility of ensuring that other entities discharge their responsibilities. This will entail notifying other applicable departments of capital expenditures to be included in their budgets, notifying other departments and groups of actions that must be taken, and assisting other departments and agencies in their plan implementation responsibilities. As part of the, the county has developed a Concurrency Management Plan, which ensures the maintenance of the adopted level-of-service standards. Through the Concurrency Management Plan, the county will measure facility capacity, assess development demand, and maintain a Capital Improvements Program which ensures that the level-of-service standards are maintained. Table 6.21: Capital Improvement Element Implementation Matrix Policy Type of Action Responsibility Timing Capital Expenditure 1.1 Maintain the CIP OMB/PD No 61
67 Table 6.21: Capital Improvement Element Implementation Matrix Policy Type of Action Responsibility Timing Capital Expenditure 1.2 Follow the CIP PD No 1.3 Prioritize capital improvement projects OMB/PD/SD Ongoing No 1.4 Implement recommendations 1.5 Prioritize and implement programs Appropriate County Departments/SD Appropriate County Departments/SD Yes Yes 1.6 Maintain previous commitments BCC/PWD/SD Ongoing No 1.7 Replacement and renewal of infrastructure Appropriate County Departments/SD Ongoing No 1.8 Budget Management OMB/SD Ongoing No 1.9 Define capital improvement PD/OMB Ongoing No 1.10 Capital Budget Management OMB/SD Ongoing No 1.11 Capital Improvements Management OMB/SD Ongoing No 2.1 Define costal high hazard area DCA Ongoing No 2.2 Maintain density and intensity levels of current FLU Map PD Ongoing No 2.3 Budget management Appropriate County Departments Ongoing Yes 2.4 Maintain LOS standards Appropriate County Departments Ongoing Yes 2.5 Funding mechanisms BCC/Private Developers Ongoing No 2.6 Infrastructure replacement strategy Appropriate County Departments Ongoing No 3.1 Maintain concurrency management system PD Ongoing No 3.2 Follow connection matrix of Comprehensive Plan Sub- Elements Appropriate County Departments Ongoing No 3.3 Maintain adopted LOS standards PD Ongoing No 3.4 Land use decisions BCC Ongoing No 3.5 Adopt LOS standards BCC/SD/Appropriate County Departments Ongoing No 4.1 Impose regulations Appropriate County Departments Ongoing Yes 4.2 Conduct research OMB/PD Ongoing No 62
68 Table 6.21: Capital Improvement Element Implementation Matrix Policy Type of Action Responsibility Timing Capital Expenditure 4.3 Work with municipalities BCC/SD/Other Local Governments in IRC Ongoing No 5.1 Approve land use changes only if infrastructure can support land use change BCC Ongoing No 5.2 Prioritize capital improvements BCC/SD/Appropriate County Departments Ongoing No 5.3 Extension of facilities and services BCC/Appropriate County Departments Ongoing No 5.4 Create an efficient capital improvements schedule Appropriate County Departments/Other Government Agencies Ongoing No 5.5 Utilize enterprise funds OMB Ongoing No 5.6 Finance non-enterprise fund supported projects OMB Ongoing No 5.7 Fund the construction of public facilities OMB/SD Ongoing Yes 5.8 Permitting Requirements BCC/Appropriate County Departments Ongoing No 5.9 Amending the Schedule of Capital Improvements BCC/OMB/PD/SD Ongoing No 5.10 Complete the Schedule of Capital Improvements BCC/SD/Appropriate 2014 No C D Adopt a Priority Transportation Capital Improvements 5.11 BCC/PWD/MPO Ongoing No Schedule BCC = Board of County Commissioners FDOT = Florida Department of Transportation OMB = Office of Management and Budget PWD = Public Works Department DCA = Department of Community Affairs MPO = Metropolitan Planning Organization PD = Planning Department SD = School District Evaluation and Monitoring Procedures To be effective, a plan must not only provide a means for implementation; it must also provide a mechanism for assessing the plan's effectiveness. Generally, a plan's effectiveness can be judged by the degree to which the plan's objectives have been met. Since objectives are structured, as much as possible, to be measurable and to have specific timeframes, the plan's objectives are the benchmarks used as a basis to evaluate the plan. Table 6.22 identifies each of the objectives of the. It also identifies the measures to be used to evaluate progress in achieving these objectives. Most of these measures are quantitative, such as adopting land development requirements, which ensure the maintenance of 63
69 the level-of-service standards, adopting a capacity monitoring system and others. Besides the measures, table 6.22 also identifies timeframes associated with meeting the objectives. The Planning Department staff will be responsible for monitoring and evaluating the Capital Improvement Element. This will involve collection of data and compilation of information regarding facility capacity, expansion, and new development permitted. This will be done on a regular basis. As part of the county's Concurrency Management System, the Planning Department will continually monitor the facility capacity to ensure that level-of-service standards will be maintained. Table 6.22: Evaluation Matrix Objective Measure Timeframe 1 Existing deficiencies in county services and/or obsolete or worn-out facilities Land use density and intensity in Coastal High Hazard Area Level-of-service provided for county services Existence of appropriate Land Development Regulations Completion of the Schedule of Capital Improvements 2030 While monitoring will occur on a continual basis, formal evaluation of the Capital Improvements Element will occur annually. The formal evaluation and appraisal of the entire Comprehensive Plan will occur every ten years (dependent upon the schedule adopted by the Florida Department of Community Affairs). Besides assessing progress, the evaluation and appraisal process will also be used to determine whether the objectives should be modified or expanded based on revisions to state statutes and changing conditions not identified and addressed as part of the annual CIE update. In this way, the monitoring and evaluation of the Capital Improvements Element will not only provide a means of determining the degree of success of the plan's implementation; it will also provide a mechanism for evaluating needed changes to the plan element not otherwise addressed in the yearly update of the. As discussed in the above paragraphs, the evaluation and monitoring procedures identified for the are basically the same for the entire Comprehensive Plan. These procedures are currently being used to prepare the formal Evaluation and Appraisal Report and will be used by the county in subsequent Evaluation and Appraisal Reports. Included in those procedures are the format requirements listed in 9J (1)(a)(e), F.A.C. The monitoring and evaluation of this plan is critical to ensure that the policies are effective in achieving the plan's goals and objectives. Each individual element of the plan contains provisions and measures to be used in the review of the element. Each element contains an Implementation and Evaluation Matrix and monitoring procedures, which are currently being used to prepare the current Evaluation and Appraisal Report and will be used to prepare future Evaluation and Appraisal Reports. 64
70 In addition, a great portion of the plan monitoring will be in conjunction with the concurrency management system which is designed to ensure that approved level-of-service standards are maintained and that sufficient capacity exists in the various services and facilities. Other evaluation of the plan or plan elements is likely to occur in the day to day application of the mandated regulations, which will result in plan amendments. The formal Evaluation and Appraisal Report required by law is currently providing and in subsequent versions will provide a complete review of the plan and be conducted in compliance with the public participation procedures adopted for the development of this plan. As part of the monitoring system, all appropriate baseline data is currently being updated and will be updated. Besides assessing progress, the evaluation and appraisal process is and will also be used to determine whether the objectives should be modified or expanded. In this way the monitoring and evaluation of the Comprehensive Plan Elements not only provides a means of determining the degree of success of the plan's implementation; it also provides a mechanism for evaluating needed changes to the plan element. 65
71 APPENDIX A: FIVE-YEAR SCHEDULE OF CAPITAL IMPROVEMENTS Conservation and Aquifer Recharge Five Year Schedule of Improvements Revenue FY 2009/10 FY 2010/11 FY 2011/12 FY 2012/13 FY 2013/14 Total Env. Land Bonds $450,000 $0 $50,000 $0 $0 $500,000 Grant $475,000 $400,000 $50,000 $0 $0 $925,000 Total Revenue $925,000 $400,000 $100,000 $0 $0 $1,425,000 Expenditures FY 2009/10 FY 2010/11 FY 2011/12 FY 2012/13 FY 2013/14 Total Revenue Source Archie Smith Fish House $ 50,000 $ - $ - $ - $ - $ 50,000 Env. Land Bonds Archie Smith Fish House $ 50,000 $ 400,000 $ - $ - $ - $ 450,000 Grant South Prong Preserve $ 25,000 $ - $ - $ - $ - $ 25,000 Env. Land Bonds Environmental Land Acquisition $ 200,000 $ - $ - $ - $ - $ 200,000 Env. Land Bonds Environmental Land Acquisition $ 200,000 $ - $ - $ - $ - $ 200,000 Grant Manage/Access to Future Acq. Conservation Lands $ - $ - $ 50,000 $ - $ - $ 50,000 Env. Land Bonds Manage/Access to Future Acq. Conservation Lands $ - $ - $ 50,000 $ - $ - $ 50,000 Grant Halstrom Farmstead $ 50,000 $ - $ - $ - $ - $ 50,000 Env. Land Bonds Halstrom Farmstead $ 50,000 $ - $ - $ - $ - $ 50,000 Grant Cypress Bend Community Preserve $ 25,000 $ - $ - $ - $ - $ 25,000 Env. Land Bonds Cypress Bend Community Preserve $ 25,000 $ - $ - $ - $ - $ 25,000 Grant Wabasso Scrub conservation Area - Public Access $ 50,000 $ - $ - $ - $ - $ 50,000 Env. Land Bonds Wabasso Scrub conservation Area - Public Access $ 50,000 $ - $ - $ - $ - $ 50,000 Grant Flinn Tract - Access $ 50,000 $ - $ - $ - $ - $ 50,000 Env. Land Bonds Flinn Tract - Access $ 100,000 $ - $ - $ - $ - $ 100,000 Grant Total Expenditures $ 925,000 $ 400,000 $ 100,000 $ - $ - $ 1,425,000 Comparison of Expenditures to Revenue FY 2009/10 FY 2010/11 FY 2011/12 FY 2012/13 FY 2013/14 Total Total Revenue $925,000 $400,000 $100,000 $0 $0 $1,425,000 Total Expenditures $925,000 $400,000 $100,000 $0 $0 $1,425,000 Annual Balance $0 $0 $0 $0 $0 $0 Emergency Services Revenue Sources FY 2009/10 FY 2010/11 FY 2011/12 FY 2012/13 FY 2013/14 Total Emergency Services Dist. $ 1,686,705 $ - $ - $ - $ - $1,686,705 Optional Sales Tax $ 3,700,000 $ - $ - $ - $ - $3,700,000 Impact Fees $ - $ - $ - $ 2,200,000 $ - $2,200,000 66
72 Total Revenue $ 5,386,705 $ - $ - $ 2,200,000 $ - $7,586,705 Expenditures FY 2009/10 FY 2010/11 FY 2011/12 FY 2012/13 FY 2013/14 Total Revenue Source Emergency Svcs. Station 9 - Replace $ 100,000 $ - $ - $ - $ - $ 100,000 Emergency Services Dist. Emergency Svcs. Station 12 - Addition $ 100,000 $ - $ - $ - $ - $ 100,000 Emergency Services Dist. Emergency Svcs. Station 13 - Addition $ 1,500,000 $ - $ - $ - $ - $ 1,500,000 Optional Sales Tax Emergency Svcs. Station 13 - Addition $ 1,486,705 $ - $ - $ - $ - $ 1,486,705 Emergency Services Dist. 800 MHz Radio Expansion $ 2,200,000 $ - $ - $ - $ - $ 2,200,000 Optional Sales Tax Emergency Svcs. Station 14 - Addition $ - $ - $ - $ 2,200,000 $ - $ 2,200,000 Impact Fees Total Expenditures $ 5,386,705 $ - $ - $ 2,200,000 $ - $ 7,586,705 Comparison of Expenditures to Revenue FY 2009/10 FY 2010/11 FY 2011/12 FY 2012/13 FY 2013/14 Total Total Revenue $ 5,386,705 $ - $ - $ 2,200,000 $ - $7,586,705 Total Expenditures $ 5,386,705 $ - $ - $ 2,200,000 $ - $7,586,705 Annual Balance $0 $0 $0 $0 $0 $0 General Services Revenue FY 2009/10 FY 2010/11 FY 2011/12 FY 2012/13 FY 2013/14 Total Optional Sales Tax $ 300,000 $ - $ 3,850,000 $ - $ - $ 4,150,000 Court Facility Surcharge $ - $ - $ 250,000 $ - $ - $ 250,000 Total Revenue $ 300,000 $ - $ 4,100,000 $ - $ - $ 4,400,000 Expenditures FY 2009/10 FY 2010/11 FY 2011/12 FY 2012/13 FY 2013/14 Total Revenue Source Expansion of Fiber Optic Network $ 300,000 $ - $ - $ - $ - $ 300,000 Optional Sales Tax New Courtroom Facilities $ - $ - $ 1,850,000 $ - $ - $ 1,850,000 Optional Sales Tax New Courtroom Facilities $ - $ - $ 250,000 $ - $ - $ 250,000 Court Facility Surcharge Displaced Courtroom $ - $ - $ 2,000,000 $ - $ - $ 2,000,000 Optional Sales Tax Total Expenditures $ 300,000 $ - $ 4,100,000 $ - $ - $ 4,400,000 Comparison of Expenditures to Revenue FY 2009/10 FY 2010/11 FY 2011/12 FY 2012/13 FY 2013/14 Total Total Revenue $ 300,000 $ - $ 4,100,000 $ - $ - $4,400,000 Total Expenditures $ 300,000 $ - $ 4,100,000 $ - $ - $ 4,400,000 Annual Balance $0 $0 $0 $0 $0 $0 67
73 Law Enforcement Revenue FY 2009/10 FY 2010/11 FY 2011/12 FY 2012/13 FY 2013/14 Total Impact Fees $ 924,100 $ - $ - $ 224,400 $ 740,800 $1,889,300 Optional Sales Tax $ 558,960 $ - $ - $ 4,096,000 $ - $4,654,960 Total Revenue $ 1,483,060 $ - $ - $ 4,320,400 $ 740,800 $6,544,260 Expenditures FY 2009/10 FY 2010/11 FY 2011/12 FY 2012/13 FY 2013/14 Total Revenue Source Training Facility $ 876,100 $ - $ - $ - $ 876,100 Impact Fees Furniture/Equipment for training facility $ 48,000 $ - $ - $ - $ - $ 48,000 Impact Fees Remodel Old Fleet Facility 10,000 sq ft $ - $ - $ - $ 224,400 $ - $ 224,400 Impact Fees Evidence Addition $ 558,960 $ - $ - $ - $ - $ 558,960 Optional Sales Tax Fleet Facility $ - $ - $ - $ 4,096,000 $ - $ 4,096,000 Optional Sales Tax Hangar $ - $ - $ - $ - $ 740,800 $ 740,800 Impact Fees Total Expenditures $ 1,483,060 $ - $ - $ 4,320,400 $ 740,800 $ 6,544,260 Comparison of Expenditures to Revenue FY 2009/10 FY 2010/11 FY 2011/12 FY 2012/13 FY 2013/14 Total Total Revenue $ 1,483,060 $ - $ - $ 4,320,400 $ 740,800 $ 6,544,260 Total Expenditures $ 1,483,060 $ - $ - $ 4,320,400 $ 740,800 $ 6,544,260 Annual Balance $0 $0 $0 $0 $0 $0 Parks and Recreation Revenue FY 2009/10 FY 2010/11 FY 2011/12 FY 2012/13 FY 2013/14 Total FBIP $ 200,000 $ - $ - $ - $ - $ 200,000 Grant $ 225,000 $ - $ - $ - $ - $ 225,000 68
74 Optional Sales Tax $ 3,343,545 $ - $ 1,400,000 $ - $ - $ 4,743,545 Impact Fees $ 425,000 $ 2,205,000 $ 3,575,000 $ 4,375,000 $ 1,575,000 $ 12,155,000 Total Revenue $ 4,193,545 $ 2,205,000 $ 4,975,000 $ 4,375,000 $ 1,575,000 $ 17,323,545 Expenditures FY 2009/10 FY 2010/11 FY 2011/12 FY 2012/13 FY 2013/14 Total Revenue Source Oslo Boat Ramp and Parking $ 200,000 $ - $ - $ - $ - $ 200,000 FBIP Oslo Boat Ramp and Parking $ 100,000 $ - $ - $ - $ - $ 100,000 Grant Oslo Boat Ramp and Parking $ 300,000 $ - $ - $ - $ - $ 300,000 Impact Fees S. County Regional Park improvements $ 125,000 $ - $ - $ - $ - $ 125,000 Impact Fees South County Regional Park Improvements $ 125,000 $ - $ - $ - $ - $ 125,000 Grant South County Recreation Multi Purpose Facility $ 1,843,545 $ - $ - $ - $ - $ 1,843,545 Optional Sales Tax South County Recreation Multi Purpose Facility $ - $ - $ 1,500,000 $ - $ - $ 1,500,000 Impact Fees Fairgrounds Building Enclosure $ - $ 630,000 $ - $ - $ - $ 630,000 Impact Fees Parks Maintenance Facility $ 1,500,000 $ - $ - $ - $ - $ 1,500,000 Optional Sales Tax State Road 510 Fishing Pier $ - $ - $ 1,400,000 $ - $ - $ 1,400,000 Optional Sales Tax Land for Future Parks $ - $ 1,575,000 $ 1,575,000 $ 1,575,000 $ 1,575,000 $ 6,300,000 Impact Fees West County Regional Park $ - $ - $ 500,000 $ 2,800,000 $ - $ 3,300,000 Impact Fees Total Expenditures $ 4,193,545 $ 2,205,000 $ 4,975,000 $ 4,375,000 $ 1,575,000 $ 17,323,545 Comparison of Expenditures to Revenue FY 2009/10 FY 2010/11 FY 2011/12 FY 2012/13 FY 2013/14 Total Total Revenue $ 4,193,545 $ 2,205,000 $ 4,975,000 $ 4,375,000 $ 1,575,000 $17,323,545 Total Expenditures $ 4,193,545 $ 2,205,000 $ 4,975,000 $ 4,375,000 $ 1,575,000 $ 17,323,545 Annual Balance $0 $0 $0 $0 $0 $0 Sanitary Sewer and Potable Water Revenue FY 2009/10 FY 2010/11 FY 2011/12 FY 2012/13 FY 2013/14 Total Capacity Charges & User Fees $ 17,299,793 $ 1,200,000 $ 1,500,000 $ 1,500,000 $ 1,500,000 $ 22,999,793 Total Revenue $ 17,299,793 $ 1,200,000 $ 1,500,000 $ 1,500,000 $ 1,500,000 $ 22,999,793 69
75 Expenditures FY 2009/10 FY 2010/11 FY 2011/12 FY 2012/13 FY 2013/14 Total Revenue Source Misc Water Improvements $ 250,000 $ 250,000 $ 250,000 $ 250,000 $ 250,000 $ 1,250,000 Capacity Charges & User Fees Misc Sewer Improvements $ 175,000 $ 175,000 $ 175,000 $ 175,000 $ 175,000 $ 875,000 Capacity Charges & User Fees West Reg WWTF Expansion 2.0 to 6.0 MGD $ 1,024,382 $ - $ - $ - $ - $ 1,024,382 Capacity Charges & User Fees 77th West of Kings (Tuscanny Lakes) $ 112,237 $ 112,237 $ 112,237 $ - $ - $ 336,711 12WM 17th St. SW from 27th Av to 43rd Av $ - $ - $ - $ 610,000 $ - $ 610,000 (Convert 8"FM) 16" Reuse Lateral G Conversion $ 840,343 $ - $ - $ - $ - $ 840,343 FM and WM on 4th st from 82nd to 98th ave and on 98th from 4th to 8th $ - $ - $ - $ - $ 1,000,000 $ 1,000,000 Convert North County Brine Line to Reuse Main $ 1,295,000 $ - $ - $ - $ - $ 1,295,000 12" WM on 27th Ave from 13th st SW to 17th St SW (Madera Isles & Echo Lake $ - $ - $ - $ 341,000 $ - $ 341,000 Tie South County Brine Line to Existing FM $ 270,000 $ - $ - $ - $ - $ 270,000 58th Av 65th St to 69th St & along 61st and 69th St $ 50,000 $ 500,000 $ 450,000 $ 232,000 $ - $ 1,232,000 N of Windsor & Polo Club Extension $ - $ - $ 225,000 $ 20,000 $ - $ 245,000 Svce Transmission Lines Oslo Pk, Villages of VB Gardens $ - $ - $ - $ 700,000 $ - $ 700,000 Install 12" WM along 66th Ave from 16th St to SR 60 & 16" WM along 16th St. $ 609,356 $ - $ - $ - $ - $ 609,356 Install Wells and Piping at North County RO Plant $ 1,965,580 $ - $ - $ - $ - $ 1,965,580 Install Well No.7 st S. Co. RO Plant $ 1,200,000 $ - $ - $ - $ - $ 1,200,000 Falcon Trace Developer's Agreement $ 44,502 $ 44,502 $ 44,502 $ - $ - $ 133,506 Capacity Charges & User Fees Capacity Charges & User Fees Capacity Charges & User Fees Capacity Charges & User Fees Capacity Charges & User Fees Capacity Charges & User Fees Capacity Charges & User Fees Capacity Charges & User Fees Capacity Charges & User Fees Capacity Charges & User Fees Capacity Charges & User Fees Capacity Charges & User Fees Capacity Charges & User Fees Capacity Charges & User Fees 70
76 Install 6" FM in Conjunction with 43rd Ave Road Widening $ 335,000 $ - $ - $ - $ - $ 335,000 Install 6" FM along 16th St west of 43rd Ave $ 100,000 $ - $ - $ - $ - $ 100,000 16" WM from Kingshighway Tank to College Lane $ 290,450 $ - $ - $ - $ - $ 290,450 Install 24" WM along 77th St from 66th Ave to 70th Ave then North to CR 510 $ - $ - $ 500,000 $ 880,000 $ - $ 1,380,000 N. Reg. Reuse Sto. & Repump Facility with Transmission Mains to Barrier Island $ 1,501,327 $ 1,125,038 $ - $ - $ - $ 2,626,365 Construct 8" WM on Oslo from 8th Ct. to 9th Ct. $ 30,000 $ - $ - $ - $ - $ 30,000 Construct 12" WM along 53rd St. E/O RR, Lat H Canal $ 795,000 $ - $ - $ - $ - $ 795,000 Construct 20"WM on 66th Av 41st to 77th St $ - $ - $ - $ - $ 500,000 $ 500,000 Construct 20" WM on 66th Av from 20th St. to 41st St. $ - $ 1,000,000 $ 1,500,000 $ - $ - $ 2,500,000 Verona Trace Developer's Agreement $ 40,100 $ 40,100 $ 40,100 $ - $ - $ 120,300 Madera Isle/Echo Lake Dev Agreement $ - $ - $ 97,400 $ 97,400 $ - $ 194,800 Upgrade Dataflow System w/auto Valves $ 200,000 $ - $ - $ - $ - $ 200,000 Total Expenditures $ 11,128,277 $ 3,246,877 $ 3,394,239 $ 3,305,400 $ 1,925,000 $ 22,999,793 Capacity Charges & User Fees Capacity Charges & User Fees Capacity Charges & User Fees Capacity Charges & User Fees Capacity Charges & User Fees Capacity Charges & User Fees Capacity Charges & User Fees Capacity Charges & User Fees Capacity Charges & User Fees Capacity Charges & User Fees Capacity Charges & User Fees Capacity Charges & User Fees Comparison of Expenditures to Revenue FY 2009/10 FY 2010/11 FY 2011/12 FY 2012/13 FY 2013/14 Total Total Revenue $ 17,299,793 $ 1,200,000 $ 1,500,000 $ 1,500,000 $ 1,500,000 $ 22,999,793 Total Expenditures $ 11,128,277 $ 3,246,877 $ 3,394,239 $ 3,305,400 $ 1,925,000 $ 22,999,793 Annual Balance $6,171,516 -$2,046,877 -$1,894,239 -$1,805,400 -$425,000 $0 Solid Waste Revenue FY 2009/10 FY 2010/11 FY 2011/12 FY 2012/13 FY 2013/14 Total 71
77 Assessments & User Fees $ 3,279,600 $ 3,312,300 $ 3,345,300 $ 3,378,900 $ 4,192,900 $ 17,509,000 Total Revenue $ 3,279,600 $ 3,312,300 $ 3,345,300 $ 3,378,900 $ 4,192,900 $ 17,509,000 Expenditures FY 2009/10 FY 2010/11 FY 2011/12 FY 2012/13 FY 2013/14 Total Revenue Source Citizen Convenience Center Improvement Projects Relocation & Replacement of Fellsmere Citizens Convenience Center $ 130,000 $ - $ - $ - $ - $130,000 Winter Beach Citizens Convenience Center Phase I Improvements $ - $ - $ - $ - $ 247,000 $247,000 Roseland Citizens Convenience Center Expansion and Improvements $ - $ - $ - $ 1,920,000 $ - $1,920,000 Gifford Citizens Convenience Center Expansion and Improvements $ - $ - $ 1,430,000 $ - $ - $1,430,000 Oslo Citizens Convenience Center Expansion and Improvements $ 2,500,000 $ - $ - $ - $ - $2,500,000 Transfer Tractor/Transfer Trailers and Roll-off Truck/Containers $ - $ 380,000 $ 50,000 $ 125,000 $ 75,000 $630,000 Lateral and Vertical Expansion of Segment I/Segment II/Infill $ 550,000 $ - $ - $ - $ - $ 550,000 Design, Permitting & Construction of Class I Landfill - Co Disposal (former 33 Acres for C&D) $ 3,000,000 $ - $ - $ - $ - $3,000,000 Relocation/Replacement 10,000 gal Diesel Fuel Tank $ 50,000 $ - $ - $ - $ - $50,000 Abandon. Relocate 3 Groundwater Monitoring Well Clusters $ 52,000 $ - $ - $ - $ - $52,000 Retrofit of MRF $ 50,000 $ - $ - $ - $ - $50,000 Partial Closure of Cell I, C&D Landfill, Seg-1, Seg-2 and the Infill $ 550,000 $ - $ - $ - $ 6,400,000 $6,950,000 Assessments & User Fees Assessments & User Fees Assessments & User Fees Assessments & User Fees Assessments & User Fees Assessments & User Fees Assessments & User Fees Assessments & User Fees Assessments & User Fees Assessments & User Fees Assessments & User Fees Assessments & User Fees Total Expenditures $ 6,882,000 $ 380,000 $ 1,480,000 $ 2,045,000 $ 6,722,000 $ 17,509,000 Comparison of Expenditures to Revenue FY 2009/10 FY 2010/11 FY 2011/12 FY 2012/13 FY 2013/14 Total Total Revenue $ 3,279,600 $ 3,312,300 $ 3,345,300 $ 3,378,900 $ 4,192,900 $ 17,509,000 Total Expenditures $ 6,882,000 $ 380,000 $ 1,480,000 $ 2,045,000 $ 6,722,000 $ 17,509,000 Annual Balance $ -3,602,400 $ 2,932,300 $ 1,865,300 $ 1,333,900 $ -2,529,100 $0 72
78 Stormwater Management Revenue FY 2009/10 FY 2010/11 FY 2011/12 FY 2012/13 FY 2013/14 Total Optional Sales Tax Funds $ 935,830 $ 400,000 $ 400,000 $ 400,000 $ 400,000 $2,535,830 Grant $ 114,170 $ - $ 7,750,000 $ 9,500,000 $ 8,000,000 $25,364,170 MSTU Assessments $ - $ 250,000 $ 150,000 $ 150,000 $ 150,000 $700,000 Total Revenue $ 1,050,000 $ 650,000 $ 8,300,000 $ 10,050,000 $ 8,550,000 $28,600,000 Expenditures FY 2009/10 FY 2010/11 FY 2011/12 FY 2012/13 FY 2013/14 Total Revenue Source Optional Sales Tax Egret Marsh Regional Stormwater Park $ 935,830 $ - $ - $ - $ - $ 935,830 Funds Egret Marsh Regional Stormwater Park $ 114,170 $ - $ - $ - $ - $ 114,170 Grant North Relief Canal Treatment System (Canal Screening System and Algal Turf Scrubber System) $ - $ 400,000 $ 400,000 $ - $ - $ 800,000 Optional Sales Tax Funds North Relief Canal Treatment System (Canal Screening System and Algal Turf Scrubber System) $ - $ - $ - $ 9,000,000 $ 2,200,000 $ 11,200,000 Grant South Relief Canal Treatment System (Canal Screening System and Algal Turf Scrubber System) $ - $ - $ - $ 400,000 $ - $ 400,000 Optional Sales Tax Funds South Relief Canal Treatment System (Canal Screening System and Algal Turf Scrubber System) $ - $ - $ - $ - $ 5,800,000 $ 5,800,000 Grant Rockridge Surge Protection Project $ - $ - $ 5,750,000 $ - $ - $ 5,750,000 Grant Rockridge Surge Protection Project $ - $ - $ 2,000,000 $ - $ - $ 2,000,000 Grant Vero Lake Estates Phase II and III $ - $ 250,000 $ 150,000 $ 150,000 $ 150,000 $ 700,000 MSTU Assessments Optional Sales Tax Vero Lake Estates Phase II and III $ - $ - $ - $ - $ 400,000 $ 400,000 Funds Vero Lake Estates Phase II and III $ - $ - $ - $ 500,000 $ - $ 500,000 Grant Total Expenditures $ 1,050,000 $ 650,000 $ 8,300,000 $ 10,050,000 $ 8,550,000 $ 28,600,000 Comparison of Expenditures to Revenue FY 2009/10 FY 2010/11 FY 2011/12 FY 2012/13 FY 2013/14 Total Total Revenue $ 1,050,000 $ 650,000 $ 8,300,000 $ 10,050,000 $ 8,550,000 $ 28,600,000 Total Expenditures $ 1,050,000 $ 650,000 $ 8,300,000 $ 10,050,000 $ 8,550,000 $ 28,600,000 73
79 Annual Balance $0 $0 $0 $0 $0 $0 Transportation Revenue FY 2009/10 FY 2010/11 FY 2011/12 FY 2012/13 FY 2013/14 Total Gas Tax $ 5,198,000 $ 2,152,000 $ 2,182,000 $ 4,858,000 $ 51,043,137 $ 65,433,137 Payback from FDOT-Gas Tax $ 6,554,173 $ 7,865,009 $ - $ - $ - $ 14,419,182 Interest $ 415,000 $ 500,000 $ 500,000 $ 500,000 $ 478,089 $ 2,393,089 Grant $ 2,191,520 $ 5,320,000 $ 2,000,000 $ 3,000,000 $ 2,339,000 $ 14,850,520 Traffic Impact Fees District I $ 200,000 $ 400,000 $ 700,000 $ 1,200,000 $ 2,000,000 $ 4,500,000 Traffic Impact Fees District II $ 20,955,000 $ 1,000,000 $ 1,500,000 $ 2,000,000 $ 2,500,000 $ 27,955,000 Traffic Impact Fees District III $ 12,222,000 $ 800,000 $ 1,300,000 $ 1,800,000 $ 2,500,000 $ 18,622,000 Developer Contributions $ - $ - $ 2,000,000 $ 2,000,000 $ - $ 4,000,000 Optional Sales Tax $ 13,888,955 $ 3,543,960 $ 3,543,960 $ 3,543,960 $ 3,543,960 $ 28,064,795 Payback from FDOT- Optional Sales Tax $ 3,376,393 $ 4,051,671 $ 2,000,000 $ 4,000,000 $ 4,771,900 $ 18,199,964 Old Traffic Impact Fees $ 998,500 $ - $ - $ - $ - $ 998,500 Total Revenue $ 65,999,541 $ 25,632,640 $ 15,725,960 $ 22,901,960 $ 69,176,086 $ 199,436,187 Expenses FY 2009/10 FY 2010/11 FY 2011/12 FY 2012/13 FY 2013/14 Total Gas Tax $ 9,778,980 $ 6,210,780 $ 16,508,888 $ 23,308,888 $ 25,496,194 $ 81,303,730 Grant $ 2,191,520 $ 5,320,000 $ 2,000,000 $ 3,000,000 $ 2,339,000 $ 14,850,520 Traffic Impact Fees- District I $ 200,000 $ 1,269,220 $ - $ 3,100,000 $ - $ 4,569,220 Traffic Impact Fees- District II $ 11,720,300 $ 7,520,000 $ 5,650,000 $ 3,491,374 $ - $ 28,381,674 Traffic Impact Fees- District III $ 12,340,000 $ 3,565,000 $ 100,000 $ 250,000 $ 1,250,000 $ 17,505,000 Old Impact Fees II $ 998,500 $ - $ - $ - $ - $ 998,500 74
80 Developer Contributions $ - $ - $ 2,000,000 $ 2,000,000 $ - $ 4,000,000 Optional Sales Tax $ 9,057,700 $ 7,719,843 $ 3,200,000 $ 11,650,000 $ 16,200,000 $ 47,827,543 Total Expenses $ 46,287,000 $ 31,604,843 $ 29,458,888 $ 46,800,262 $ 45,285,194 $ 199,436,187 Variance $ 19,712,541 $ -5,972,203 $ -13,732,928 $ -23,898,302 $ 23,890,892 $ 0 Expenses FY 2009/10 FY 2010/11 FY 2011/12 FY 2012/13 FY 2013/14 Grand Total Revenue Source 12th Street/27th Avenue $ - $ - $ 200,000 $ - $ - $ 200,000 Impact Fees II Design & Engineering $ - $ - $ - $ - $ - $ - Right-of-Way $ - $ - $ - $ - $ - $ - Construction $ - $ - $ 200,000 $ - $ - $ 200,000 16th Street, 66th Avenue to 74th Avenue, two lanes (1 mile) $ 760,000 $ - $ - $ - $ - $ 760,000 Gas Tax 16th Street, 66th Avenue to 74th Avenue, two lanes (1 mile) $ 1,000,000 $ - $ - $ - $ - $ 1,000,000 Optional Sales Tax Design & Engineering $ 110,000 $ - $ - $ - $ - $ 110,000 Right-of-Way $ 50,000 $ - $ - $ - $ - $ 50,000 Construction $ 1,600,000 $ - $ - $ - $ - $ 1,600,000 17th Lane SW - 20th Avenue SW to 27th Avenue SW $ 55,000 $ - $ - $ - $ - $ 55,000 Optional Sales Tax 17th Lane SW - 20th Avenue SW to 27th Avenue SW $ 300,000 $ - $ - $ - $ - $ 300,000 Impact Fees III Design & Engineering $ 5,000 $ - $ - $ - $ - $ 5,000 Right-of-Way $ - $ - $ - $ - $ - $ - Construction $ 350,000 $ - $ - $ - $ - $ 350,000 17th Street/A1A Intersection $ 998,500 $ - $ - $ - $ - $ 998,500 Old Impact Fees II 75
81 17th Street/A1A Intersection $ 101,500 $ - $ - $ - $ - $ 101,500 Gas Tax Design & Engineering $ - $ - $ - $ - $ - $ - Right-of-Way $ 300,000 $ - $ - $ - $ - $ 300,000 Construction $ 800,000 $ - $ - $ - $ - $ 800,000 20th Avenue SW, 17th Street SW to 25th Street SW, two lanes (1 mile) $ 1,150,000 $ - $ - $ - $ - $ 1,150,000 Gas Tax 20th Avenue SW, 17th Street SW to 25th Street SW, two lanes (1 mile) $ - $ - $ - $ - $ - $ - Impact Fees III Design & Engineering $ 50,000 $ - $ - $ - $ - $ 50,000 Right-of-Way $ - $ - $ - $ - $ - $ - Construction $ 1,100,000 $ - $ - $ - $ - $ 1,100,000 26th Street, 43rd Avenue to 66th Avenue, four/five lanes (2 mile) $ 200,000 $ 200,000 $ 100,000 $ - $ - $ 500,000 Impact Fees II Design & Engineering $ 200,000 $ 200,000 $ 100,000 $ - $ - $ 500,000 Right-of-Way $ - $ - $ - $ - $ - $ - Construction $ - $ - $ - $ - $ - $ - 26th Street, 43rd Avenue to US #1, four/five lanes (2 miles) $ 200,000 $ - $ 2,000,000 $ - $ - $ 2,200,000 Impact Fees II 26th Street, 43rd Avenue to US #1, four/five lanes (2 miles) $ - $ 5,190,000 $ - $ - $ - $ 5,190,000 Grant 26th Street, 43rd Avenue to US #1, four/five lanes (2 miles) $ - $ - $ 4,000,000 $ - $ - $ 4,000,000 Gas Tax Design & Engineering $ 200,000 $ 100,000 $ - $ - $ - $ 300,000 Right-of-Way $ - $ - $ - $ - $ - $ - Construction $ - $ 5,090,000 $ 6,000,000 $ - $ - $ 11,090,000 26th Street, 74th Avenune to 82nd Avenue, two lanes $ 750,000 $ - $ - $ - $ - $ 750,000 Gas Tax Design & Engineering $ - $ - $ - $ - $ - $ - 76
82 Right-of-Way $ - $ - $ - $ - $ - $ - Construction $ 750,000 $ - $ - $ - $ - $ 750,000 43rd Ave. 3-lane and Bridge Replacements 5th Street and 43rd Avenue over S. Relief Canal $ 2,100,000 $ - $ - $ - $ - $ 2,100,000 Optional Sales Tax Design & Engineering $ 100,000 $ - $ - $ - $ - $ 100,000 Right-of-Way $ - $ - $ - $ - $ - $ - Construction $ 2,000,000 $ - $ - $ - $ - $ 2,000,000 43rd Avenue, 49th Street to 53rd Street, three lanes (.5 miles) $ - $ - $ 1,000,000 $ - $ - $ 1,000,000 Developer Contributions Design & Engineering $ - $ - $ - $ - $ - $ - Right-of-Way $ - $ - $ - $ - $ - $ - Construction $ - $ - $ 1,000,000 $ - $ - $ 1,000,000 43rd Avenue, 12th Street to 18th Street, four lanes (1 mile) $ 580,000 $ 520,000 $ 2,000,000 $ 1,341,374 $ - $ 4,441,374 Impact Fees II 43rd Avenue, 12th Street to 18th Street, four lanes (1 mile) $ - $ - $ 1,500,000 $ 2,500,000 $ - $ 4,000,000 Gas Tax Design & Engineering $ 80,000 $ 20,000 $ - $ - $ - $ 100,000 Right-of-Way $ 500,000 $ 500,000 $ 500,000 $ - $ - $ 1,500,000 Construction $ - $ - $ 3,000,000 $ 3,841,374 $ - $ 6,841,374 43rd Avenue,12th Street to Oslo Road, four lanes (2.5 miles) $ - $ - $ - $ - $ - $ - Optional Sales Tax 43rd Avenue,12th Street to Oslo Road, four lanes (2.5 miles) $ 180,000 $ 120,000 $ 100,000 $ 250,000 $ 1,250,000 $ 1,900,000 Impact Fees III Design & Engineering $ 80,000 $ 20,000 $ - $ - $ - $ 100,000 Right-of-Way $ 100,000 $ 100,000 $ 100,000 $ 250,000 $ 250,000 $ 800,000 Construction $ - $ - $ - $ - $ 1,000,000 $ 1,000,000 77
83 43rd Avenue/SR 60-18th Street to 26th Street - 4 lanes $ 4,000,000 $ 1,500,000 $ - $ - $ - $ 5,500,000 Impact Fees II 43rd Avenue/SR 60-18th Street to 26th Street - 4 lanes $ - $ 2,100,000 $ 7,100,000 $ - $ - $ 9,200,000 Gas Tax 43rd Avenue/SR 60-18th Street to 26th Street - 4 lanes $ 1,500,000 $ - $ 2,000,000 $ - $ - $ 3,500,000 Optional Sales Tax Design & Engineering $ 500,000 $ 100,000 $ 100,000 $ - $ - $ 700,000 Right-of-Way $ 1,500,000 $ 1,500,000 $ 2,000,000 $ - $ - $ 5,000,000 Construction $ 3,500,000 $ 2,000,000 $ 7,000,000 $ - $ - $ 12,500,000 45th Street Beautification $ 200,000 $ - $ - $ - $ - $ 200,000 Gas Tax Design & Engineering $ - $ - $ - $ - $ - $ - Right-of-Way $ - $ - $ - $ - $ - $ - Construction $ 200,000 $ - $ - $ - $ - $ 200,000 53rd Street 58th Avenue to IR Blvd, add four lanes $ 3,200,000 $ 1,500,000 $ - $ - $ - $ 4,700,000 Impact Fees II 53rd Street 58th Avenue to IR Blvd, add four lanes $ - $ - $ - $ - $ - $ - Optional Sales Tax 53rd Street 58th Avenue to IR Blvd, add four lanes $ - $ - $ - $ - $ - $ - Developer Contributions Design & Engineering $ 200,000 $ - $ - $ - $ - $ 200,000 Right-of-Way $ - $ - $ - $ - $ - $ - Construction $ 3,000,000 $ 1,500,000 $ - $ - $ - $ 4,500,000 58th Avenue / SR 60 Intersection $ 650,000 $ 1,100,000 $ 1,350,000 $ 2,150,000 $ - $ 5,250,000 Impact Fees II 58th Avenue / SR 60 Intersection $ - $ - $ - $ 2,100,000 $ 7,796,194 $ 9,896,194 Gas Tax 58th Avenue / SR 60 Intersection $ - $ - $ - $ - $ 5,000,000 $ 5,000,000 Optional Sales Tax 58th Avenue / SR 60 Intersection $ - $ - $ - $ - $ - $ - Developer Contributions 58th Avenue / SR 60 Intersection $ - $ - $ - $ 1,500,000 $ 2,339,000 $ 3,839,000 Grant Design & Engineering $ 150,000 $ 100,000 $ 100,000 $ 100,000 $ - $ 450,000 78
84 Right-of-Way $ - $ 1,000,000 $ 1,250,000 $ 2,650,000 $ - $ 4,900,000 Construction $ 500,000 $ - $ - $ 3,000,000 $ 15,135,194 $ 18,635,194 58th Avenue 49th-65th St - 4 lanes-58th Ave26th to 53rd $ - $ - $ 1,000,000 $ 2,000,000 $ - $ 3,000,000 Developer Contributions Design & Engineering $ - $ - $ - $ - $ - $ - Right-of-Way $ - $ - $ - $ - $ - $ - Construction $ - $ - $ 1,000,000 $ 2,000,000 $ - $ 3,000,000 66th Ave 4th-12th St $ 2,900,000 $ - $ - $ - $ - $ 2,900,000 Impact Fees III 66th Ave 4th-12th St $ - $ 3,000,000 $ - $ - $ - $ 3,000,000 Optional Sales Tax Design & Engineering $ 300,000 $ - $ - $ - $ - $ 300,000 Right-of-Way $ 600,000 $ - $ - $ - $ - $ 600,000 Construction $ 2,000,000 $ 3,000,000 $ - $ - $ - $ 5,000,000 66th Ave, 12th to SR60 $ 1,890,300 $ - $ - $ - $ - $ 1,890,300 Impact Fees II 66th Ave, 12th to SR60 $ - $ - $ - $ - $ - $ - Gas Tax 66th Ave, 12th to SR60 $ 209,700 $ - $ - $ - $ - $ 209,700 Grant Design & Engineering $ 100,000 $ - $ - $ - $ - $ 100,000 Right-of-Way $ - $ - $ - $ - $ - $ - Construction $ 2,000,000 $ - $ - $ - $ - $ 2,000,000 66th Avenue - 77th Street to Barber St., four lanes (2.25 miles) & Side Streets $ - $ 1,000,000 $ - $ 1,100,000 $ - $ 2,100,000 Impact Fees I 66th Avenue - 77th Street to Barber St., four lanes (2.25 miles) & Side Streets $ 2,500,000 $ 1,100,000 $ 100,000 $ 1,000,000 $ - $ 4,700,000 Gas Tax 66th Avenue - 77th Street to Barber St., four lanes (2.25 miles) & Side Streets $ - $ - $ - $ 1,500,000 $ - $ 1,500,000 Grant 66th Avenue - 77th Street to Barber St., four lanes (2.25 miles) & Side Streets $ - $ - $ - $ 7,450,000 $ - $ 7,450,000 Optional Sales Tax 79
85 Design & Engineering $ 500,000 $ 100,000 $ 100,000 $ 200,000 $ - $ 900,000 Right-of-Way $ 2,000,000 $ 2,000,000 $ - $ - $ - $ 4,000,000 Construction $ - $ - $ - $ 10,850,000 $ - $ 10,850,000 66th Avenue, 41st Street to 77th Street, four lanes (4.0-miles), Includes side streets & side street bridges $ 1,000,000 $ 1,000,000 $ - $ - $ - $ 2,000,000 Impact Fees II Design & Engineering $ - $ - $ - $ - $ - $ - Right-of-Way $ 1,000,000 $ 1,000,000 $ - $ - $ - $ 2,000,000 Construction $ - $ - $ - $ - $ - $ - 66th Avenue,SR 60 to 41st Street, four lanes (4.0- miles), Includes side streets & side street bridges $ 800,000 $ - $ - $ - $ - $ 800,000 Optional Sales Tax 66th Avenue,SR 60 to 41st Street, four lanes (4.0- miles), Includes side streets & side street bridges $ - $ - $ 2,000,000 $ - $ - $ 2,000,000 Grant 66th Avenue,SR 60 to 41st Street, four lanes (4.0- miles), Includes side streets & side street bridges $ - $ 1,700,000 $ - $ - $ - $ 1,700,000 Impact Fees II 66th Avenue,SR 60 to 41st Street, four lanes (4.0- miles), Includes side streets & side street bridges $ - $ - $ 1,608,888 $ 3,608,888 $ - $ 5,217,776 Gas Tax Design & Engineering $ 400,000 $ 100,000 $ - $ - $ - $ 500,000 Right-of-Way $ 400,000 $ 1,600,000 $ - $ - $ - $ 2,000,000 Construction $ - $ - $ 3,608,888 $ 3,608,888 $ - $ 7,217,776 82nd Avenue Over Lateral D Canal and 4th Street/82nd Ave. Intersection Widening $ - $ 1,509,843 $ - $ - $ - $ 1,509,843 Optional Sales Tax 82nd Avenue Over Lateral D Canal and 4th Street/82nd Ave. Intersection Widening $ 60,000 $ 80,000 $ - $ - $ - $ 140,000 Gas Tax Design & Engineering $ 60,000 $ 80,000 $ - $ - $ - $ 140,000 Right-of-Way $ - $ - $ - $ - $ - $ - Construction $ - $ 1,509,843 $ - $ - $ - $ 1,509,843 CR st Drive to Indian River, four lanes $ 700,000 $ 130,780 $ 400,000 $ 2,300,000 $ 5,500,000 $ 9,030,780 Gas Tax 80
86 CR st Drive to Indian River, four lanes (1.6 miles) $ 200,000 $ 269,220 $ - $ - $ - $ 469,220 Impact Fees I CR st Drive to Indian River, four lanes (1.6 miles) $ - $ - $ - $ - $ 5,000,000 $ 5,000,000 Optional Sales Tax Design & Engineering $ 500,000 $ - $ - $ - $ - $ 500,000 Right-of-Way $ 400,000 $ 400,000 $ 400,000 $ 2,300,000 $ 500,000 $ 4,000,000 Construction $ - $ - $ - $ - $ 10,000,000 $ 10,000,000 CR 510, 75th Court to 61st Drive, four lanes (1.5 miles) $ 900,000 $ 700,000 $ 600,000 $ 4,700,000 $ 3,500,000 $ 10,400,000 Gas Tax Design & Engineering $ 300,000 $ 100,000 $ - $ - $ - $ 400,000 Right-of-Way $ 600,000 $ 600,000 $ 600,000 $ 1,200,000 $ - $ 3,000,000 Construction $ - $ - $ - $ 3,500,000 $ 3,500,000 $ 7,000,000 CR 510, CR 512 to 75th Court, four lanes (4.5 miles) $ - $ - $ - $ 2,000,000 $ - $ 2,000,000 Impact Fees I CR 510, CR 512 to 75th Court, four lanes (4.5 miles) $ 800,000 $ 400,000 $ 500,000 $ 6,400,000 $ 8,000,000 $ 16,100,000 Gas Tax CR 510, CR 512 to 75th Court, four lanes (4.5 miles) $ - $ - $ - $ 3,000,000 $ 5,000,000 $ 8,000,000 Optional Sales Tax Design & Engineering $ 400,000 $ - $ 100,000 $ 100,000 $ - $ 600,000 Right-of-Way $ 400,000 $ 400,000 $ 400,000 $ 1,800,000 $ - $ 3,000,000 Construction $ - $ - $ - $ 9,500,000 $ 13,000,000 $ 22,500,000 CR 512 Phase 4, Sebastian Middle School to I-95, four lanes (2 miles) $ - $ - $ - $ - $ - $ - Impact Fees I CR 512 Phase 4, Sebastian Middle School to I-95, four lanes (2 miles) $ 187,480 $ - $ - $ - $ - $ 187,480 Gas Tax CR 512 Phase 4, Sebastian Middle School to I-95, four lanes (2 miles) $ - $ - $ - $ - $ - $ - Optional Sales Tax CR 512 Phase 4, Sebastian Middle School to I-95, four lanes (2 miles) $ 822,520 $ - $ - $ - $ - $ 822,520 Grant Design & Engineering $ 10,000 $ - $ - $ - $ - $ 10,000 Right-of-Way $ - $ - $ - $ - $ - $ - 81
87 Construction $ 1,000,000 $ - $ - $ - $ - $ 1,000,000 Indian River Drive Sidewalk- North $ 300,000 $ - $ - $ - $ - $ 300,000 Grant Indian River Drive Sidwealk- North $ 220,000 $ - $ - $ - $ - $ 220,000 Gas Tax Design & Engineering $ 20,000 $ - $ - $ - $ - $ 20,000 Right-of-Way $ - $ - $ - $ - $ - $ - Construction $ 500,000 $ - $ - $ - $ - $ 500,000 12th Street Sidewalk-43rd to 27th Ave $ 135,000 $ - $ - $ - $ - $ 135,000 Grant Design & Engineering $ 5,000 $ - $ - $ - $ - $ 5,000 Right-of-Way $ - $ - $ - $ - $ - $ - Construction $ 130,000 $ - $ - $ - $ - $ 130,000 12th Street Sidewalk-VBE-11th Ave $ 187,000 $ - $ - $ - $ - $ 187,000 Grant Design & Engineering $ 7,000 $ - $ - $ - $ - $ 7,000 Right-of-Way $ - $ - $ - $ - $ - $ - Construction $ 180,000 $ - $ - $ - $ - $ 180,000 Misc. Intersection Improvements $ 300,000 $ 600,000 $ 600,000 $ 600,000 $ 600,000 $ 2,700,000 Optional Sales Tax Design & Engineering $ 300,000 $ 100,000 $ 100,000 $ 100,000 $ 100,000 $ 700,000 Right-of-Way $ - $ - $ - $ - $ - $ - Construction $ - $ 500,000 $ 500,000 $ 500,000 $ 500,000 $ 2,000,000 Misc. Right of Way Acquisition $ 500,000 $ 500,000 $ 500,000 $ 500,000 $ 500,000 $ 2,500,000 Gas Tax Misc. Right of Way Acquisition $ 500,000 $ 500,000 $ 500,000 $ 500,000 $ 500,000 $ 2,500,000 Optional Sales Tax Right-of-Way $ 1,000,000 $ 1,000,000 $ 1,000,000 $ 1,000,000 $ 1,000,000 $ 5,000,000 82
88 Old Dixie Hwy/SRC - included in 3 lane $ 2,700,000 $ - $ - $ - $ - $ 2,700,000 Impact Fees III Old Dixie Hwy/SRC - included in 3 lane $ - $ - $ - $ - $ - $ - Optional Sales Tax Design & Engineering $ 100,000 $ - $ - $ - $ - $ 100,000 Right-of-Way $ - $ - $ - $ - $ - $ - Construction $ 2,600,000 $ - $ - $ - $ - $ 2,600,000 Oslo Road, 27th Avenue to 43rd Avenue, four lanes (1 mile) $ 4,400,000 $ 2,000,000 $ - $ - $ - $ 6,400,000 Impact Fees III Oslo Road, 27th Avenue to 43rd Avenue, four lanes (1 mile) $ 500,000 $ 1,000,000 $ - $ - $ - $ 1,500,000 Gas Tax Design & Engineering $ 200,000 $ - $ - $ - $ - $ 200,000 Right-of-Way $ 2,700,000 $ - $ - $ - $ - $ 2,700,000 Construction $ 2,000,000 $ 3,000,000 $ - $ - $ - $ 5,000,000 Oslo Road, 43rd Avenue to 58th Avenue, four lanes (1 mile) $ 1,500,000 $ 1,000,000 $ - $ - $ - $ 2,500,000 Impact Fees III Oslo Road, 43rd Avenue to 58th Avenue, four lanes (1 mile) $ 1,600,000 $ 2,000,000 $ - $ - $ - $ 3,600,000 Optional Sales Tax Design & Engineering $ 100,000 $ - $ - $ - $ - $ 100,000 Right-of-Way $ 1,000,000 $ - $ - $ - $ - $ 1,000,000 Construction $ 2,000,000 $ 3,000,000 $ - $ - $ - $ 5,000,000 SR A1A Widening Castaway Boulevard to Moorings $ - $ 445,000 $ - $ - $ - $ 445,000 Impact Fees III Design & Engineering $ - $ - $ - $ - $ - $ - Right-of-Way $ - $ - $ - $ - $ - $ - Construction $ - $ 445,000 $ - $ - $ - $ 445,000 8th Street Sidewalk (US1 to 6th Avenue) $ 34,700 $ - $ - $ - $ - $ 34,700 Optional Sales Tax 83
89 8th Street Sidewalk (US1 to 6th Avenue) $ 105,300 $ - $ - $ - $ - $ 105,300 Grant Design & Engineering $ 10,000 $ - $ - $ - $ - $ 10,000 Right-of-Way $ - $ - $ - $ - $ - $ - Construction $ 130,000 $ - $ - $ - $ - $ 130,000 8th Street Sidewalk (18th Ct to Old Dixie Hwy) $ - $ 10,000 $ - $ - $ - $ 10,000 Optional Sales Tax 8th Street Sidewalk (18th Ct to Old Dixie Hwy) $ - $ 130,000 $ - $ - $ - $ 130,000 Grant Design & Engineering $ - $ 10,000 $ - $ - $ - $ 10,000 Right-of-Way $ - $ - $ - $ - $ - $ - Construction $ - $ 130,000 $ - $ - $ - $ 130,000 Indian River Blvd Sidewalk (12th Street to 17th Street) $ 18,000 $ - $ - $ - $ - $ 18,000 Optional Sales Tax Indian River Blvd Sidewalk (12th Street to 17th Street) $ 432,000 $ - $ - $ - $ - $ 432,000 Grant Design & Engineering $ 50,000 $ - $ - $ - $ - $ 50,000 Right-of-Way $ - $ - $ - $ - $ - $ - Construction $ 400,000 $ - $ - $ - $ - $ 400,000 13th Street SW (From 35th Avenue to 31st Avenue) $ 250,000 $ - $ - $ - $ - $ 250,000 Gas Tax 13th Street SW (From 35th Avenue to 31st Avenue) $ 360,000 $ - $ - $ - $ - $ 360,000 Impact Fees III Design & Engineering $ 10,000 $ - $ - $ - $ - $ 10,000 Right-of-Way $ - $ - $ - $ - $ - $ - Construction $ 600,000 $ - $ - $ - $ - $ 600,000 Traffic controllers $ 100,000 $ 100,000 $ 100,000 $ 100,000 $ 100,000 $ 500,000 Gas Tax Traffic Fiber Optic $ 100,000 $ 100,000 $ 100,000 $ 100,000 $ 100,000 $ 500,000 Gas Tax 84
90 Traffic Fiber Optic $ 100,000 $ 100,000 $ 100,000 $ 100,000 $ 100,000 $ 500,000 Optional Sales Tax Bridge at Lateral A Canal-East of 66th Ave $ 750,000 $ - $ - $ - $ - $ 750,000 Optional Sales Tax Construction $ 750,000 $ - $ - $ - $ - $ 750,000 IR Lagoon-Misc Paving Projects $ 300,000 $ - $ - $ - $ - $ 300,000 Construction $ 300,000 $ - $ - $ - $ - $ 300,000 Optional Sales Tax Design & Engineering $ 5,047,000 $ 1,030,000 $ 600,000 $ 500,000 $ 100,000 $ 7,277,000 Right-of-Way $ 12,550,000 $ 10,100,000 $ 6,250,000 $ 9,200,000 $ 1,750,000 $ 39,850,000 Construction $ 28,390,000 $ 20,174,843 $ 22,308,888 $ 36,800,262 $ 43,135,194 $ 150,809,187 Traffic Controllers & Fiber Optic $ 300,000 $ 300,000 $ 300,000 $ 300,000 $ 300,000 $ 1,500,000 Total Transportation Expenditures $ 46,287,000 $ 31,604,843 $ 29,458,888 $ 46,800,262 $ 45,285,194 $ 199,436,187 Comparison of Expenditures to Revenue FY 2009/10 FY 2010/11 FY 2011/12 FY 2012/13 FY 2013/14 Total Total Revenue $ 65,999,541 $ 25,632,640 $ 15,725,960 $ 22,901,960 $ 69,176,086 $ 199,436,187 Total Expenditures $ 46,287,000 $ 31,604,843 $ 29,458,888 $ 46,800,262 $ 45,285,194 $ 199,436,187 Annual Balance $19,712,541 -$5,972,203 -$13,732,928 -$23,898,302 $23,890,892 $0 Revenue and Expenditure Summary Revenue Source FY 2009/10 FY 2010/11 FY 2011/12 FY 2012/13 FY 2013/14 Total Env. Land Bonds $ 450,000 $ - $ 50,000 $ - $ - $ 500,000 Grant $ 3,005,690 $ 5,720,000 $ 9,800,000 $ 12,500,000 $ 10,339,000 $ 41,364,690 Emergency Services Dist. $ 1,686,705 $ - $ - $ - $ - $ 1,686,705 Optional Sales Tax $ 22,727,290 $ 3,943,960 $ 9,193,960 $ 8,039,960 $ 3,943,960 $ 47,849,130 85
91 Impact Fees (Emergency Services, General Servics, Law Enforcement, Parks & Rec.) $ 1,349,100 $ 2,205,000 $ 3,575,000 $ 6,799,400 $ 2,315,800 $ 16,244,300 Court Facility Surcharge $ - $ - $ 250,000 $ - $ - $ 250,000 FBIP $ 200,000 $ - $ - $ - $ - $ 200,000 Capacity Charges & User Fees $ 17,299,793 $ 1,200,000 $ 1,500,000 $ 1,500,000 $ 1,500,000 $ 22,999,793 Assessments & User Fees $ 3,279,600 $ 3,312,300 $ 3,345,300 $ 3,378,900 $ 4,192,900 $ 17,509,000 MSTU Assessments $ - $ 250,000 $ 150,000 $ 150,000 $ 150,000 $ 700,000 Gas Tax $ 5,198,000 $ 2,152,000 $ 2,182,000 $ 4,858,000 $ 51,043,137 $ 65,433,137 Payback from FDOT-Gas Tax $ 6,554,173 $ 7,865,009 $ - $ - $ - $ 14,419,182 Interest $ 415,000 $ 500,000 $ 500,000 $ 500,000 $ 478,089 $ 2,393,089 Traffic Impact Fees District I $ 200,000 $ 400,000 $ 700,000 $ 1,200,000 $ 2,000,000 $ 4,500,000 Traffic Impact Fees District II $ 20,955,000 $ 1,000,000 $ 1,500,000 $ 2,000,000 $ 2,500,000 $ 27,955,000 Traffic Impact Fees District III $ 12,222,000 $ 800,000 $ 1,300,000 $ 1,800,000 $ 2,500,000 $ 18,622,000 Developer Contributions $ - $ - $ 2,000,000 $ 2,000,000 $ - $ 4,000,000 Payback from FDOT- Optional Sales Tax $ 3,376,393 $ 4,051,671 $ 2,000,000 $ 4,000,000 $ 4,771,900 $ 18,199,964 Old Traffic Impact Fees $ 998,500 $ - $ - $ - $ - $ 998,500 TOTAL $ 99,917,244 $ 33,399,940 $ 38,046,260 $ 48,726,260 $ 85,734,786 $ 305,824,490 Expenditures by Category FY 2009/10 FY 2010/11 FY 2011/12 FY 2012/13 FY 2013/14 Total Conservation and Aquifer Recharge $925,000 $400,000 $100,000 $ - $ - $ 1,425,000 Emergency Services $5,386,705 $ - $ - $2,200,000 $ - $ 7,586,705 General Services $300,000 $ - $4,100,000 $ - $ - $ 4,400,000 Law Enforcement $1,483,060 $ - $ - $4,320,400 $740,800 $ 6,544,260 Parks and Recreation $4,193,545 $2,205,000 $4,975,000 $4,375,000 $1,575,000 $ 17,323,545 Sanitary Sewer and Potable Water $11,128,277 $3,246,877 $3,394,239 $3,305,400 $1,925,000 $ 22,999,793 Solid Waste $6,882,000 $380,000 $1,480,000 $2,045,000 $6,722,000 $ 17,509,000 Stormwater Management $1,050,000 $650,000 $8,300,000 $10,050,000 $8,550,000 $ 28,600,000 Transportation $46,287,000 $31,604,843 $29,458,888 $46,800,262 $45,285,194 $ 199,436,187 Total $77,635,587 $38,486,720 $51,808,127 $73,096,062 $64,797,994 $ 305,824,490 Total Revenues All Categories $ 99,917,244 $ 33,399,940 $ 38,046,260 $ 48,726,260 $ 85,734,786 $ 305,824,490 Total Expenditures All Categories $ 77,635,587 $ 38,486,720 $ 51,808,127 $ 73,096,062 $ 64,797,994 $ 305,824,490 Difference $ 22,281,657 $ -5,086,780 $ -13,761,867 $ -24,369,802 $ 20,936,792 $ 0 86
92 APPENDIX B: PRIORITY TRANSPORTATION CAPITAL IMPROVEMENTS PROGRAM Priority Transportation Capital Improvements Facility From To Improvement Type Estimated Begin Date Estimated Completion Date Estimated Cost 43rd Ave 18 th St 26 th St Widening from 2 to 4 lanes (1 mile) July-10 Jan-12 $18,200,000 County Projects 43rd Ave 12th St 18th St Widening from 2 to 4 lanes (1 mile) Oct-11 April-13 $8,441,374 Oslo Rd 27 th Ave 43 rd Ave Widening from 2 to 4/5 lanes August-10 March-11 $7,900,000 Oslo Rd 43 rd Ave 58 th Ave Widening from 2 to 4/5 lanes August -10 March-11 $6,100,000 87
93 APPENDIX C: 2030 ROADWAY IMPROVEMENT PLAN The Metropolitan Planning Organization (MPO) has adopted its 2030 Long Range Transportation Plan (LRTP). This plan prioritizes roadway improvements through a 20 year planning horizon. The table below lists these prioritized roadway improvements. Because the LRTP prioritizes long range roadway projects through 2030, or contains projects funded entirely by non-county sources, it includes some projects that are not in Appendix A, the Five Year Schedule of Capital Improvements. SIS State Roads County Roads 2030 Roadway Improvement Plan (Table of the Transportation Element) On Street From To Base Road Type Future Road Type Total Cost I-95 S. County Line N. County Line 4 Lane Freeway 6 Lane Freeway $109,919,000 SR 60 98th Ave I-95 4 Lane Divided 6 Lane Divided $2,543,842 SIS Total $112,462,842 SR 60 I-95 82nd Ave 4 Lane Divided 6 Lane Divided $8,119,445 SR 60 6th Ave Indian River Blvd 4 Lane Divided 6 Lane Divided $1,864,758 US 1 S. County Line Oslo Rd 4 Lane Divided 6 Lane Divided $12,064,823 US 1 Aviation Blvd Old Dixie Hwy (N) 4 Lane Divided 6 Lane Divided $44,372,047 US 1 Roseland Rd N. County Line 4 Lane Divided 6 Lane Divided $5,255,518 Congestion Management System Projects ($500,000 Per Year) $10,000,000 Other State Roads Total $81,676,591 4th St 98th Ave 66th Ave 00 2 Lane Undivided $16,262,035 12th St 90th Ave 82nd Ave 00 2 Lane Undivided $3,781,786 12th St 43rd Ave 27th Ave 2 Lane Undivided 2 Lane Divided $2,854,618 13th St SW 66th Ave 58th Ave 00 2 Lane Undivided $4,041,388 13th St SW 43rd Ave 34th Ave 00 2 Lane Undivided $1,560,899 13th St SW 34th Ave 27th Ave 00 2 Lane Undivided $3,359,684 88
94 2030 Roadway Improvement Plan (Table of the Transportation Element) On Street From To Base Road Type Future Road Type Total Cost 13th St SW 27th Ave 20th Ave 00 2 Lane Undivided $1,922,225 17th St SW 66th Ave 58th Ave 00 2 Lane Undivided $4,019,519 26th St 66th Ave 43rd Ave 2 Lane Undivided 4 Lane Divided $13,006,154 26th St 82nd Ave 74th Ave 00 2 Lane Undivided $3,850,481 Aviation Blvd 43rd Ave U.S. 1 2 Lane Undivided 4 Lane Divided $8,537,828 27th Ave S. County Line Oslo Rd 2 Lane Undivided 4 Lane Divided $9,560,909 27th Ave Oslo Rd S.R Lane Undivided 2 Lane Divided $12,330,699 43rd Ave S County Line Oslo Rd 2 Lane Undivided 4 Lane Divided $12,974,563 43rd Ave Oslo Rd 8th St 2 Lane Undivided 2 Lane Divided $8,311,058 53rd St 82nd Ave 66th Ave 00 2 Lane Undivided $9,599,620 58th Ave S County Line/Koblegard Rd Oslo Rd 2 Lane Undivided 4 Lane Divided $11,850,325 66th Ave S County Line Oslo Rd 00 2 Lane Undivided $8,562,423 66th Ave Oslo Rd 4th St 2 Lane Undivided 4 Lane Divided $8,887,466 66th Ave 4th St SR 60 2 Lane Divided 4 Lane Divided $8,853,565 66th Ave SR 60 C.R Lane Undivided 4 Lane Divided $36,173,489 82nd Ave S County Line Oslo Rd 00 2 Lane Undivided $7,302,941 82nd Ave 26th St C.R Lane Undivided $28,174,165 Laconia St C.R. 510 C.R Lane Undivided $2,679,879 Aviation Blvd Ext U.S. 1 Indian River Blvd 00 4 Lane Divided $14,387,771 C.R. 510 C.R. 512 U.S. 1 2 Lane Undivided 4 Lane Divided $36,369,280 C.R. 510 U.S. 1 ICWW 2 Lane Undivided 4 Lane Divided $3,718,539 C.R. 512 Fellsmere City Limits I-95 2 Lane Undivided 4 Lane Divided $19,192,929 C.R. 512 I-95 C.R Lane Divided 6 Lane Divided $13,317,010 C.R. 512 C.R. 510 Roseland Rd 4 Lane Divided 6 Lane Divided $6,674,370 8th St 82nd Ave 74th Ave 00 2 Lane Undivided $3,955,196 Indian River Blvd Royal Palm 37th St 4 Lane Divided 6 Lane Divided $8,678,255 89
95 City Rds 2030 Roadway Improvement Plan (Table of the Transportation Element) On Street From To Base Road Type Future Road Type Total Cost Oslo Rd I-95 58th Ave 2 Lane Undivided 4 Lane Divided $19,484,669 Roseland Rd C.R. 512 U.S. 1 2 Lane Undivided 2 Lane Divided $12,847,897 Schumann Dr C.R. 510 Barber St 2 Lane Undivided 4 Lane Divided $3,974,335 Congestion Management System Projects ($500,000 Per Year) $10,000,000 County Roads Total $381,057,970 Barber St Schumann Dr U.S. 1 2 Lane Undivided 2 Lane Divided $3,621,587 Barber St C.R. 512 Schumann Dr 2 Lane Undivided 2 Lane Divided $7,596,306 City Roads Total $11,217,893 Total $576,415,296 Source: MPO F:\COMMUNITY DEVELOPMENT\COMPREHENSIVE PLAN ELEMENTS\CAPITAL IMPROVEMENTS ELEMENT\CAPITAL IMPROVEMENTS ELEMENT DRAFT.DOC 90
96 APPENDIX D: SCHOOL DISTRICT OF INDIAN RIVER COUNTY CAPITAL IMPROVEMENT SCHEDULE 91
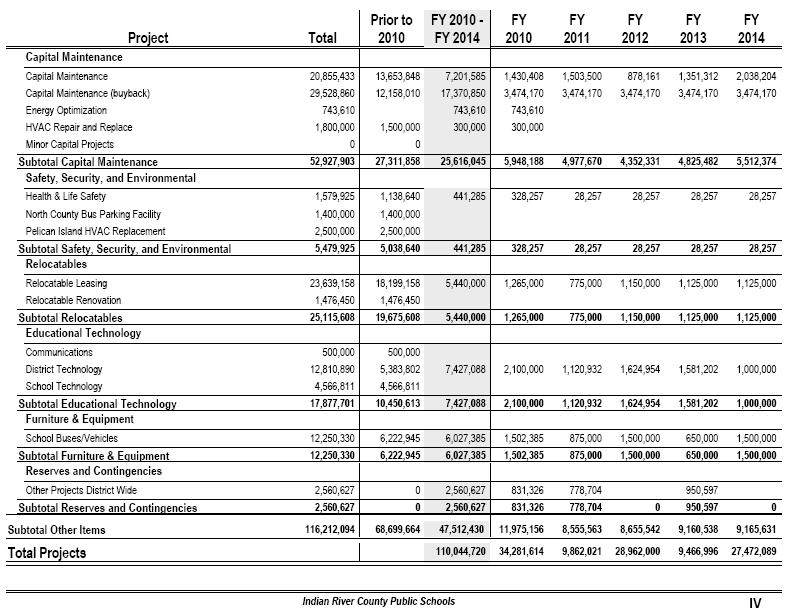
97 92
Indian River County 2030 Comprehensive Plan
 2030 Comprehensive Plan Chapter 6 Supplement #15; Adopted December 5, 2017, Ordinance 2017-015 TABLE OF CONTENTS List of Figures... ii List of Tables... iii Introduction... 1 Existing Conditions... 2 Financial
REVENUE MANUAL PALM BEACH COUNTY Edition February 2018
 REVENUE MANUAL PALM BEACH COUNTY 218 Edition February 218 TABLE OF CONTENTS About this. 2 Index of Revenues Index of Revenues by Revenue Source Code Index of Revenues by Name. 3 4 1 About this The Palm
Schedule of Ad Valorem Taxes and Required Millage. Summary of Total Budget
 Citrus County, Florida Schedule of Ad Valorem Taxes and Required Millage BOCC County-Wide 2010/2011 2011/2012 Revenue Millage Revenue Millage General Fund $ 47,539,858 4.9447 $ 46,165,753 4.9447 Road &
Section 19 Revenues. Overview
 Section 19 Revenues Overview Local governments generate revenues from a wide range of sources. The authority for generating revenues is derived from the State Constitution, home rule authority, or Florida
Revenue Account Codes for FY Reporting Account Code
 Account s for FY 13-14 Reporting Account 311000 Ad Valorem Taxes Property Value Taxes Ad Valorem Taxes 312100 Local Option Taxes Local Option, Use and Fuel Taxes General Government Taxes 312300 County
Fully Utilized Transportation Funding Sources
 Ad valorem Taxes Fully Utilized Transportation ing Sources Statutory Ad Valorem Taxes Section 9, Article VII, Florida Constitution has the current authority to levy up to 0.5 mills and is currently levying
2010 Local Government Financial Information Handbook
 2010 Local Government Financial Information Handbook October 2010 The Florida Legislature s Office of Economic and Demographic Research 2010 Local Government Financial Information Handbook October 2010
FY 2018 Revenue Manual CITY OF ST. AUGUSTINE
 FY 2018 Revenue Manual CITY OF ST. AUGUSTINE This Revenue Manual was developed to provide a comprehensive reference source for all revenue collected by the City of St. Augustine. The manual is an in depth
MISSION STATEMENT. To Meet the Needs and Exceed the Expectations of Those We Serve, in Fulfilling Our Constitutional Obligations.
 MISSION STATEMENT To Meet the Needs and Exceed the Expectations of Those We Serve, in Fulfilling Our Constitutional Obligations. A Message from Karen E. Rushing Clerk of the Circuit Court and County Comptroller
Revenue Account Codes for FY12-13 Reporting
 311000 Ad Valorem Taxes Property Value Taxes Ad Valorem Taxes 312100 Local Option Taxes Local Option, Use and Fuel Taxes General Government Taxes 312300 County Ninth-Cent Voted Fuel Tax Local Option, Use
FY 09/10 ADOPTED GENERAL FUND REVENUES $218,840,522
 GENERAL FUND REVENUES FY 09/10 ADOPTED GENERAL FUND REVENUES $218,840,522 State Revenue 11% Transfers Federal Revenue1% 2% Fund Balance 0.1% Other Local Revenue 2% Other Local Taxes 21% Gen. Property Taxes
Capital Improvements i
 CAPITAL IMPROVEMENTS TABLE OF CONTENTS I. INTRODUCTION...1 II. INVENTORY OF PUBLIC FACILITY NEEDS...1 A. Capital Needs Derived from Other Elements...1 B. Cost Estimates for Identified Capital Needs...2
Citizens Academy Budget Office
 Citizens Academy Budget Office January 19, 2018 Jill J. Hayes, Budget Director Overview 2 The Budget Office Truth In Millage & Property Taxes Charter Section 2.9.3.1 How We Impact the Citizens The Brevard
Florida Legislative Committee on Intergovernmental Relations
 Jeff Atwater President Florida Legislative Committee on Intergovernmental Relations Issue Brief Utilization of Local Option Sales Taxes by Florida Counties in Fiscal Year 2009-10 November 2009 Larry Cretul
Crawford County, Ohio
 Financial Forecast For the Years Ended December 31, 2006, 2007, and 2008 Actual; Years Ending December 31, 2009, 2010, and 2011 Forecasted 12/1/2009 1 Financial Forecast Table of Contents Page Schedule
FY 08/09 ADOPTED GENERAL FUND REVENUES $224,391,325
 GENERAL FUND REVENUES FY 08/09 ADOPTED GENERAL FUND REVENUES $224,391,325 State Revenue 10% Transfers 1% Federal Revenue 2% Fund Balance 0.2% Other Local Revenue 3% Other Local Taxes 22% Gen. Property
The Citizen s Report 2009
 ERNIE LEE MAGAHA YOUR ESCAMBIA COUNTY CLERK and COMPTROLLER PRESENTS The Citizen s Report 2009 A Summary Report of the COMPREHENSIVE ANNUAL FINANCIAL REPORT Fiscal Year Ended September 30, 2009 Independent
Clay County, Florida. County Audit Report September 30, 2014
 Clay County, Florida County Audit Report September 30, 2014 Clay County, Florida County Audit Report September 30, 2014 Table of Contents Section Financial Report 1 County-Wide 3 Clerk of the Circuit Court
Tourist Development Tax Analysis
 Tourist Development Tax Analysis October 28, 2011 Report No. 12-02 Evan A. Lukic, CPA County Auditor Table of Contents Topic Page Executive Summary... 1 Purpose and Scope... 1 Methodology... 1 Background...
TABLE OF CONTENTS INTRODUCTION... 1 CAPITAL IMPROVEMENTS INVENTORY AND ANALYSIS... 1 DEFINITIONS... 2 DATA INVENTORY... 23
 1 2 3 4 5 6 7 8 9 10 11 12 13 14 15 16 17 18 19 20 21 22 23 24 25 26 27 28 29 30 31 32 33 34 35 36 37 38 39 40 41 42 43 44 Chapter 8 TABLE OF CONTENTS INTRODUCTION... 1 CAPITAL IMPROVEMENTS INVENTORY AND
DEBT SERVICE BUDGET. This section is organized in the following manner: Page. Debt Service Budget 6-1. Debt Service Budget Fund Summary 6-2
 DEBT SERVICE BUDGET Local governments traditionally issue debt to pay for capital projects for several reasons. First, the cost of these projects is normally too high to absorb into an annual budget. Second,
Pinellas County Bonded Debt. Last ten years (dollars in thousands)
") DEBT SERVICE Debt Service Costs include the annual payments of interest, principal and other fees on long term bond indebtedness. This section includes the budgeted debt service for obligations which provide
DEBT SERVICE Debt Service Costs include the annual payments of interest, principal and other fees on long term bond indebtedness. This section includes the budgeted debt service for obligations which provide
CITY OF BREVARD
 ANNUAL BUDGET ESTIMATE - REVENUE Amended - 2018-2019 CITY OF BREVARD FY 2017-2018 2016-2017 2017-2018 4/30/2018 2017-2018 2018-2019 Account Actual ($) Budget ($) Actual ($) Estimate %Remaining Requested
COLUMBIA COUNTY BOARD OF COUNTY COMMISSIONERS FINAL BUDGET FISCAL YEAR PREPARED BY BEN SCOTT COUNTY MANAGER
 COLUMBIA COUNTY BOARD OF COUNTY COMMISSIONERS FINAL FISCAL YEAR 2016-2017 PREPARED BY BEN SCOTT COUNTY MANAGER SEPTEMBER 15, 2016 COLUMBIA COUNTY BOARD OF COUNTY COMMISSIONERS TABLE OF CONTENTS PAGE OPERATING
Purpose of LOST SALES AND USE TAXATION. Local Option Sales Tax (LOST) Taxation 101 Larry Hanson City Manager City of Valdosta June 26, /16/2017
 Taxation 101 Larry Hanson City Manager City of Valdosta June 26, /16/2017") SALES AND USE TAXATION Taxation 101 Larry Hanson City Manager City of Valdosta June 26, 2017 Local Option Sales Tax (LOST) Purpose of LOST To assist in funding governmental services authorized by the Constitution
SALES AND USE TAXATION Taxation 101 Larry Hanson City Manager City of Valdosta June 26, 2017 Local Option Sales Tax (LOST) Purpose of LOST To assist in funding governmental services authorized by the Constitution
OFFICE OF JOE G. TEDDER, CFC Tax Collector for Polk County, Florida
 OFFICE OF JOE G. TEDDER, CFC Tax Collector for Polk County, Florida The Guiding Principles are our organization s beliefs. They help us understand: MISSION What we do VISION Where we are going SHARED VALUES
Local Government Division
 2014 Local Government Division ILLINOIS STATE COMPTROLLER LESLIE GEISSLER MUNGER WELCOME LETTERfrom THE COMPTROLLER Illinois State Comptroller Leslie Geissler Munger To the Honorable Members of the General
DEBT SERVICE BUDGET. This section is organized in the following manner: Page. Debt Service Budget 6-1. Debt Service Budget Fund Summary 6-2
 DEBT SERVICE BUDGET Local governments traditionally issue debt to pay for capital projects for several reasons. First, the cost of these projects is normally too high to absorb into an annual budget. Second,
TABLE OF CONTENTS LIST OF TABLES
 TABLE OF CONTENTS A. GOALS, OBJECTIVES, AND POLICIES... 3 B. SUMMARY... 17 LIST OF TABLES Table IX 1: City of Winter Springs Five-Year Schedule of Capital Improvements (SCI) FY 2013/14-2017/18... 11 Table
FY 2005 FISCAL RESPONSIBILITY REPORT CARD EXECUTIVE SUMMARY
 FY 2005 FISCAL RESPONSIBILITY REPORT CARD EXECUTIVE SUMMARY 2 December 15, 2006 Honorable Members of the General Assembly and County Clerks: Pursuant to the Fiscal Responsibility Report Card Act [35 ILCS
Chapter 14 MUNICIPALLY IMPOSED TAXES AND FEES
 Chapter 14 MUNICIPALLY IMPOSED TAXES AND FEES Some locally-imposed taxes and fees are optional, and a given municipality may have imposed all or portions of their taxing authority under that item. Other
MADISON COUNTY, FLORIDA ANNUAL FINANCIAL REPORT SEPTEMBER 30, 2017
 MADISON COUNTY, FLORIDA ANNUAL FINANCIAL REPORT SEPTEMBER 30, 2017 MADISON COUNTY, FLORIDA THIS REPORT CONTAINS THE FOLLOWING SECTIONS Madison County, Florida (Government-Wide) Basic Financial Statements,
Table of Contents. Transmittal... i Introduction Executive Overview...1 Organization Chart...7. Community Profile...8. GFOA Budget Award...
 Table of Contents Transmittal... i Introduction Executive Overview...1 Organization Chart...7 Community Profile...8 GFOA Budget Award...18 Budget Calendar...19 How to use this document...20 General Fund
General Fund Revenue Summary
 Summary of General Fund Revenues and Expenditures Budget FY 2017-2018 FISCAL YEAR 2017-2018 General Fund Revenue Summary The City of Decatur has 7 broad revenue categories: taxes, licenses and permits,
Fiscal Year 2016 and Beyond: Balancing Revenue with Community Expectations
 Fiscal Year 2016 and Beyond: Balancing Revenue with Community Expectations St. Johns County Board of County Commissioners Special Meeting January 27, 2015 Michael D. Wanchick St. Johns County Administrator
FY15 REVENUES. FY 14 Adopted Taxes. General Fund $ $ $753.50
 BROWARD COUNTY BUDGET-IN-BRIEF FY15 REVENUES Overview County services are funded with a variety of revenue sources. These sources include the following: property taxes, miscellaneous taxes and assessments,
CITY OF NORTH LAS VEGAS, NEVADA DEBT MANAGEMENT POLICY IN ACCORDANCE WITH NRS (C)
") CITY OF NORTH LAS VEGAS, NEVADA DEBT MANAGEMENT POLICY IN ACCORDANCE WITH NRS 350.013 1(C) JUNE 30, 2007 TABLE OF CONTENTS DEBT MANAGEMENT POLICY NRS 350.013 Subsection 1(c)... 1 Summary of Debt... 2 Affordability
CITY OF NORTH LAS VEGAS, NEVADA DEBT MANAGEMENT POLICY IN ACCORDANCE WITH NRS 350.013 1(C) JUNE 30, 2007 TABLE OF CONTENTS DEBT MANAGEMENT POLICY NRS 350.013 Subsection 1(c)... 1 Summary of Debt... 2 Affordability
GENERAL FUND REVENUES BY SOURCE
 BUDGET DETAIL BUDGET DETAIL The Budget Detail gives more information on the budget, than is shown in the Executive Summary. Detail information is provided on the General Fund, Special Revenue Funds, Enterprise
FY19 Adopted Budget Overview
 FY19 Budget Overview FY19 Financial Plan Overview The Sarasota County total FY2019 Financial Plan is $1,242,441,007 for all funds. When excluding transfers and reserves equaling $212,401,925, the FY19
FY 2009 FISCAL RESPONSIBILITY REPORT CARD
 FY 2009 FISCAL RESPONSIBILITY REPORT CARD Local Government Division 100 West Randolph Street Chicago, IL 60601 Toll Free Hotline: (877) 304-3899 E-mail: locgov@mail.ioc.state.il.us 2 December 21, 2010
NASSAU COUNTY, FLORIDA
 NASSAU COUNTY, FLORIDA COMPREHENSIVE ANNUAL FINANCIAL REPORT FOR THE FISCAL YEAR ENDED SEPTEMBER 30, 2017 PREPARED BY: John A. Crawford CLERK OF THE CIRCUIT COURT/COMPTROLLER Table of Contents INTRODUCTORY
TOWNS COUNTY, GEORGIA HIAWASSEE, GEORGIA FINANCIAL STATEMENTS WITH SUPPLEMENTAL MATERIAL FOR THE YEAR ENDED
 HIAWASSEE, GEORGIA FINANCIAL STATEMENTS WITH SUPPLEMENTAL MATERIAL FOR THE YEAR ENDED DECEMBER 31, 2016 FINANCIAL STATEMENTS For the Year Ended December 31, 2016 PAGE INDEPENDENT AUDITOR'S REPORT 1-2 MANAGEMENT'S
DEBT SERVICE BUDGET. This section is organized in the following manner: Page. Debt Service Budget 6-1. Debt Service Budget Fund Summary 6-2
 DEBT SERVICE BUDGET Local governments traditionally issue debt to pay for capital projects for several reasons. First, the cost of these projects is normally too high to absorb into an annual budget. Second,
MADISON COUNTY, FLORIDA ANNUAL FINANCIAL REPORT SEPTEMBER 30, 2015
 MADISON COUNTY, FLORIDA ANNUAL FINANCIAL REPORT SEPTEMBER 30, 2015 MADISON COUNTY, FLORIDA THIS REPORT CONTAINS THE FOLLOWING SECTIONS Madison County, Florida (Government-Wide) Basic Financial Statements,
Circuit Court - Juvenile Judicial 68X.XX
 Reconciliation of Expenditure Data Listed in LCIR 'Local Fiscal Data' Datafiles to Expenditure Accounts Listed in the 2005 Uniform Accounting System Manual Expenditure Category in LCIR Spreadsheet Expenditure
FY16 REVENUES. FY 15 Adopted Taxes. General Fund $ $ $ Voter Approved Debt Service $37.30 $36.90 $37.50
 FY16 REVENUES Overview County services are funded with a variety of revenue sources. These sources include the following: property taxes, miscellaneous taxes and assessments, federal and state grants,
LONG-TERM DEBT. Long-Term Debt Outstanding
 LONG-TERM DEBT The City of Palm Coast has limited debt, both because of City Charter restrictions and a pay-asyou-go philosophy of the City Council. The City Charter states that unfunded multiyear contracts,
 MANAGEMENT S DISCUSSION AND ANALYSIS As management of the City of Gainesville (the City ), we offer readers of the City s financial statements this narrative overview and analysis of the financial activities
The work and final recommendations of that joint study committee are fully chronicled in a 1993 report submitted to the Legislature.
 SUMMARY Florida s economic well-being depends heavily on the well-being of the state s tourism industry. Substantiating this statement are sales tax figures from the Department of Revenue (DOR) and employment
RESOLUTION NO. 14R-2434
 RESOLUTION NO. 14R-2434 A RESOLUTION OF THE CITY COMMISSION OF THE CITY OF SARASOTA, FLORIDA, APPROVING A BUDGET; AND MAKING APPROPRIATIONS OF SUMS OF MONEY FOR ALL EXPENDITURES OF THE CITY OF SARASOTA,
Funding Sources. Total Revenues
 Funding Sources The City s revenues come from a wide variety of sources. Revenues and expenses are categorized according to the State of Florida Uniform Accounting System chart of accounts. These standard
SANIBEL CITY COUNCIL MEETING FIRST BUDGET HEARING SATURDAY, SEPTEMBER 10, :00 A. M.
 SANIBEL CITY COUNCIL MEETING FIRST BUDGET HEARING SATURDAY, SEPTEMBER 10, 2011 9:00 A. M. Mayor Ruane called the meeting to order at 9:03 a.m. Members present: Mayor Ruane, Vice Mayor Denham, Councilman
TAYLOR COUNTY, FLORIDA ANNUAL FINANCIAL REPORT. For the Fiscal Year Ended September 30, 2016
 TAYLOR COUNTY, FLORIDA ANNUAL FINANCIAL REPORT For the Fiscal Year Ended September 30, 2016 1 TAYLOR COUNTY, FLORIDA ANNUAL FINANCIAL REPORT For the Fiscal Year Ended September 30, 2016 T A B L E O F C
PALM BEACH COUNTY CAPITAL IMPROVEMENT PROGRAM
 Palm Beach County (the County) provides the needed and desired urban services to the public. In order to provide these services, the County must furnish and maintain capital facilities and equipment, such
K. Government Structure and Finance
 K. Government Structure and Finance 1. Government Structure Legislative Leadership The activities of the county are overseen by a seven member Board of Supervisors elected for four-year terms. The responsibilities
Town of South Palm Beach Adopted Budget Fiscal Year
 Adopted Budget Fiscal Year 2011 2012 Adopted General Fund Budget Summary FY2011 Actual FY2012 variance Budget @ 06/30/11 Adopted % dollar Revenues Ad Valorem Taxes $1,079,917 $1,045,228 $1,079,036 0.08%
GENERAL ASSEMBLY OF NORTH CAROLINA 1991 SESSION CHAPTER 594 HOUSE BILL 703
 GENERAL ASSEMBLY OF NORTH CAROLINA 1991 SESSION CHAPTER 594 HOUSE BILL 703 AN ACT TO AUTHORIZE WAKE COUNTY TO LEVY A ROOM OCCUPANCY TAX AND A PREPARED FOOD AND BEVERAGE TAX. The General Assembly of North
New Mexico Department of Finance and Administration Local Government Division Property Valuation Estimate
 New Mexico Department of Finance and Administration Local Government Division Property Valuation Estimate COUNTY: Colfax County Fiscal Year: 2017-2018 ROUNDED TO NEAREST DOLLAR (A) (B) (C) (D) PROPERTY
CHAPTER 13 STATE TAXES
 CHAPTER 13 STATE TAXES Latest Revision 1994 13.01 INTRODUCTION Ohio relies on various taxes to support its governmental activities. Some of these taxes have transfer provisions which accrue to the benefit
CITY OF NORTH LAS VEGAS, NEVADA DEBT MANAGEMENT POLICY IN ACCORDANCE WITH NRS (C)
") CITY OF NORTH LAS VEGAS, NEVADA DEBT MANAGEMENT POLICY IN ACCORDANCE WITH NRS 350.013 1(C) JUNE 30, 2009 TABLE OF CONTENTS Summary of Debt... 2 Affordability of Debt... 8 General Obligation Bonds Supported
CITY OF NORTH LAS VEGAS, NEVADA DEBT MANAGEMENT POLICY IN ACCORDANCE WITH NRS 350.013 1(C) JUNE 30, 2009 TABLE OF CONTENTS Summary of Debt... 2 Affordability of Debt... 8 General Obligation Bonds Supported
CITIZENS ANNUAL POPULAR REPORT
 WAKULLA COUNTY, FLORIDA CITIZENS ANNUAL POPULAR REPORT For the Year Ended September 30, 2011 Brent X. Thurmond, CPA Clerk of Circuit and County Courts www.wakullaclerk.com WAKULLA COUNTY, FLORIDA BOARD
GENERAL FUND Revenues
 GENERAL FUND Revenues The General Fund is used to account for general purpose revenues, which are used to fund general governmental services, excluding utilities. Following are descriptions of the City's
Millage Comparison. FY19 Rolled- Back Rates. FY19 Adopted Rates
 Millage Comparison Adopted Rates Millage Rates Rolled- Back Rates Adopted Rates Adopted Taxes Ad Valorem Taxes Taxes Levied Adopted Taxes Countywide Operating 5.2904 5.2904 $937,994,229 $930,455,041 $1,002,331,958
Monthly Financials May 31, 2016
 Monthly Financials May 31, 2016 Combining All Fund Revenue, & Other Uses Monthly Financials Table of Contents Budget Comparison 1 Bank Account Balances 2 Summary of Government wide Statement of, and Other
CITY OF CHARLOTTESVILLE, VIRGINIA
 Page 1 of 5 Revenues Taxes: Real estate $ 32,011,244 $ 32,011,244 $ 32,749,762 $ 738,518 Personal property 4,596,481 4,596,481 4,605,583 9,102 Public service corporation 1,500,000 1,500,000 1,950,118 450,118
Monthly Financials November 30, 2017
 Monthly Financials November 30, 2017 Combining All Fund Revenue, Expenditures & Monthly Financials Table of Contents Budget Comparison 1 Bank Account Balances 2 Summary of Government wide Statement of,
CITY OF ST. PETERSBURG FISCAL YEAR 2013 ADOPTED OPERATING BUDGET & CAPITAL IMPROVEMENT PROGRAM
 CITY OF ST. PETERSBURG FISCAL YEAR 2013 ADOPTED OPERATING BUDGET & CAPITAL IMPROVEMENT PROGRAM City of St. Petersburg Budget I. FUND SUMMARIES General Fund (0001) 1 Preservation Fund (0002) 4 Industrial
JEFFERSON DAVIS PARISH POLICE JURY JENNINGS, LOUISIANA. Annual Financial Statements. As of and for the Year Ended December 31, 2016
 JENNINGS, LOUISIANA Annual Financial Statements Annual Financial Statements CONTENTS Statement Page Independent Auditor s Report 1-4 Basic Financial Statements Government-Wide Financial Statements: Statement
BASIC FINANCIAL STATEMENTS
 BASIC FINANCIAL STATEMENTS COUNTY OF WELD Statement of Net Assets December 31, 2008 Primary Government Governmental Business-type Activities Activities Total Component Units Housing Authority E-911 Authority
OTHER GOVERNMENTAL FUNDS - SPECIAL REVENUE
 OTHER GOVERNMENTAL FUNDS - SPECIAL REVENUE Special Revenue Funds are used to account for proceeds of specific revenue sources other than expendable trust that are legally restricted to expenditures for
CAPITAL FUNDS 2015 Budget
 CAPITAL FUNDS This section provides comparisons of revenues and expenditures/appropriations for all capital funds for 2014 2016, the 2017 budget, and the 2018 2022 plan. Historical fund balances and the
HEARD COUNTY, GEORGIA
 HEARD COUNTY, GEORGIA FINANCIAL REPORT FOR THE YEAR ENDED JUNE 30, 2011 HEARD COUNTY, GEORGIA FINANCIAL REPORT FOR THE YEAR ENDED JUNE 30, 2011 TABLE OF CONTENTS INDEPENDENT AUDITOR S REPORT 1 BASIC FINANCIAL
CITY OF WOODWARD, OKLAHOMA WOODWARD, OKLAHOMA
 WOODWARD, OKLAHOMA ANNUAL FINANCIAL STATEMENTS AND ACCOMPANYING INDEPENDENT AUDITOR'S REPORT FOR THE YEAR ENDED JUNE 30, 2017 The City of Woodward, Oklahoma Table of Contents Year Ended June 30, 2017 INDEPENDENT
Wakulla County. Annual Debt Report. For. FY (unaudited) Prepared by the Wakulla County Clerk of Court, Finance Department
 Prepared by the Wakulla County Clerk of Court, Finance Department") Wakulla County Annual Debt Report For FY 2013-2014 (unaudited) Prepared by the Wakulla County Clerk of Court, Finance Department 1 Board of County Commissioners and Citizens of Wakulla County, As your
Wakulla County Annual Debt Report For FY 2013-2014 (unaudited) Prepared by the Wakulla County Clerk of Court, Finance Department 1 Board of County Commissioners and Citizens of Wakulla County, As your
Millage Comparison. FY17 Rolled- Back Rates. FY17 Adopted Rates
 Millage Comparison Adopted Rates Millage Rates Rolled- Back Rates Adopted Rates Adopted Taxes Ad Valorem Taxes Taxes Levied Adopted Taxes Countywide Operating 5.3444 5.2904 $805,284,750 $800,498,049 $862,115,399
2014 Local Government Financial Information Handbook
 2014 Local Government Financial Information Handbook December 2014 The Florida Legislature s Office of Economic and Demographic Research 2014 Local Government Financial Information Handbook December 2014
Board Budgeting Basics. New Clerk Academy May 22, 2017
 New Clerk Academy May 22, 2017 Honorable Brent Thurmond, CPA, Wakulla County Clerk of the Circuit Court and Comptroller Michael Tomich, CPA, Marion County Budget Director for the Office of the Honorable
Monroe County, FL Fiscal Year Capital Improvement Program
 Monroe County, FL Fiscal Year 2018 2022 Capital Improvement Program Capital Improvement Plan Overview Capital Improvement Plan The Capital Improvement Plan is a resource that assists Monroe County in ensuring
BOX ELDER COUNTY, UTAH FINANCIAL REPORT
 BOX ELDER COUNTY, UTAH FINANCIAL REPORT YEAR ENDED DECEMBER 31, 2008 BOX ELDER COUNTY FINANCIAL REPORT DECEMBER 31, 2008 BOX ELDER COUNTY FINANCIAL REPORT DECEMBER 31, 2008 TABLE OF CONTENTS Independent
HILLSBOROUGH COUNTY MPO 2035 LONG RANGE TRANSPORTATION PLAN
 HILLSBOROUGH COUNTY MPO 2035 LONG RANGE TRANSPORTATION PLAN REASONABLY AVAILABLE AND NEW AND ADDITIONAL PROJECTED REVENUE SOURCES IN HILLSBOROUGH COUNTY TECHNICAL MEMORANDUM Hillsborough County Metropolitan
GLOSSARY. A separate organizational unit of County government established to deliver services to citizens.
 Accrual Basis of Accounting A basis of accounting that recognizes transactions at the time they are incurred, rather than when cash is received or spent. In Albemarle, the basis of budgeting and accounting
DESCRIPTIONS OF BUDGET TERMS
 DESCRIPTIONS OF BUDGET TERMS Ad Valorem Tax A tax based on the assessed value of a property. Adopted Budget Financial plan which forms the basis and limits for appropriations and is adopted by the City
Quarterly Budget Status Report
 Quarterly Budget Status Report 10/01/2016-06/30/2017 (3 rd quarter) OVERVIEW This financial overview reflects the County s overall unaudited financial condition through June 2017. Except as noted below,
sources for FY , only a portion of the statedistributed revenue would be available for new capital projects.
 6 REVENUE PROJECTIONS, SARASOTA/MANATEE 2040 LRTP The purpose of this analysis is to begin to document the financial resources and revenues available for consideration in developing the Financially Feasible
DEFINITION OF REVENUE SOURCES GENERAL FUND
 GENERAL FUND PROPERTY TAX: The valuation of property in the City is determined by the Los Angeles County Tax Assessor, except for Public Utility property, which is assessed by the State Board of Equalization.
CITY OF STONE MOUNTAIN 875 Main Street Stone Mountain, Georgia ANNEXATION STUDY 2016
 CITY OF STONE MOUNTAIN 875 Main Street Stone Mountain, Georgia 30083 ANNEXATION STUDY 2016 Presented by the Annexation Study Committee Mayor Patricia Wheeler Alex Brennan Thom DeLoach Mayor Pro Tem Chakira
Ohio 2020 Tax Policy Commission
 Ohio 2020 Tax Policy Commission Testimony of Tax Commissioner Joe Testa Department of Taxation October 22, 2015 Co-Chairman Senator Peterson, Co-Chairman Representative McClain, and members of the Tax
INDEPENDENT AUDITORS' REPORT
 FINANCIAL SECTION This section contains the following subsections: INDEPENDENT AUDITORS REPORT MANAGEMENT S DISCUSSION AND ANALYSIS BASIC FINANCIAL STATEMENTS REQUIRED SUPPLEMENTARY INFORMATION OTHER SUPPLEMENTARY
RESOLUTION NO GLADES COUNTY, FLORIDA ADOPTING A FINAL MILLAGE FOR FISCAL YEAR
 RESOLUTION NO. 2014-23 GLADES COUNTY, FLORIDA ADOPTING A FINAL MILLAGE FOR 2014-2015 FISCAL YEAR WHEREAS, preparation of an annual county operating budget is required by Florida Statutes; and WHEREAS,
PREPARED BY: DAVID R. ELLSPERMANN, CLERK OF THE CIRCUIT COURT AND COMPTROLLER BUDGET DEPARTMENT
 PREPARED BY: DAVID R. ELLSPERMANN, CLERK OF THE CIRCUIT COURT AND COMPTROLLER BUDGET DEPARTMENT Marion County Board of County Commissioners Budget Workshop - Proposed Budget Overview Monday, July 10, 2017
Tourist Development Tax Funded Programs
 Tourist Development Tax Funded Programs FY18 Recommended Operating Budget and Capital Programs June 6 th, 2017 1 Tourism Development Tax (TDT) Overview & Uses 2 Legislative Background of Tourist Development
Fiscal Year Mid-Year Budget Status Report
 Fiscal Year 2009 Mid-Year Budget Status Report Prepared by the Pinellas County Office of Management & Budget May 19, 2009 TABLE OF CONTENTS SECTION PAGE Report Format 3 I. Executive Summary 3 II. Economic
TABLE I COUNTY OF VOLUSIA, FLORIDA GOVERNMENT-WIDE EXPENSES BY FUNCTION LAST THREE FISCAL YEARS (In Thousands of Dollars)
") STATISTICAL SECTION The Statistical Section includes financial presentations that provide detailed data on the physical, economic, social, and political characteristics of the County of Volusia, Florida.
STATISTICAL SECTION The Statistical Section includes financial presentations that provide detailed data on the physical, economic, social, and political characteristics of the County of Volusia, Florida.
Revenue Source Descriptions
 Primary Government Property Taxes Revenue Source Descriptions Property Taxes are levied against the assessed taxable valuation of real and personal property in the County. The tax rates are expressed in
Budget Introduction Proposed Budget
 Budget Introduction Proposed Budget INTRO - 1 INTRO - 2 Summary of the Budget and Accounting Structure The City of Beverly Hills uses the same basis for budgeting as for accounting. Governmental fund financial
COLUMBIA COUNTY BOARD OF COUNTY COMMISSIONERS TENTATIVE BUDGET FISCAL YEAR PREPARED BY DALE WILLIAMS COUNTY MANAGER.
 COLUMBIA COUNTY BOARD OF COUNTY COMMISSIONERS TENTATIVE FISCAL YEAR 2010-2011 PREPARED BY DALE WILLIAMS COUNTY MANAGER August 13,2010 11:00 AM COLUMBIA COUNTY BOARD OF COUNTY COMMISSIONERS TENTATIVE TABLE
FY 2010 FY 2019 Capital Funding
 Capital Improvement Plan Overview Capital Improvement Plan The Capital Improvement Plan is a resource that assists Monroe County in ensuring that decisions on projects and funding are made wisely and in
BUDGET SUMMARY TABLE OF CONTENTS
 BUDGET SUMMARY TABLE OF CONTENTS Pinellas County Organization Chart... B-2 Description of Pinellas County Government... B-3 Appropriations and Sources Table... B-4 Ad Valorem and Millages Table... B-5
CITY OF SATELLITE BEACH, FLORIDA. Financial Statements Year Ended September 30, 2010
 CITY OF SATELLITE BEACH, FLORIDA Financial Statements Year Ended September 30, 2010 CITY OF SATELLITE BEACH, FLORIDA Table of Contents As of September 30, 2010 Introductory Section Page Title Page 1 Table
FY19 Budget Non-Departmental Costs $185,126,891 $327,758,980 $340,508,190 4% Subtotal $185,126,891 $327,758,980 $340,508,190 4%
 Non-Departmental Department Non-Departmental GENERAL FUND Percent Positions Change 2018-19 FY18 Budget FY19 Budget Non-Departmental Costs $185,126,891 $327,758,980 $340,508,190 4% Subtotal $185,126,891