FMConsulting CEO Peter Heidinger gives a presentation on "Market Entry in Turkey" in Investing in Romania, Poland, Turkey and China Conference, Italy.
|
|
|
- Kelly Beasley
- 5 years ago
- Views:
Transcription

1 FMConsulting CEO Peter Heidinger gives a presentation on "Market Entry in Turkey" in Investing in Romania, Poland, Turkey and China Conference, Italy. December 13, 2013 Padova, Italy Eurointerim International organized a conference on Investing in Romania, Poland, Turkey and China in December,2013 which introduced by Luigi Sposato, President of Eurointerim Spa. Following this introduction, consultants from different countries gave presentations on the current economic situation and investing in Romania, Poland, Turkey and China. You can find Mr. Heidinger s presentation about "Market Entry in Turkey " in the following pages.
2 Presentation Market Entry in Turkey Peter J. Heidinger December 13, 2013 Padova, Italy
3 3
4 What makes Turkey that interesting? 76 million people Youngest population in Europe Average age: % younger than 35 Highly motivated labor force Near to Europe Strategic location Neighbor countries 4

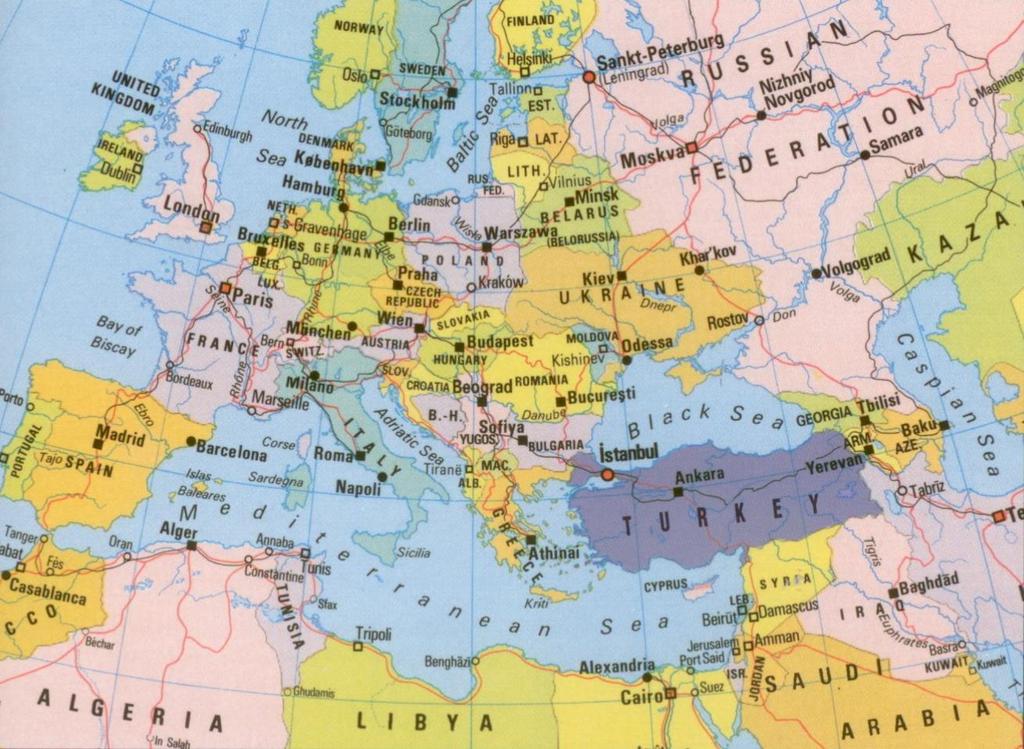
5 Turkey is the Gate between the Eastern and Western World Turkey... ddd 5
6 World s Largest Economies (GDP-PPP, USD trillion, 2012) Source: IMF, World Economic Outlook, Undersecretariat of Treasury, October

7 Europe s Largest Economies (GDP-PPP, USD trillion, 2012) Source: IMF, World Economic Outlook, Undersecretariat of Treasury, October
8 Comparison of Europe and Turkey: Real GDP Growth (2001=100) Source: OECD, Undersecretariat of Treasury,

9 GDP Growth Rate Projections (%) Source: Ministry of Development, Medium Term Economic Program , Undersecretariat of Treasury,

10 Per Capita GDP (USD) Source: Turkstat, Undersecretariat of Treasury,

11 FDI Inflows (USD billion) (*) Annualized as of September 2013 Source: CBRT, Undersecretariat of Treasury,

12 FDI Inflows (USD billion) FDI by Sectors ( ) Wood and Wood Products; 4% Transport Equipment; 4% Other; 11% Food Products, Beverages and Tobacco; 31% Pulp, Paper and Paper Products and Publishing and Printing; 4% Machinery and Equipment; 6% Basic Metals and Fabricated Metal Products; 6% Rubber and Plastic Products; 11% Textiles and Textile Products; 11% Other Non-Metallic Mineral Products; 13% Source: CBRT,

13 FDI Inflows (USD billion) FDI by Countries ( ) Other; 25% Austria; 13% Luxembourg; 11% Saudi Arabia; 3% Belgium; 4% Netherlands; 10% France; 6% USA; 6% Germany; 6% Spain; 7% United Kingdom; 9% Source: CBRT,
14 Privatization Implementations (Billion USD) Source: Privatization Administration, Saving Deposit Insurance Fund, Undersecretariat of Treasury,

15 Exports (USD billion) (*) Annualized as of October 2013 Source: Turkstat, Undersecretariat of Treasury,

16 Imports (USD billion) (*) Annualized as of October 2013 Source: Turkstat, Undersecretariat of Treasury,
17 Top 10 Countries in Foreign Trade Exports (2012) Imports (2012) Country USD 000 Country USD 000 Germany Russia Iraq Germany Iran China UK USA UAE Italy Russia Iran Italy France France Spain USA India Spain S.Korea Source: Turkstat,
18 Main Product Groups in Foreign Trade Exports (2012) Imports (2012) Product Group USD '000 Product Group USD ' Precious stones, precious metals, pearls and articles thereof 2- Vehicles other than railway or tramway rolling-stock, parts thereof Mineral fuels, minerals oils and product of their distillation 2- Boilers, machinery and mechanical appliances, parts thereof Boilers, machinery and mechanical appliances, parts thereof Iron and steel Iron and steel Electrical machinery and equipment, parts thereof Electrical machinery and equipment, parts thereof Vehicles other than railway or tramway rolling-stock, parts thereof Source: Turkstat,

19 Trade between TR and EU (*) Jan.-Sep. Source: Ministry of Economy,

20 Distribution of Employment by Economic Activity (%) Source: Turkstat, Undersecretariat of Treasury,

21 Unemployment Rate (%) Source: Turkstat, Undersecretariat of Treasury,

22 Average Inflation in Periods (%) Source: Turkstat, Undersecretariat of Treasury,
23 R&D Expenditure per Capita (PPP, USD) Source: TUBITAK, Undersecretariat of Treasury,
 Source: TEIAS, Undersecretariat of Treasury,")
24 Electricity Demand and Supply in Turkey (Billion kwh) Source: TEIAS, Undersecretariat of Treasury,
25 Turkey s Energy Perspective Targets for 2023 Complete use of the potential of indigenous coal and hydro resources Maximum use of renewable resources Incorporate nuclear energy into electricity generation Rapid and continuous improvement in energy efficiency Turkey s Energy Corridor Concept: Strategy is to act as a transit country for secure & commercially viable projects and to be an energy terminal. e.g. TANAP (Trans-Anatolian Natural Gas Pipeline) Project Some ongoing important energy projects that will help Turkey s Energy Security: Mersin Akkuyu Nuclear Power Plant-Russia Sinop Nuclear Power Plant-Japan Source: Ministry of Economy,
26 Growing Dynamism in Turkey's Domestic Market Cell phone penetration rate in households: 93.2% (2012) Internet access rate in households: 47.2% (2012) Internet access rate in enterprises: 92.5% (2012) PC penetration rate in households: 31.8% (2012) Laptop penetration rate in households: 27.1% (2012) Digital camera penetration rate in households: 27.1% (2012) Printer penetration rate in households: 14.0% (2011) 1 of each 5 people owns a vehicle. (2011) Source: Ministry of Economy,
27 Logistics 2012 Europe s biggest truck fleet 53,000 hauler trucks 1,800-2,000 logistics and transportation companies Almost 1.4 million flights in million tonnes freight and 131 million passengers in airways 25. biggest ship fleet in the world 68 airports and 253 ports Total length of divided highways reached 18,000 kilometers High-speed railway projects are carried out rapidly Source: Ministry of Economy,
28 Market entry in Turkey Market entry without direct investment Direct sales Co-operation with an agency or importer Distribution via a sales representative Establishment of a liaison office Market entry involving direct investment Establishment of a branch office Establishment of a new company Participation in a company Acquisition of a company Joint venture 28
29 Essentials of strategy development Market opportunities? 29
30 Essentials of strategy development Market opportunities? Competition? 30
31 Clarification of the following issues: How large is the market potential and how is it developing? What is the regional distribution of the customers like? Do they import directly or do they buy locally? Which local and international competitors are currently operating? How are they positioned and which strategies are being implemented successfully? How satisfied are the customers with the products and services that have been offered so far? Which deficits are there? What are the distribution structures in the sector like (chain from the producer down to the final customer)? How is the price situation and which products are mainly being sold? What is the image of the own brand like in Turkey? 31
32 Testing the market Definition of the target group Mailing to the companies that are interested Research for companies Re-contacting Identifying of contact persons Phone interview to find out if they are interested Short-listing of companies that are interested In-situ talks with the companies 32
33 Direct sales There is not a large number of customers. Customers are bigger companies that are used to buy and import directly from foreign countries. Pricing pressure is very high, and the products need little explaining. The products need a lot of explaining and are very customer-specific. A representative will hardly be able to provide the required know-how, but the market is not large enough to be able to have an employee. 33
34 Direct sales Advantages Direct contact with customers No price increase due to commissions to be paid to representatives Disadvantages Time-consuming when there is a large number of customers Smaller companies prefer to buy locally in Turkey 34
35 Agent or importer Market potential < 1 million Customers are municipalities or the state 35
36 Agent or importer Advantages Advantageous cost situation Fast access to the market Utilization of existing resources Disadvantages Partners often think short-term Difficult to steer Strategy cannot be decided directly Market information is filtered Less customer confidence compared to own representation 36
37 Experiences of our customers with importers and agents In practice usually considerably less successful than company s own representation Problems due to diverging mentalities By first having a representative and then own company you train a future competitor Short-term thinking is not compatible with the building up of the market that will be rather slow at first 37
38 Possible mistakes when choosing partners You choose an exclusive partner who only has good leads to one of several target sectors Your sales partner represents too many companies already 38
39 More possible mistakes You choose a representative with a traditional mentality You choose a representative that is not active enough 39
40 Problem areas Your partner plans on a rather short term Market information is being filtered 40
41 Search for a sales partner Definition of profile of desired partner Systematic search for candidates (should be ) together with contact persons Personal interviews of the candidates on the basis of a detailed questionnaire, collection of market information Analysis and reporting Long list Mailing to the candidates Interviews with the candidates Verification of references Phone interviews for short-listing Consultation of potential customers: What are their recommendations? Selection of one or several partners Possibly local follow-up in the initial period 41
42 Sales representative In practice of little significance, mostly there is a real employee, or an agent or importer Individual personnel who will work strictly on a commission basis is extremely hard to find 42
43 Liaison Office Easy market entry Comparatively few expenses Not a full legal entity No personal income tax for employees 43
44 Liaison Office Advantages Steering of strategy with own employees No personal income tax for employees Representation with an address and phone number in Turkey Simple expense accounting Disadvantages No way to issue local invoices No possibility of importing or stock-keeping Input tax not deductible Customer confidence 44
45 Limited liability company Advantages Easier access to the market Full governance Customer intimacy and confidence Control of know-how Competitive advantages Qualified employees Disadvantages Running expenses Administrative burden 45
46 Joint Venture We only recommend a joint venture if the strategic benefits are very high There are many examples of joint ventures that have failed miserably 46
47 Employee Leasing Customized recruitment for example by our recruitment company Employment in a Turkish company (we offer to employ the persons in our company Professional employee administration, payroll by us Optional active employee management by us Functional management by our client 47
48 Employee Leasing - Advantages Fast and and uncomplicated market entry Full control of activities Highly flexible, formation of a subsidiary in Turkey later on possible and even possibility to quit the market easily 48
49 A little bit of advice Be careful how you conduct negotiations Try to gain people s trust Take emotional aspects into account Build and cultivate personal relationships Develop intercultural know-how on Turkey 49
50 Turkey Newsletter Foreign Market Consulting publishes a complimentary monthly newsletter via , which informs about current economic and political issues in Turkey in a concise and condensed manner. Subscribe 50
Turkey: Recent Developments and Future Prospects. ISBANK Economic Research Division October 2018
 Turkey: Recent Developments and Future Prospects ISBANK Economic Research Division October 2018 Macroeconomic Outlook Strong Economic Growth Cycle GDP of 851 bn USD (2017), 10.6k USD (2017) per capita
India Economic Factsheet
 1 India Economic Factsheet (As of February 2015) ECONOMIC PROJECTIONS 2013 2014 2015 (F) GDP (Trillion US$) 1.88 2.04 2.16 Real GDP growth 4.47 4.8 5.6 GDP per capita in PPP 5,412 5,777 6,176 Exports (Billion
Turkey: Recent Developments and Future Prospects. ISBANK Economic Research Division May 2018
 Turkey: Recent Developments and Future Prospects ISBANK Economic Research Division May 2018 Macroeconomic Outlook Strong Economic Growth Cycle GDP of 851 bn USD (2017), 10.6k USD (2017) per capita Average
Report on Finnish Technology Industry Exports
 Report on Finnish Technology Industry Exports Last observation October 2018, 2.1.2019 Goods Export of Technology Industry from Finland Goods Export of Technology Industry from Finland by Branches Source:
TURKEY: RECENT DEVELOPMENTS January March 2018
 TURKEY: RECENT DEVELOPMENTS January March 218 3 81 4 698 961 7 34 7 96 9 66 8 98 1 931 1 6 11 2 11 88 11 19 1 883 1 97 12 48 12 112 Per capita GDP tripled while nominal GDP quadrupled in last 1 years 237
TURKEY: RECENT DEVELOPMENTS January June 2018
 TURKEY: RECENT DEVELOPMENTS January June 218 3 81 4 698 961 7 34 7 96 9 66 8 98 1 931 1 6 11 2 11 88 11 19 1 883 1 97 12 48 12 112 Per capita GDP tripled while nominal GDP quadrupled in last 1 years 237
TURKEY: RECENT DEVELOPMENTS January September 2018
 TURKEY: RECENT DEVELOPMENTS January September 218 3 81 4 698 961 7 34 7 96 9 66 8 98 1 931 1 6 11 11 88 11 19 1 883 1 97 12 48 12 112 Per capita GDP tripled while nominal GDP quadrupled in last 1 years
REPUBLIC OF TURKEY PRIME MINISTRY
 REPUBLIC OF TURKEY PRIME MINISTRY Investment Support and Promotion Agency of Turkey (ISPAT) Investment Climate and Doing Business in Turkey Murat OZDEMIR Country Advisor Canada ozdemir.murat@invest.gov.tr
WHY INVEST IN TURKEY?
 Why invest in? 10 reasons to invest in.. Robust Economy Opportunities Domestic market + EU Benign R&D Ecosystem WHY Strategic Location INVEST IN Lucrative Incentives TURKEY? Favorable Demographics Business-friendly
CENTRAL BANK OF THE REPUBLIC OF TURKEY
 CENTRAL BANK OF THE REPUBLIC OF TURKEY Growth and Financial System Durmuş YILMAZ Governor February, 211 1 Presentation Outline I. Recent Developments in the Turkish Economy II. III. Monetary Policy Policy
Lithuania: in a wind of change. Robertas Dargis President of the Lithuanian Confederation of Industrialists
 Lithuania: in a wind of change Robertas Dargis President of the Lithuanian Confederation of Industrialists 2017 06 15 Lithuanian Confederation of Industrialists - the largest business organisation in Lithuania
Economic Stimulus Packages and Steel: A Summary
 Economic Stimulus Packages and Steel: A Summary Steel Committee Meeting 8-9 June 2009 Sources of information on stimulus packages Questionnaire to Steel Committee members, full participants and observers
Environment. of Turkey. Esra DOĞAN TULGAN Senior Project Director. Republic of Turkey Prime Ministry Investment Support and Promotion Agency
 Investment Environment of Turkey Esra DOĞAN TULGAN Senior Project Director Republic of Turkey Prime Ministry Investment Support and Promotion Agency Agenda Key Figures on Turkey Top Reasons to Invest in
India s International Trade & Investment
 India s International Trade & Investment July 2017 1 Structure of Presentation 1 Indian Economy: A Snapshot 2 Merchandise Trade: A Perspective 3 Services Trade: Recent Trends 4 India s Investment Flows
Turkey s Saving Deficit Issue From an Institutional Perspective
 Turkey s Saving Deficit Issue From an Institutional Perspective Engin KURUN, Ph.D CEO, Ziraat Asset Management Oct. 25th, 2011 - Istanbul 1 PRESENTATION Household and Institutional Savings Institutional
Summary and Conclusion
 Chapter 7 Summary and Conclusion 7.1 Introduction The main objective of the study was to examine the investment scenario in SAARC countries. In addition to that the study has also analysed intra-regional
VEDP QUARTERLY ECONOMIC UPDATE
 VEDP QUARTERLY ECONOMIC UPDATE September 2016 VIRGINIA ECONOMIC DEVELOPMENT PARTNERSHIP YESVIRGINIA.ORG 1 US ECONOMIC OUTLOOK 1 8% - Source: Consensus Forecasts, September 2016 2 US WEEKLY INDICATORS 5%
Transformative Power of Private Equity in Turkey
 tepav Economic Policy Research Foundation of Turkey Transformative Power of Private Equity in Turkey Guven Sak, Berlin, Super Returns Conference 27 February 2012 Slide 2 Framework Current economic environment
III. TRADE-RELATED ASPECTS OF INVESTMENT POLICIES. (1) Foreign Direct Investment: General Policy Direction
 Foreign Direct Investment: General Policy Direction") Page 26 III. TRADE-RELATED ASPECTS OF INVESTMENT POLICIES (1) Foreign Direct Investment: General Policy Direction 1. Singapore's rapid economic growth has been to a large extent due to massive foreign
Page 26 III. TRADE-RELATED ASPECTS OF INVESTMENT POLICIES (1) Foreign Direct Investment: General Policy Direction 1. Singapore's rapid economic growth has been to a large extent due to massive foreign
Foreign Direct Investment and Ease of Doing Business: Before, During and After the Global Crisis
 Foreign Direct Investment and Ease of Doing Business: Before, During and After the Global Crisis Nihal Bayraktar Pennsylvania State University Harrisburg June 27, 2011 Introduction FDI has been seen as
MEDITERRANEAN EXPANSION. Acquisition of U.N. Ro-Ro
 MEDITERRANEAN EXPANSION Acquisition of U.N. Ro-Ro 12 April 2018 AGENDA Welcome 1 Key strategic rationale 2 Overview of U.N. Ro-Ro 3 Turkey macro perspectives 4 Financial highlights 5 Summary 6 Q&A 2 The
S U M M A R Y. Table 1(a) : Monthly Import of Goods & Services Items
 : Monthly Import of Goods & Services Items") VI S U M M A R Y Table 1(a) : Monthly Import of Goods & Items (Million US$) August 2012 2011 I. Import Payments (Banks) 3,169 3,610 II. Freight & Insurance 190 217 III. Other Import unaccounted by Banks
VI S U M M A R Y Table 1(a) : Monthly Import of Goods & Items (Million US$) August 2012 2011 I. Import Payments (Banks) 3,169 3,610 II. Freight & Insurance 190 217 III. Other Import unaccounted by Banks
Republic of Turkey Prime Ministry. Investment Support and Promotion Agency of Turkey ISPAT. Investment Environment of Turkey
 Republic of Turkey Prime Ministry Investment Support and Promotion Agency of Turkey ISPAT Investment Environment of Turkey Ahmet Cüneyt Selçuk Chief Project Director AGENDA The Agency Turkey with some
Congress continues to consider moving to
 Who Will Benefit from a Territorial Tax? Characteristics of Multinational Firms Jennifer Gravelle, Congressional Budget Office* INTRODUCTION Congress continues to consider moving to a territorial tax system
Statistics on UK-EU trade
 BRIEFING PAPER Number 7851, 6 January 2017 Statistics on UK-EU trade By Dominic Webb Contents: 1. Overview 2. Trade in goods 3. Trade in services 4. Trade between EU & Scotland, Wales, Northern Ireland
REPUBLIC OF TURKEY PRIME MINISTRY
 REPUBLIC OF TURKEY PRIME MINISTRY Investment Support and Promotion Agency of Turkey ISPAT Investment Climate in Turkey Beautiful landscape Combination of contemporary and traditional Home of many successful
REPUBLIC OF TURKEY PRIME MINISTRY
 REPUBLIC OF TURKEY PRIME MINISTRY Investment Support and Promotion Agency of Turkey ISPAT Ismail Bitirim Senior Project Director Investment Climate in Turkey Beautiful landscape... Combination of contemporary
Content. Introduction. Part I: The Lebanese Macroeconomy. 1. Gross Domestic Product. 2. Monetary Situation. 3. Banking Sector. 4. Balance of Payments
 Content Introduction Part I: The Lebanese Macroeconomy 1. Gross Domestic Product 2. Monetary Situation 3. Banking Sector 4. Balance of Payments 5. Public Finance 6. Financial Markets 7. Foreign Trade 8.
EU-28 STEEL SCRAP STATISTICS. by Rolf Willeke Statistics Advisor of the BIR Ferrous Division For EFR a branch of EuRIC (30 October 2017)
") EU-28 STEEL SCRAP STATISTICS (JANUARY JUNE 2017) by Rolf Willeke Statistics Advisor of the BIR Ferrous Division For EFR a branch of EuRIC (30 October 2017) C O N T E N T S EU-28 and World Crude Steel Production
EU-28 STEEL SCRAP STATISTICS (JANUARY JUNE 2017) by Rolf Willeke Statistics Advisor of the BIR Ferrous Division For EFR a branch of EuRIC (30 October 2017) C O N T E N T S EU-28 and World Crude Steel Production
Slovak Competitiveness: Fundamentals, Indicators and Challenges
 Copyright rests with the author Slovak Competitiveness: Fundamentals, Indicators and Challenges Presentation by Mark De Broeck European Department, IMF Seminar Organized by the European Commission November
B2. International trade and emerging markets
 B2. International trade and emerging markets Introduction and definitions The key origins and destinations of Dutch trade remain other European Union countries and the United States. However, other trading
Indicator Name f 2016f
 December 215 A&T Bank View: We expect Omani economy to grow by 4.4% and 2.8% in 215 and 216 respectively. The growth of Oman's economy will slow over 216 as falling oil production and prices begin to have
 Turkey s value proposition and a short note on Turkish Mining Sector (10 November 2016) ABMEC Annual Conference 2016 (Figures and pictures courtesy of Investment Agency of Turkey) www.ishtaradvisory.com
The Economic Letter May 2018
 ASSOCIATION OF BANKS IN LEBANON Research & Statistics Department The Economic Letter May 2018 Summary: In May 2018, real sector indicators were mixed with reference to the preceding month. Imports of goods
Citation The Kyoto Economic Review (2017), 8.
, 8.") Title Turkey's Current Account Deficit Pr the Economic and Monetary Union of Author(s) Ünal, Emre Citation The Kyoto Economic Review (2017), 8 Issue Date 2017 URL http://hdl.handle.net/2433/232665 Right
Title Turkey's Current Account Deficit Pr the Economic and Monetary Union of Author(s) Ünal, Emre Citation The Kyoto Economic Review (2017), 8 Issue Date 2017 URL http://hdl.handle.net/2433/232665 Right
IZMIR UNIVERSITY of ECONOMICS
 IZMIR UNIVERSITY of ECONOMICS Department of International Relations and the European Union TURKEY EU RELATIONS ( EU308) FOREIGN DIRECT INVESTMENT IN THE EUROPEAN UNION AND TURKEY Prepared By: Büke OŞAFOĞLU
The Economic Letter July 2018
 ASSOCIATION OF BANKS IN LEBANON Research & Statistics Department The Economic Letter July 2018 Summary: In July 2018, real sector indicators progressed in relation to the preceding month. Both imports
European Commission takes over the national authorities competence with regard to international trade Common Customs Tariff
 MINISTRY OF ECONOMY AND COMMERCE Foreign Trade Department ROMANIA Member of the European Union ECONOMIC DEVELOPMENT AND OPPORTUNITIES IN ROMANIA By Iuliu WINKLER, minister delegate for commerce Romania
BULGARIAN TRADE WITH EU PRELIMINARY DATA
 BULGARIAN TRADE WITH EU PRELIMINARY DATA During the period January - June 2010 the Bulgarian exports to EU increased by 17.4% compared to the corresponding period of the previous year and amounted to 8
Ukraine FDI report 2011
 Ukraine FDI report 2011 Contents Competing in a converging world 3 Ukraine s true FDI value 4 Reforms and expectations 7 Methodology 8 Ernst & Young in Ukraine 9 Foreword The Ukraine Foreign Direct Investment
Review of Pakistan s Balance of Payments July June 2009
 Review of Pakistan s Balance of Payments July 2008 - June 2009 Pakistan s balance of payments showed a deficit of $9,261 million in its current account balance during 2008-09 as against a deficit of $13,874
The Economic Letter December 2010
 ASSOCIATION OF BANKS IN LEBANON Research & Statistics Department The Economic Letter December 2010 Summary: Despite the deceleration in the activities of a number of economic sectors in the fourth quarter,
TURKEY: RECENT DEVELOPMENTS January December 2018
 TURKEY: RECENT DEVELOPMENTS January December 18 3 581 4 698 5 961 7 4 7 96 9 656 8 98 1 931 1 56 11 5 11 588 11 19 1 883 1 597 12 48 12 112 Per capita GDP tripled while nominal GDP quadrupled in last 15
Japan's Balance of Payments Statistics and International Investment Position for 2016
 Japan's Balance of Payments Statistics and International Investment Position for 16 July 17 International Department Bank of Japan Japan's balance of payments statistics for 16 -- the annually revised
Turkey and the Emerging. the Global Crisis. Yelda Yücel 14 June 2009 Nicosia
 Turkey and the Emerging Market Economies during the Global Crisis Yelda Yücel 14 June 2009 Nicosia Green Shoots in The Global Economy? There are more signs of easing of the global recession in the second
First estimate for 2011 Euro area external trade deficit 7.7 bn euro bn euro deficit for EU27
 27/2012-15 February 2012 First estimate for 2011 Euro area external trade deficit 7.7 152.8 deficit for EU27 The first estimate for the euro area 1 (EA17) trade in goods balance with the rest of the world
The Economic Letter September 2018
 ASSOCIATION OF BANKS IN LEBANON Research & Statistics Department The Economic Letter September 2018 Summary: In the first three quarters of 2018, most real sector indicators retreated in relation to the
The Economic Letter March 2018
 ASSOCIATION OF BANKS IN LEBANON Research & Statistics Department The Economic Letter March 2018 Summary: In the first quarter 2018, most real sector indicators retreated with regard to the corresponding
The Economic Letter December 2016
 ASSOCIATION OF BANKS IN LEBANON Research & Statistics Department The Economic Letter December 2016 Summary: In 2016, real sector indicators were mixed and their varied performance pointed to another year
10 reasons to invest in France
 October 2009 10 reasons to invest in France IFA Keys to understanding the new France 2 1 An economy with a global outlook Foreign companies employ over 2.8 million people in France at 23,000 different
Vietnam. HSBC Global Connections Report. October 2013
 HSBC Global Connections Report October 2013 Vietnam The pick-up in GDP growth will be modest this year, with weak domestic demand and exports still dampening industrial confidence. A stronger recovery
Presentation for the Economic Development Committee of the City of Toronto
 Presentation for the Economic Development Committee of the City of Toronto Consulate General of the Republic of Turkey June 24, 2014 TORONTO ECONOMIC SUCCESS STORY OF THE STAR AND CRESCENT ECONOMIC SUCCESS
Main Development Trends of Czech Economy in 2013 and the Perspective for (April 2014)
") Main Development Trends of Czech Economy in 2013 and the Perspective for 2014 (April 2014) The Czech Industry Results in 2013 in the Context of the EU Market and the Perspective for 2014 The Development
Main Development Trends of Czech Economy in 2013 and the Perspective for 2014 (April 2014) The Czech Industry Results in 2013 in the Context of the EU Market and the Perspective for 2014 The Development
Missouri Economic Indicator Brief: Manufacturing Industries
 Missouri Economic Indicator Brief: Manufacturing Industries Manufacturing is a major component of Missouri s $300.9 billion economy. It represents 13.1 percent ($39.4 billion) of the 2016 Gross State Product
The Economic Letter November 2018
 ASSOCIATION OF BANKS IN LEBANON Research & Statistics Department The Summary: In November 2018, the majority of real sector indicators regressed in relation to the previous month. Imports and exports of
EUROPEAN UNION SOUTH KOREA TRADE AND INVESTMENT 5 TH ANNIVERSARY OF THE FTA. Delegation of the European Union to the Republic of Korea
 EUROPEAN UNION SOUTH KOREA TRADE AND INVESTMENT 5 TH ANNIVERSARY OF THE FTA 2016 Delegation of the European Union to the Republic of Korea 16 th Floor, S-tower, 82 Saemunan-ro, Jongno-gu, Seoul, Korea
ECONOMIC MONITOR MOLDOVA Issue 7 January 2018
 ECONOMIC MONITOR MOLDOVA Issue 7 January 218 Overview Economic growth at 3.5% in 217 Weaker growth of 3.% expected in 218 due to decreased consumption demand Inflation at 6.6% in average during 217; lower
Economic Outlook. William Strauss Senior Economist and Economic Advisor Federal Reserve Bank of Chicago
 Economic Outlook CRF Credit & A/R Forum & EXPO Salt Lake City, UT October 23, 218 William Strauss Senior Economist and Economic Advisor Federal Reserve Bank of Chicago What I said In August The outlook
InvestBulgaria Agency. Empower your Investment
 InvestBulgaria Agency Empower your Investment Content 2 Who are we What is InvestBulgaria Agency and what is its purpose What can you get What are your benefits from investing in Bulgaria and how can you
ANNUAL ECONOMIC REPORT AJMAN 2015
 ANNUAL ECONOMIC REPORT AJMAN C O N T E N T S Introduction Growth of the Global Economy Economic Growth in the United Arab Emirates Macro - Economic Growth in the Emirate of Ajman Gross Domestic Product
LEBANON WEEKLY REPORT
 Total imports decreased by a yearly 5% to reach USD 8,713 million in the first five months of 2014, while total exports dropped by 30% to reach USD 1,387 million. Imports from China accounted for the largest
A. Definitions and sources of data
 Poland A. Definitions and sources of data Data on foreign direct investment (FDI) in Poland are reported by the National Bank of Poland (NBP), the Polish Agency for Foreign Investment (PAIZ) and the Central
January 2014 Euro area international trade in goods surplus 0.9 bn euro 13.0 bn euro deficit for EU28
 STAT/14/41 18 March 2014 January 2014 Euro area international trade in goods surplus 0.9 13.0 deficit for EU28 The first estimate for the euro area 1 (EA18) trade in goods balance with the rest of the
The Economic Letter January 2018
 ASSOCIATION OF BANKS IN LEBANON Research & Statistics Department The Economic Letter January 2018 Summary: In the first month of 2018, most real sector indicators retreated in relation to the preceding
National Export & Investment Agency KAZNEX INVEST Ministry of Investment and Development
 National Export & Investment Agency KAZNEX INVEST Ministry of Investment and Development Invest in Kazakhstan Basic Facts National Flag National Emblem Area: 2,724,000km 2 (1,051,742 sq.miles),9 th largest
Structural Transformation of the Turkish Economy: The new agenda for adjustment, risk management, and competitiveness
 Economic Policy Research Institute TOBB Economics and Technology University Structural Transformation of the Turkish Economy: The new agenda for adjustment, risk management, and competitiveness Güven Sak
Travel Insurance and Assistance in the Asia-Pacific Region
 Travel Insurance and Assistance in the Asia-Pacific Region Report Prospectus October 2013 Web: www.finaccord.com. E-mail: info@finaccord.com 1 Prospectus contents Page What is the research? What methodology
CURRENT ACCOUNT DEFICIT
 SHORT OVERVIEW The continuously strong inflow of external funds accompanied by active invest ment activities and private consumption maintained a high level of current account deficit. The current account
May 2012 Euro area international trade in goods surplus of 6.9 bn euro 3.8 bn euro deficit for EU27
 108/2012-16 July 2012 May 2012 Euro area international trade in goods surplus of 6.9 3.8 deficit for EU27 The first estimate for the euro area 1 (EA17) trade in goods balance with the rest of the world
How Much, With Whom and What Does the US Trade? It is important to remember that trade includes both Goods and Services.
 How Much, With Whom and What Does the US Trade? It is important to remember that trade includes both Goods and Services. In 2016 1 : The US exported $1.5 trillion in Goods and $750 billion in Services
Review of the Economy. E.1 Global trends. January 2014
 Export performance was robust during the third quarter, partly on account of the sharp depreciation in the exchange rate of the rupee and partly on account of a modest recovery in major advanced economies.
June 2014 Euro area international trade in goods surplus 16.8 bn 2.9 bn surplus for EU28
 127/2014-18 August 2014 June 2014 Euro area international trade in goods surplus 16.8 bn 2.9 bn surplus for EU28 The first estimate for the euro area 1 (EA18) trade in goods balance with the rest of the
June 2012 Euro area international trade in goods surplus of 14.9 bn euro 0.4 bn euro surplus for EU27
 121/2012-17 August 2012 June 2012 Euro area international trade in goods surplus of 14.9 0.4 surplus for EU27 The first estimate for the euro area 1 (EA17) trade in goods balance with the rest of the world
August 2012 Euro area international trade in goods surplus of 6.6 bn euro 12.6 bn euro deficit for EU27
 146/2012-16 October 2012 August 2012 Euro area international trade in goods surplus of 6.6 12.6 deficit for EU27 The first estimate for the euro area 1 (EA17) trade in goods balance with the rest of the
Eesti Pank ESTONIA S BALANCE OF PAYMENTS FOR 2016
 Eesti Pank ESTONIA S BALANCE OF PAYMENTS FOR 216 217 The Balance of Payments Yearbook is a longer analysis of annual external sector statistics, which includes a number of graphs. In addition, the yearbook
Emirates NBD Research UAE Sector Chart Pack
 Emirates NBD Research UAE Sector Chart Pack Thanos Tsetsonis athanasiost@emiratesnbd.com May 218 1 mn b/d USD / b UAE: Downside risks to 218 growth forecast due to lower oil production estimates Highlights
Economic Outlook. Global And Finnish. Technology Industries In Finland Turnover and orders picking up s. 5. Economic Outlook
 Economic Outlook Technology Industries of Finland 2 217 Global And Finnish Economic Outlook Broad-Based Global Economic Growth s. 3 Technology Industries In Finland Turnover and orders picking up s. 5
Economic outlook and market attractiveness. Innocenzo Cipolletta AIFI Chairman
 Economic outlook and market attractiveness Innocenzo Cipolletta AIFI Chairman Zurich, 14 April 2015 Some features of the Italian economy In spite of the difficult economic scenario, Italy: Is the 6 th
Iran: Untapped Potential
 Iran: Untapped Potential Alireza Kolahi CEO Abhar Wire and Cable Executive Chairman Noorin Industrial Holdings Member of Board DigiKala.com President Iran Electrical Industry Association Member of Board
Iron Ore & Steel Derivatives Let the Battle Begin
 Iron Ore & Steel Derivatives Let the Battle Begin Topics Raw Material Price Volatility Financial Hedging Attributes Iron Ore World Steel Exchange Scrap Presented by: DATE: Tuesday November 30, 2010 Patrick
Supplemental Table I. WTO impact by industry
 Supplemental Table I. WTO impact by industry This table presents the influence of WTO accessions on each three-digit NAICS code based industry for the manufacturing sector. The WTO impact is estimated
Global Economic Outlook John Hawksworth Chief Economist, PwC September 2012
 www.pwc.co.uk/economics Global Economic Outlook John Hawksworth Chief Economist, September 2012 Agenda Global overview Short term prospects for Europe, US and BRICs Long term trends: demographics, growth
World Steel Industry Development and Market Prospects 13 th International Market and Trade Conference
 World Steel Industry Development and Market Prospects 13 th International Market and Trade Conference Global Steel Industry in the post-crisis Period Global economic recovery continues to disappoint The
BELGIUM S TRADE RELATIONS WITH THE REPUBLIC OF INDIA. State Visit. to the Republic of India. of Their Majesties the King and the Queen of the Belgians
 BELGIUM S TRADE RELATIONS WITH THE REPUBLIC OF INDIA State Visit to the Republic of India of Their Majesties the King and the Queen of the Belgians 5-11 NOVEMBER 2017 CONTENT 1. IMPORTANCE OF BELGIUM AND
Global Styrene Butadiene Rubber (SBR) Market Study ( )
 Market Study ( )") Global Styrene Butadiene Rubber (SBR) Market Study (2014 2025) Table of Contents 1. INTRODUCTION 1.1. Introduction to SBR Market Product Description Properties Industry Structure Value Chain Market Dynamics
Global Styrene Butadiene Rubber (SBR) Market Study (2014 2025) Table of Contents 1. INTRODUCTION 1.1. Introduction to SBR Market Product Description Properties Industry Structure Value Chain Market Dynamics
China s Economy: Development Trends
 China s Economy: Development Trends BRUSSELS INSTITUTE OF CONTEMPORARY CHINA STUDIES Duncan Freeman March 215 dfreeman@vub.ac.be CHINA S NEW NORMAL PRC GDP Growth 1978-214 (%) 16. 14. 12. 1. 8. 6. 4. 2..
CANADA EUROPEAN UNION
 THE EUROPEAN UNION S PROFILE Economic Indicators Gross domestic product (GDP) at purchasing power parity (PPP): US$20.3 trillion (2016) GDP per capita at PPP: US$39,600 (2016) Population: 511.5 million
EMPLOYMENT RATE IN EU-COUNTRIES 2000 Employed/Working age population (15-64 years)
") EMPLOYMENT RATE IN EU-COUNTRIES 2 Employed/Working age population (15-64 years EU-15 Denmark Netherlands Great Britain Sweden Portugal Finland Austria Germany Ireland Luxembourg France Belgium Greece Spain
EMPLOYMENT RATE IN EU-COUNTRIES 2 Employed/Working age population (15-64 years EU-15 Denmark Netherlands Great Britain Sweden Portugal Finland Austria Germany Ireland Luxembourg France Belgium Greece Spain
France Economic Update QNB Group. September 2014
 France Economic Update QNB Group September 2014 France Overview France is the ninth largest economy in the world on a purchasing power parity basis and service-oriented; high indebtedness and lack of reforms
Switzerland Economic Update QNB Group. September 2014
 Switzerland Economic Update QNB Group September 14 Switzerland Overview Switzerland s efficient capital markets, highly skilled human capital and low corporate tax rates make it the world's most competitive
UK ECONOMY SITUATION & PROSPECTS
 UK ECONOMY SITUATION & PROSPECTS 26 November 2013 Hermione Gough Counsellor Europe and Global Issues British Embassy Paris UNCLASSIFIED 1 The pace of recovery picked up further in Q3, with UK GDP expanding
Travel Insurance and Assistance
 Travel Insurance and Assistance Worldwide research covering over 40 countries Series Prospectus Finaccord 1 Prospectus contents Page What is the research? Which countries are covered What methodology has
Chapter-2. Trends in India s Foreign Trade
 Chapter-2 India s Trade Performance India s merchandise exports reached a level of US $ 251.14 billion during 2010-11 registering a growth of 40.49 percent as compared to a negative growth of 3.53 percent
TRADE IN GOODS OF BULGARIA WITH EU IN THE PERIOD JANUARY - JUNE 2018 (PRELIMINARY DATA)
") TRADE IN GOODS OF BULGARIA WITH EU IN THE PERIOD JANUARY - JUNE 2018 (PRELIMINARY DATA) In the period January - June 2018 the exports of goods from Bulgaria to the EU increased by 10.7% 2017 and amounted
TRADE IN GOODS OF BULGARIA WITH EU IN THE PERIOD JANUARY - JUNE 2018 (PRELIMINARY DATA) In the period January - June 2018 the exports of goods from Bulgaria to the EU increased by 10.7% 2017 and amounted
Japan's Balance of Payments for August 2009 International Department Bank of Japan
 Japan's Balance of Payments for 28 August 29 International Department Bank of Japan This is an English translation of the Japanese original released on March 24, 29 Balance of Payments 28 Please contact
Preliminary results of International Trade in 2014: in nominal terms exports increased by 1.8% and imports increased by 3.
 International Trade Statistics 7 July, 215 Preliminary results of International Trade in : in nominal terms exports increased by 1.8% and imports increased by 3.2% vis-à-vis 213 In, exports of goods increased
Financial wealth of private households worldwide
 Economic Research Financial wealth of private households worldwide Munich, October 217 Recovery in turbulent times Assets and liabilities of private households worldwide in EUR trillion and annualrate
Item
 385 POPULATION Total population a thousand; as of 1 July 96.4 97.4 99.1 99.8 100.1 100.4 100.8 101.1 Population density persons per square kilometer 121 122 124 125 125 126 126 126 Population annual change,
Travel Insurance and Assistance
 Travel Insurance and Assistance Worldwide research covering over 40 countries Series Prospectus Finaccord Ltd., 2016 Web: www.finaccord.com. E-mail: info@finaccord.com 1 Prospectus contents Page What is
Revised October 17, 2016
 Revised October 17, 2016 60 ISM Manufacturing Purchasing Managers Index (September 2015 September 2016) 58 56 54 52 50 48 46 44 42 Sept-15 Oct Nov Dec Jan-16 Feb Mar Apr May Jun Jul Aug Sept Purchasing