Foreign Direct Investment and Ease of Doing Business: Before, During and After the Global Crisis
|
|
|
- Buddy Fox
- 5 years ago
- Views:
Transcription
1 Foreign Direct Investment and Ease of Doing Business: Before, During and After the Global Crisis Nihal Bayraktar Pennsylvania State University Harrisburg June 27, 2011
2 Introduction FDI has been seen as an important source of technology spillover, improvement in efficiency and growth. Thus, it is important to study determinants of FDI and its effects on an economy. Blonigen and Piger (2011) [OECD countries] Cultural distance factors, parent country per capita GDP, relative labor endowments, and regional trade agreements play an important role in determining FDI. Multilateral trade openness, host country business costs, host country infrastructure, and host country institutions are less important in determining FDI.
3 Introduction Aim: investigate the factors determining changing direction of FDI from developed countries towards developing ones. Focus is on doing business indicators of the World Bank. Period: (estimates used for 2011). Before, during and after the global financial and economic crisis But the historical trend in FDI inflows is also included.
4 Plan Trends in FDI in the world Trends in FDI country specific examples FDI and basic macroeconomic variables in recent years Link between doing business indicators and FDI in years Summary of initial results
5 Trends in FDI in the world United Nations Conference on Trade and Development (2009) reported that FDI in 2008 dropped almost by 15 percent from its historically high level of $1.9 trillion in Two reasons: 1) the capacity of firms to invest reduced by declining availability of credits; 2) the tendency to invest declined negatively by changing economic conditions especially in developed countries. Interesting observation: even in the middle of the crisis in 2008, flows into developing countries were increasing, while it was declining into developed countries.
6 Trends in FDI in the world UN Conference on Trade and Development (UNCTAD, 2011) Global inflows of foreign direct investment in 2010 was equal to $1.12 trillion, slightly higher than the level in 2009 ($1.11 trillion). In 2010, for the first time, developed countries received less than half of global FDI. Flows of FDI to developed countries as a group fell by nearly 7%, whereas those to the rest of the world increased by almost 10%
7 Trends in FDI in the world UN Conference on Trade and Development (UNCTAD, 2011) The USA remained the world s biggest receiver for FDI ($186 billion in 2010), which is 43% more than a year earlier. More than $100 billion of FDI flew to China. This figure makes China the world s second largest recipient of FDI.
8 FDI Inflows (net)
9 FDI Data FDI net inflows: Foreign direct investment (FDI) or foreign investment refers to the net inflows of investment to acquire a lasting management interest (10 percent or more of voting stock) in an enterprise operating in an economy other than that of the investor. It is the sum of equity capital, reinvestment of earnings, other long term capital, and short term capital as shown in the balance of payments. The net inflows are new investment inflows less disinvestment. Data source: International Monetary Fund Balance of Payments and World Economic Outlook Databases.

10 Trends in FDI Inflows (in the world)

11 Trends in FDI Inflows (in the world)
12 FDI Inflows in developed countries


13 FDI Inflows in developed countries (% of world flows)
14 Top 15 FDI Recipients FDI inflows (in bilions of US $) FDI inflows (% of world flows) FDI inflows (in bilions of US $) FDI inflows (% of world flows) United States United States United Kingdom China (Mainland) China (Mainland) United Kingdom Netherlands China (Hong Kong) Canada Brazil France Russia Belgium Netherlands Germany Saudi Arabia Spain Germany Austria Singapore Russia France China (Hong Kong) India Italy Ireland Australia Canada Singapore Spain
15 Top 15 FDI Recipients Share in % of world flows FDI Share of developing countries in top

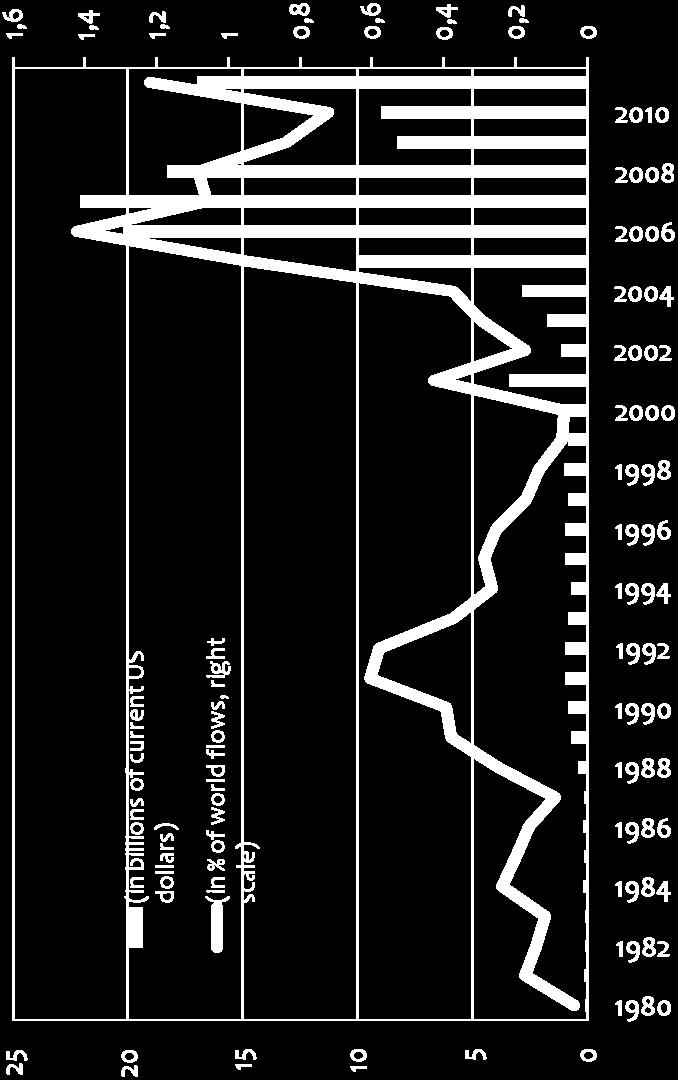
16 Top two recipients in 2010: FDI inflows in USA and China (in % of world inflows)

17 Top two recipients in 2010: FDI inflows to China (in % of inflows to USA)


18 BRIC Countries: FDI inflows (% of world flows)


19 Turkey: FDI Inflows
20 Possible determinants of FDI


21 Top 30 FDI Recipients in 2010 (receiving 90% of FDI): Growth of GDP and FDI Correlation = 0.56
")
 Correlation =")
22 Top 30 FDI Recipients in 2010 (receiving 90% of FDI) Growth of GDP and FDI (% of world flows) Correlation = 0.08

 Correlation =")
23 Top 30 FDI Recipients in 2010 (receiving 90% of FDI) Income and FDI (% of world flows) Correlation = 0.19

 Correlation =")
24 Top 30 FDI Recipients in 2010 (receiving 90% of FDI) Income and FDI (in ln terms) Correlation = 0.60
 Gross")
")
25 Top 30 FDI Recipients in 2010 (90% of FDI) Gross fixed K formation/gdp and FDI (% of world flows) Correlation = 0.24
26 Doing Business Database
27 Doing Business Database Definition of FDI is given in the Balance of Payments Manual of the International Monetary Fund (1993): FDI refers to an investment made to acquire lasting interest in enterprises operating outside of the economy of the investor. Further, in cases of FDI, the investor s purpose is to gain an effective voice in the management of the enterprise. Based on this definition, ease of doing business must be one of the important factors motivating the inflows of foreign direct investment.
28 Doing Business Database The main data source is the World Bank s Doing Business Database, covering the years from 2004 to Methodology of the database: The World Bank collaborates with academic professionals to design a business case survey. This method includes a business scenario and asks questions about how that firm would react to this scenario. Annually, the survey is distributed to nearly 8,000 local experts per economy, such as lawyers, consultants, accountants, supply chain professionals, government officials, and other businesspeople routinely administering or consulting foreign firms. The methodology also includes direct contacts the professionals.
29 Doing Business Database The main groups of variables in the Doing Business Database are: Starting a business indicators Getting credit indicators Protecting investors indicators Closing a business indicators
30 Doing Business Database Starting a business indicators: Procedures (number), Time (days), Cost (% of income per capita), Minimum capital (% of income per capita). Closing a business indicators: Recovery rate (cents on the dollar); Time (years); Cost (% of estate).
31 Doing Business Database Getting credit indicators: Strength of legal rights index (index between 0 10); Depth of credit information index (index between 0 6); Public registry coverage (% of adults); Private bureau coverage (% of adults).
32 Doing Business Database Protecting investors indicators: Extent of disclosure index (index between 0 10), Extent of director liability index (index between 0 10); Ease of shareholder suits index (index between 0 10); Strength of investor protection index (index between 0 10).
33 Top FDI Recipients in 2010: FDI and Ease of doing business ranking The higher the ease of doing business rank, the worse is the position of the country. FDI (% of world flows) Ease of doing business (ranking) United States China (Mainland) United Kingdom China (Hong Kong) Brazil Russia Netherlands Saudi Arabia Germany Singapore France India Ireland Canada Spain Switzerland Mexico Chile
34 Top FDI Recipients in 2010: FDI and Ease of doing business ranking BRIC countries are big exceptions. Despite very high ease of doing business ranking, their shares in FDI inflows are very high. FDI (% of world flows) Ease of doing business (ranking) United States China (Mainland) United Kingdom China (Hong Kong) Brazil Russia Netherlands Saudi Arabia Germany Singapore France India Ireland Canada Spain Switzerland Mexico Chile
 Expected correlation is")
35 Top 30 FDI recipients: Ease of doing business and FDI (2010 and 2011 combined) Expected correlation is ( )

 Expected")
36 Top 30 FDI recipients: Ease of doing business and FDI (2010 and 2011 combined) Expected correlation is ( )
 (developed versus developing")

37 Top 30 FDI recipients: Ease of doing business and FDI (2010 and 2011 combined) (developed versus developing countries) Correlation between FDI/GDP and ease of doing business Developing countries = 0.61 Developed countries = 0.33
38 Changes in Doing business indicators between 2004 and 2010 In terms of improvements in the values of doing business indicators, differences between developed and developing groups are significant. Developed: There is almost no change in the values of the indicators. That s the reason, we cannot explain the dropping FDI inflows to developed countries by changes in doing business indicators in these countries. Developing: Improvements in indicators in developing countries, especially in BRIC countries, are clear and these improvements support the increasing FDI inflows to this group of countries.
39 USA: FDI and doing business, FDI inflow/gdp FDI/world FDI Ease of Doing Business Rank Procedures (number) Starting a Business Time (days) Cost (% of income per capita) Paid in Min. Capital (% of income per capita) Ratio of value in 2010 to
40 USA: FDI and doing business, FDI inflow/gdp FDI/world FDI Procedures (number) Registering Property Time (days) Cost (% of property value) Strength of legal rights index (0 10) Getting Credit Depth of credit information index (0 6) Public registry coverage (% of adults) Private bureau coverage (% of adults) Ratio of value in 2010 to
41 USA: FDI and doing business, FDI inflow/gdp FDI/world FDI Extent of disclosure index (0 10) Protecting Investors Extent of director liability index (0 10) Ease of shareholder suits index (0 10) Strength of investor protection index (0 10) Ratio of value in 2010 to
42 Brazil: FDI and doing business, FDI inflow/gdp FDI/world FDI Ease of Doing Business Rank Procedures (number) Starting a Business Time (days) Cost (% of income per capita) Paid in Min. Capital (% of income per capita) Ratio of value in 2010 to
43 Brazil: FDI and doing business, Enforcing Contracts Closing a Business FDI inflow/gdp FDI/world FDI Procedures (number) Time (days) Cost (% of claim) Recovery rate (cents on the dollar) Time (years) Cost (% of estate) Ratio of value in 2010 to
44 China: FDI and doing business, FDI inflow/gdp FDI/world FDI Ease of Doing Business Rank Procedures (number) Starting a Business Time (days) Cost (% of income per capita) Paid in Min. Capital (% of income per capita) , , Ratio of value in 2010 to
45 China: FDI and doing business, FDI inflow/gdp FDI/world FDI Extent of disclosure index (0 10) Protecting Investors Extent of director liability index (0 10) Ease of shareholder suits index (0 10) Strength of investor protection index (0 10) Ratio of value in 2010 to
46 China: FDI and doing business, Enforcing Contracts Closing a Business FDI inflow/gdp FDI/world FDI Procedures (number) Time (days) Cost (% of claim) Recovery rate (cents on the dollar) Time (years) Cost (% of estate) Ratio of value in 2010 to
47 Hong Kong: FDI and doing business, FDI inflow/gdp FDI/world FDI Ease of Doing Business Rank Procedures (number) Starting a Business Time (days) Cost (% of income per capita) Paid in Min. Capital (% of income per capita) Ratio of value in 2010 to
48 Hong Kong: FDI and doing business, Enforcing Contracts FDI inflow/gdp FDI/world FDI Procedures (number) Time (days) Cost (% of claim) Ratio of value in 2010 to
49 India: FDI and doing business, FDI inflow/gdp FDI/world FDI Ease of Doing Business Rank Procedures (number) Starting a Business Time (days) Cost (% of income per capita) Paid in Min. Capital (% of income per capita) Ratio of value in 2010 to

50 India: FDI and doing business,
51 Russia: FDI and doing business, FDI inflow/gdp FDI/world FDI Ease of Doing Business Rank Procedures (number) Starting a Business Time (days) Cost (% of income per capita) Paid in Min. Capital (% of income per capita) Ratio of value in 2010 to
52 Turkey: FDI and doing business, FDI inflow/gdp FDI/world FDI Ease of Doing Business Rank Procedures (number) Starting a Business Time (days) Cost (% of income per capita) Paid in Min. Capital (% of income per capita) Ratio of value in 2010 to
53 Turkey: FDI and doing business, Enforcing Contracts Closing a Business FDI inflow/gdp FDI/world FDI Procedures (number) Time (days) Cost (% of claim) Recovery rate (cents on the dollar) Time (years) Cost (% of estate) Ratio of value in 2010 to


54 Top FDI Receiving Developing Countries: Starting a business (no. of procedures) and FDI, As you move down, lower is the number of procedure. Correlation = 0.27 As you move right, more FDI received.

55 Top FDI receiving developing countries: Starting a business (cost) and FDI, As you move down, lower is the cost of starting a business. Correlation = 0.42 As you move right, more FDI received.
 and FDI, 2004 10 As you move")

56 Top FDI receiving developing countries: Closing a business (recovery rate) and FDI, As you move up, higher is the recovery rate after closing the business. Correlation = 0.50 As you move right, more FDI received.
57 Developing countries: Correlation between FDI inflows and "doing business" indicators (country average, FDI % of world flows ) Expected sign Starting a Business Procedures (number) 0.54 Time (days) 0.69 Cost (% of income per capita) 0.63 Paid in Min. Capital (% of income per capita) Dealing with Construction Permits Procedures (number) 0.51 Time (days) 0.42 Cost (% of income per capita) 0.69 Registering Property Procedures (number) 0.48 Time (days) 0.58 Cost (% of property value) 0.23
58 Developing countries: Correlation between FDI inflows and "doing business" indicators (country average, FDI % of world flows ) Expected sign Getting Credit + Strength of legal rights index (0 10) Depth of credit information index (0 6) Public registry coverage (% of adults) Private bureau coverage (% of adults) 0.34 Protecting Investors + Extent of disclosure index (0 10) Extent of director liability index (0 10) Ease of shareholder suits index (0 10) Strength of investor protection index (0 10) 0.41
59 Developing countries: Correlation between FDI inflows and "doing business" indicators (country average, FDI % of world flows ) Expected sign Paying Taxes Payments (number per year) 0.41 Time (hours per year) 0.06 Total tax rate (% profit) 0.24 Trading Across Borders Documents to export (number) 0.26 Time to export (days) 0.44 Cost to export (US$ per container) 0.46 Documents to import (number) 0.51 Time to import (days) 0.50 Cost to import (US$ per container) 0.41 Enforcing Contracts Procedures (number) 0.55 Time (days) 0.32 Cost (% of claim) 0.01 Closing a Business + Recovery rate (cents on the dollar) 0.28 Time (years) 0.18
60 Initial Findings Share of developing countries in FDI inflows is increasing consistently, while it is dropping for developed countries. Differences in growth rates of developed and developing countries are one of the factor that can explain changing FDI inflows from developed to developing countries (developing countries are growing faster). Doing business indicators haven t changed much in developed countries. But the values of the indicators are rapidly improving in developing countries, especially in BRIC countries. Improvements are especially strong in starting a business and closing a business and protecting investors indicators. Thus improvements in doing business can be one important factor attracting more FDI inflows to developing countries.
61 Future study Regression studies of doing business indicators as determinants of FDI inflows, after controlling for other variables that can explain FDI inflows such as growth. Example empirical study Piwonski (2010): The results of the regression show that by increasing their country s Ease of Doing Business rank one level, a government can bring in over $44 million USD.
62


63 Trends in FDI Inflows (in the world)

64 FDI Inflows in developed countries

65 Two top recipients in 2010: FDI inflows in USA and China (in billions of current US dollar)
66 Developing countries: Correlation between changing FDI in GDP and changing "doing business" indicators Expected sign Starting a Business Procedures (number) 0.31 Time (days) 0.53 Cost (% of income per capita) 0.57 Paid in Min. Capital (% of income per capita) 0.58 Dealing with Construction Permits Procedures (number) 0.14 Time (days) 0.15 Cost (% of income per capita) 0.53 Registering Property Procedures (number) 0.32 Time (days) 0.41 Cost (% of property value) 0.29
67 Developing countries: Correlation between changing FDI in GDP and changing "doing business" indicators Expected sign Getting Credit + Strength of legal rights index (0 10) Depth of credit information index (0 6) Public registry coverage (% of adults) Private bureau coverage (% of adults) 0.38 Protecting Investors + Extent of disclosure index (0 10) Extent of director liability index (0 10) Ease of shareholder suits index (0 10) Strength of investor protection index (0 10) 0.34
68 Developing countries: Correlation between changing FDI in GDP and changing "doing business" indicators Expected sign Paying Taxes Payments (number per year) 0.27 Time (hours per year) 0.02 Total tax rate (% profit) 0.12 Trading Across Borders Documents to export (number) 0.23 Time to export (days) 0.25 Cost to export (US$ per container) 0.26 Documents to import (number) 0.51 Time to import (days) 0.34 Cost to import (US$ per container) 0.24 Enforcing Contracts Procedures (number) 0.55 Time (days) 0.35 Cost (% of claim) 0.02 Closing a Business + Recovery rate (cents on the dollar) 0.35 Time (years) 0.22

69 FDI Inflows in developed versus developing countries (% of world flows)
70 Measures of FDI inflows in initial calculations FDI in levels (in current US$) FDI (in % of GDP of the country) FDI (in % of world flows)
UK ECONOMY SITUATION & PROSPECTS
 UK ECONOMY SITUATION & PROSPECTS 26 November 2013 Hermione Gough Counsellor Europe and Global Issues British Embassy Paris UNCLASSIFIED 1 The pace of recovery picked up further in Q3, with UK GDP expanding
Available online at ScienceDirect. Procedia Economics and Finance 32 ( 2015 )
") Available online at www.sciencedirect.com ScienceDirect Procedia Economics and Finance 32 ( 2015 ) 256 263 Emerging Markets Queries in Finance and Business Quantitative and qualitative analysis of foreign
Available online at www.sciencedirect.com ScienceDirect Procedia Economics and Finance 32 ( 2015 ) 256 263 Emerging Markets Queries in Finance and Business Quantitative and qualitative analysis of foreign
Institutions & Perceptions of Political Risk in International Investment
 Institutions & Perceptions of Political Risk in International Investment Quintin H. Beazer 1 Daniel J. Blake 2 1 Florida State University qbeazer@fsu.edu 2 IE Business School daniel.blake@ie.edu IPES 2014
Note: G20 includes only the 19 member countries (excludes European Union).
.") Note: G20 includes only the 19 member countries (excludes European Union). (Per cent) Variable 2007 2008 2009 2010 2011 2012 2013 2014 2015* GDP 5.7 3.1 0.0 5.4 4.2 3.4 3.3 3.4 3.1 Trade 7.9 2.9-10.3 12.5
Note: G20 includes only the 19 member countries (excludes European Union). (Per cent) Variable 2007 2008 2009 2010 2011 2012 2013 2014 2015* GDP 5.7 3.1 0.0 5.4 4.2 3.4 3.3 3.4 3.1 Trade 7.9 2.9-10.3 12.5
Foreign Direct Investment in the United States 2013 Preliminary Data. Organization for International Investment (OFII)
") Foreign Direct Investment in the United States 2013 Preliminary Data Organization for International Investment (OFII) Key Findings: Foreign Direct Investment in the United States, 2003-2013 1 Foreign direct
Foreign Direct Investment in the United States 2013 Preliminary Data Organization for International Investment (OFII) Key Findings: Foreign Direct Investment in the United States, 2003-2013 1 Foreign direct
Division on Investment and Enterprise
 Division on Investment and Enterprise Readers are encouraged to use the data in this publication for non-commercial purposes, provided acknowledgement is explicitly given to UNCTAD, together with the reference
Actuarial Supply & Demand. By i.e. muhanna. i.e. muhanna Page 1 of
 By i.e. muhanna i.e. muhanna Page 1 of 8 040506 Additional Perspectives Measuring actuarial supply and demand in terms of GDP is indeed a valid basis for setting the actuarial density of a country and
Capital Access Index 2006 Gauging Entrepreneurial Access to Capital
 Capital Access Index 2006 Gauging Entrepreneurial Access to Capital Max = 10 9.0 Hong Kong 8.5 8.0 7.5 7.0 6.5 6.0 5.5 5.0 4.5 40 Source: Milken Institute United Kingdom U.S. India China Brazil Russia
Executive Summary. The Transatlantic Economy Annual Survey of Jobs, Trade and Investment between the United States and Europe
 The Transatlantic Economy 2011 Annual Survey of Jobs, Trade and Investment between the United States and Europe Daniel S. Hamilton Daniel S. Hamilton and Joseph P. Quinlan and Joseph P. Quinlan Center
GLOBAL FDI OUTFLOWS CONTINUED TO RISE IN 2011 DESPITE ECONOMIC UNCERTAINTIES; HOWEVER PROSPECTS REMAIN GUARDED HIGHLIGHTS
 GLOBAL FDI OUTFLOWS CONTINUED TO RISE IN 211 DESPITE ECONOMIC UNCERTAINTIES; HOWEVER PROSPECTS REMAIN GUARDED No. 9 12 April 212 ADVANCE UNEDITED COPY HIGHLIGHTS Global foreign direct investment (FDI)
Talent in Insurance 2015 The Netherlands in Focus. UK Financial Services Insight
 Talent in Insurance 2015 The Netherlands in Focus UK Financial Services Insight Report contents The Netherlands in Focus Key findings Macroeconomic and industry context Survey findings 2 Key findings 3
World Investment Report 2013
 Twenty-Sixth Meeting of the IMF Committee on Balance of Payments Statistics Muscat, Oman October 28 30, 2013 BOPCOM 13/25 World Investment Report 2013 Prepared by the UNCTAD WORLD INVESTMENT REPORT 2013
International Statistical Release
 International Statistical Release This release and additional tables of international statistics are available on efama s website (www.efama.org). Worldwide Investment Fund Assets and Flows Trends in the
A short history of debt
 A short history of debt In the words of the late Charles Kindleberger, debt/financial crises are a hardy perennial we have been here many times before. Over the past decade and a half the ratio of global
Methodology Calculating the insurance gap
 Methodology Calculating the insurance gap Insurance penetration Methodology 3 Insurance Insurance Penetration Rank Rank Rank penetration penetration difference 2018 2012 change 2018 report 2012 report
Global FDI Inflows. Global foreign direct investment (FDI) flows fell by 23 % to $1.43 trillion.
 flows fell by 23 % to $1.43 trillion.") Global FDI Inflows Distribution of Global FDI Inflows 1,92 1,87 -%23 Global foreign direct investment (FDI) flows fell by 23 % to $1.43 trillion. 1,18 1,37 1,57 1,57 1,43 1,34 1,43 This is in contrast
Global FDI Inflows Distribution of Global FDI Inflows 1,92 1,87 -%23 Global foreign direct investment (FDI) flows fell by 23 % to $1.43 trillion. 1,18 1,37 1,57 1,57 1,43 1,34 1,43 This is in contrast
Chile: Business Environment and Investment Opportunities
 Chile: Business Environment and Investment Opportunities Guest Speaker 14:00 15:00 GUEST SPEAKER Martin Pathan Investment Officer Foreign Investment Committee Chile: business environment and investment
Empirical Trade Analysis 1-1
 Empirical Trade Analysis?? 1-1 Dierk Herzer?? 1-2 Introduction This course examines empirical research methods on topics related to international trade and investment. We review the empirics of international
Foreign Direct Investment in the United States. Organization for International Investment
 Foreign Direct Investment in the United States Organization for International Investment March 16, 2011 FOREIGN DIRECT INVESTMENT IN THE UNITED STATES Key Findings Foreign Direct Investment in the United
Corrigendum. OECD Pensions Outlook 2012 DOI: ISBN (print) ISBN (PDF) OECD 2012
 ISBN (PDF) OECD 2012") OECD Pensions Outlook 2012 DOI: http://dx.doi.org/9789264169401-en ISBN 978-92-64-16939-5 (print) ISBN 978-92-64-16940-1 (PDF) OECD 2012 Corrigendum Page 21: Figure 1.1. Average annual real net investment
OECD Pensions Outlook 2012 DOI: http://dx.doi.org/9789264169401-en ISBN 978-92-64-16939-5 (print) ISBN 978-92-64-16940-1 (PDF) OECD 2012 Corrigendum Page 21: Figure 1.1. Average annual real net investment
Financial wealth of private households worldwide
 Economic Research Financial wealth of private households worldwide Munich, October 217 Recovery in turbulent times Assets and liabilities of private households worldwide in EUR trillion and annualrate
No October 2013
 DEVELOPING AND TRANSITION ECONOMIES ABSORBED MORE THAN 60 PER CENT OF GLOBAL FDI INFLOWS A RECORD SHARE IN THE FIRST HALF OF 2013 EMBARGO The content of this Monitor must not be quoted or summarized in
Technological transformation and payment systems
 Technological transformation and payment systems Lorenza Martínez Trigueros, June 2016 Summary 1 Innovation: existing versus disruptive networks 2 Innovation brings new participants and services... 3 and
Is Economic Growth Good for Investors? Jay R. Ritter University of Florida
 Is Economic Growth Good for Investors? Jay R. Ritter University of Florida What (modern day) country had the highest per capita income, in the following years? 1500 1650 1800 1870 1900 1920 It is widely
Global Construction 2030 Expo EDIFICA 2017 Santiago Chile. 4-6 October 2017
 Global Construction 2030 Expo EDIFICA 2017 Santiago Chile 4-6 October 2017 Graham Robinson Global Construction Perspectives Global Construction 2030 is the fourth in a series of global studies of the construction
Reporting practices for domestic and total debt securities
 Last updated: 27 November 2017 Reporting practices for domestic and total debt securities While the BIS debt securities statistics are in principle harmonised with the recommendations in the Handbook on
Global growth weakening as some risks materialise
 OECD INTERIM ECONOMIC OUTLOOK Global growth weakening as some risks materialise 6 March 2019 Laurence Boone OECD Chief Economist http://www.oecd.org/eco/outlook/economic-outlook/ ECOSCOPE blog: oecdecoscope.wordpress.com
RECENT EVOLUTION AND OUTLOOK OF THE MEXICAN ECONOMY BANCO DE MÉXICO OCTOBER 2003
 OCTOBER 23 RECENT EVOLUTION AND OUTLOOK OF THE MEXICAN ECONOMY BANCO DE MÉXICO 2 RECENT DEVELOPMENTS OUTLOOK MEDIUM-TERM CHALLENGES 3 RECENT DEVELOPMENTS In tandem with the global economic cycle, the Mexican
Hamid Rashid, Ph.D. Chief Global Economic Monitoring Unit Development Policy Analysis Division UNDESA, New York
 Hamid Rashid, Ph.D. Chief Global Economic Monitoring Unit Development Policy Analysis Division UNDESA, New York 1 Global macroeconomic trends Major headwinds Risks and uncertainties Policy questions and
San Francisco Retiree Health Care Trust Fund Education Materials on Public Equity
 M E K E T A I N V E S T M E N T G R O U P 5796 ARMADA DRIVE SUITE 110 CARLSBAD CA 92008 760 795 3450 fax 760 795 3445 www.meketagroup.com The Global Equity Opportunity Set MSCI All Country World 1 Index
Progress towards Strong, Sustainable and Balanced Growth. Figure 1: Recovery from Financial Crisis (100 = First Quarter of Real GDP Contraction)
") Progress towards Strong, Sustainable and Balanced Growth Figure 1: Recovery from Financial Crisis (100 = First Quarter of Real GDP Contraction) Source: OECD May 2014 Forecast, Haver Analytics, Rogoff and
Progress towards Strong, Sustainable and Balanced Growth Figure 1: Recovery from Financial Crisis (100 = First Quarter of Real GDP Contraction) Source: OECD May 2014 Forecast, Haver Analytics, Rogoff and
Developing Housing Finance Systems
 Developing Housing Finance Systems Veronica Cacdac Warnock IIMB-IMF Conference on Housing Markets, Financial Stability and Growth December 11, 2014 Based on Warnock V and Warnock F (2012). Developing Housing
Frequently Asked Questions Transparency International 2008 Bribe Payers Index
 Frequently Asked Questions Transparency International 1. What is the Transparency International (BPI)? 2. Which countries are included in the 2008 BPI? 3. How is the 2008 BPI calculated? 4. Whose views
2013 Global Survey of Accounting Assumptions. for Defined Benefit Plans. Executive Summary
 2013 Global Survey of Accounting Assumptions for Defined Benefit Plans Executive Summary Executive Summary In broad terms, accounting standards aim to enable employers to approximate the cost of an employee
International Statistical Release
 International Statistical Release This release and additional tables of international statistics are available on efama s website (www.efama.org) Worldwide Investment Fund Assets and Flows Trends in the
UPDATE ON FISCAL STIMULUS AND FINANCIAL SECTOR MEASURES. April 26, 2009
 UPDATE ON FISCAL STIMULUS AND FINANCIAL SECTOR MEASURES April 26, 2009 This note provides an update of information in the paper, The State of Public Finances: Outlook and Medium-Term Policies After the
UK Trade in Numbers. February 2019
 UK Trade in Numbers February 2019 Disclaimer The figures used in this pocketbook are the latest at the time of publication. We include figures from monthly and quarterly publications, such as ONS Balance
Social Security Benefits Around the World,
 Social Security Benefits Around the World, 197-2 Prepared by The Population Reference Bureau for the NIA P-3 Coordinating Center at the Michigan Center on the Demography of Aging, University of Michigan
Sovereign Development Funds and the Shifting Wealth of Nations
 Sovereign Development Funds and the Shifting Wealth of Nations Salzburg Global Seminar Javier Santiso Director and Chief Economist 27 September Salzburg, Austria A fundamental shift Emerging economies
Where did the Wealth go? - After twenty years of WTO: only 26 countries are beneficiaries of globalization
 Where did the Wealth go? - After twenty years of WTO: only 26 countries are beneficiaries of globalization Basel, Switzerland April 2015 www.commons.ch 1 Only 26 out of 173 countries benefit 173 Countries
India s Bilateral Trade in Services: Patterns, Determinants and Role of Trade in Goods
 India s Bilateral Trade in Services: Patterns, Determinants and Role of Trade in Goods Seema Sangita NCAER Mid Year Review November 1, 2014 Objectives The patterns of India s bilateral trade in services.
A new design for the corporate income tax?
 A new design for the corporate income tax? Michael Devereux Paris, October 17, 2013 Three issues 1. Why tax corporate profit, and what economic problems arise in attempting to do so? 2. Defining the domestic
EQUITY REPORTING & WITHHOLDING. Updated May 2016
 EQUITY REPORTING & WITHHOLDING Updated May 2016 When you exercise stock options or have RSUs lapse, there may be tax implications in any country in which you worked for P&G during the period from the
Charting Brunei s Economy
 Charting Brunei s Economy Designed to help executives catch up with the economy and incorporate macro impacts into company s planning. Annual subscription includes 2 semiannual issues published in June
Lecture 13 International Trade: Economics 181 Foreign Direct Investment (FDI) and Multinational Corporations (MNCs)
 and Multinational Corporations (MNCs)") Lecture 13 International Trade: Economics 181 Foreign Direct Investment (FDI) and Multinational Corporations (MNCs) REMEMBER: Midterm NEXT TUESDAY. Office hours next week: Monday, 12 to 2 for Ann Harrison
Lecture 13 International Trade: Economics 181 Foreign Direct Investment (FDI) and Multinational Corporations (MNCs) REMEMBER: Midterm NEXT TUESDAY. Office hours next week: Monday, 12 to 2 for Ann Harrison
Two tales of development
 Two tales of development BRAZIL-INDIA 17 Liliana Lavoratti, Rio de Janeiro India is still almost unknown to Brazilians in general. Given the distance not only geographically as well as quite different
The Global Aging Preparedness Index
 The Global Aging Preparedness Index 2 nd Edition Richard Jackson Senior Associate Center for Strategic & International Studies International Longevity Centre Roundtable May 6, 2014 London GAPINDEX.CSIS.ORG
Internet Appendix: Government Debt and Corporate Leverage: International Evidence
 Internet Appendix: Government Debt and Corporate Leverage: International Evidence Irem Demirci, Jennifer Huang, and Clemens Sialm September 3, 2018 1 Table A1: Variable Definitions This table details the
International Statistical Release
 International Statistical Release This release and additional tables of international statistics are available on efama s website (www.efama.org). Worldwide Investment Fund Assets and Flows Trends in the
Twenty-Third Meeting of the IMF Committee on Balance of Payments Statistics Washington, D.C. October 25-27, 2010
 BOPCOM-10/15 Twenty-Third Meeting of the IMF Committee on Balance of Payments Statistics Washington, D.C. October 25-27, 2010 Bilateral Cross-Border Holdings and Global Imbalances A View on the Eve of
FDI drops 18% in 2017 as corporate restructurings decline
 FDI IN FIGURES April 2018 FDI drops 18% in 2017 as corporate restructurings decline Global FDI flows decreased by 18% to USD 1 411 billion in 2017 compared to 2016. In the fourth quarter of 2017, FDI flows
Saudi Arabia at a Glance
 Invest Saudi Table of Contents Saudi Arabia at a Glance Saudi Arabia Economy Why Invest in Saudi? Key Incentives Available for Investors Strategic Sectors & Opportunities Investments We Value the Most
FDI linkages with innovation & technology-related benefits for SMEs
 FDI linkages with innovation & technology-related benefits for SMEs David Brown Chief Operating Officer WWW.CZECH-INVENT.ORG Beirut June 21 2011 CzechINVENT Mission Not-for profit technology agency established
Business Investment in the United States
 Business Investment in the United States Presenter s Name Presenter s Title Event Name Andrea Rosa Commercial Specialist Referente per SelectUSA in Italia Roadshow/Italy Date October 22-26, 2012 The U.S.
Foreign Direct Investment in the United States. Organization for International Investment
 Foreign Direct Investment in the United States Organization for International Investment March 14, 2012 FOREIGN DIRECT INVESTMENT IN THE UNITED STATES Key Findings Foreign Direct Investment in the United
2012 Canazei Winter Workshop on Inequality
 2012 Canazei Winter Workshop on Inequality Measuring the Global Distribution of Wealth Jim Davies 11 January 2012 Collaborators Susanna Sandström, Tony Shorrocks, Ed Wolff The world distribution of household
Stronger growth, but risks loom large
 OECD ECONOMIC OUTLOOK Stronger growth, but risks loom large Ángel Gurría OECD Secretary-General Álvaro S. Pereira OECD Chief Economist ad interim Paris, 3 May Global growth will be around 4% Investment
IMF-BAFT Trade Finance Survey
 IMF-BAFT Trade Finance Survey A Survey Among Banks Assessing the Current Trade Finance Environment Study Overview & Methodology There is general agreement that the ongoing global financial crisis has produced
Marine. Global Programmes. cunninghamlindsey.com. A Cunningham Lindsey service
 Marine Global Programmes A Cunningham Lindsey service Marine global presence Marine Global Programmes Cunningham Lindsey approach Managing your needs With 160 marine surveyors and claims managers in 36
STATISTICS Last update: 03/07/2017
 STATISTICS 2012-2016 Last update: 03/07/2017 BU NEWS BUSINESS [USD, BILLIONS] New business by year, vs. total world exports 3,000 2,500 2,000 1,500 1,000 500 12,131 1,138 40 127 971 14,023 1,323 53 143
Foreign Direct Investment in the United States 2018
 Foreign Direct Investment in the United States 2018 Overview Foreign direct investment in the United States, known as FDIUS, surpassed $4 trillion at the end of on a historical-cost basis. Every year,
Understanding the Macroeconomic Scenario: Global Demand, Global Supply Chains
 Understanding the Macroeconomic Scenario: Global Demand, Global Supply Chains 12 June 2014 Fabio Sdogati, fabio.sdogati@polimi.it Table of Contents 1. Economic Scenario after the Great Recession 2. Structural
Foreign Exchange Reserves in India
 Year (as at end- SDRs## Foreign Exchange Reserves in India (1950-1951 to 2013-2014) Gold* Foreign Currency Assets* Rs. In Reserve Tranche Position (RTP) Total Reserve 1983-84 248 230 226 320 5,498 5,099
Globalization, Inequality, and Tax Justice
 Globalization, Inequality, and Tax Justice Gabriel Zucman (UC Berkeley) November 2017 How can we make globalization and tax justice compatible? One of the most pressing policy questions of our time: Globalization
DIVERSIFICATION. Diversification
 Diversification Helps you capture what global markets offer Reduces risks that have no expected return May prevent you from missing opportunity Smooths out some of the bumps Helps take the guesswork out
EXECUTIVE SUMMARY PRIVATE PENSIONS OUTLOOK 2008 ISBN
 EXECUTIVE SUMMARY PRIVATE PENSIONS OUTLOOK 2008 ISBN 978-92-64-04438-8 In 1998, the OECD published Maintaining Prosperity in an Ageing Society in which it warned governments that the main demographic changes
INTERIM MANAGEMENT STATEMENT QUARTER ENDED 31 MARCH 2012
 INTERIM MANAGEMENT STATEMENT QUARTER ENDED 31 MARCH 2012 12 April 2012 Financial summary Growth in net fees for the quarter ended 31 March 2012 (Q3) (versus the same period last year) Actual Growth LFL*
Doing Business: Getting Credit and APEC
 2010/SOM3/EC/SEM/003 Session 1 Doing Business: Getting Credit and APEC Submitted by: World Bank Seminar on Getting Credit for Small and Medium Enterprises Sendai, Japan 21 September 2010 Doing Business:
Appendix 1. Outline of BOP-Related Statistics and Release Schedule. The following is an overview of major BOP-related statistics.
 Appendix 1. Outline of BOP-Related Statistics and Release Schedule Outline of BOP-related statistics BOP-related statistics can be broadly divided into (1) flow data on various transactions and the associated
India s International Trade & Investment
 India s International Trade & Investment July 2017 1 Structure of Presentation 1 Indian Economy: A Snapshot 2 Merchandise Trade: A Perspective 3 Services Trade: Recent Trends 4 India s Investment Flows
International Statistical Release
 International Statistical Release This release and additional tables of international statistics are available on efama s website (www.efama.org) Worldwide Investment Fund Assets and Flows Trends in the
Foreign Investment Statistics
 2012-2013 Released Date: May 2015 Table of Contents Introduction....4 Key Points......5 Total Stock of Foreign Investment (FI) by Economic Activity....6 Foreign Direct Investment (FDI) by Economic Activity.......8
DFA Global Equity Portfolio (Class F) Quarterly Performance Report Q2 2014
 Quarterly Performance Report Q2 2014") DFA Global Equity Portfolio (Class F) Quarterly Performance Report Q2 2014 This presentation has been prepared by Dimensional Fund Advisors Canada ULC ( DFA Canada ), manager of the Dimensional Funds.
DFA Global Equity Portfolio (Class F) Quarterly Performance Report Q2 2014 This presentation has been prepared by Dimensional Fund Advisors Canada ULC ( DFA Canada ), manager of the Dimensional Funds.
An Overview of World Goods and Services Trade
 Appendix IV An Overview of World Goods and Services Trade An overview of the size and composition of U.S. and world trade is useful to provide perspective for the large U.S. trade and current account deficits
Intraday Liquidity Monitoring Solution
 Treasury and Trade Solutions Global Clearing & FI Payments Citi Academy for Financial Institutions July 2015 Intraday Liquidity Monitoring Solution Carolina Caballero Intraday Liquidity Product Manager
Charting Myanmar s Economy
 Charting Myanmar s Economy Designed to help executives catch up with the economy and incorporate macro impacts into company s planning. Annual subscription includes 2 semiannual issues published in June
Global Consumer Confidence
 Global Consumer Confidence The Conference Board Global Consumer Confidence Survey is conducted in collaboration with Nielsen 4TH QUARTER 2017 RESULTS CONTENTS Global Highlights Asia-Pacific Africa and
EUROPEAN UNION SOUTH KOREA TRADE AND INVESTMENT 5 TH ANNIVERSARY OF THE FTA. Delegation of the European Union to the Republic of Korea
 EUROPEAN UNION SOUTH KOREA TRADE AND INVESTMENT 5 TH ANNIVERSARY OF THE FTA 2016 Delegation of the European Union to the Republic of Korea 16 th Floor, S-tower, 82 Saemunan-ro, Jongno-gu, Seoul, Korea
International Statistical Release
 International Statistical Release This release and additional tables of international statistics are available on efama s website (www.efama.org). Worldwide Regulated Open-ended Fund Assets and Flows Trends
New in 2013: Greater emphasis on capital flows Refinements to EBA methodology Individual country assessments
 As in 212: Stock-take: multilaterally consistent assessment of external sector policies of the largest economies Feeds into Article IVs Draws on External Balance Assessment (EBA) methodology/other Identifies
Chapter 3 Emergence of new sources for growth Section 1 Rise of the services industry and expansion of services trade
 Chapter 3 Emergence of new sources for growth Key points of Part I, Chapter 3 While goods trade has slowed down around the world, services trade is steadily growing. The size of the global market is 1.2
Table 1: Foreign exchange turnover: Summary of surveys Billions of U.S. dollars. Number of business days
 Table 1: Foreign exchange turnover: Summary of surveys Billions of U.S. dollars Total turnover Number of business days Average daily turnover change 1983 103.2 20 5.2 1986 191.2 20 9.6 84.6 1989 299.9
DFA Global Equity Portfolio (Class F) Performance Report Q2 2017
 Performance Report Q2 2017") DFA Global Equity Portfolio (Class F) Performance Report Q2 2017 This presentation has been prepared by Dimensional Fund Advisors Canada ULC ( DFA Canada ), manager of the Dimensional Funds. This presentation
DFA Global Equity Portfolio (Class F) Performance Report Q2 2017 This presentation has been prepared by Dimensional Fund Advisors Canada ULC ( DFA Canada ), manager of the Dimensional Funds. This presentation
DFA Global Equity Portfolio (Class F) Performance Report Q3 2018
 Performance Report Q3 2018") DFA Global Equity Portfolio (Class F) Performance Report Q3 2018 This presentation has been prepared by Dimensional Fund Advisors Canada ULC ( DFA Canada ), manager of the Dimensional Funds. This presentation
DFA Global Equity Portfolio (Class F) Performance Report Q3 2018 This presentation has been prepared by Dimensional Fund Advisors Canada ULC ( DFA Canada ), manager of the Dimensional Funds. This presentation
DFA Global Equity Portfolio (Class F) Performance Report Q4 2017
 Performance Report Q4 2017") DFA Global Equity Portfolio (Class F) Performance Report Q4 2017 This presentation has been prepared by Dimensional Fund Advisors Canada ULC ( DFA Canada ), manager of the Dimensional Funds. This presentation
DFA Global Equity Portfolio (Class F) Performance Report Q4 2017 This presentation has been prepared by Dimensional Fund Advisors Canada ULC ( DFA Canada ), manager of the Dimensional Funds. This presentation
Focus on: Hong Kong. International Business Report 2011 Economy focus series
 Focus on: Hong Kong International Business Report 11 Economy focus series The recovery The economy rebounded strongly in, posting growth of 6.8 per cent as recovering global demand boosted exports. Prospects
By Philippe Guinaudeau June 2008
 By Philippe Guinaudeau June 2008 Content What happened in the world of NPD Toy Markets in the World Top 10 Countries Evaluating the future Summary 2 Australia, Austria, Belgium, France, Germany, Italy,
!!!1!!!!!!!!!!!!!!!!!!!!!!!!!!!!! The Association of Real Estate Funds & Property Funds Research
 1 The Association of Real Estate Funds & Property Funds Research Global Real Estate Funds Review H1 216 Contents CONTENTS 2 EXECUTIVE SUMMARY 3 UNLISTED FUND UNIVERSE: OVERVIEW (EX FOF) 6 UNLISTED FUNDS
Quarterly Investment Update First Quarter 2017
 Quarterly Investment Update First Quarter 2017 Market Update: A Quarter in Review March 31, 2017 CANADIAN STOCKS INTERNATIONAL STOCKS Large Cap Small Cap Growth Value Large Cap Small Cap Growth Value Emerging
Second Quarter Trading Update 9 July 2010
 Second Quarter Trading Update 9 July 2010 Michael Page International Second Quarter Trading Update 2010 2 Group gross profit Constant Group gross profit m m Reported exchange 2010 vs 2009 111.5 83.8 +33.1%
Summary of key findings
 1 VAT/GST treatment of cross-border services: 2017 survey Supplies of e-services to consumers (B2C) (see footnote 1) Supplies of e-services to businesses (B2B) 1(a). Is a non-resident 1(b). If there is
DFA Global Equity Portfolio (Class F) Performance Report Q3 2015
 Performance Report Q3 2015") DFA Global Equity Portfolio (Class F) Performance Report Q3 2015 This presentation has been prepared by Dimensional Fund Advisors Canada ULC ( DFA Canada ), manager of the Dimensional Funds. This presentation
DFA Global Equity Portfolio (Class F) Performance Report Q3 2015 This presentation has been prepared by Dimensional Fund Advisors Canada ULC ( DFA Canada ), manager of the Dimensional Funds. This presentation
Doing Business 2011 Paying Taxes
 Doing Business 011 Paying Taxes Marcin Piątkowski Senior Economist Warsaw, Poland November, 010 1 Paying Taxes as part of a broader project The Doing Business project measures business regulations taking
Travel Insurance and Assistance
 Travel Insurance and Assistance Worldwide research covering over 40 countries Series Prospectus Finaccord 1 Prospectus contents Page What is the research? Which countries are covered What methodology has
This article is on Capital Adequacy Ratio and Basel Accord. It contains concepts like -
 This article is on Capital Adequacy Ratio and Basel Accord It contains concepts like - Capital Adequacy Capital Adequacy Ratio (CAR) Benefits of CAR Basel Accord Origin Basel Accords I, II, III Expected
Global Business Barometer April 2008
 Global Business Barometer April 2008 The Global Business Barometer is a quarterly business-confidence index, conducted for The Economist by the Economist Intelligence Unit What are your expectations of
BIS International Locational Banking Statistics and International Consolidated Banking Statistics in Japan (end-june 2018)
") FOR RELEASE 8:5 A.M. September 14, 218 BIS International Locational Banking Statistics and International Consolidated Banking Statistics in Japan (end-june 218) I. BIS International Locational Banking
FOR RELEASE 8:5 A.M. September 14, 218 BIS International Locational Banking Statistics and International Consolidated Banking Statistics in Japan (end-june 218) I. BIS International Locational Banking
2018 Global Survey of Accounting Assumptions. for Defined Benefit Plans. Executive summary
 2018 Global Survey of Accounting Assumptions for Defined Benefit Plans Executive summary Executive summary In broad terms, accounting standards aim to enable employers to approximate the cost of an employee
International Statistical Release
 International Statistical Release This release and additional tables of international statistics are available on efama s website (www.efama.org) Worldwide Investment Fund Assets and Flows Trends in the
Quarterly Investment Update First Quarter 2018
 Quarterly Investment Update First Quarter 2018 Dimensional Fund Advisors Canada ULC ( DFA Canada ) is not affiliated with [insert name of Advisor]. DFA Canada is a separate and distinct company. Market