suri.chartsimulator (Daily)
|
|
|
- Beryl Lyons
- 6 years ago
- Views:
Transcription
1 suri.chartsimulator (Daily) TradeStation Simulate/Pause/Forward/Back All Symbols, Daily Charts Any Indicators, ShowMes, Paint Bars and Strategies Bar and Candlestick Chart Styles Main and Sub-graph indicators User Adjustable Speed Settings Customizable Date Ranges Cross Hair Functionality for DataView TS 9.+ OOEL compatible Version 1.0 surinotes.com
2 Legal Notices and Disclaimer Chart Simulation (Daily) in TradeStation, 2015 ALL RIGHTS RESERVED No part of this document may be reproduced or transmitted without a written consent of the surinotes.com or Suri Duddella. This document relies on sources and information reasonably believed to be accurate, but neither the author nor publisher guarantees accuracy or completeness. Trading is risky. You are 100% responsible for your own trading. surinotes.com or Suri Duddella, specifically disclaims any and all express and implied warranties. Your trades may entail substantial loss. Nothing in this document should be construed as a recommendation to buy or sell any security or other instrument, or a determination that any trade is suitable for you. The examples in this document could be considered hypothetical trades. The CFTC warns that: HYPOTHETICAL PERFORMANCE RESULTS HAVE MANY INHERENT LIMITATIONS, SOME OF WHICH ARE DESCRIBED BELOW. NO REPRESENTATION IS BEING MADE THAT ANY ACCOUNT WILL OR ISLIKELY TO ACHIEVE PROFITS OR LOSSES SIMILAR TO THOSE SHOWN. IN FACT, THERE ARE FREQUENTLY SHARP DIFFERENCES BETWEEN HYPOTHETICAL PERFORMANCE RESULTS AND THE ACTUAL RESULTS SUBSEQUENTLY ACHIEVED BY ANY PARTICULAR TRADING PROGRAM. ONE OF THE LIMITATIONS OF HYPOTHETICAL PERFORMANCE RESULTS IS THAT THEY ARE GENERALLY PREPARED WITH THE BENEFIT OF HINDSIGHT. IN ADDITION, HYPOTHETICAL TRADING DOES NOT INVOLVE FINANCIAL RISK, AND NO HYPOTHETICAL TRADING RECORD CAN COMPLETELY ACCOUNT FOR THE IMPACT OF FINANCIAL RISK IN ACTUAL TRADING. FOR EXAMPLE, THE ABILITY TO WITHSTAND LOSSES OR TO ADHERE TO A PARTICULAR TRADING PROGRAM IN SPITE OF TRADING LOSSES ARE MATERIAL POINTS WHICH CAN ALSO ADVERSELY AFFECT ACTUAL TRADING RESULTS. THERE ARE NUMEROUS OTHER FACTORS RELATED TO THE MARKETS IN GENERAL OR TO THE IMPLEMENTATION OF ANY SPECIFIC TRADING PROGRAM WHICH CANNOT BE FULLY ACCOUNTED FOR IN THE PREPARATION OF HYPOTHETICAL PERFORMANCE RESULTS AND ALL OF WHICH CAN ADVERSELY AFFECT ACTUAL TRADING RESULTS. COPYRIGHT 2015 surinotes.com Charts are created by TradeStation Software from TradeStation Securities. Printed in the United States of America
3 Chart Simulation Introduction Education is one of the key elements for successful trading. Practicing and reading charts may lead to perfecting the art of trading. Traders can hone their entry, exit strategies and get familiar with its nuances. Simulation software is used to build confidence and tweak their trading models for optimal outcome. Trading simulator shortens a traders learning experience in the markets. Traders learn many nuances in simulation mode of trade execution which may not be visible in building a trading theory or models. Trading models or trading systems are built on a set of rules with specific trade execution methods. To achieve the successful trading results traders spend thousands of hours to find key opportunities and optimal setups. Execution of their trade setups and results can be only realized through live trading. Unfortunately, this method could be very expensive to learn the nuances and errors in their models. An alternative way is to simulate their trading models, practice and learn their nuances. Chart Simulation for TradeStation software will show bar by bar simulation in an intuitive way to simulate and learn trading any market instrument in daily time-frame with any user built indicators in user selected speed. Chart Simulation software allows users to enter any symbol, (daily timeframe) in to a clean TS Chart along with user built Indicators to simulate the data in Bar charts, Candle stick charts. User controls to pause, play bars backward/forward, control speed and re-wind the chart features are added. You can also load multiple indicators in a chart or in sub-graphs with adjustable settings. Third-party data of daily time-frame can be also simulated. Learn Key Trading Methods Learn Key Indicator usage and its nuances Reduce the learning time Educate Indicators or Trade Setups Find Best and Optimal Trade Setups
4 Installation Installation suri.chartsimulator is available from TradeStation Appstore. Subscribe to suri.chartsimulator indicator from TradeStation AppStore and follow installation instructions. Once the indicator is subscribed, you can insert suri.chartsimulator in any TradeStation Chart (Daily Time Frame).
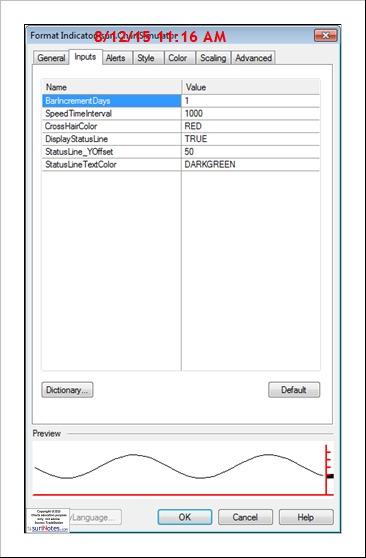
5 Simulation Settings
6 Simulation Settings Parameter Usage BarIncrementDays: 1 Sets Bar Increment Days Speed Interval: 1000 Sets Speed Interval (1000msec =1 sec) to use for Speed CrossHair Color: RED Cross Hair shows Current Date and OHLC prices. Set Cross Hair Color Display Status Line: TRUE/FALSE Displays Status Line on Chart with Symbol, Date/Time, OHLC Values StatusLine_YOffset: 50 Status line Y-Offset in Pixels from the Top StatusLine Text Color: DARKGREEN Set StatusLine in Color Status Line
 4. Insert suri.chartsimulator Indicator 5.")
7 Chart Simulation Chart Preparation 1. Open a Chart of any instrument and DAILY time-frame. 2. Select Bar Style (Bar Charts or CandleStocks) 3. Load plenty of data (at least twice of your Simulation Bars and Indicators) 4. Insert suri.chartsimulator Indicator 5. Format indicator to set Chart Style and Number of Bars to load And colors/thickness etc. 6. Make sure RunCommand (from General Tab) is CHECKED with confirmation OFF (See the Image)

8 Enable Run Command Enable RunCommand keyword: Set With Confirmation is OFF and set it this setup as Default.

9 While opening suri.chartsimulator Workspace, you may need to enable to confirm Open Windows with Items Enabled

10 Chart Simulation You should see the following chart. Make sure you have enough data loaded on the chart.
11 Chart Simulation Notes: 1. To add an indicator in the middle of simulation, the best practice is to add indicator and start again. 2. You must load plenty of data on the chart to see the simulation and its indicators replay.
12 Chart Simulation Controls Button Description Back5 Back 1 Pause Play Forw 1 Forw 5 Reset Jump 5 bars back Jump 1 bar back Pauses the chart. Play Move forward 1 bar Move forward 5 bars Reset Buttons Speed** Select Playback Speed from 1 to 10, 1 = Fast, 10 = Slow ** Playback speed interval is determined by 1000/speed. You can set 1 = Fast, 10 = Slow
13 ChartSimulator Controls Chart simulator has following controls 1. When a chart is first loaded, [From Date] shows the date the currently chart is loaded from. Select a [From Date] where you want chart to simulate. 2. The SIMULATE button will simulate the data immediately. 3. You can use Chart Control buttons like PLAY, Pause, Back, Forward buttons to play simulate the chart. 4. Select a SPEED (1=FAST and 10=Slow) to control the chart refresh rate. You can also use Large RED Pause button or GREEN play buttons to Pause/Play the chart at the given speed.
14 INDICATOR Examples

15 Adding Indicators to Charts To add an indicator to a DAILY chart, Open a chart and insert your customized or TS supplied indicator. You can indicators in Sub-Graphs or main chart on the Chart Simulator. When you are simulating the chart, it will show indicators corresponding to that date in main graph or sub-graphs.

16 Adding Indicators in Sub-Graph Chart SIM with sub-graph Indicator

17 Adding PaintBars

18 Adding Cross Hair To add Cross Hair (shows current bar Date, Open, High, Low and Close

19 Strategy Simulation
20 MARKET CONTEXT Market Context Most technical traders use chart analysis with market context concepts to trade. Market context concept is described as how current price is reacting to certain levels (pivots, support and resistance) and how indicators are performing relative to historic price conditions (like oversold, overbought) and where/how patterns are developing in current time-frame or multiple-time frames etc. Each trader develops his own market context to trade. One of the elegant ways to define market context is through a Fib. Grid structure. Fib. Grid consists of Fib. Bands (showing price reaction, trends), Pivot levels (to show historic Support/Resistance areas) and Market Structures (to show potential turning points). All these patterns are well explained in my book with clear examples. On any trading chart, Fib. Grid layout is plotted to understand how current price is reacting to the Fib. bands and if the price is exhausted, and price trading above/below the extreme bands and how the price is reacting to the support and resistance levels defined by Pivots etc. A Market structure (MSH/MSL) algorithm is used to confirm if the recent pivot high/low is a key pivotal Market Structure to assist ABC formation. Confluence of these levels in the Fib. Grid structure along with emerging pattern structure (and pattern target/stop levels) helps a trader make a clear trade decision. Pattern trading is very precise as each pattern has specific rules to enter/stop and targets. When combined Pattern analysis with market context gives a great edge to trade. Patterns also fail but their failure levels are well defined and that information is clearly known prior to the trade. Hence, pattern trading has much more advantage than trading other trading methods. Here is a Market Context chart to show the Fib. Grid structures, Pivot formations (Floor, Globex, Opening Range, Fib. Zone) and Market Structures. The other surinotes software like Harmonic Pattern identification methods (i.e., Gartleys, all X5 patterns ) also use Market Context in real-time to identify key trading opportunities. These patterns also automatically plot Entry/Stops and Target levels without any delays to give potential trade opportunities.
21 surinotes.com s products CHART PATTERNS Auto ABC Patterns Description Auto ABC patterns for all instruments, RT/EOD Auto Gartley/Butterfly Head and Shoulders Cup and Handles Channels, Flags, Triangles Market Structures 2B Top/Bottom Patterns Triangle Patterns Gartley, All X5 Patterns in RT/EOD H&S, Inv. H&S Patterns in RT/EOD, All instruments Cup and Handle Patterns in RT/EOD. Channels, Flags, Triangle Patterns in RT/EOD Market Structures for all instruments/time-frames 2B Top/Bottom Patterns with Trade Info. Symmetric, Ascending and Desc. Triangles SUPPORT TOOLS Combined Market Internals SuperBars Fib. Zone Pivots Chart Simulator Volatility Zones Fib. Bands Description Market Internals Indicators Market Trend PaintBars Fib. Zone pivots for Intraday Trading Chart Simulator Detects Intraday Volatilty Zones Plots Fibonacci Bands
22 surinotes.com Intelligent Trading Innovation Suri Duddella ( demicron ) surinotes@gmail.com
suri.autocharts for TradeStation 9+, 10 surinotes.com
 suri.autocharts Auto Play of Symbols with Back/Forward/Pause with Delay Scrtachpad for Saving Symbol to a Text file. for TradeStation 9+, 10 Automatic Chart Loader Selectable Custom Lists Previous/Next
suri.ivrank for TradeStation 9.5 & 10 surinotes.com Version 2
 suri.ivrank Version 2 for TradeStation 9.5 & 10 surinotes.com 1 Suri.IVRank Manual 2016 ALL RIGHTS RESERVED No part of this document may be reproduced or transmitted without the express written consent
Dividend Status - Version 9.0
 Dividend Status - Version 9.0 Description: The Dividend Status (DS) ShowMe allows you to get information about upcoming dividends as well as historical data about prior dividend announcements. DS allows
Fintech $tocks. Chart Patterns & Algo. Trader. Trading Symmetric Triangle Patterns
 surinotes.com s Feb. 19, 2018 Chart Patterns & Algo. Trader Trading Symmetric Triangle Patterns A Weekly Publication Stocks/Futures/FX/Commodities Daily/Weekly/Monthly Analysis Auto Generated Chart Patterns/Analysis
5G Networks. Chart Patterns & Algo. Trader. Trading Rectangle Channel Patterns. Daily/Weekly/Monthly Analysis. Auto Generated Chart Patterns/Analysis
 surinotes.com s Feb. 05, 2018 Chart Patterns & Algo. Trader A Weekly Publication Trading Rectangle Channel Patterns Daily/Weekly/Monthly Analysis Auto Generated Chart Patterns/Analysis Algorithmic Trading
SALE. Travel & Airlines. Chart Patterns & Algo. Trader. Trading Cup & Handle Patterns BOOK + POSTER. surinotes.com s. Jan.
 surinotes.com s Jan. 08, 2018 Chart Patterns & Algo. Trader A Weekly Publication BOOK + POSTER SALE Trading Cup & Handle Patterns Travel & Airlines Chart Patterns & Algorithmic Trader 2018 ALL RIGHTS RESERVED
Chart Patterns & Algo. Trader
 surinotes.com s 1 Sep. 25, 2017 Chart Patterns & Algo. Trader A Weekly Magazine Stocks/Options/Futures Commodities/FX Daily/Weekly/Monthly Analysis Watchlists Auto Generated Chart Patterns/Analysis Algorithmic
Intraday Volume Change - Version 4.0
 Intraday Volume Change - Version 4.0 Description: The Intraday Volume Change (IVC) indicator for TradeStation lets you see how the current intraday volume compares to the same time period from prior days.
MTF Volatility Squeeze Version 4.0
 MTF Volatility Squeeze Version 4.0 Description: The Multiple Time Frame Volatility Squeeze (MTFVS) indicator shows when there is a reduction in volatility that usually means that consolidation is occurring.
FOREX PROFITABILITY CODE
 FOREX PROFITABILITY CODE Forex Secret Protocol Published by Old Tree Publishing CC Suite 509, Private Bag X503 Northway, 4065, KZN, ZA www.oldtreepublishing.com Copyright 2013 by Old Tree Publishing CC,
Chart Patterns & Algo. Trader
 surinotes.com s Dec. 04, 2017 Chart Patterns & Algo. Trader A Weekly Publication Trading Parabolic Arc Patterns Daily/Weekly/Monthly Analysis Auto Generated Chart Patterns/Analysis Algorithmic Trading
MTF Trend Version 4.0
 MTF Trend Version 4.0 Description: The Multiple Time Frame Trend (MTFT) indicator will aggregate multiple timeframes onto 1 chart. Up to 5 time frames can be shown (time frame 1=TF1, time frame 2 =TF2,
Intraday Multi-View Suite (IMV) For Stocks and Futures
 For Stocks and Futures") Intraday Multi-View Suite (IMV) For Stocks and Futures Release Notes Thank you for purchasing the PowerZone Trading IMV custom indicator suite for TradeStation. The following notes are intended to act
Intraday Multi-View Suite (IMV) For Stocks and Futures Release Notes Thank you for purchasing the PowerZone Trading IMV custom indicator suite for TradeStation. The following notes are intended to act
Chart Patterns & Algo. Trader
 surinotes.com s Jan. 15, 2018 Chart Patterns & Algo. Trader S : Bo &Pos A Weekly Publication Trading Megaphone Patterns Chart Patterns & Algorithmic Trader 2018 ALL RIGHTS RESERVED No part of this document
Enhanced Pivot Point Indicator for TradeStation
 1 Enhanced Pivot Point Indicator for TradeStation PZT POWER PIVOTS are used to display 14 key levels that are projected as a series of horizontal lines on the price chart along with accompanying text.
FOREX TREND SECRETS. New Science Of Forex Trading Published by Alaziac CC Suite 509, Private Bag X503 Northway, 4065, KZN, ZA
 FOREX TREND SECRETS New Science Of Forex Trading Published by Alaziac CC Suite 509, Private Bag X503 Northway, 4065, KZN, ZA www.alaziac.com Copyright 2013 by Alaziac CC, KZN, ZA Reproduction or translation
MTF Volatility Squeeze Version 6.0
 MTF Volatility Squeeze Version 6.0 Description: The Multiple Time Frame Volatility Squeeze (MTFVS) indicator shows when there is a reduction in volatility that usually means that consolidation is occurring.
SALE. Bank Stocks. Chart Patterns & Algo. Trader. Trading Confluence Chart Patterns HAPPY HOLIDAYS
 surinotes.com s Dec. 11, 2017 Chart Patterns & Algo. Trader Trading Confluence Chart Patterns A Weekly Publication HAPPY HOLIDAYS SALE Daily/Weekly/Monthly Analysis Auto Generated Chart Patterns/Analysis
Chart Patterns & Algo. Trader
 surinotes.com s Feb. 26, 2018 Chart Patterns & Algo. Trader Trading ABC Bearish Patterns A Weekly Publication Chart Patterns & Algorithmic Trader 2018 ALL RIGHTS RESERVED No part of this document may be
Before I address the harmonic patterns and harmonic ratios that exist in the market, I need to address the Fibonacci series and Fibonacci ratios.
 Full Trading Circle: The Complete Underground Trader System By Jea Yu Copyright 2010 by Jea Yu APPENDIX A HARMONIC PATTERN TRADING by Suri Duddella of Surinotes.com Financial markets exhibit the natural
ATR Trailing Stop - Version 7.0
 ATR Trailing Stop - Version 7.0 Description: The ATR Trailing Stop indicator allows you to see a user defined ATR Trailing Stop on your charts or in RadarScreen. The ATR Trailing Stop indicator can also
Find Elusive MACD Divergences Easily
 Find Elusive MACD Divergences Easily By using a Custom TradeStation Workspace After following these instructions, you will have Charts displaying MACD lines and histogram which highlight price/indicator
Presents. Trade Predator
 Presents RISK DISCLOSURE STATEMENT / DISCLAIMER AGREEMENT Trading any financial market involves risk. This report and all and any of its contents are neither a solicitation nor an offer to Buy/Sell any
RISK DISCLOSURE STATEMENT / DISCLAIMER AGREEMENT
 RISK DISCLOSURE STATEMENT / DISCLAIMER AGREEMENT Trading any financial market involves risk. This report and all and any of its contents are neither a solicitation nor an offer to Buy/Sell any financial
Earnings Release with History - Version 21.0
 Earnings Release with History - Version 21.0 Description: The Earnings Release with History set of indicators for Chart Analysis, RadarScreen, and the Scanner indicates when the next scheduled earnings
Next Earnings Release - Version 30.0
 Next Earnings Release - Version 30.0 Description: The Next Earnings Release (NER) ShowMe analysis technique for Chart Analysis and RadarScreen indicates when the next scheduled earnings release will be
Chart Patterns & Algo. Trader. Watchlists Auto Generated Chart Patterns/Analysis
 surinotes.com s Dec. 18, 2017 Chart Patterns & Algo. Trader A Weekly Publication HAPPY HOLIDAYS SALE Trading Dragon Chart Patterns Stocks/Options/Futures Commodities/FX Daily/Weekly/Monthly Analysis Watchlists
Presents FOREX ALPHA CODE
 Presents FOREX ALPHA CODE Forex Alpha Code Published by Alaziac Trading CC Suite 509, Private Bag X503 Northway, 4065, KZN, ZA www.tradeology.com Copyright 2014 by Alaziac Trading CC, KZN, ZA Reproduction
Trading Forex Using High Probability Pattern Trade
 Presents Trading Forex Using High Probability Pattern Trade Trading Forex Using High Probability Pattern Trade Published by Alzaiak Trading CC Nominee Old Tree Publishing CC Suite 509, Private Bag X503
Adaptive Oscillator for TradeStation
 1 Adaptive Oscillator for TradeStation PZT PROOF is an adaptive oscillator based on a statistical range of price action. Similar to a stochastic indicator, it creates values by comparing the distance between
Forex Trend Directive
 FOREX GEMINI CODE Presents Forex Trend Directive Forex Gemini Code Published by Alaziac Trading CC Suite 509, Private Bag X503 Northway, 4065, KZN, ZA www.forexgeminicode.com Copyright 2014 by Alaziac
The strategy has an average holding period of 4 days and trades times a year on average.
 Introduction Diversity TF is a price pattern based swing trading system for the Emini Russell 2000 futures contract. The system uses multiple price patterns hence the name "Diversity". The strategy trades
FOREX GEMINI CODE. Presents. Dynamic Triple Edge
 FOREX GEMINI CODE Presents Forex Gemini Code Published by Alaziac Trading CC Suite 509, Private Bag X503 Northway, 4065, KZN, ZA www.forexgeminicode.com Copyright 2014 by Alaziac Trading CC, KZN, ZA Reproduction
Forex Renko Charts FX Trading System
 Forex Renko Charts FX Trading System Disclaimer FOREX trading, online foreign exchange trading, foreign currency trading and Forex options trading involves risk of loss and is not appropriate for all investors.
Stacked Moving Averages - Version 4.0
 Stacked Moving Averages - Version 4.0 Description: The Stacked Moving Averages indicator allows you to quickly see if an equity is in an uptrend, downtrend, or no trend based on the condition of the moving
15 Second Tick Pulse E-mini S&P Trading System. By Capstone Trading Systems
 15 Second Tick Pulse E-mini S&P Trading System By Capstone Trading Systems 214-498-5029 david@capstonetradingsystems.com DISCLAIMER HYPOTHETICAL PERFORMANCE RESULTS HAVE MANY INHERENT LIMITATIONS, SOME
Earnings Release Version 20.0
 Earnings Release Version 20.0 Description: The Earnings Release (ER) analysis techniques for Chart Analysis, RadarScreen and the Scanner indicates when the next scheduled earnings release will be for a
The Launchpad Strategy
 presented by Thomas Wood MicroQuant SM Divergence Trading Workshop Day One The Launchpad Strategy Risk Disclaimer Trading or investing carries a high level of risk, and is not suitable for all persons.
The content of and this ebook are copyrighted and may not be copied or reproduced.
 All rights reserved. Except for brief quotations in a review of this publication, no part of this publication may be reproduced, stored in a retrieval system, or transmitted in any form or by any means
Using Volume Based Bars in Your Trading Exclusive Presentation for Infinity Futures
 Using Volume Based Bars in Your Trading Exclusive Presentation for Infinity Futures Trading Futures, Options on Futures, and retail off-exchange foreign currency transactions involves substantial risk
Presents. Forex Cash Geyser. By Joshua Schultz
 Presents Forex Cash Geyser By Joshua Schultz RISK DISCLOSURE STATEMENT / DISCLAIMER AGREEMENT Trading any financial market involves risk. This report and all and any of its contents are neither a solicitation
Autochartist User Manual
 Autochartist User Manual compliance@ifxbrokers.com www.ifxbrokers.com +27 42 293 0353 INTRODUCTION Chapter 1 Autochartist offers traders automated market-scanning tools that highlight trade opportunities
TRADE SIGNALS POWERED BY AUTOCHARTIST
 SAXO TRADER GO TRADE SIGNALS POWERED BY AUTOCHARTIST Trade Signals is a SaxoTraderGO tool that uses Autochartist technology to identify emerging and completed patterns in most leading financial markets.
The strategy has an average holding period of 4 days and trades times a year on average.
 Introduction Diversity CL is a price pattern based swing trading system for the NYMEX WTI Crude Oil futures contract. The system uses multiple price patterns hence the name "Diversity". The strategy trades
INTRODUCTION CHAPTER 1
 INTRODUCTION CHAPTER 1 Autochartist offers traders automated market-scanning tools that highlight trade opportunities based on support and resistance levels. Autochartist products include: Chart pattern
RISK DISCLOSURE STATEMENT / DISCLAIMER AGREEMENT
 RISK DISCLOSURE STATEMENT / DISCLAIMER AGREEMENT Trading any financial market involves risk. This report and all and any of its contents are neither a solicitation nor an offer to Buy/Sell any financial
TAS Market Profile Charting Package For Tradestation User s Guide, ver 1.2
 TAS Market Profile Charting Package For Tradestation User s Guide, ver 1.2 Table of Contents Introduction Page 3 Installing the TAS Market Profile Charting Package Page 4 Overview Page 9 TAS Boxes Page
FOREX INCOME BOSS. Presents. SRT Profit System
 FOREX INCOME BOSS Presents SRT Profit System Published by Alaziac Trading CC Suite 509, Private Bag X503 Northway, 4065, KZN, ZA www.forexincomeboss.com Copyright 2014 by Alaziac Trading CC, KZN, ZA Reproduction
A unique trading tool designed to help traders visualize and place orders based on market depth and order flow. DepthFinder TradingApp
 A unique trading tool designed to help traders visualize and place orders based on market depth and order flow. DepthFinder TradingApp DepthFinder Trading App for TradeStation Table of Contents Introduction
Table Of Contents. Introduction. When You Should Not Use This Strategy. Setting Your Metatrader Charts. Free Template 15_Min_Trading.tpl.
 Table Of Contents Introduction When You Should Not Use This Strategy Setting Your Metatrader Charts Free Template 15_Min_Trading.tpl How To Trade 15 Min. Trading Strategy For Long Trades 15 Min. Trading
Bullalgo Trading Systems, Inc. Orion NBar Crossover Strategy User Manual Version 1.0 Manual Revision
 Bullalgo Trading Systems, Inc. Orion NBar Crossover Strategy User Manual Version 1.0 Manual Revision 20150917 Orion NBar Crossover Strategy The Orion NBar Crossover Strategy is a tool to show the NBar
EFE 2 Contracts USER GUIDE
 EFE 2 Contracts USER GUIDE The risk of trading can be substantial and each investor and/or trader must consider whether this is a suitable investment. Past performance, whether actual or indicated by simulated
TRADE SIGNALS POWERED BY AUTOCHARTIST
 TRADE SIGNALS POWERED BY AUTOCHARTIST Trade Signals is a powerful tool available in BiGlobal Trade for identifying trading opportunities based on chart patterns using Autochartist technology. As an introduction
Crude oil Arrow USER GUIDE
 Crude oil Arrow USER GUIDE The risk of trading can be substantial and each investor and/or trader must consider whether this is a suitable investment. Past performance, whether actual or indicated by simulated
FOREX ENIGMA USER GUIDE.
 FOREX ENIGMA USER GUIDE http://www.forexenigma.com DISCLAIMER Please be aware of the loss, risk, personal or otherwise consequences of the use and application of this book s content. The author and the
TRADE PLANNING WITH SIMPLE SUPPORT & RESISTANCE. Presented by Nabil Mattar FX Technical Analyst
 TRADE PLANNING WITH SIMPLE SUPPORT & RESISTANCE Presented by Nabil Mattar FX Technical Analyst 1 DISCLAIMER IG Asia Pte Ltd (Co. Reg. No. 20051002K) holds a capital markets services licence from the Monetary
BY JIM PRINCE
 No part of this publication may be reproduced, stored in a retrieval system, or transmitted in any form or by any means electronic, mechanical, photocopying, recording, or otherwise without the prior permission
1. For initial testing, log into your Trading Simulation accounts.
 Instructions Product: TradeAssistant Pro Date: January 4, 2017 Purpose: TradeAssistant Pro is for fast and flexible order placements. Setup custom triggers. Put orders in OCO groups to leverage buying
A Guide to Joe DiNapoli s D-Levels Studies Using GFT s DealBook FX 2
 A Guide to Joe DiNapoli s D-Levels Studies Using GFT s DealBook FX 2 Based on the book: Trading with DiNapoli Levels The Practical Application of Fibonacci Analysis to Investment Markets Important notice:
NetPicks Keltner Bells
 Page 1 NetPicks Keltner Bells NetPicks, LLC HYPOTHETICAL PERFORMANCE RESULTS HAVE MANY INHERENT LIMITATIONS, SOME OF WHICH ARE DESCRIBED BELOW. NO REPRESENTATION IS BEING MADE THAT ANY TRADING ACCOUNT
BUY SELL PRO. Improve Profitability & Reduce Risk with BUY SELL Pro. Ultimate BUY SELL Indicator for All Time Frames
 BUY SELL PRO Improve Profitability & Reduce Risk with BUY SELL Pro Ultimate BUY SELL Indicator for All Time Frames Risk Disclosure DISCLAIMER: Crypto, futures, stocks and options trading involves substantial
Swing Traders Edge The Systematic Swing Trading System. TradeStation Guide
 Swing Traders Edge The Systematic Swing Trading System TradeStation Guide Important Non-Disclosure: You are purchasing a single user licence which may not be transferred or resold. The information including
presented by Thomas Wood MicroQuant SM Divergence Trading Workshop Day One Bond Trading Success
 presented by Thomas Wood MicroQuant SM Divergence Trading Workshop Day One Bond Trading Success Risk Disclaimer Trading or investing carries a high level of risk, and is not suitable for all persons. Before
TriggerCharts Indicators
 TriggerCharts Indicators TradeStation User Guide The TriggerCharts Commander Series indicators are a structured and logical approach to analyzing and interpreting the markets that has its foundation in
An Overview of the ZMA : The Superior Moving Average Page 2. ZMA Indicator: Infinite Flexibility and Maximum Adaptability Page 4
 An Overview of the ZMA : The Superior Moving Average Page 2 ZMA Indicator: Infinite Flexibility and Maximum Adaptability Page 4 ZMA PaintBar: Moving Average Color-Coding Page 5 Responsiveness and Inertia:
Directional Key System
 1 Directional Key System 2 RISK DISCLOSURE STATEMENT. Trading any financial market involves risk. This e-book, software, and the website and its contents are neither a solicitation nor an offer to Buy/Sell
Gold Space USER GUIDE
 Gold Space USER GUIDE The risk of trading can be substantial and each investor and/or trader must consider whether this is a suitable investment. Past performance, whether actual or indicated by simulated
VERY IMPORTANT Before you start you have to follow these instructions to insure that the strategy is working properly:
 Volatility Pivots User Guide help@volatilitypivots.com VERY IMPORTANT Before you start you have to follow these instructions to insure that the strategy is working properly: 1. This strategy works with
Chart Patterns. (High Probability Chart Patterns) By Russ Horn
 By Russ Horn") (High Probability ) By Russ Horn 1 RISK DISCLOSURE STATEMENT / DISCLAIMER AGREEMENT Trading any financial market involves risk. This report and all and any of its contents are neither a solicitation nor
(High Probability ) By Russ Horn 1 RISK DISCLOSURE STATEMENT / DISCLAIMER AGREEMENT Trading any financial market involves risk. This report and all and any of its contents are neither a solicitation nor
RISK DISCLOSURE STATEMENT / DISCLAIMER AGREEMENT
 RISK DISCLOSURE STATEMENT / DISCLAIMER AGREEMENT Trading any financial market involves risk. This report and all and any of its contents are neither a solicitation nor an offer to Buy/Sell any financial
IVGraph Live Service Contents
 IVGraph Live Service Contents Introduction... 2 Getting Started... 2 User Interface... 3 Main menu... 3 Toolbar... 4 Application settings... 5 Working with layouts... 5 Working with tabs and viewports...
INTERMEDIATE EDUCATION GUIDE
 INTERMEDIATE EDUCATION GUIDE CONTENTS Key Chart Patterns That Every Trader Needs To Know Continution Patterns Reversal Patterns Statistical Indicators Support And Resistance Fibonacci Retracement Moving
TRADE SIGNALS POWERED BY AUTOCHARTIST
 SAXO TRADER GO TRADE SIGNALS POWERED BY AUTOCHARTIST Trade Signals is a SaxoTraderGO tool that uses Autochartist technology to identify emerging and completed patterns in most leading financial markets.
Three skills to help you trade forex
 Three skills to help you trade forex AN INTRODUCTION TO TRADING CURRENCIES A FOREX.com educational guide FOREX.com is a trading name of GAIN Capital UK Limited, FCA No. 113942. Our services include products
USER GUIDE
 USER GUIDE http://www.superprofitscalper.com DISCLAIMER Please be aware of the loss, risk, personal or otherwise consequences of the use and application of this book s content. The author and the publisher
TRADE SIGNALS POWERED BY AUTOCHARTIST
 SAXO TRADER GO TRADE SIGNALS POWERED BY AUTOCHARTIST Trade Signals is a SaxoTraderGO tool that uses Autochartist technology to identify emerging and completed patterns in most leading financial markets.
Bullalgo Trading Systems, Inc. Bullalgo Volatility Gauge Study Indicator User Manual Version 1.0 Manual Revision
 Bullalgo Trading Systems, Inc. Bullalgo Volatility Gauge Study Indicator User Manual Version 1.0 Manual Revision 20150917 Bullalgo Volatility Gauge Study Indicator The Bullalgo Volatility Gauge/Brake Indicator
McDowell s Special Market Report Using the TradersCoach.com Software Tools
 McDowell s Special Market Report Using the TradersCoach.com Software Tools JULY 2018: Welcome to this month s Market Report! This written report is going to forecast the Dow Jones Industrial Average (hereafter
Trading Success Principles Floor Trader Pivots
 Trading Success Principles Floor Trader Pivots Trading Concepts, Inc. Trading Success Principles Floor Trader Pivots By Todd Mitchell Copyright 2014 by Trading Concepts, Inc. All Rights Reserved This training
An informative reference for John Carter's commonly used trading indicators.
 An informative reference for John Carter's commonly used trading indicators. At Simpler Options Stocks you will see a handful of proprietary indicators on John Carter s charts. This purpose of this guide
TAS MARKET ABOUT CONTACT US. TAS Market Profile is a global leader in trading technology and market analytics. It's still your trade. Just better.
 TAS MARKET MAP U S E R M A N U A L ABOUT TAS Market Profile is a global leader in trading technology and market analytics. It's still your trade. Just better. CONTACT US Website: www.tasmarketprofile.com
Please read the following risk disclosure before you proceed.
 Please read the following risk disclosure before you proceed. The risk of loss in trading commodity futures contracts can be substantial. You should therefore carefully consider whether such trading is
Instructions 1. For initial testing, log into your Trading Simulation accounts.
 Instructions Product: TradeAssistant Date: February 28, 2018 Purpose: A fast and flexible order placement tool. Setup custom triggers. Put orders in OCO groups to leverage buying power. Create OSO relationships
Software user manual for all our indicators including. Floor Traders Tools & TrendPro
 Software user manual for all our indicators including Floor Traders Tools & TrendPro All the software was designed and developed by Roy Kelly ARC Systems, Inc. 1712 Pioneer Ave Ste 1637 Cheyenne, WY 82001
For general trading knowledge, please get a beginners guide or simply got to :
 www.forexripper.com About The System For general trading knowledge, please get a beginners guide or simply got to : www.babypips.com For more interactive information about the market, there are hundreds
PRESENTS. The Target Entry Elevator Indicator. By Michael Nurok
 PRESENTS The Target Entry Elevator Indicator By Michael Nurok RISK DISCLOSURE STATEMENT / DISCLAIMER AGREEMENT Trading any financial market involves risk. This report and all and any of its contents are
An Overview of the Super Stochastics MTF Indicator Page 2. The Advantages and Features of MTF Indicators Page 3
 An Overview of the Super Stochastics MTF Indicator Page 2 The Advantages and Features of MTF Indicators Page 3 The Various Methods of MTF Analysis: Unlocking New Possibilities Page 5 - Different Time Frames
An Overview of the Dynamic Trailing Stop Page 2. Dynamic Trailing Stop: The Power of Smart-Stop Technology Page 3
 An Overview of the Dynamic Trailing Stop Page 2 Dynamic Trailing Stop: The Power of Smart-Stop Technology Page 3 DTS PaintBar: Color-Coded Trend Status Page 5 Customizing the DTS Indicators Page 6 Expert
TradeStation User Guide
 TradeStation User Guide *For S&P 500 ETF Only (SPY)* Important note: Data subscriptions for NYSE, AMEX and OPRA are required for this indicator. ** DATA SUBSCRIPTIONS FOR NYSE, AMEX AND OPRA ARE REQUIRED
NEW SCIENCE OF FOREX TRADING. Presents. Rapid Trade Finder
 NEW SCIENCE OF FOREX TRADING Presents Rapid Trade Finder New Science of Forex Trading Published by Alaziac Trading CC Suite 509, Private Bag X503 Northway, 4065, KZN, ZA www.newscienceofforextrading.com
Bullalgo Trading Systems, Inc. Orion Bollinger Band (BB) Threshold Study Indicators User Manual Version 1.0 Manual Revision
 Threshold Study Indicators User Manual Version 1.0 Manual Revision") Bullalgo Trading Systems, Inc. Orion Bollinger Band (BB) Threshold Study Indicators User Manual Version 1.0 Manual Revision 20150917 Orion Bollinger Band (BB) Threshold Study Indicators The Orion Bollinger
Bullalgo Trading Systems, Inc. Orion Bollinger Band (BB) Threshold Study Indicators User Manual Version 1.0 Manual Revision 20150917 Orion Bollinger Band (BB) Threshold Study Indicators The Orion Bollinger
TRADE SIGNALS POWERED BY AUTOCHARTIST
 SAXO TRADER GO TRADE SIGNALS POWERED BY AUTOCHARTIST Trade Signals is a SaxoTraderGO tool that uses Autochartist technology to identify emerging and completed patterns in most leading financial markets.
JaySignal BULLSEYE TRADING
 JaySignal BULLSEYE TRADING JaySignal is a standalone fibonacci confluence Ninja Trader Indicator that we lease for $150.00 a month as an add on to our live trading room. It can be used for additional setups
T-VALUATION Trading Made Simple. The Fibonacci Channel Indicator Classic. Table of Contents. 1 The Fibonacci Channel Indicator Classic: Overview 2
 The Fibonacci hannel Indicator lassic Table of ontents 1 The Fibonacci hannel Indicator lassic: Overview 2 2 Using the Fibonacci hannel Indicator 3 3. Alerts 9 4. Using the T-Bars Paint Study 10 5. Inputs
Russ Horn Presents PROFIT AUTOMATION TOOL
 Russ Horn Presents PROFIT AUTOMATION TOOL RISK DISCLOSURE STATEMENT / DISCLAIMER AGREEMENT Trading any financial market involves risk. This report and all and any of its contents are neither a solicitation
S-Enrooter 1.0. Automatic trading strategy USER GUIDE. Version 1.0
 S-Enrooter 1.0 Automatic trading strategy USER GUIDE Version 1.0 Revised 22.08.2016 Trading method Breakout signals Trading Style Swing trading system Description of automatic strategy S-Enrooter 1.0 -
Best Strategies for Trading Binary Options
 Best Strategies for Trading Binary Options Binary Options Trading Overview 5 Most Successful Strategies Course Info Free Strategy Binary Options Trading Basics: - Basically, binary options trading involves
Russ Horn Presents. Forex Money Bounce
 Presents Forex Money Bounce RISK DISCLOSURE STATEMENT / DISCLAIMER AGREEMENT Trading any financial market involves risk. This report and all and any of its contents are neither a solicitation nor an offer
Presents. Forex Profit Boost
 Presents Forex Profit Boost Forex Profit Boost Published by Alzaiak Trading CC Nominee Old Tree Publishing CC Suite 509, Private Bag X503 Northway, 4065, KZN, ZA www.oldtreepublishing.com Copyright 2014
Tradeonix 2.0. (An Updated Version Of Tradeonix) By Russ Horn
 By Russ Horn") Tradeonix 2.0 (An Updated Version Of Tradeonix) By 1 RISK DISCLOSURE STATEMENT / DISCLAIMER AGREEMENT Trading any financial market involves risk. This report and all and any of its contents are neither
Tradeonix 2.0 (An Updated Version Of Tradeonix) By 1 RISK DISCLOSURE STATEMENT / DISCLAIMER AGREEMENT Trading any financial market involves risk. This report and all and any of its contents are neither