BursaStation Learning Workshop Enhance Your Trading Skills With Bursastation
|
|
|
- Elfreda Rice
- 5 years ago
- Views:
Transcription
1 BursaStation Learning Workshop Enhance Your Trading Skills With Bursastation Presented by: C.Y. Leow Assistant Manager ShareInvestor Malaysia
2 BURSASTATION LAYOUT
3 LAYOUT Toolbar CHANNEL NAVIGATOR MAIN FRAME STOCK FRAME NEWS FRAME
4 TOOLBAR
5 Channel Navigator Opens and Closes the Channel Navigator CHANNEL NAVIGATOR
6 Open&Close News Frame Opens and Closes the News Frame NEWS Frame
7 Open&Close Stocks Frame Opens and Closes the Stocks Frame STOCK FRAME

8 Open&Close View Mode Minimize Tile Window View

9 Ticker Mode Right Click WATCHLIST


10 FactSheet Stock Frame Intraday Info
11 INTRADAY MARKET TICKER


12 Intraday Market Ticker Intraday Market Ticker


13 Intraday Market Ticker Open few Intraday Market Ticker filtering different channels Portfolio Top Active Stocks Channel
14 DISPLAY LAYOUT SETTING

15 Layout SAVE DISPLAY LAYOUT #1 - Restart your Bursastation - Drag out the Channel Navigator - You will see below Advanced Docking

16 Layout - Restart your Bursastation - Pull and drag the stock frame

17 Layout SAVE DISPLAY LAYOUT #2 Save As : BSLearning
18 MAIN FRAME


19 5 Different Channels Main Frame Adjustable Column Trend Column Green Yellow Red Indicates an increase in the last done price. Indicates that there has been no change in the last done price. Indicates a drop in the last done price.
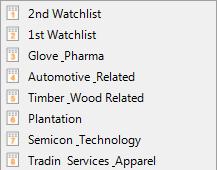
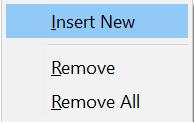
20 CHANNEL NAVIGATOR


21 Top Counters Top Warrants Channel Navigator Indices World Indices
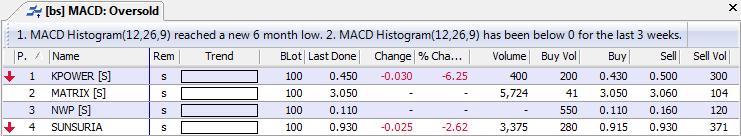
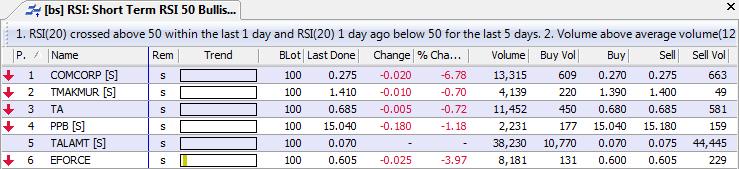
22 Predefined TA Screens Bullish Engulfing

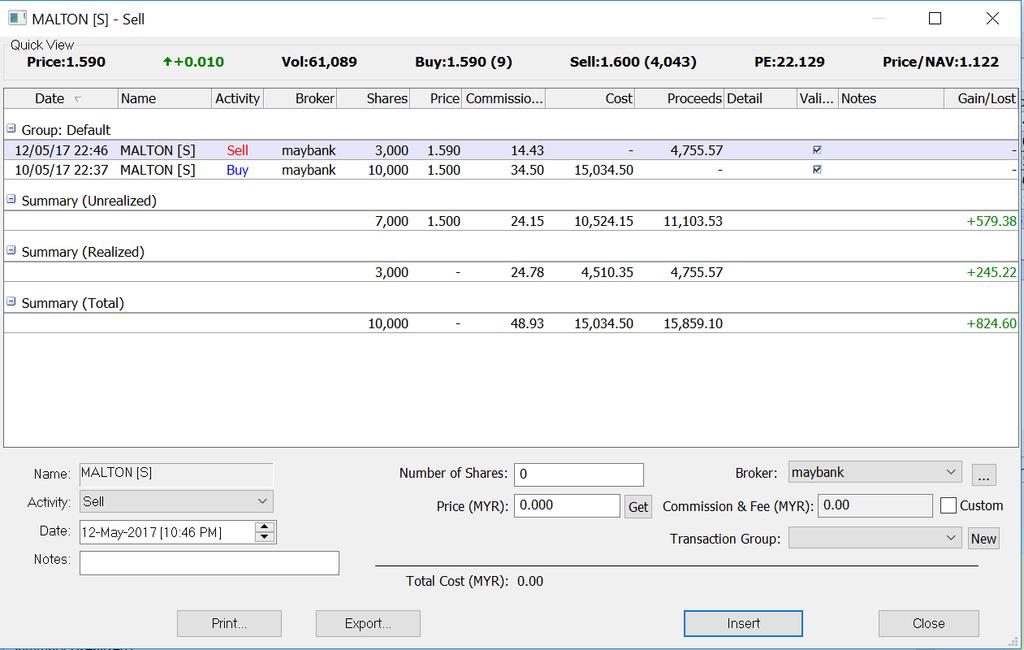
23 Predefined TA Screens 1. Bullish Engulfing 2. Bullish Hammer 3. Bullish Harami


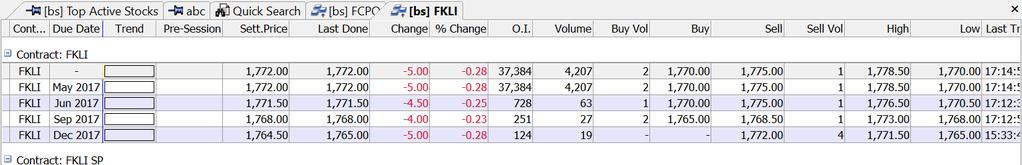
24 Channel Navigator FKLI FCPO
25 PORTFOLIO MANAGER

26 Portfolio Right Click watchlist1


27 Watchlist Right Click Please add below stocks 1. MAYBANK 2. AIRASIA

28 Set Brokerage Fee Broker Setting


29 Tutorial Set 1 Broker here Broker Setting
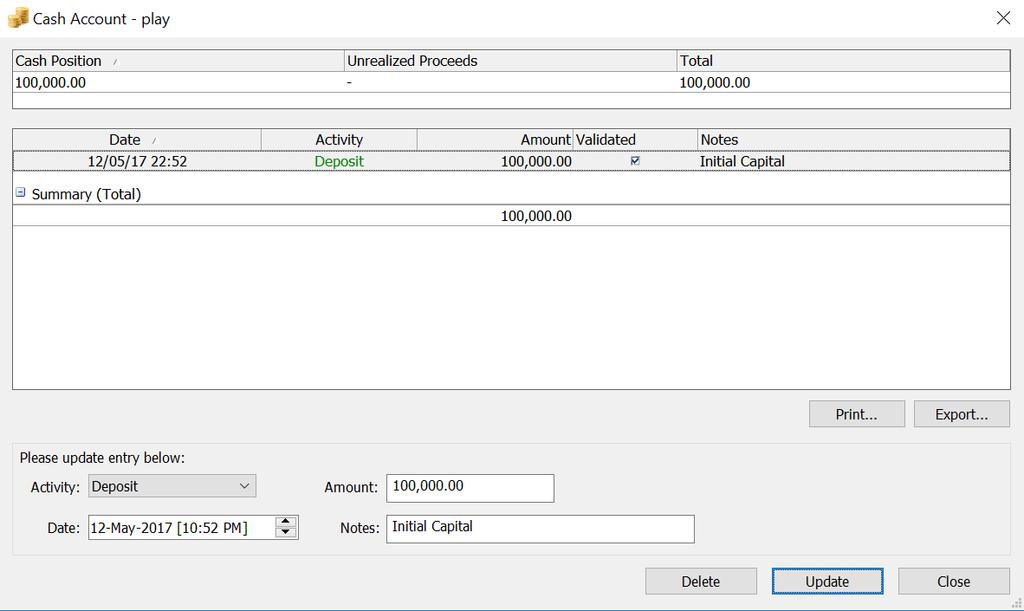

30 Transaction Set Up Portfolio Cash Right Click

31 Transaction Enter Transactions Tutorial AirAsia : 5000 Shares Maybank : 2000 Shares


32 Transaction Profit & Loss Summary Transactions Details Capital Allocation

33 Transactions Summary of a Stock Transaction

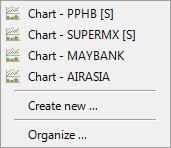
34 Chart Right Click Please add below stocks chart 1. MAYBANK 2. AIRASIA
35 ALERT SYSTEM


36 Alert Select Stocks Up to 160 alerts Set Alert Conditions Trigger Time Range Delivery Options Tutorial AirAsia : Price Done or less than 1.30 Topglove : Volume done or greater than 25,000 Lots
37 NEWS FRAME

38 News Frame REAL TIME FROM BURSA MALAYSIA *Double click on news feed

39 News Frame

40 News Frame Open News for Individual Counter Right click on counter
41 STOCK FRAME

42 Stocks Frame 2 1 STOCK FRAME TOOLBAR 1 Time & Sales Trade Summary Matrix Intraday Chart Volume Distribution Chart Dynamic TA Chart Market Depth Quote Movements Trade Summary Matrix Chart 2 Stock Summary Price, Vol Done, Buy&Sell, PE, Price/NAV


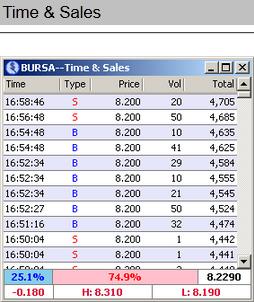
43 Stocks Frame 3 Time & Sales 3 Show Every Transactions Right Click Summary of Buy Up & Sell Down / Daily High and Low


44 Stocks Frame 4 Market Depth SELL Queue 4 BUY Queue Right Click Depth Statistic Summary Buy Sell Summary


45 Stocks Frame 5 Volume Distribution Chart 5 X-Axis indicates the volume done Y-Axis indicates the size of the Transactions (Volume x Price)


46 Stocks Frame 6 Trade Summary Matrix Trades summarize by sell down & buy up vol, No. of trades and Prices 6 7 Trade Summary Chart (Graphical Representation of the Trade Summary Matrix) 7


47 Stocks Frame 8 Quote Movements Right Click 8 The Quote Movements is an extension of Time & Sales. In addition to recording each individual trade, all changes in the first level Buy Queue and Sell Queue are recorded and displayed in chronological order.
48 PRICE SPREAD CALCULATOR

49 Price Spread Calculator Profit and Loss Table Right Click
50 STOCK S FUNDAMENTAL
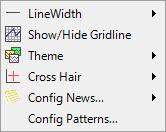
51 Right Click Stock s Fundamental

52 Fact Sheet General Info EPS, PE, NAV, MARKET CAP, DIVIDEND YIELD Stock s Fundamental Company Background

53 Financials Compact Financials: Profit & Loss Balance Sheet Cash Flow Financial Ratios *Could be viewed in different modes: Yearly, Half-yearly, Quarterly
54 INSIDER TRADES

55 Insider Trades Display Trades by Substantial Shareholders and Directors. Note: point over to view details of particular trade
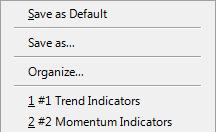
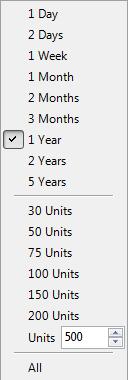
56 DYNAMIC CHART

57 Toolbar Dynamic Chart Stock Chart Stocks Listing Indicators Indicators Drawing Tools Performance Comparison

58 Right Click Dynamic Chart
59 Candlestick Pattern Recognition Dynamic Chart News On Chart Zoom In & Out


60 Dynamic Chart Add Indicators Tutorial Add Indicators 1. MA 5 & MACD 3. RSI

61 Dynamic Chart Change Indicator s Properties Change to 5 and 10 MA accordingly Change the 5 MA line weight to 2.00 and yellow color MACD 5 & 10 MA RSI
 Change")

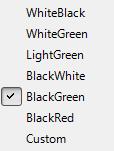
62 Change Properties & Theme Dynamic Chart 1) Change Color Style to Trend 2) Change the Theme to WhiteBlack

63 Save Chart Templates Dynamic Chart

64 Drawing Tools Dynamic Chart Horizontal and Vertical Lines Parallel Line Fibonacci Retracement Fibonacci Projection Fibonacci Fan Fibonacci Time Zone Fibonacci Time Extension Fibonacci Time Projection Linear Regression Standard Deviation Channel Gann Grid Andrew s Pitchfork Cycle Brackets Symmetrical Triangle Midas

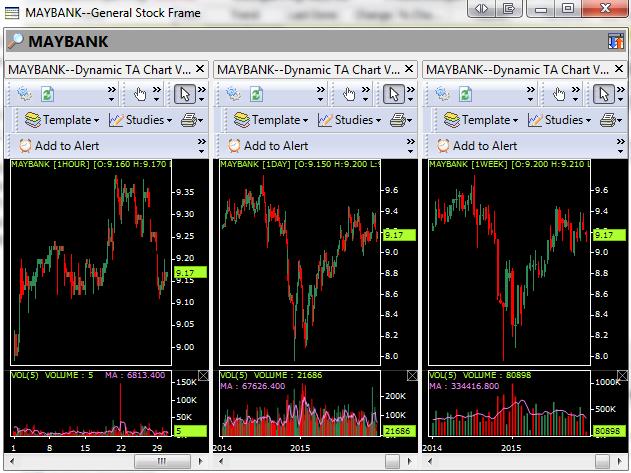
65 Dynamic Chart Draw a horizontal line and vertical line Save Studies
66 Dynamic Chart Draw Fibonnaci, line segments, parallel lines.. * Depending on how many points of reference you need for the particular drawing tools, you would nee to click how many times to complete the drawing

67 Save Chart Images Dynamic Chart Save file location


68 Dynamic Chart Candlestick Pattern Recognition On/Off Candlestick Pattern Recognition
69 Dynamic Chart News On Chart Each dot represents one news

70 Dynamic Chart Performance comparison Easy to compare the stock performance in same industry
71 POWER FRAME

72 Right Click Power Frame


73 Power Frame * Close all the data column Click TA Charts 3 times

74 Power Frame Change the time frame charts : - 1 hour Chart - Daily Chart - Weekly Chart

75 Power Frame 1 HOUR Save The Templates DAILY Weekly - BSLearning


76 Right Click Power Frame

77 Power Frame Sample Intraday Info 1 Minutes Chart 1 Hour Chart


78 2 Screens Setting Channel Navigator Main Frame Time & Sales Market Depth Volume Distribution Trade Summary Intraday Market Ticker Hourly Chart Daily Chart
79 MARKET SCANNER


80 Market Scanner Scanned Conditions More Scan Conditions Scanned Results Tutorial 1. Instrument Type : Stock 2. Price/52 Weeks High : Min 0.95 / Max % Change : 0.1% 4. Volume : Min 1000 Lots 5. Last Done Price : Min 0.50 Breakout Strategy
81 ONLINE TUTORIAL

82 Online Tutorial

83 Online Tutorial
BursaStation Application-based
 Disclaimer The views and opinions expressed by the speaker does not necessarily reflect those of ShareInvestor Pte Ltd nor any related companies of ShareInvestor Pte Ltd. The presentation by the speaker
ก ก กก ก ก ก ก ก ก ก ก (Volume) ก ก D Daily ก ก ก (Maximize) Toolbars ก ก 1. (Technical Analysis) 2. ก ก 3. ก Trendlines ก ก ก Bisnews AFE (Thailand)
 ก ก D Daily ก ก ก (Maximize) Toolbars ก ก 1. (Technical Analysis) 2. ก ก 3. ก Trendlines ก ก ก Bisnews AFE (Thailand)") Chart Menu Chart ก ก 16 Trend Line ก ก ก ก ก ก ก ก ก Chart Interval ก ก ก tic, 5, 15, 30, 60, 3 2 Zoom-in ก ก ก Cross Hair Color Palette Setting ก background, foreground, grid line, highlight box Save/Restore
Chart Menu Chart ก ก 16 Trend Line ก ก ก ก ก ก ก ก ก Chart Interval ก ก ก tic, 5, 15, 30, 60, 3 2 Zoom-in ก ก ก Cross Hair Color Palette Setting ก background, foreground, grid line, highlight box Save/Restore
Introduction to Active Trader Pro
 Introduction to Active Trader Pro 3 Fidelity Brokerage Services, Member NYSE, SIPC, 900 Salem Street, Smithfield, RI 02917. 2017 FMR LLC. All rights reserved. 686285.7.0 This workshop will Illustrate how
Streaming Real Time Quotes Service User Guide. Version 5.3
 Streaming Real Time Quotes Service User Guide www.easecurities.com.hk Version 5.3 Table of Content 1. Introduction... 3 2. System requirement... 4 2.1 Hardware requirements... 4 2.2 Software requirements...
+44 (0)
") FXCM Inc., a publicly traded company listed on the New York Stock Exchange (NYSE: FXCM), is a holding company and its sole asset is a controlling equity interest in FXCM Holdings, LLC. Forex Capital Markets
FXCM Inc., a publicly traded company listed on the New York Stock Exchange (NYSE: FXCM), is a holding company and its sole asset is a controlling equity interest in FXCM Holdings, LLC. Forex Capital Markets
Release Notes. November 2014
 Release Notes November 2014 Trade & Orders Options Account Management Chart General Trade Armor Options o New tab with ability to view and trade single leg and select multi-leg options. o Upcoming earnings
TRADE SIGNALS POWERED BY AUTOCHARTIST
 SAXO TRADER GO TRADE SIGNALS POWERED BY AUTOCHARTIST Trade Signals is a SaxoTraderGO tool that uses Autochartist technology to identify emerging and completed patterns in most leading financial markets.
TRADE SIGNALS POWERED BY AUTOCHARTIST
 SAXO TRADER GO TRADE SIGNALS POWERED BY AUTOCHARTIST Trade Signals is a SaxoTraderGO tool that uses Autochartist technology to identify emerging and completed patterns in most leading financial markets.
IVGraph Live Service Contents
 IVGraph Live Service Contents Introduction... 2 Getting Started... 2 User Interface... 3 Main menu... 3 Toolbar... 4 Application settings... 5 Working with layouts... 5 Working with tabs and viewports...
Page 1 of 8. Several actions can be done from the Market Watch window by right clicking on an instrument such as this:
 Page 1 of 8 Market Watch The main thing to look at when using MT4 is the Market Watch window which is probably the most important feature of the platform. The Market Watch displays the instruments available
Qualify Your Instruments & Find High Probability Setups
 +1.888.537.0070 x 750 support@marketprofilescan.com www.marketprofilescan.com TAS knows the value of accurate and timely market generated information. Providing high probability trading setups is our business.
TRADE SIGNALS POWERED BY AUTOCHARTIST
 TRADE SIGNALS POWERED BY AUTOCHARTIST Trade Signals is a powerful tool available in BiGlobal Trade for identifying trading opportunities based on chart patterns using Autochartist technology. As an introduction
PHILLIP FUTURES PTA. POEMS Installation and Quick Start User Guideline
 PHILLIP FUTURES PTA POEMS 1.8.3 Installation and Quick Start User Guideline NOTICE The best effort has been put in to ensure that the information given in this POEMS Professional 1.8.3 Quick Start User
TRADE SIGNALS POWERED BY AUTOCHARTIST
 SAXO TRADER GO TRADE SIGNALS POWERED BY AUTOCHARTIST Trade Signals is a SaxoTraderGO tool that uses Autochartist technology to identify emerging and completed patterns in most leading financial markets.
BUY SELL PRO. Improve Profitability & Reduce Risk with BUY SELL Pro. Ultimate BUY SELL Indicator for All Time Frames
 BUY SELL PRO Improve Profitability & Reduce Risk with BUY SELL Pro Ultimate BUY SELL Indicator for All Time Frames Risk Disclosure DISCLAIMER: Crypto, futures, stocks and options trading involves substantial
PART 3 - CHART PATTERNS & TECHNICAL INDICATORS
 Tyler Chianelli s EASYOPTIONTRADING by OPTION TRADING COACH PART 3 - CHART PATTERNS & TECHNICAL INDICATORS A SIMPLE SYSTEM FOR TRADING OPTIONS WORKS IN UP, DOWN, AND SIDEWAYS MARKETS PART 3.1 - PRIMARY
INTRODUCTION CHAPTER 1
 INTRODUCTION CHAPTER 1 Autochartist offers traders automated market-scanning tools that highlight trade opportunities based on support and resistance levels. Autochartist products include: Chart pattern
Table of Contents. Navigation Overview Log In To IBIS The Classic Workspace Add Windows Group Windows... 5
 IBIS Users' Guide Table of Contents Navigation Overview... 1 Log In To IBIS... 1 The Classic Workspace... 2 Add Windows... 4 Group Windows... 5 Drag and Snap Windows... 6 Tools and Windows... 7 The Anchor
Merrill Edge MarketPro Alerts
 Merrill Edge MarketPro Alerts Alerts provide notifications when market activity meets the defined criteria. TOOLBAR GUIDE 1 2 3 4 1 2 3 4 Add add a new alert Action allows an action (edit, reactivate,
StockFinder Workbook. Fast and flexible sorting and rule-based scanning. Charting with the largest selection of indicators available
 StockFinder Workbook revised Apr 23, 2009 Charting with the largest selection of indicators available Fast and flexible sorting and rule-based scanning Everything you need to make your own decisions StockFinder
Metatrader 4 (MT4) User Guide
 User Guide") Metatrader 4 (MT4) User Guide Installation Download the MetaTrader4 demo platform from the Tradesto website:- https://members.tradesto.com/tradestoco4setup.exe Launch the installation file the same way
Metatrader 4 (MT4) User Guide Installation Download the MetaTrader4 demo platform from the Tradesto website:- https://members.tradesto.com/tradestoco4setup.exe Launch the installation file the same way
TRADE SIGNALS POWERED BY AUTOCHARTIST
 SAXO TRADER GO TRADE SIGNALS POWERED BY AUTOCHARTIST Trade Signals is a SaxoTraderGO tool that uses Autochartist technology to identify emerging and completed patterns in most leading financial markets.
esignal 11.5 February 2013
 esignal Release Notes Page 1 of 22 esignal 11.5 introduces a host of new features and enhancements for active traders and investors. Read on to get more details of this release. See Appendix for 11.5 SP1
User Reference Guide to UTRADE Tablet App
 Table of Content Currently UTRADE Tablet App is able to support SGX Market only. Trades for foreign markets are not reflected. System Requirements and Login.1 Navigation 2 Chart View i. Price Quote..3
Gtrade manual version 2.04 updated
 Gtrade manual version 2.04 updated 9.30.2016 Table of Contents Contents Table of Contents2 Getting started, Logging in and setting display language in TurboTick Pro3 Level 25 Order Entry8 Streamlined Order
Table of Contents. 1. Idea Mobility Solution Framework for Derivatives Trading. 1.1 Executive Summary. 1.2 Users. 1.3 Problem Statement
 Table of Contents 1. Idea Mobility Solution Framework for Derivatives Trading 1.1 Executive Summary 1.2 Users 1.3 Problem Statement 1.4 High Level Business Requirements 1.5 Relevance to Customer s Business
Autochartist User Manual
 Autochartist User Manual compliance@ifxbrokers.com www.ifxbrokers.com +27 42 293 0353 INTRODUCTION Chapter 1 Autochartist offers traders automated market-scanning tools that highlight trade opportunities
Julia s Notes from Scottsdale
 Julia s Notes from Scottsdale November 2007 Overview of TeleChart and Blocks... 2 Downloading and Installing Blocks version 2... 4 Opening Personal Chartist... 4 Add Study... 5 Sorting by Stochastics...
LOGIN. Click on login button to login to your account
 LOGIN Click on login button to login to your account If you are new and don t have an online account, click here to sign up for Online Share Trading or Futures Account NAVIGATING RHB TRADESMART Find useful,
Comprehensive Data: (NSE Cash, Futures and Options)
") 1MarketView Discover Opportunities. Gain Insight. 1MarketView is a State of the Art Market Information and Analysis platform designed for Active traders to help them spot opportunities and make informed
1MarketView Discover Opportunities. Gain Insight. 1MarketView is a State of the Art Market Information and Analysis platform designed for Active traders to help them spot opportunities and make informed
1.1 Installation from the Web 1.2 Logging On
 1 1.1 Installation from the Web 1.2 Logging On 2.1 WH Expert Elite Display and Menu Bars 2.2 The Icon Bar 2.2.1 Icon Bar Type 1 2.2.2 Icon Bar Type 2 2.2.3 Icon Bar Type 3 2.3 Right Mouse Click Support
Contents 1. Login Layout Settings DEFAULTS CONFIRMATIONS ENVIRONMENT CHARTS
 USER GUIDE Contents 1. Login... 3 2. Layout... 4 3. Settings... 5 3.1. DEFAULTS... 5 3.2. CONFIRMATIONS... 6 3.3. ENVIRONMENT... 6 3.4. CHARTS... 7 3.5. TOOLBAR... 10 3.6. DRAWING TOOLS... 10 3.7. INDICATORS...
StockFinder 5 Workbook
 StockFinder 5 Workbook Updated Februar y 2010 STOCKFINDER 5 WORKBOOK Worden Brothers, Inc. www.worden.com Five Oaks Office Park 4905 Pine Cone Drive Durham, NC 27707 STOCKFINDER 5 WORKBOOK 2010 Worden
THE CM TRADING METATRADER 4 USER GUIDE:
 THE CM TRADING METATRADER 4 USER GUIDE: THE MAIN SCREEN Main menu (access to the program menu and settings); Toolbars (quick access to the program features and settings); Market Watch window (real-time
Bonus Points Promotion. Real-Time Snapshot Stock Quote Service
 Bonus Points Promotion Customers can now earn 1 Bonus Point for every HK$10 Brokerage Commission Paid for all securities trading orders executed via any of the Bank s trading channels. Bonus Points can
The Launchpad Strategy
 presented by Thomas Wood MicroQuant SM Divergence Trading Workshop Day One The Launchpad Strategy Risk Disclaimer Trading or investing carries a high level of risk, and is not suitable for all persons.
CFD Marketmaker v5.0 New Charting User Guide. 7 th June 2005 v1.2
 CFD Marketmaker v5.0 New Charting User Guide 7 th June 2005 v1.2 Contents Page Introduction...3 Charting...4 How to View a Chart... 4 Main Chart Window... 6 Date/Time & Value where the mouse is... 6 Value
ZNet XPress (Version )
") ZNet XPress (Version 1.0.6.3) KT ZMICO Securities Company Limited WWW.KTZMICO.COM Table of Content Beginning to access the Z Net XPress Programme 1 Stock Watcher 4 Derivative Warrants 12 Sale By Time 15
ZNet XPress (Version 1.0.6.3) KT ZMICO Securities Company Limited WWW.KTZMICO.COM Table of Content Beginning to access the Z Net XPress Programme 1 Stock Watcher 4 Derivative Warrants 12 Sale By Time 15
Bethesda Training Class Notes Julia Ormond
 Bethesda Training Class Notes Julia Ormond Helpful StockFinder Keyboard Shortcuts... Keep These in Mind (Page 1 of 1) Chart Shortcuts 1 1 Day Chart TimeFrame 2 2 Day Chart TimeFrame 3 3 Day Chart TimeFrame
1MarketView Discover Opportunities. Gain Insight.
 1MarketView Discover Opportunities. Gain Insight. 1MarketView is a State of the Art Market Information and Analysis platform designed for Active traders to help them spot opportunities and make informed
Trends. Define the term Trend Explain why Trend is important Identify Primary, Secondary, and Short-Term trends
 Trends Define the term Trend Explain why Trend is important Identify Primary, Secondary, and Short-Term trends 1 What is a Trend? Uptrend Prices rise and fall in Trends Trend is defined as: Up (Rising)
SCEPTRE TRADING A COURSE IN DAY AND SWING TRADING
 SCEPTRE TRADING A COURSE IN DAY AND SWING TRADING STOCK PRICE CHARACTERISTICS AND TRADING TECHNIQUES INTRODUCTION Overview of where we re going this week during the course Why use technical analysis to
VectorVest 7. Welcome. Product Support. System Requirements Minimum System Requirements:
 VectorVest 7 PDF Table of Contents VectorVest 7... 1 Welcome... 1 Product Support... 1 System Requirements... 1 Program Reference Manual... 2 Universal Settings & Applications... 2 Default Program Settings...
Software user manual for all our indicators including. Floor Traders Tools & TrendPro
 Software user manual for all our indicators including Floor Traders Tools & TrendPro All the software was designed and developed by Roy Kelly ARC Systems, Inc. 1712 Pioneer Ave Ste 1637 Cheyenne, WY 82001
QUICK START GUIDE: THE WIZARD FOREX
 : In this guide, we ll show you the four simple steps to trading forex with The Wizard. It s important to us that you understand what to do before you learn how to do it, because once you learn this simple
MotiveWave What s New in Version 6 Beta MotiveWave Software
 MotiveWave What s New in 2019 MotiveWave Software Table of Contents 1 Introduction... 2 2 Cloud Workspaces... 3 2.1 Synchronization... 3 2.2 Limitations... 3 2.3 Creating/Editing Cloud Workspaces... 3
Julia s Notes from Detroit
 Julia s Notes from Detroit September 2007 Overview of TeleChart and Blocks... 2 Downloading and Installing Blocks version 2... 4 Opening Personal Chartist... 4 Add Study... 5 Sorting by Stochastics...
Table Of Contents. Introduction. When You Should Not Use This Strategy. Setting Your Metatrader Charts. Free Template 15_Min_Trading.tpl.
 Table Of Contents Introduction When You Should Not Use This Strategy Setting Your Metatrader Charts Free Template 15_Min_Trading.tpl How To Trade 15 Min. Trading Strategy For Long Trades 15 Min. Trading
MT4 Supreme Edition Trade Terminal
 MT4 Supreme Edition Trade Terminal In this manual, you will find installation and usage instructions for MT4 Supreme Edition. Installation process and usage is the same in new MT5 Supreme Edition. Simply
JForex Quickstart Manual. v EN
 JForex Quickstart Manual v 14.12.2016 EN Table of Contents 1. Disclaimer... 1 2. Welcome to JForex and the Quickstart Manual... 2 2.1 What is JForex?... 2 2.2 How to use this manual?... 2 3. Starting JForex...
MINI TERMINAL User Guide
 MINI TERMINAL User Guide 1 CONTENTS 1. PLACING TRADES USING THE MINI TERMINAL 4 1.1 Placing buy/sell orders 4 1.1.1 Calculators 4 1.2 Placing pending orders 4 1.2.1 Placing pending orders directly from
An informative reference for John Carter's commonly used trading indicators.
 An informative reference for John Carter's commonly used trading indicators. At Simpler Options Stocks you will see a handful of proprietary indicators on John Carter s charts. This purpose of this guide
Monitor and trade different accounts and portfolios through one screen simultaneously
 WHAT IS ZAGTRADER? ZagTrader is the only region-wide Online Trading & Financial Analysis platform that provides the users the edge to understand market dynamics to better manage risk, spot potential opportunities
As soon as you are logged in, you will see the default screen, very similar to the one below:
 Page 1 of 6 As soon as you are logged in, you will see the default screen, very similar to the one below: This is the default layout of the platform. At the top, you will see several tabs which are clickable
Icoachtrader Consulting Service WELCOME TO. Trading Boot Camp. Day 5
 Icoachtrader Consulting Service www.icoachtrader.weebly.com WELCOME TO Trading Boot Camp Day 5 David Ha Ngo Trading Coach Phone: 1.650.899.1088 Email: icoachtrader@gmail.com The information presented is
Pull up the chart utilizing as much window real estate as possible.
 Darin s Trend Channel method as I understand it. I have Darin s ok as to sharing his method. So Darin if I have any of this wrong or you wish to add to it or make comments. Please feel free to make changes
Learning TradeStation. News, Time & Sales, Research, Browser, and Ticker Bar
 Learning TradeStation News, Time & Sales, Research, Browser, and Ticker Bar Important Information No offer or solicitation to buy or sell securities, securities derivative or futures products of any kind,
Learning TradeStation. Order-Entry Tools and Preferences
 Learning TradeStation Order-Entry Tools and Preferences Important Information No offer or solicitation to buy or sell securities, securities derivative or futures products of any kind, or any type of trading
V4.20. Bisnews Helpdesk :
 ก Apex@i V4.20 Bisnews Helpdesk : 02 637 5555 E-mail : helpdesk@bisnews.com This document contains information proprietary to Bisnews AFE (Thailand) Ltd. and may not be reproduced, disclosed or used in
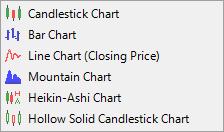
CHARTS. Bar Line Candlestick Charts are the basis of technical analysis They are a graphic display of price action. Notes:
 TECHNICAL ANALYSIS CHARTS Bar Line Candlestick Charts are the basis of technical analysis They are a graphic display of price action Candlestick charts have become the industry standard for technical traders.
Subject: Daily report explanatory notes, page 2 Version: 0.9 Date: Dec 29, 2013 Author: Ken Long
 Subject: Daily report explanatory notes, page 2 Version: 0.9 Date: Dec 29, 2013 Author: Ken Long Description Example from Dec 23, 2013 1. Market Classification: o Shows market condition in one of 9 conditions,
Introduction. Technical analysis is the attempt to forecast stock prices on the basis of market-derived data.
 Technical Analysis Introduction Technical analysis is the attempt to forecast stock prices on the basis of market-derived data. Technicians (also known as quantitative analysts or chartists) usually look
TRADE TERMINAL. Page 1 of 13
 v TRADE TERMINAL 1. Overview of the Trade Terminal... 2 1.1 Opening the Trade Terminal... 2 1.2 Components of the Trade Terminal... 2 2. Market watch... 3 2.1 Placing buy/sell orders... 3 2.2 Placing pending
TheWizardUniversity POWERSCANS FOR ETF S
 While the Simple Scan focuses on one, core strategy for finding ETF s, PowerScans offer several different options, ranging from conservative strategies with lower risk/reward to very aggressive strategies
The FX-Agency Advisor III. User Manual
 The FX-Agency Advisor III User Manual Brought to you by... System Requirements: For use of The FX-Agency Advisor III you will need a few things which you most likely already have or can get very easily.
Trend Channels: How to Identify Easy Profit-Making Opportunities Using Simple Chart Analysis
 Trend Channels: How to Identify Easy Profit-Making Opportunities Using Simple Chart Analysis Trend channels produce a very powerful trading technique. They are very visible, which makes them easy to utilize
Only trade this method when all of the following conditions exist:
 Objective: This method is based on Jesse Livermore s IPO breakout setup. It is conceptually a range breakout swing trading strategy with an objective of profiting from the momentum market anamoly during
Introduction. Technicians (also known as quantitative analysts or chartists) usually look at price, volume and psychological indicators over time.
 usually look at price, volume and psychological indicators over time.") Technical Analysis Introduction Technical Analysis is the study of market action, primarily through the use of charts, for the purpose of forecasting future price trends. Technicians (also known as quantitative
Technical Analysis Introduction Technical Analysis is the study of market action, primarily through the use of charts, for the purpose of forecasting future price trends. Technicians (also known as quantitative
Gambit Trading Suite Setup Guide. V2.31 PUBLIC BETA March 2017
 Gambit Trading Suite Setup Guide V2.31 PUBLIC BETA March 2017 Gambit Trading Suite - Intro The Gambit Trading Suite is a set of indicators developed in Pine script to be used on Tradingview.com. The goal
Trade Ideas A.I. Strategy Descriptions Revised : 10/04/2017
 Trade Ideas A.I. Strategy Descriptions Revised : 10/04/2017 The 5 Day Bounce The trigger for this alert has to cross above resistance while also making a 60 minute high on stocks that are trying to bounce
You can now seize market opportunities readily wherever you go with UTRADE on iphone, the trading app optimized for your iphone.
 Online trading made easy. Overview You can now seize market opportunities readily wherever you go with UTRADE on iphone, the trading app optimized for your iphone. UTRADE on iphone is available in the
On Our Technical Watch
 By the Kenanga Research Team l research@kenanga.com.my Figure 1: Daily Charting FBMKLCI Basic Data 52-week High 1,759.76 (in Million) 52-week Low 1,611.88 KLCI Vol 129.13 Current Level 1,740.60 Bursa Vol
Robert Roy's Power Hour Indicator Applied to TradeStation
 Author: Rick Maus Date: March 18, 2017 Version: 1.0 Version Description 1.0 Initial document. Robert Roy's Power Hour Indicator Applied to TradeStation Table of Contents Table of Contents... 1 Overview...
STREETSMART PRO MARKET DATA TOOLS
 STREETSMART PRO MARKET DATA TOOLS StreetSmart Pro Market Data Tools... 279 Watch Lists...280 Tickers...294 Top Ten...303 Options Top Ten...306 Highs & Lows...309 Sectors...313 279 StreetSmart Pro User
A Guide to Joe DiNapoli s D-Levels Studies Using GFT s DealBook FX 2
 A Guide to Joe DiNapoli s D-Levels Studies Using GFT s DealBook FX 2 Based on the book: Trading with DiNapoli Levels The Practical Application of Fibonacci Analysis to Investment Markets Important notice:
Technical Stock Market and Stock Analysis UCLA Extension
 Technical Stock Market and Stock Analysis UCLA Extension Date: February 4, 2012 Duration: Instructor: 9:00 AM - 4:00 PM Andrew Lais Investment Executive and General Principal Course Topics and Aim: This
Investoscope 3 User Guide
 Investoscope 3 User Guide Release 3.0 Copyright c Investoscope Software Contents Contents i 1 Welcome to Investoscope 1 1.1 About this User Guide............................. 1 1.2 Quick Start Guide................................
Price Action - The Footprint of the Money Judy MacKeigan - Buffy
 Price Action - The Footprint of the Money Judy MacKeigan - Buffy "What is Price Action?" is a frequently asked question by aspiring traders. Traders who ask, feel it is a well kept secret when all they
What is it really? Presentation to the Melbourne ATAA meeting 8 October, Technical Analysis What is it really?
 1 What is it really? What is it really? Presentation to the Melbourne ATAA meeting 8 October, 2009 The share market can seem mystical and almost like black magic; but with the right support and assistance,
Coaching Session FIVE
 Coaching Session FIVE Coaching Session FIVE Counter-Trend Trade Set-Ups Program Summary Trading Plan Execution The Master Trader Powerful Price Pattern Trades Trade Management Initial Trend Entry Trading
BY JIM PRINCE
 No part of this publication may be reproduced, stored in a retrieval system, or transmitted in any form or by any means electronic, mechanical, photocopying, recording, or otherwise without the prior permission
And Training Manual. Version 1.1. P a g e 1 22
 And Training Manual Version 1.1 P a g e 1 22 Contents 1 Workspaces 3 2 Watchlist.. 5 3 Graphs.. 8 4 Order Entry 11 5 Linking Panels Together 16 6 Blotter (Positions, Trades, Orders, Order Book).. 17 7
CHONG HING SECURITIES
 CHONG HING SECURITIES NEW IWEB USER GUIDE Version 1.2 Table Of Contents 1. LOGIN... 4 2. LOGOUT... 5 3. NAVIGATION MENU... 7 3.1 Streaming Version... 7 3.2 Snapshot Version... 8 4. LANGUAGE... 9 5. ON
CHONG HING SECURITIES
 CHONG HING SECURITIES NEW IWEB USER GUIDE Version 1.5 Table Of Contents 1. LOGIN... 4 2. LOGOUT... 5 3. NAVIGATION MENU... 7 3.1 Streaming Version... 7 3.2 Snapshot Version... 8 4. LANGUAGE... 9 5. ON
MT4 Advanced USER GUIDE
 MT4 Advanced USER GUIDE 1 TABLE OF CONTENTS 1. MINI TERMINAL... 03 2. TRADE TERMINAL... 07 3. ALARM MANAGER...15 4. EXCEL RTD... 32 5. MARKET MANAGER... 41 6. CORRELATION MATRIX... 47 7. CORRELATION TRADER...
Intraday Multi-View Suite (IMV) For Stocks and Futures
 For Stocks and Futures") Intraday Multi-View Suite (IMV) For Stocks and Futures Release Notes Thank you for purchasing the PowerZone Trading IMV custom indicator suite for TradeStation. The following notes are intended to act
Intraday Multi-View Suite (IMV) For Stocks and Futures Release Notes Thank you for purchasing the PowerZone Trading IMV custom indicator suite for TradeStation. The following notes are intended to act
Order Entry Tools. For. Futures DayTraders. (and maybe stocks also)
") Order Entry Tools For Futures DayTraders (and maybe stocks also) Order Entry Tools for Futures DayTraders If you are a daytrader, especially in Futures, how you place and manage your orders is crucial
Order Entry Tools For Futures DayTraders (and maybe stocks also) Order Entry Tools for Futures DayTraders If you are a daytrader, especially in Futures, how you place and manage your orders is crucial
Trading Platforms-Liquidity-White Label-Management Systems
 Trading Platforms-Liquidity-White Label-Management Systems WORLD CLASS TRADING PLATFORM PROVIDER Brokers Introducing Brokers Forex Training Schools Hedge Funds & Money Managers PROVIDING OPPORTUNITY INTRODUCTION
2GoTrade Limited. New Web Trading Platform. User Manual. Version:1.57
 2GoTrade Limited New Web Trading Platform User Manual Version:1.57 Last Update:Mar-2015 CONTENT GENERAL... 2 1.1 SELECT LANGUAGE... 2 1.2 CUSTOMER SERVICE... 2 1.3 LOGOUT... 3 1.3.1 Login... 3 1.4 FIRST-TIME
Morningstar Direct SM Cloud Release January 2016
 Morningstar Direct SM Cloud Release January 2016 The Morningstar Direct team is pleased to announce the latest updates to Morningstar Direct. In this release, you ll find new enhancements to Morningstar
GoTrade. IPhone & Android. Mobile App Guide. Ver Copyright GoTrade Limited. All rights reserved.
 GoTrade IPhone & Android Ver..0.0 06 GoTrade Hotline: +85 000 E-mail: cs-hk@gotrade.com Copyright 06 GoTrade Limited. All rights reserved. Contents Introduction, Buttons & Quoting Plans Download & Login
FUTURESOURCE TRADER 1 WELCOME 6 THE FUTURESOURCE TRADER WINDOW 7. Changing Your Password 8. Viewing Connection Status 8 DOMTRADER 9
 FutureSource Trader FUTURESOURCE TRADER 1 WELCOME 6 THE FUTURESOURCE TRADER WINDOW 7 Changing Your Password 8 Viewing Connection Status 8 DOMTRADER 9 Adding a DOMTrader 9 DOMTrader Components 10 Title
Technicals & Time Frame
 Advanced Charting Neither Better Trades or any of its personnel are registered broker-dealers or investment advisers. I will mention that I consider certain securities or positions to be good candidates
Copyright 2012
 What is RangeBox Trader Expert Advisor for Metatrader 4 platform that will open trade(s) when currency price reach high/low level of the last range box. You need to set desired start and end hours of the
Written by Rahul Mohindar
 Your complete guide for using the ATM PowerScreener & RMO ATM add-on for MetaStock Written by Rahul Mohindar Copyright 2016 VIRATECH SOFTWARE & COMMUNICATIONS LTD. Disclaimer The ATM PowerScreener Product
Daily Technical Trader Qatar
 Daily Technical Trader Qatar Monday, 20 November 2017 Today s Coverage Ticker Price Target BRES 28.50 29.45 QSE Index Level % Ch. Vol. (mn) Last 7,827.50 0.02 1.6 QSE Index (Daily) QSE Summary Market Indicators
 Types of charts Bar charts Candlestick charts Constant volume charts Line charts Tflow charts, exclusively CQG Bar Charts Vertical line representing the high and low of the sessions Horizontal line on
Chapter 3. Price Action
 Chapter 3 Price Action The movement of price in any market is called Price Action. This movement is caused by the beliefs and trading systems of hundreds of thousands of worldwide traders that the market
1. Placing trades using the Mini Terminal
 Page 1 of 9 1. Placing trades using the Mini Terminal 2 1.1 Placing buy/sell orders 2 1.2 Placing pending orders 2 1.2.1 Placing pending orders directly from the chart 2 1.2.2 OCO orders 3 1.3 Order templates
ShareChart User s Guide February Disclaimer
 Sharechart ShareChart User s Guide February 2011 Disclaimer ShareChart is share technical analysis software aiming at providing investors and/or traders a useful tool in analysing shares. It does not take