VectorVest 7. Welcome. Product Support. System Requirements Minimum System Requirements:
|
|
|
- Edward Brice Maxwell
- 6 years ago
- Views:
Transcription
1 VectorVest 7 PDF
2
3 Table of Contents VectorVest Welcome... 1 Product Support... 1 System Requirements... 1 Program Reference Manual... 2 Universal Settings & Applications... 2 Default Program Settings Tabs Best Practices Timing the Market Strategies for Success Bottom Fishing Strategies for Bear Markets Managing Your Portfolio Searches Glossary Index i
4
5 VectorVest 7 Welcome Welcome to VectorVest RealTime, the fastest, smartest, friendliest stock analysis and graphics program available to individual investors. VectorVest RealTime sorts, screens, searches, ranks and graphs thousands of stocks in a matter of seconds. Our proprietary indicators provide you with a unique comprehensive analysis that combines both the fundamental and technical aspects of over 8,300 U.S. traded stocks. Product Support We're here to help you succeed. If you have any problems or questions using VectorVest RealTime, please call our RealTime Support Hotline at If you live outside the U.S., you can reach us at Product Support is available from 7:00 AM to 11:00 PM Eastern, Monday through Friday, and Saturday from 9:00 AM to 5:00 PM. We will also return voic messages as soon as possible during normal hours of operation. If we cannot fix your problem immediately, a technical expert will call you back within 24 business hours. You can also our Product Support staff for a prompt response at support@vectorvest.com. System Requirements Minimum System Requirements: Supported Operating Systems. Windows Vista or Windows XP (Service Pack 2 or higher). Processor: 800MHz CPU. RAM Memory: 512 MB RAM. Display: Video Card supporting Microsoft DirectX 8.0 or higher and Monitor that supports 1024x768 resolution. Internet Connection: VectorVest RealTime can run on a 56k dial-up connection. Hard Disk: Up to 500 MB of available space may be required. 1
6 Recommended System Requirements: Processor: 2.0GHz or faster. VectorVest RealTime runs best with Dual-Core and Quad-Core Processors RAM Memory: 1 GB or higher. Display: Video Card supporting DirectX 9.0 or higher and Monitor that supports 1280x1024 or higher resolution with 32-bit color. Internet Connection: A high-speed connection such as DSL, cable, etc., is strongly advised. Hard Disk: 1 GB of available space. Program Reference Manual Universal Settings & Applications Program Icons The following legend will assist you in identifying icons and symbols that are commonly used throughout the VectorVest RealTime Program: Close: The Close Icon allows you to close any window you are viewing. Custom Field Builder: The Custom Field Builder icon is located in the upper right corner of the main screen, and is viewable from any section of the program. The Custom Field Builder will allow the user to create unique formulas and combinations using the VectorVest fields. Click here for a complete description of this feature. Detach Icon: The Detach Icon will allow you to detach the item viewed so that it resides in a separate window. The window can then be moved to another location on the screen. The Detach Icon can be found on Graphs, Dashboard Gadgets and Home Page Gadgets, as well as the Home, Viewers, Views, and UniSearch Tabs. 2
7 VectorVest 7 PDF Fill Mode Icon: The Fill Mode Icon will maximize the graph display area by hiding the Local Graph Toolbar, Graph Shortcuts and Graph Markers. Group Icon: The Group Icon resembles a folder, and provides a way to categorize WatchLists and Searches. Configure Icon: The Configure icon resembles a wrench, and can be found in almost every section of VectorVest RealTime. This icon allows you to customize an item's settings. Resizing Handle: The Resizing Handle is a series of five dots which allow the user to stretch or shrink the viewing area. To change the viewing area, simply place your cursor over the dots, hold down the left mouse button and drag the bar in the direction you would like the area to move. Scroll bar:the scroll bar can be vertical or horizontal. Click on the arrows at either end to move the screen in the direction of the arrow, or click in the empty area between the arrow and the scroll bar. Show/Hide Arrows: The Show/Hide arrows indicate a panel or directory that can be displayed or hidden from view. Click the arrows or click the item's title bar to show or hide the item. 3
8 Sizing Window Frames The VectorVest RealTime screen is divided into frames, making it easy to change the viewing area of each frame. The Resizing Handle, a series of five dots, can be found along the edge of each frame. To change the viewing area of a frame, move your cursor over the Resizing Handle (your cursor will change to a double-headed arrow), hold down the left mouse button and move the mouse in the same direction you would like the window frame to move. Using the Date/Time Control The Date/Time Control is found throughout VectorVest RealTime, and allows you to select the date and time of the information displayed. At some point, you may select a past date or time in Viewers, QuickTest, or UniSearch. This will stop the information from ticking in real time, but does not disconnect the 4
9 VectorVest 7 PDF datafeed. To bring the status back to RealTime, use the RealTime Button located on the Local Toolbar, or click here for more details about the program's connection status. Selecting the Market Open or Close: Clicking "<< Open" will change the time to 9:30 AM ET on the date shown, or 8:00 AM ET if extended hours have been enabled.. Clicking "Close >>" will change the time to the 4:00 PM ET on the date shown, or 8:00 PM ET if extended hours have been enabled. Changing the Date: 1. To change the date or time, access the calendar by left-clicking on the date and time shown. The calendar and time clock will appear 2. To change the year, left-click on the year shown at the top of the calendar, and select the year of your choice. Intraday (minute-by-minute) data will be available for the five most recent trading days. Dates that have intraday data will be displayed on the calendar in bold. Selecting a date prior to this time period will display end of day data. Changing the Time: 5
10 1. To change the time, access the time clock by left-clicking on the date and time shown. The calendar and time clock will appear. 2. Use the up and down arrow controls surrounding the clock to increase or decrease the hour and minutes displayed. The I< clock control will automatically change the time to 9:30 AM ET, and the >I clock control will change the time to 4:00 PM ET. When extended hours have been enabled the market open will reflect 8:00 AM ET, and the market close will be displayed as 7:59 PM ET. The time control is only available when viewing data from the last five trading days. Custom Field Builder Custom Fields can be used to filter and sort Viewers, Watchlists, and Searches. The Custom Field Builder Icon is located in the right corner of the program, next to the Alerts Button. This icon is viewable from every section of the program, and will allow you to create unique formulas and combinations using the VectorVest fields. 6

11 VectorVest 7 PDF Creating A Custom Field: 1. Click in the empty box beneath the words "Enter Custom Field Definition". 2. Use the "Fields..." button at the bottom of the window to select your first indicator (i.e. VST, RS, RT, EPS, DIV, Volume, etc.) The indicators will be grouped into the following categories: Capital Appreciation: VST, Value, RV - (Relative Value), RS - (Relative Safety), RT - (Relative Timing), GRT - (Earnings Growth Rate), EY - (Earnings Yield), EPS (Earnings Per Share), P/E - (Price to Earnings Ratio), GPE - (Growth to P/E Ratio), P/S - (Price to Sales Ratio), SPS - (Sales Per Share Ratio) and CI- (Comfort Index). Dividend Analysis: DIV - (Dividend Paid), DY - (Dividend Yield), DS - (Dividend Safety), DG - (Dividend Growth) and YSG - (Yield Safety Growth Vector). Price/Volume: Price - Split Adjusted, Stop Price, Open - (Day's Open), High - (Day's High), Low - (Day's Low), Volume - (Shares Traded) (Day), AvgVol - (50 day moving Average Volume), Range (Day), %PRC (Percent Price Change), %Vol (Percent Volume Change), Change (Dollar Price Change), Price - Actual, Range 7
12 (Minute), Volume - (Minute's Volume), Open - (Minute's Open), High - (Minute's High) and Low - (Minute's Low). Sales/Market Capital: Shares - (Outstanding (Millions)), Sales - (Yearly Sales-($Millions), MktCap - (Market Capitalization - ($Millions) and Sales GRT - (Sales Growth). VectorVest Fields: Contains many formulas and field combinations that have already been created by VectorVest. My Custom Fields: Contains the formulas and field combinations that have already been created by the user. 3. Select, or type, the mathematical operator you would like to use in the custom field. The mathematical operators available are listed to the right of the "Fields..." button and include multiplication (*), division (/), addition (+), and subtraction (-). Parentheses may be used to define the order of operations. 4. Repeat steps 2 and 3 until the custom field is complete. 5. Click "Finish" when the custom field is complete, or click "Apply" to begin creating the next custom field. The "Validate" button may be clicked to verify whether or not the mathematical expression is valid. The Dashboard The Dashboard conveniently enables you to access and track up to three items, or Gadgets, at a time while navigating throughout the program. The Dashboard is shown at the bottom of the screen and can be hidden from view with a single click. By default, the RealTime Dashboard will display a Newsfeed of the Top Market Stories from Yahoo! Finance, a MiniGraph of the VVC, and a QuickList tracking the DJI, IXIC, SPX, and VVC. Each of these Gadgets may be customized to your preference or replaced with other available Gadgets. Available Gadgets include: Color Guard, Market Timing Gauge, QuickLists, News, Strategy, Top Items, VectorVest at a Glance, Standard MiniGraph, Advances/Declines, and Portfolio MiniGraph. Click on the Gadget listed to view its description. Changing Gadget Settings: Each Gadget can be customized by clicking the Settings Icon on the Gadget's Title Bar. The options will vary according to the Gadget selected. 8
13 VectorVest 7 PDF Detaching Dashboard Gadgets: Detaching a Gadget will allow it to be viewed independently of the Dashboard. The detached gadget can be moved to another area of the screen, or to an additional monitor. To detach a Dashboard Gadget click the Detach Icon on the Title Bar of the Gadget you would like to detach. Re-attaching Dashboard Gadgets: To return a detached Gadget to the Dashboard, click the 'X' on the Gadget's Title Bar. Removing Dashboard Gadgets: To remove a Gadget from the Dashboard click the 'X' on the Title Bar of the Gadget you would like to remove. 9

14 Selecting New Dashboard Gadgets: To select new Dashboard Gadgets, first remove the ones you no longer want to view, then click the Configure Icon located on the Dashboard Title Bar. Select the new Dashboard Gadget from the list. Note: The Settings Icon will not be visible unless there is an available space on the Dashboard. Showing or Hiding the Dashboard: To Hide the Dashboard, click once on the Title Bar, or on the double arrows located in the right corner. The dashboard will be minimized to the bottom of the screen. To show the Dashboard again, click the Title Bar, or use the show/hide arrows again. Connection Status The Connection Status is displayed at the bottom of the VectorVest RealTime Screen. The datafeed may be toggled on or off according to your preference by double clicking on the Connection Status Button. Regardless of whether the status is connected or disconnected the user will need to remain connected to the internet to use the RealTime program. The time of the last tick will be displayed at the bottom left of the screen. 10

15 VectorVest 7 PDF You may select a past date or time in Viewers, QuickTest, or UniSearch. This will stop the information from ticking in real time, but does not disconnect the datafeed. To bring the status back to RealTime, use the RealTime Button located on the Local Toolbar. Alerts Alerts provide you with portfolio automation messages, as well as important notices from VectorVest regarding the RealTime program. To learn more about Portfolio Automation Alerts, see Edit Automation and Set Automation. The Alerts button is located in the top right corner of the program. The Alerts button will be 'lit' when there are new messages waiting to be read. New alerts will appear briefly on the screen. To view the entire message, left-click on the "Alerts" button, and click the message name to display it and mark it as read. Alerts will remain in the program until they are read, and the program is closed and reopened. Click the 'X' to close the Alerts Manager Window, or simply click the 'Alerts' button.. 11

16 Sizing Columns Each tab uses a grid format to display stock, industry or sector information. Any column of information may be expanded to display the complete field, or narrowed to give other columns more room, by dragging the separation bar that is located between column headings. Place the mouse cursor on the line separating column names, the cursor will change to a double-headed arrow. Drag the cursor to the right to expand, or the left to narrow, the column. You may reset columns to their default size by right-clicking on the column heading and selecting 'Autofit', or by right-clicking anywhere on the Viewer Grid and selecting "Autofit all Columns". Changing Tick Colors The up tick and down tick colors in each viewer grid may be individually customized according to a specific column and viewer. 12
17 VectorVest 7 PDF To change the up/down tick color of a single column, right-click on the column heading, and select "Column Settings". Click "Foreground Color..." to change the text color. The background color of a specific column and viewer may also be changed here by unchecking the "Transparent' selection box, then left-clicking on "Background Color..." Default Program Settings Program Settings Window The Program Settings Window enables you to set the default selections used for the Home Page, Dashboard, Graphs, Portfolios and Quickfolios. You may also change the Program's color scheme from this window. Accessing the Program Settings Window: Click the Settings Icon, located next to the Alerts button, in the top right corner of the program. 13
18 Using the Program Settings Window: The Program Settings Window has three main tabs. Click the desired tab to make your selections. Any changes made in the Program Settings Window will not take affect until the 'Apply' or 'OK' Button is clicked. Restoring the Original Program Defaults: Each Tab includes individual options for restoring selections to the original VectorVest layout, but the Restore Defaults Button, located at the bottom left of the Program Settings Window, will restore all the original options for all the tabs, with the exception of the HomePage and Dashboard Layouts. Clicking 'OK' or 'Cancel' will close the Program Settings Window. The General Settings Tab: Default General Settings 14

19 VectorVest 7 PDF The General Settings Tab allows you to set the default selections used for themes, extended hours, and disabling the dashboard. This tab will also allow you to restore the HomePage and the Dashboard to the original VectorVest layout. To access the General Settings Tab, first access the Program Settings Window by clicking the Settings Icon, located next to the Alerts Button, in the top right corner of the program. The Program Settings Window will open with the General Tab displayed. Click "Apply" to complete any changes. Extended Hours: This option will display trading information that occurs prior to the market open (8:00 AM-9:30 AM ET), and after the market close (4:00 PM- 6:30 PM ET). To display extended hours information, click the selection box next to Extended Hours. Uncheck the selection box to hide extended hours information. By default, the extended hours information will not be displayed. Enable/Disable the Dashboard: This option allows the user to completely remove the Dashboard from the bottom of the screen. To disable the Dashboard, remove the check mark from the selection box next to Use Dashboard. By default, the 15
20 dashboard will be displayed and may be hidden or minimized at any time by using the show/hide arrows, or clicking on the Dashboard Title Bar. Changing Program Themes: Themes are color schemes that you can apply to VectorVest RealTime. Here, a general theme may be selected for use in the entire program. By default, the selected color scheme for the program is RealTime. This color scheme may be changed by using the drop down arrow next to the selection box to choose a different theme. The Classic theme uses a white display background, while the RealTime theme uses a black display background. Colors used for Graphs and Viewers may be customized independently using layouts. Selecting individual colors for Viewers or Graphs, will result in a Custom theme. Restore the Default Theme: Clicking the Restore Defaults Button, located directly below the Theme selection box will restore the program theme to the original RealTime color scheme. Restore the HomePage Layout: This button will restore the HomePage to the original VectorVest layout. Click "Restore HomePage Layout", then click "Yes" to confirm the change, or "No" to cancel. Restore the Dashboard Layout: This button will restore the Dashboard to the original VectorVest layout. Click "Restore Dashboard Layout", then click "Yes" to confirm the change, or "No" to cancel. Rest Default Graph Settings: Default Graph Settings 16

21 VectorVest 7 PDF Default Graph Settings allow you to set default selections for graph themes, markers, cursors, time frames, and more. To access the Default Graph Settings Tab, first access the Program Settings Window by clicking the Settings Icon, located next to the Alerts Button, in the top right corner of the program, then click the Graph Tab. You may also access these settings by clicking the Graph Tab on the Main Menu Bar, then clicking the Settings Icon to the right of the Tab Label. Markers: Graph Markers bring significant information to the user's attention. There are eight markers included in the VectorVest Program, including Real Time, High-Low, Splits, Previous Close, Market Calls, Dividends, REC Changes, and Log Scale. To choose default graph markers, click in the selection box next to the graph marker(s) you would like to be automatically displayed on the graph. Click "Apply" to complete any changes. For a complete description of each marker, click Graph Markers. 17
22 Other Settings: Other Settings allow the user to enable MultiView graphs, and graph tabs, as well as change several display aspects that affect the graph margin, line thickness, menu orientation, scaling, and labels. Click "Apply" to complete any changes. Axis Separator Thickness will determine the width of the lines that separate the main graph and the sub graphs. Click the up arrow to increase the thickness of the graph separator, and the down arrow to decrease it. The default thickness is set to 1. Line Thickness will change the width of the actual parameter displayed on the graph. Click the up arrow to increase the thickness of the parameter shown, and the down arrow to decrease it. The default thickness is set to 1. This setting is only applicable for line graphs. Right Margin allows you to specify an empty area at the right edge of the graph to clearly delineate the last viewable data point. Click the up arrow to increase the right margin, and the down arrow to decrease it. The default margins are set to 0 so the graph will be displayed from edge to edge. Grid Orientation will change whether the Parameter List is displayed on the right or the left side of the graph. The VectorVest default display is Right of Graph. To change this selection, use the drop down arrow to select "Left of Graph". When viewing a graph, the Parameter List can be completely hidden by using the show/hide arrows. Allow Multiple Tabs enables you to use separate tabs when graphing securities. Each tab may also be detached from the main program to be viewed in a separate window. This feature also activates MultiView, which allows you to view up to four side-by-side graphs, in a single window. To enable this option, check the selection box next to "Allow Multiple Tabs". This setting is not selected by default. Click here for more information on viewing multiple graphs. Anti-Aliasing will improve the appearance of the lines displayed on a graph, but may result in decreased display speed. To choose this 18
23 VectorVest 7 PDF option, check the selection box next to Anti-Aliasing. This setting is not selected by default. Axis Titles label the parameters displayed in the main graph, and sub-graph(s). For example, Price, RT (Relative Timing), and Volume are displayed by default, the axis title would be located at the top left corner of each graph section. This setting is already selected by default. To hide the axis titles, uncheck the selection box next to Axis Titles. Watermarks are displayed in the background of each graph to provide the ticker symbol (main watermark), company name, and industry/sector information. All watermark labels are displayed by default. To hide a watermark label, uncheck the selection box next to the desired watermark. Cursor Settings: Cursor Settings allow the user to choose the type of cursor that is initially displayed for use on the local toolbar of each graph. By default, the dateline cursor is selected. Also by default, this cursor will not be active, i.e. displayed on the graph. To activate a cursor by default, read the options listed below. Click "Apply" to complete any changes. Save Cursor on Change remembers and activates the same cursor that was last selected upon opening each successive graph. Check the selection box next to "Save Cursor on Change" to use this option. Cursor Type is not available when "Save Cursor on Change" is selected. Cursor types include: Crosshair Cursor: Displays price and time/date information along the vertical and horizontal axis of the graph, respectively. This information is reflective of the close of the day or the close of the bar selected. This is a dynamic cursor that will automatically track and display information based on the movement of your mouse. Additional parameter values will be displayed in the parameter list. Horizontal Cursor: Displays price information along the horizontal axis of the graph. This is a dynamic cursor that will track and display information based on the movement of your mouse. Vertical Cursor: Displays time/date information along the vertical axis of the graph. This is a dynamic cursor that will track and display 19
24 information based on the movement of your mouse. Additional parameter values will be displayed in the parameter list. DateLine Cursor: Information will be displayed in the Parameter List. This is a static cursor. Left click on the desired data point to display the information for the date/time selected. Cursor Active enables the user to select a single default cursor that will be automatically activated upon opening each new graph. This option is not available when "Save Cursor on Change" is already selected. To enable this selection, check the selection box next to "Active Cursor" and use the drop down arrow next to "Cursor Type" to make your cursor selection. Default Time Frame: The Default Time Frame section allows you to customize the default graph options for the type, frequency, and time span of the data displayed. Click "Apply" to complete any changes. Type allows the user to select from Intraday, End of Day, End of Week, or Weekly data as the initial data type. By default, Intraday data will be selected. To change the selection, click the drop down arrow beside Type and select from the drop down menu. Frequency allows you to define the number of minutes between data points. This selection is only available for Intraday data. By default, 1 minute will be selected. Click the drop down arrow next to the selection box to select a different default frequency. Span enables you to choose the amount of data initially displayed on the graph. In addition to numerous predefined time frames, the "Best Fit" selection will determine the time span needed for optimal display based on the user's screen resolution. By default, 1 day is selected. Click the drop down arrow next to the selection box to select a different time span. Restore Graph Defaults: Click the "Restore Defaults" button, located on the Graph Settings Tab (the button is located in the middle of the Graph Settings Tab, toward the bottom), to restore the program's original default graph selections and colors. 20

25 VectorVest 7 PDF Graph Theme: Themes will allow you to make changes to the colors used in selected areas of the graph, including the background, axes, labels, grid lines, watermarks, extended hours, and market calls. To access graph themes, click "Theme" on the left panel of the Graph Settings Tab. Select a pre-designed theme from the drop down list, or create a custom theme by selecting colors for each of the areas listed. Click the drop down arrow to the right of the area you would like to change and use the chart to select a new color. Click "Apply" to complete any changes. Default Portfolio Settings: Default Portfolio/Quickfolio Settings Portfolio Settings allow the user to set the default selections used when creating a new portfolio or QuickFolio. These selections include the initial investment, in addition to selections for commission, margin, and interest. To access the Default Portfolio Settings Tab, first access the Program Settings Window by clicking the Settings Icon located 21

26 next to the Alerts Button in the top right corner of the program. Then click the Portfolio Tab. You may also access these settings by clicking the Portfolio Tab on the Main Menu Bar, then clicking the Settings Icon to the right of the tab label. Make your selections for each Portfolio option, then click "Apply" to complete your changes. Setting QuickFolio Defaults: Select QuickFolio from the left panel on the Portfolio Settings Tab and make your selections for each of the options listed. Click "Apply" to complete your changes. Tabs About Tabs Seven tabs represent the main sections of the VectorVest RealTime Program; Home, Viewers, Graphs, UniSearch, Portfolios, Views and Help. These tabs allow you to navigate to any part of the program with a single click. Most tabs can be detached, and the information displayed on a tab will remain even as you move to other areas of the program. *Please note that the Derby tab is a plug-in that is purchased separately. Home The HomePage 22
27 VectorVest 7 PDF The VectorVest RealTime HomePage keeps you up-to-date on continually changing market conditions and their investment impact. The Home Tab is completely customizable, with gadgets ranging from the Color Guard Gauge to breaking news headlines. Keep it simple, or add as many Gadgets as you like! Detaching the HomePage The HomePage may be detached from the rest of the program by clicking the Detach Icon located to the right of the tab label. To return the HomePage to the main program window, click the 'X' in the top right corner of the detached window. 23
28 Adding New Gadgets to the HomePage: Adding HomePage Gadgets New Gadgets may be selected by clicking the Settings Icon located to the right of the tab label. The Gadget Selector will appear at the top of the screen, showing each available item. Placing your mouse directly over the gadget image will display a description of the gadget. Left-clicking on the Gadget will add the Gadget to the top left corner of the HomePage. You may select the same Gadget multiple times. For example if you wanted to track the Top VST Stocks, the Top RT Sectors, and the Top RT Industries, you would need to select the Top Items Gadget three times, then customize each one. Clicking on the Settings Icon again, will close the Gadget Selector. You can also close the Gadget selector by clicking anywhere on the HomePage. There is no limit to the number of Gadgets you can add to the Homepage. If more Gadgets are added than can be viewed on the current screen, a scroll bar will appear on the right. 24
29 VectorVest 7 PDF Detaching Gadgets An individual Gadget may be detached from the HomePage or Dashboard by clicking the Detach Icon on the Gadgets Title Bar. Closing a detached Gadget ("X") will return the Gadget to its original location on the HomePage or Dashboard. 25


30 Removing Gadgets To remove a Gadget from the Dashboard or HomePage click the Close Icon the Gadget's Title Bar. on Moving Gadgets Gadgets on the HomePage and the Dashboard can be arranged in any order by dragging and dropping. Dragging a Gadget to a New Location: 1. Place the cursor on the Gadget's Title Bar. The cursor will change to a four directional arrow. 2. Hold down the left mouse button on the Title Bar. 26


31 VectorVest 7 PDF 3. Move the mouse to the desired location. 4. Release the left mouse button. Changing Gadget Settings Many of the HomePage and Dashboard Gadgets can be customized. To change a Gadget's settings left-click the Settings Icon located on the Gadget's Title Bar. If the Title Bar does not have a Settings Icon, the Item can not be changed. 27
 Price, RT (Relative Timing), and BSR (Buy/Sell Ratio) on a day-over-day and week-over-week basis.")
32 Gadget Descriptions Color Guard The Daily Color Guard is intended to accurately describe the direction and strength of the stock market on a daily basis. This is accomplished by tracking the movements of the VVC (VectorVest Composite) Price, RT (Relative Timing), and BSR (Buy/Sell Ratio) on a day-over-day and week-over-week basis. The movement of these indicators will result in a red, green, or yellow 'light' on the Color Guard, graphically representing the changing trend. The letters found on each 'light' represent the color code, "Y" for Yellow, "G" for Green, and "R" for Red. For a detailed explanation of the VectorVest Color Guard click here. In addition to the Color Guard information, the status of the MTI, the Market Trend, and the status of VectorVest's Confirmed Market Call will also be displayed and updated every 5 seconds throughout the trading day. This Gadget is customizable. The Settings Icon allows you to change the window length (small or medium), and whether or not the numerical values of the Color Guard Indicators are displayed next to the color code. 28


33 VectorVest 7 PDF Market Timing Gauge The Market Timing Gauge reflects the current status of the VectorVest Color Guard, and lets you know whether the market is Bullish, Bearish, or Neutral. When there is one red light on the Color Guard, the needle will be pointing one notch into the red zone, two red lights would be two notches in the red zone, etc. Next to the gauge will be the interpretation of this information. This Gadget can not be customized. QuickLists QuickLists display the price, dollar and percent change for a customizable list of stocks and indices. 29

34 Right-clicking on any stock in the QuickList enables you to choose from a menu of options that include: View Stock News, View Historical Data, View Stocks in Industry Group, View Stocks in Business Sector, View Industries in Business Sector, QuickTest, Add To Watchlist, Delete Item, View Stock Graph, View Industry Graph, and View Sector Graph. A stock may also be dragged from the QuickList and dropped into any viewable WatchList, MiniGraph, Newsfeed, or even another QuickList. This Gadget is customizable. Left-clicking the Settings Icon allows you to add their own selections to the list. Symbols can be removed from the QuickList by right-clicking on the symbol, and selecting "Delete Item".. News The News Gadget displays breaking headlines for a particluar security or index. Articles are provided by Yahoo! Finance and may be viewed by clicking on the headline. This Gadget is customizable. Left-clicking the Settings Icon allows you to select the type of news received. News choices include stock news (for a specific symbol), US Market News, Earnings, Top Stories, and Upgrades and Downgrades. You may type a specific symbol or company name into the selection box for Stock News, or they may drag a stock from any Viewer or QuickList and drop it directly into the News window. The news feed will automatically display any new headlines every five minutes, or can be refreshed manually by left-clicking the Settings Icon, and then the "Refresh" button. Multiple news feeds may be added to the HomePage and Dashboard. 30

35 VectorVest 7 PDF Strategy The Strategy section is a daily market review that contains guidance for both prudent and aggressive investors. This section is updated on a daily basis by 8:00 PM ET. VectorVest addresses three types of investors here: 1. Prudent Investors who prefer to buy fundamentally sound stocks and hold them for the long-term. We recommend they go bargain hunting at the beginning of market upturns. They should refrain from buying stocks, protect profits and accumulate cash during Bull Market downturns. They should sell stocks and hold cash during Bear Markets. Bull and Bear Markets are identified in the VectorVest Investment Climate. 2. Aggressive Investors and Traders who buy and sell stocks on a short-term basis with little regard to fundamentals. They are dedicated to using technical analysis to identify entry and exit points for their trades. We suggest they buy stocks long at upturns and sell stocks short at downturns as signaled by the Color Guard Report. We also suggest that they base their trading decisions on what the market is doing at the moment of the trade. These investors should use the Bull and Bear Market scenarios cited in the Investment Climate as background information only. 3. Riding the Wave Investors who are using the VectorVest Market Timing System to identify when to buy and sell stocks. They use VectorVest Strategies to select which stocks to buy long or sell short and the VectorVest Portfolio Manager to manage their portfolio. We example this technique with a Model Portfolio by buying stocks at upturns and selling stocks short at downturns. The Model Portfolio is intended to be used for illustration purposes only and can be found in our end of day program.. 31

36 This Gadget is customizable. Left-clicking Settings Icon allows you to change the length of the window display. The Strategy Toolbar: The Page Icon allows you to move to the next 'page' by clicking the arrows beside the page numbers. The Scroll Icon allows you to scroll through the Strategy information from beginning to end, rather than click the arrows. The Text Size Slider allows you to increase or decrease the font size of the Strategy section. Drag the slider to the right to increase the text size, or to the left to decrease the text size. You may also click the + or - buttons on either side of the slider to change the text size. Top Items Top Items displays the top five VST-Stocks, RT Industries or RT Sectors. The information displayed will include the Security Name, Symbol (stocks only), RT (Relative Timing) or VST (Value, Safety, Timing-Vector), Price, $ Change and % Change. Price information will be updated on a tick-by-tick basis for stocks, and every 5 seconds for Industries and Sectors. By default, the list of Top Items will automatically refresh every five minutes allowing the order of items to change and new items to appear in the list. 32
, as well as the refresh rate (from 1-5 minutes).")
37 VectorVest 7 PDF This Gadget is customizable. Left-clicking the Settings Icon allows you to select which top items to view (stocks, industries or sectors), as well as the refresh rate (from 1-5 minutes). you may also refresh the Top Items manually by clicking the "Refresh Now" Button on the Settings Toolbar. VectorVest at a Glance VectorVest at a Glance includes a bar chart representing the number and percentage of Buy and Sell Recommendations currently in the program. Relating the number of stocks receiving Buy Recommendations to the number of stocks receiving Sell Recommendations enables you to gauge the underlying strength of a rally or correction. This Gadget also displays the current level of all the market timing indicators in the Market Profile. 33


38 This Gadget updates every five seconds and is not customizable. Standard MiniGraph The Standard MiniGraph tracks the price performance of any security, industry, sector or market timing indicator. Stock information will update in RealTime, while group and market timing information updates every five seconds. This Gadget is customizable. Left-clicking the Settings Icon will display the MiniGraph Toolbar. 34
39 VectorVest 7 PDF Standard MiniGraph Toolbar Settings: MiniGraph Type: Click to select the graph type. Price Graph: Displays a graph of the price movement for the selected stock, industry, or sector graph. VVC RT Graph: Displays the movement of the VectorVest Composite's Relative Timing Indicator. MTI Graph: Displays the movement of the VectorVest Market Timing Indicator. BSR Graph: Displays the movement of the Buy/Sell Ratio. Advance/Decline Graph: Displays the movement of advancing stocks versus declining stocks in the VectorVest database. Time span and Frequency: the MiniGraph. Click to select Intraday, End of Day, or Weekly data for Type: Click to select a stock, industry, or sector graph. This selection is only available on price graphs. Color: Click to choose the color of the MiniGraph. Selection Box: The selection box allows you to type the ticker symbol of a stock when choosing a stock graph. This box will change to a drop down menu when the industry or sector graph type is selected. Size: The size menu will allow you to select a small, medium or large graph. Show Change: The Show Change button displays a watermark for the point or dollar change and percent change of the security. Previous Close: A horizontal line on the MiniGraph marks the level of the chosen security's previous close. 35

40 RealTime Tracker: Located in the top right corner of the MiniGraph. As the cursor is moved along the curve of the graph, the RealTime Tracker will display the time, the level of the security, the point or dollar change, and percent change of the security for each intraday data point. The RealTime Tracker will limit the display to the date and level of the security when viewing End of Day or Weekly data. Advances/Declines Advances/Declines graphically displays the number of securities advancing or declining in the VectorVest system during the trading day, as well as the number of securities that remain unchanged from their previous close. This Gadget updates every five seconds, and is customizable. Left-click the Settings Icon to change the length of the window. Portfolio MiniGraph The Portfolio MiniGraph allows you to track the price performance of any portfolio created in VectorVest RealTime. This Gadget is customizable. Left-click the Settings Icon to display the Portfolio MiniGraph Toolbar. 36
 data. By default, Intraday will be selected. Portfolio Selector: The second selection box on the Portfolio MiniGraph Toolbar allows you to select which portfolio to track.")
41 VectorVest 7 PDF Portfolio Mini Graph Toolbar Settings (Located on the HomePage & Dashboard): Data Type: The first selection box on the Portfolio MiniGraph Toolbar allows you to select from Intraday or EOD (End of Day) data. By default, Intraday will be selected. Portfolio Selector: The second selection box on the Portfolio MiniGraph Toolbar allows you to select which portfolio to track. By default, the first portfolio listed on the Portfolios tab will be displayed. Note: You must create a portfolio using the Portfolios Tab before it can be selected from the list. you can add multiple Portfolio MiniGraphs to the HomePage and Dashboard. Color: Click to choose the color of the Portfolio MiniGraph. Size: The third selection box can be used to change the size of the Portfolio MiniGraph Window. Selections include Small, Medium, and Large. By default, Medium will be selected. Initial Investment: Click this button to display or hide a graph marker to mark the initial investment amount used to start the portfolio. This marker will be selected by default. Show Change: Click to display a watermark representing the dollar and percent change of the portfolio. Viewers About Viewers 37

42 VectorVest RealTime Viewers are vast spreadsheets that contain information about every stock, industry group and business sector in the database. They are easy to use, and have many functions in common. By default, WatchLists and the Stock Viewer are ranked by VST-Vector in descending order, while the Industry Group and Business Sector Viewer are ranked by RT, in descending order. Stocks displayed in RealTime Mode will update tick-by-tick, while industries and sectors will update every five seconds. Detaching the Viewer Screen Any Viewer Grid may be detached from the rest of the program by left-clicking the Detach Icon next to the tab label. The Detach Icon will not be shown when the "No Viewer" option is selected. Detaching a Viewer: 1. Left-click on the Viewer you would like to detach. 2. Left-click the Detach Icon. 3. Move the detached Viewer to the desired location by dragging the Title Bar. 38
 Tagging Records Selecting multiple records, or 'tagging' them, allows the user to easily view multiple graphs, perform QuickTests or add the selected records to a WatchList or a QuickFolio.")
43 VectorVest 7 PDF You may repeat the detach process for the same Viewer to detach multiple copies. Each detached Viewer may be customized independently (i.e. sorted, searched, refreshed, etc.) Tagging Records Selecting multiple records, or 'tagging' them, allows the user to easily view multiple graphs, perform QuickTests or add the selected records to a WatchList or a QuickFolio. Tagging a Single Stock, Industry or Business Sector: 1. Open any Viewer Grid. (Stock, Industry, Sector, WatchLists, Unisearch, and Portfolios use Viewer Grids to display information.) 2. Left-click on the stock, sector, or industry of your choice. This will 'tag' only the record selected. Tagging Sequential Stocks, Industries or Sectors: 1. Open any Viewer Grid. (Stock, Industry, Sector, WatchLists, Unisearch, and Portfolios use Viewer Grids to display information.) 39
44 2. Left-click on the first stock, sector, or industry you would like to appear in the series. 3. Hold down the Shift key on the keyboard and left-click on the last record you would like to appear in the series. This will select all rows between the first and last record clicked. Tagging Non-Sequential Stocks, Industries or Sectors: 1. Open any Viewer Grid. (Stock, Industry, Sector, WatchLists, Unisearch, and Portfolios use Viewer Grids to display information.) 2. Left-click on the stock, sector, or industry of your choice. 3. Hold down the Control Key (Ctrl) on your keyboard and left-click on another stock, industry, or sector. 4. Repeat step 3 until you have finished making your selections. Once the records have been selected, the following actions may be performed: View Multiple Graphs of your selections. Click "Graph Selected" on the local toolbar (if "Graph Selected" is not already displayed on the Local Toolbar, click the drop down arrow next to the Graphing Selection to choose it). OR Right-click on any of the highlighted records and select View Stock Graph, Industry Graph, or Sector Graph. Perform a QuickTest of the selected records. Click "QuickTest Selected" on the local toolbar (if "QuickTest Selected" is not already displayed on the Local Toolbar, click the drop down arrow next to the QuickTest Selection to choose it). OR Right-click on any of the highlighted records, and select QuickTest from the Options Menu that appears. Add your selections to a QuickFolio (stock selections only). Right-click on any of the highlighted records, and select QuickFolio from the Options Menu that appears. Add your selections to a WatchList (stock selections only). 40
45 VectorVest 7 PDF Drag your stock selections from the viewer and drop them into the WatchList of your choice. The Watchlist must be visible in the Viewer Directory. This function is only available for stock selections. Create a new WatchList from your selections (stock selections only). Make your selections, right click on the viewer grid and select "Add To Watchlist", Follow the steps for creating a new WatchList. Refreshing the Viewer Screen Each Viewer screen can be automatically refreshed as frequently as one minute. This will allow new records to be added to the Viewer Screen. These additions are identified by a green dot to the right of the security name. The Refresh Selection Bar is located at the bottom of the Viewers Screen. Click the selection box to enable the Refresh Mode, and use the arrows to increase or decrease the number of minutes until the refresh occurs. The minimum refresh rate is 1 minute, and the maximum refresh rate is 10 minutes. The Viewer may be manually refreshed at any time by clicking "Refresh Now" located in the bottom right corner of the Viewer screen. Note: The Refresh Selection Bar will not be available when the Viewer is not in RealTime Mode, when the datafeed is disconnected, or when the total number of records in a viewer grid is displayed. See Connection Status to learn more. 41

46 Printing Selecting the Number of Records to Print: Use the "Display" box on the Local Toolbar to type or select the number of records to print. The maximum number of stocks that can be displayed while viewing RealTime data is 100. Printing from the Local Toolbar: 1. Access the Stock, Industry, Sector, Market Index, ETF or WatchList Viewer, or UniSearch Results. 2. Choose the number of records to print by changing the number of records to display. 42
47 VectorVest 7 PDF 3. Click the Printer Icon on the Local Toolbar. The Print Preview Window will appear. 4. Click the Printer Icon on the Print Preview page. The page orientation (landscape or portrait) and column layout may be changed using the Toolbar at the top of the Print Preview Window. Printing from the Options Menu: 1. Access any Viewer Grid. (Stock, Industry, Sector, Market Index, ETF WatchLists, Unisearch, and Portfolios use Viewer Grids to display information.) 2. Right-click on any record in the Viewer Grid (any stock, industry, or sector). 3. Select "Print" from the Options Menu that appears. 4. Click the Printer Icon on the Print Preview Page. The page orientation (landscape or portrait) and column layout may be changed using the Toolbar at the top of the Print Preview Window. Changing the Paper Orientation: 1. From the Print Preview Window, left-click "Page Setup..." 2. Left-click the radio button beside "Portrait" (vertical orientation) or "Landscape" (horizontal orientation). 3. Click "OK". Changing the Print Margins: 1. From the Print Preview Window, left-click "Page Setup..." 2. Type the margin to be used for the left, right, top and bottom of page. 3. Click "OK". Selecting Columns to Print: 1. Left-click the drop down arrow next to "Column Layout", and select "Custom" (see picture below). The print preview screen will refresh. 2. Left-click "Customize..." next to the drop down menu. The Print Layout Window will appear. To remove a column: Select the column name in the "Columns in Grid Panel", and left-click the arrow pointing to the left. The column will be moved to the 'Field List', and will not be printed. 43
48 To change the placement of a column, select the column name in the "Columns in Grid Panel", and use the up/down arrows to move the column to the desired location. To add a column, select the column name in the "Field List Panel", and leftclick the arrow pointing to the right. The column will be moved to the "Columns in Grid Panel", and will be printed. 3. Click "OK" when the changes are complete. Note: Multiple fields may be selected by tagging. Viewing Fields in the Print Layout Window: By default, the fields shown in the Print Layout Window will be grouped by category. Click the "Grouped" Button to display the fields without their groups. 44
49 VectorVest 7 PDF Creating Custom Fields from the Print Layout Window: Custom Fields may be created and added directly from the Print Layout Window. To create a custom field click the "F(x)" Button. For more information about building custom fields, click here. Types of Viewers No Viewer No Viewer The No Viewer option can be selected to increase the availability of system resources on the computer being used. Selecting 'No Viewer' provides a blank screen in the Viewer, decreasing the amount of information ticking in the RealTime Program. Accessing the Stock Viewer: Accessing Stock Viewer 1. Left-click the "Viewers" Tab on the Main Menu Bar. 2. Select "Stock Viewer" from the Viewer Directory. Stock Viewer 45
50 View Stocks in an Industry Group VectorVest RealTime categorizes all stocks according to a unique array of 226 VectorVest Industry Groups. A ranked list of stocks within any Industry Group can be accessed quickly and easily. Viewing Stocks in an Industry Group (double-click method): 1. View a stock or list of stocks by using the Stock Viewer, or WatchLists (UniSearch results or a QuickList may also be used). 2. Double-click on any stock of interest. The "Stocks in Industry" window will appear displaying all the stocks within the same industry group. The stocks will be ranked by VST-Vector, in descending order. OR 1. Open the Industry Viewer. 2. Double-click on any industry of interest. The "Stocks in Industry" window will appear displaying all the stocks within the same industry group. The stocks will be ranked by VST-Vector, in descending order. Viewing Stocks in an Industry Group (right-click method): 1. Open any of the following Viewers: Stock Viewer, Industry Viewer, or WatchLists (UniSearch results or a QuickList may also be used) 2. Select a record by left-clicking on a stock, or industry group. 3. Right-click on the selected record to display the Options Menu. 4. Select "View Stocks in Industry Group". Industry Viewer Accessing the Industry Viewer Accessing the Industry Viewer: 1. Click the "Viewers" tab on the Main Menu Bar. 2. Select "Industry Viewer" from the Viewer Directory. 46

51 VectorVest 7 PDF All Industry Groups will be automatically ranked by RT (Relative Timing). These industry groups may be sorted, ranked, and graphed in the same fashion as individual stocks, and update every five seconds in RealTime Mode. View Stocks in an Industry Group Viewing Stocks in an Industry Group (double-click method): 1. View a stock or list of stocks by using the Stock Viewer, or WatchLists (UniSearch results or a QuickList may also be used). 2. Double-click on any stock of interest. The "Stocks in Industry" window will appear displaying all the stocks within the same industry group. The stocks will be ranked by VST-Vector, in descending order. OR 1. Open the Industry Viewer. 2. Double click on any industry of interest. The "Stocks in Industry" window will appear displaying all the stocks within the same industry group. The stocks will be ranked by VST-Vector, in descending order. 47
52 Viewing Stocks in an Industry Group (right-click method): 1. Open any of the following Viewers: Stock Viewer, Industry Viewer, or WatchLists (UniSearch results or a QuickList may also be used) 2. Select a record by left-clicking on a stock, or industry group. 3. Right-click on the selected record to display the Options Menu. 4. Select "View Stocks in Industry Group". Linked Business Sectors Business Sectors are broader classifications of related industry groups. Viewing Industry Groups within a Business Sector (double-click method): 1. Open the Sector Viewer. 2. Double-click on the desired Business Sector. Viewing Industry Groups within a Business Sector (right-click method): 1. Open any of the following Viewers: Stock Viewer, Industry Viewer, Sector Viewer, Market Index Viewer, ETF Viewer or WatchLists (UniSearch results or a QuickList may also be used) 2. Select the stock or industry of interest. 3. Right-click on the highlighted record to display the Options Menu. 4. Select "View Industries in Business Sector". All Business Sectors will automatically be ranked by RT (Relative Timing), but may be sorted and/or screened by any of the VectorVest RealTime parameters. 48
.")
53 VectorVest 7 PDF Accessing the Sector Viewer: 1. Click the "Viewers" tab on the Main Menu Bar. 2. Select "Sector Viewer" from Viewer Directory. Sector Viewer Accessing the Sector Viewer A window appears showing all the Sector Groups ranked by RT (Relative Timing). These sectors may be sorted, ranked, and graphed in the same fashion as individual stocks, and will update every five seconds in RealTime Mode. View Stocks in a Business Sector Viewing Stocks in a Business Sector (right-click method): 1. Open any of the following Viewers: Stock Viewer, Industry Viewer, Sector Viewer, Market Index Viewer, ETF Viewer or WatchLists (UniSearch results or a QuickList may also be used). 2. Select a record by left-clicking on a stock, industry group, or sector. 3. Right-click on the selected record to display the Options Menu. 49
54 4. Select "View Stocks in Business Sector". WatchLists About Stock WatchLists Stock WatchLists are personal Stock Viewers, allowing you to create customized lists of the stocks you wish to track. These lists can then be ranked, sorted, and graphed in the same way as all VectorVest Viewers. VectorVest also maintains several proprietary stock WatchLists for our users. These WatchLists are updated each week, and can be accessed from the Viewers Directory. A complete description of any WatchList may be accessed by first selecting the Watchlist then reading the Comments section located at the bottom of the Directory Panel. Accessing a WatchList: Accessing WatchLists 1. Click the "Viewers" tab on the Main Menu Bar. 2. Left-click to select the WatchList Group of your choice from the Directory Panel on the left. 3. Select the name of the desired WatchList. The window will now show the stocks in that WatchList ranked by VST-Vector. These stocks may by sorted, ranked and graphed in the same fashion as Stock Viewer. 50


55 VectorVest 7 PDF Organizing Watchlists Watchlists may be grouped by category or listed alphabetically. By default, WatchLists will be displayed by group name. Viewing WatchLists Alphabetically or by Group: 1. Click the "Viewers" tab on the Main Menu Bar. 2. Click the "A-Z" icon on the WatchList Toolbar. (The WatchlList Toolbar is located in the Viewer Directory Panel above the WatchList section.) Creating a New Stock WatchList Group WatchList Groups provide a way to organize your WatchLlists. 51
56 To Create a New Stock WatchList Group: 1. Select the "Viewers" tab. 2. Left-click on the drop down arrow next to the New Icon in the top left of the WatchList section. 3. Select "New Group..." from the menu that appears. A "New Group" window appears. 4. Type a name for your WatchList Group. 5. Click in the text area labeled "Comments" to type any notes about this WatchList Group. This step is optional, but descriptive comments about the purpose of the group can save confusion later. 6. Left-click "OK" or use the Enter key on your keyboard to save the new group. OR 1. Select the "Viewers" tab. 2. Right-click on any existing Watchlist Group 3. Select "New Group" from the menu that appears. A "New Group" window appears. 52
57 VectorVest 7 PDF 4. Type a name for your WatchList Group. Add any notes about the WatchList Group to the "Comments" section. This step is optional, but can provide valuable information for later use. 5. Left-click "OK" or use the Enter key on your keyboard to save the new group. Creating a Portfolio from a Watchlist Quickfolios are the simplest and easiest way to create a portfolio from any list of stocks (click here for the steps to create a Quickfolio). You may require a portfolio that contains more detail than is available in a QuickFolio. To create a portfolio from a watchlist using a different method follow the steps below. Creating Short and Long Portfolios from a WatchList: 1. Access the "Portfolio" tab. 2. Create a new portfolio. 3. After the portfolio has been added to the directory, select it by left-clicking on the portfolio name. 4. Click the "Trades" button. 5. Select "Short From Search". "<New Search>" will be shown toward the bottom of the Short from Search Window. Left-click in the empty spaces below "<New Search>" to enter the following information: Selected Date: Time of Search Parameter: Stocks/Filter by/watchlist Operator: = Value: Select the name of your WatchList from the groups shown. 6. Select "Invest all" or "specified amount: Total" on the Short from Search Window. 7. Select the "# of stocks" that you would like to short from the watchlist on the Short from Search Window. 8. Optional: Use the Date/Time Control above the search parameters to select a specific date and time to short your stocks (RealTime data is available for the last five trading days, older data will be end of day). 9. Click the "Short Stocks" button. 10. Repeat these steps for a Long Portfolio except select "Buy From Search" instead of "Short From Search". Note: The cost basis for each position may be edited using the Portfolio Transaction Log. Renaming a Stock WatchList Group To Rename A Stock WatchList Group (User-created only): 53
58 1. Select the "Viewers" tab. 2. Left-click on the name of the WatchList Group you wish to change. 3. Left-click on the Edit Icon at the top on the WatchList Directory Toolbar. 4. Left-click in the text box labeled "Name" and use the Backspace or Delete key on the keyboard to remove the current name. 5. Type a new name for the WatchList Group. 6. Left-click "OK". Note that the new name of the WatchList Group appears in the Directory. OR 1. Select the "Viewers" tab. 2. Right-click on the name of the Watchlist Group you wish to change. 3. Select "Edit" from the Options Menu that appears. 4. Left-click in the text box labeled "Name" and use the Backspace or Delete keys on your keyboard to remove the current name. 5. Type a new name for the WatchList Group. 6. Left-click "OK". Note that the new name of the WatchList Group appears in the Directory. Note: Only user-created WatchList Groups can be renamed. Deleting a Stock WatchList Group To Delete a Stock WatchList Group (User-created only): 54
59 VectorVest 7 PDF 1. Select the "Viewers" tab. 2. Left-click on the name of the WatchList Group to be deleted. 3. Left-click on the Delete Icon at the top of the WatchList Section. You will be prompted "Are you sure you want to delete this group and all of its contents?" 4. Click "Yes" to remove the WatchList Group and all associated Watchlists, or "No" to cancel the action. OR 1. Select the "Viewers" tab. 2. Right-click on the name of the WatchList Group to be deleted. 3. Select "Delete" from the Options Menu that appears. You will be prompted "Are you sure you want to delete this group and all of its contents?" 4. Click "Yes" to remove the WatchList Group and all associated WatchLists, or "No" to cancel the action. Creating a New Stock WatchList: Creating a New Stock WatchList 1. Select the "Viewers" Tab. 2. Left-click on a Group in which to save the WatchList, or create a new Watchlist Group. 3. Left-click the drop down arrow next to the New Icon, and select "New WatchList". (see picture below). 4. Enter a name for the WatchList in the New WatchList Window. 5. Add any notes about the WatchList to the "Comments" section. This step is optional, but listing the date started, and method used to find the selected stocks can be valuable information for later use. 6. Left-click the "OK" button. 55

60 OR 1. Select the "Viewers" tab. 2. Right-click on the Group in which to save the WatchList, or create a new Watchlist Group. 3. Select "New WatchList". 4. Enter a name for the WatchList in the New WatchList Window. 5. Add any notes about the WatchList to the "Comments" section. This step is optional, but listing the date started, and method used to find the selected stocks can be valuable information for later use. 6. Click the "OK" button. To Delete a Stock WatchList: Deleting a Stock WatchList 56
61 VectorVest 7 PDF 1. Select the "Viewers" tab. 2. Left-click on the group containing the WatchList to be removed. 3. Left-click on the name of the WatchList to be deleted. 4. Left-click on the Delete Icon on the WatchList Directory Toolbar. 5. You will now be prompted, "Are you sure you wish to delete this WatchList?" 6. Left-click "Yes" to completely remove the WatchList or click "No" to cancel this operation. OR 1. Select the "Viewers" tab. 2. Left-click on the Group containing the WatchList to be removed. 3. Right-click on the name of the WatchList to be deleted.. 4. You will now be prompted, "Are you sure you wish to delete this WatchList?" 5. Left-click "Yes" to completely remove the WatchList or click "No" to cancel this operation. Adding Stocks to a WatchList There are several convenient ways to add stocks to a WatchList. You may add stocks manually, use the right-click Options Menu, or drag and drop stocks from the Stock Viewer. Adding Stocks to a WatchList Manually: 57
62 1. Select the "Viewers" tab. 2. Select the WatchList you would like to add stocks to. 3. Type the ticker symbols, separated by a comma, into the Add Symbol(s) Window located on the Local Toolbar. If you do not know the symbol start typing the company name and select it from the list that appears. 4. Left-click "OK" or press the Enter key on your keyboard when finished. Adding Stocks to a WatchList by Dragging and Dropping: 1. Select the "Viewers" tab. 2. Select the Stock Viewer or an existing WatchList. 3. Tag the stocks that you wish to add to a WatchList. 4. Hold down the left mouse button on any of the selected stocks. 5. Continue to hold down the left mouse button, while moving the mouse to the desired WatchList. 6. Release the left mouse button when the cursor is directly over the name of the WatchList to which the stocks will be added. Adding Stocks to a WatchList using the Right-Click Options Menu: 1. Select the "Viewers" tab. 2. Select the Stock Viewer or an existing WatchList. 3. Tag the stocks that you wish to add to a WatchList. 58
63 VectorVest 7 PDF 4. Leave your cursor on any of the selected stocks, and right-click to view the Options Menu. 5. Left-click "Add to WatchList". The "Add to WatchList" window will appear. 6. Select the group that contains the WatchList to which you would like to add stocks. 7. Left-click the WatchList to which you would like to add the stocks. (To create a new WatchList, click the New Icon at the top of the "Add to Watchlist" window, or right-click on an existing group and use the Options Menu to select "New WatchList".) 8. Left-click "OK". Removing Stocks from a WatchList VectorVest RealTime allows you to easily remove stocks from a WatchList individually or collectively. Please note, only user-created WatchLists may be changed. Removing All Stocks from a WatchList: 1. Right-click the stock WatchList from which you would like to delete stocks. 2. Select "Empty WatchList". OR. 1. Select the WatchList from which you would like to delete stocks. 2. Left-click "Delete" on the Local Toolbar. 3. Left-click "Delete All". Removing Selected Stocks From a WatchList: 1. Select the WatchList from which you would like to delete stocks. 2. Tag the stocks that you wish to remove. 3. Left-click "Delete" on the Local Toolbar. 4. Left-click "Delete Selected". OR 1. Select the WatchList from which you would like to delete stocks. 2. Tag the stocks that you wish to remove. 3. Leave your cursor on any of the selected stocks, and right-click to view the Options Menu. 59
64 4. Left-click "Delete Item". Renaming a Stock WatchList: Renaming a Stock WatchList 1. Select the Stock WatchList that you would like to rename. 2. Click the Edit Icon on the Watchlist Toolbar. 3. Remove the old name by using the delete or backspace key on the keyboard. 4. Type the new WatchList name. 5. Left-click "OK". OR 1. Right-click on the name of the WatchList that you would like to rename. 2. Select "Edit" from the Options Menu. 3. Remove the old name by using the delete or backspace key on the keyboard. 4. Type the new WatchList name. 5. Left-click "OK". Note: Only user-created WatchLists can be renamed. Copying Stocks to Another Watchlist Selected stocks can be copied from one WatchList to another, or a duplicate of the entire WatchList may be created. Copying Selected Stocks to a WatchList by Dragging and Dropping: 1. Select the "Viewers" tab. 2. Select an existing WatchList. 60
65 VectorVest 7 PDF 3. Tag the stocks that you wish to copy. 4. Hold down the left mouse button on any of the selected stocks. 5. Continue to hold down the left mouse button, while moving the mouse to the desired WatchList. 6. Release the left mouse button when the cursor is directly over the name of the WatchList to which the stocks will be added. Copying Selected Stocks to a WatchList using the Right-Click Options Menu: 1. Select the "Viewers" tab. 2. Select an existing WatchList. 3. Tag the stocks that you wish to copy. 4. Leave your cursor on any of the selected stocks, and right-click to view the Options Menu. 5. Left-click "Add to WatchList". The "Add to WatchList" window will appear. 6. Select the group that contains the WatchList to which you would like to copy the stocks to. 7. Left-click the WatchList to which you would like to add the stocks. (To create a new WatchList, click the New Icon at the top of the "Add to Watchist" window, or right-click on an existing group and use the Options Menu to select "New WatchList".) 8. Left-click "OK". Copying Your WatchList: 1. Select the "Viewers" tab. 2. Right-click on an existing WatchList. 3. Select "Copy". A duplicate of your WatchList will appear in the WatchList Directory Panel. OR 1. Select the "Viewers" tab. 2. Right-click on an existing WatchList. 3. Select "Save As". 4. Type a name for the new WatchList. 5. Click "'OK". 61
66 Filtering a WatchList Any RealTime WatchList may be filtered to include or exclude stocks that are on another list. For example, you could compare the Best New High's WatchList and the S & P 500 WatchList to create a new WatchList that only contained stocks on both lists. Filtering WatchLists: 1. Highlight, or tag, a list of stocks you would like to filter, WatchLists, Stock Viewer, or UniSearch results may be used. 2. Right-click on the highlighted area and select "Add to WatchList". The Add to WatchList window will appear. 3. Click "Filter Items" toward the top left of the Add to WatchList Window. 4. Select "Found In:" or "NOT Found In:" according to your preference. 5. Left-click the drop down arrow on the box below NOT Found In: to select the WatchList you would like to compare the original to. The new 'filtered' list of stocks will be displayed. 6. Left-click on a Group in which to save the WatchList, or create a new Watchlist Group. 7. Left-click the drop down arrow next to the New Icon, and select "New WatchList". 8. Enter a name for the WatchList in the New WatchList Window. 9. Add any notes about the WatchList to the "Comments" section. This step is optional, but listing the date started, and method used to find the selected stocks can be valuable information for later use. 10. Left-click the "OK" button. Importing Symbols to a Watchlist Many programs allow you to create a.csv file that can be imported directly into a RealTime WatchList. you may also wish to copy and paste a list of stocks to an Excel spreadsheet, such as the Yahoo! Earnings Calendar. This list can then be saved as a.csv file. Creating a.csv file using Excel: 1. If copying stocks from a website, first highlight the table of stocks to transfer. 62
67 VectorVest 7 PDF 2. Right-click on the high-lighted area and select "Copy". 3. Open a new Excel Spreadsheet. 4. Right-click in the first cell, and select "Paste". The stocks should be copied to the spreadsheet. 5. Left-click "File" on the Menu Bar. 6. Left-click "Save As". 7. Type a name for the file in the File name Text Box. 8. Left-click in the "Save as Type" box and select.csv (Comma delimited) 9. Select the location the file will be saved to (Desktop recommended). 10. Left-click "Save". 11. Left-click "OK" on the message warning, "The selected file type does not support workbooks that contain multiple sheets". 12. Left-click "Yes" to confirm that you want to keep this format. 13. Close Excel, Left-click "No" when asked to save the changes. Importing Symbols to a Watchlist from a.csv file: 1. Select the "Viewers" tab. 2. Left-click the Import Icon on the WatchList Directory Toolbar. 3. Select the location of the saved.csv file. 4. Double-click on the name of the.csv file. The "Symbol Import Options" window will appear. 5. Select the radio button next to "Data is a comma-delimited list of symbols ONLY". 6. The recognized symbols should be listed in the bottom left column. 7. Left-click "OK". 63

68 Market Index Viewer Accessing Stock Viewer Accessing the Stock Viewer: 1. Left-click the "Viewers" Tab on the Main Menu Bar. 2. Select "Stock Viewer" from the Viewer Directory. 64
69 VectorVest 7 PDF View Stocks in an Industry Group VectorVest RealTime categorizes all stocks according to a unique array of 226 VectorVest Industry Groups. A ranked list of stocks within any Industry Group can be accessed quickly and easily. Viewing Stocks in an Industry Group (double-click method): 1. View a stock or list of stocks by using the Stock Viewer, or WatchLists (UniSearch results or a QuickList may also be used). 2. Double-click on any stock of interest. The "Stocks in Industry" window will appear displaying all the stocks within the same industry group. The stocks will be ranked by VST-Vector, in descending order. OR 1. Open the Industry Viewer. 2. Double-click on any industry of interest. The "Stocks in Industry" window will appear displaying all the stocks within the same industry group. The stocks will be ranked by VST-Vector, in descending order. Viewing Stocks in an Industry Group (right-click method): 65

70 1. Open any of the following Viewers: Stock Viewer, Industry Viewer, or WatchLists (UniSearch results or a QuickList may also be used) 2. Select a record by left-clicking on a stock, or industry group. 3. Right-click on the selected record to display the Options Menu. 4. Select "View Stocks in Industry Group". ETF Viewer Accessing Stock Viewer Accessing the Stock Viewer: 1. Left-click the "Viewers" Tab on the Main Menu Bar. 2. Select "Stock Viewer" from the Viewer Directory. View Stocks in an Industry Group 66
71 VectorVest 7 PDF VectorVest RealTime categorizes all stocks according to a unique array of 226 VectorVest Industry Groups. A ranked list of stocks within any Industry Group can be accessed quickly and easily. Viewing Stocks in an Industry Group (double-click method): 1. View a stock or list of stocks by using the Stock Viewer, or WatchLists (UniSearch results or a QuickList may also be used). 2. Double-click on any stock of interest. The "Stocks in Industry" window will appear displaying all the stocks within the same industry group. The stocks will be ranked by VST-Vector, in descending order. OR 1. Open the Industry Viewer. 2. Double-click on any industry of interest. The "Stocks in Industry" window will appear displaying all the stocks within the same industry group. The stocks will be ranked by VST-Vector, in descending order. Viewing Stocks in an Industry Group (right-click method): 1. Open any of the following Viewers: Stock Viewer, Industry Viewer, or WatchLists (UniSearch results or a QuickList may also be used) 2. Select a record by left-clicking on a stock, or industry group. 3. Right-click on the selected record to display the Options Menu. 4. Select "View Stocks in Industry Group". About the Viewers Toolbar Viewers Toolbar The toolbar for all the VectorVest Viewers is located at the top of the Viewers screen, and is referred to as the Local Toolbar. The Local Toolbar has many options and will allow you to select the time and date, find stocks, print, QuickTest, graph, sort, and more in just seconds. 67

72 Sorting in the Viewers There are two ways of sorting and ranking the Viewers within VectorVest RealTime. Sorting the Viewers: 1. Open the Stock, Industry, Sector, Market Index, ETF or WatchList Viewer. 2. Left-click the Sorting Button located on the Local Toolbar. The Sort Selection Window will appear. 3. Left-click the drop down arrow below Primary Sort. Sorts are listed in alphabetical order. Use the scroll bar to find the desired sort or use your keyboard to type the first letter of the sort you wish to choose. 4. Left-click on the desired Sort to select it. 5. Left-click the drop down arrow below Secondary Sort. 6. Left-click the desired secondary sort. The secondary sort will only be used as a 'tie-breaker' when the primary sort is the same for two or more securities. 7. Select Asc or Desc. This will sort the records in ascending (lowest to highest) or descending (highest to lowest) order. 8. Left-click "OK". This will resort all of the records using the selected sort. Click the "Cancel" button to exit without making any changes to the sort. OR 68
73 VectorVest 7 PDF 1. Open the Stock, Industry Group, Business Sector or WatchList Viewer. 2. Left-click on the column heading of the parameter you would like to sort by. This will sort the records by the parameter you have chosen in descending order (highest to lowest). 3. Click on the column heading again to change the sort to ascending order (lowest to highest). The Viewer may also be sorted using a custom field. Click here to learn more about Custom Field Builder. Record Count RealTime allows you to view up to 100 stocks in RealTime mode. When using the Industry or Sector Viewer the entire list of Industries and Sectors can be displayed. Changing the Number of Records to Return: 1. Open the Stock, Industry Group, Business Sector, ETF, Market Index or WatchList Viewer. 2. Left-click the drop down arrow next to Display on the Local Toolbar. 3. Select the number of records to view. Use the find feature to locate any record in the VectorVest database. Using the Find Feature Finding Stocks: 1. Access the Stock or WatchList Viewer. 2. Left-click in the Symbol Input Box. 3. Type the ticker symbol(s) separated by a comma in the Find Symbol(s) Window located on the Local Toolbar. If you do not know the symbol, start typing the company name and select it from the list that appears. 4. Press Enter on your keyboard when finished. The listed stocks will be displayed. 5. To restore the Viewer, click "Clear Find". 69
74 Note: The Symbol Input Box is for stocks only and can not be used in the Industry or Sector Viewer. Quick Test The Quick Test feature will determine a stock or group of stocks' individual and overall gain or loss over a period of time. By default, the QuickTest start time will be the current time and date displayed in the Date/Time Control Window. In RealTime mode, the end time will also default to the current date and time. In End of Day Mode, the end date for the QuickTest will default to the close of the most recent trading day. For convenience, the gain and loss calculations are also reported as an annualized rate of return. The Compare feature allows the user to compare the performance of the tested stocks to that of another symbol. The Quick Test feature is available in all Viewer screens, Portfolios and the UniSearch Tool. To QuickTest using the Local Toolbar: 1. Select the Viewers Tab or UniSearch. 2. Select a Viewer, Watchlist, or Run a Search. 3. Left-click the first record listed, or tag the records that you wish to select. 4. Left-click the drop down arrow beside the QuickTest Button. 5. Choose All, Selected, or Top #. Choosing Select All will QuickTest all the records visible on the Viewer Screen, QuickTest Selected will test only the stocks tagged, and QuickTest Top... will test the number of stocks chosen using the window. Your QuickTest choice will saved, and you can repeat the same type of QuickTest just by clicking the QuickTest Button. *This method is not available in Portfolios. To QuickTest using the Options Menu (right click method): 1. Left-click the stock, or tag multiple stocks, you would like to test. 2. Right-click on any of the selected records. 3. Select "Quicktest" from the Options Menu that appears. Graphs 70
75 VectorVest 7 PDF Graphing using the Local Toolbar: 1. Select the Viewers Tab. 2. Select Stock, Industry, Sector, ETF or Market Index Viewer, or select a WatchList. 3. Left-click the top stock or record, or tag the records you wish to select. 4. Left-click the drop down arrow beside the Graph Button. 5. Choose All, Selected, or Top #. Choosing Select All will graph all the records visible on the Viewer Screen, Graph Selected will only graph the stocks you have tagged, and Graph Top... will graph the number of stocks you have chosen using the selection box. Your Graph choice will saved, and you can repeat the same graph selection just by clicking the Graph Button. You may also access the Graph feature by selecting a record, then right-clicking and choosing View Graph from the Options Menu, or by using the Graph Tab. Graphing using the Right-click Options Menu: 1. Left-click the stock, industry, or business sector to graph, or tag multiple records. 2. Right-click on the selected record(s). 3. Select "View Graph" from the Options Menu that appears. Printing Selecting the Number of Records to Print: Use the "Display" box on the Local Toolbar to type or select the number of records to print. The maximum number of stocks that can be displayed while viewing RealTime data is 100. Printing from the Local Toolbar: 71
76 1. Access the Stock, Industry, Sector, ETF, Market Index or WatchList Viewer, or UniSearch Results. 2. Choose the number of records to print by changing the number of records to display. 3. Click the Printer Icon on the Local Toolbar. The Print Preview Window will appear. 4. Click the Printer Icon on the Print Preview page. The page orientation (landscape or portrait) and column layout may be changed using the Toolbar at the top of the Print Preview Window. Printing from the Options Menu: 1. Access any Viewer Grid. (Stock, Industry, Sector, ETF, Market Index, WatchLists, Unisearch, and Portfolios use Viewer Grids to display information.) 2. Right-click on any record in the Viewer Grid (any stock, industry, or sector). 3. Select "Print" from the Options Menu that appears. 4. Click the Printer Icon on the Print Preview Page. The page orientation (landscape or portrait) and column layout may be changed using the Toolbar at the top of the Print Preview Window. Changing the Paper Orientation: 1. From the Print Preview Window, left-click "Page Setup..." 2. Left-click the radio button beside "Portrait" (vertical orientation) or "Landscape" (horizontal orientation). 3. Click "OK". Changing the Print Margins: 1. From the Print Preview Window, left-click "Page Setup..." 2. Type the margin to be used for the left, right, top and bottom of page. 3. Click "OK". Selecting Columns to Print: 1. Left-click the drop down arrow next to "Column Layout", and select "Custom" (see picture below). The print preview screen will refresh. 72
77 VectorVest 7 PDF 2. Left-click "Customize..." next to the drop down menu. The Print Layout Window will appear. To remove a column: Select the column name in the "Columns in Grid Panel", and left-click the arrow pointing to the left. The column will be moved to the 'Field List', and will not be printed. To change the placement of a column, select the column name in the "Columns in Grid Panel", and use the up/down arrows to move the column to the desired location. To add a column, select the column name in the "Field List Panel", and leftclick the arrow pointing to the right. The column will be moved to the "Columns in Grid Panel", and will be printed. 3. Click "OK" when the changes are complete. Note: Multiple fields may be selected by tagging. 73
78 Viewing Fields in the Print Layout Window: By default, the fields shown in the Print Layout Window will be grouped by category. Click the "Grouped" Button to display the fields without their groups. Creating Custom Fields from the Print Layout Window: Custom Fields may be created and added directly from the Print Layout Window. To create a custom field click the "F(x)" Button. For more information about building custom fields, click here. 74

79 VectorVest 7 PDF Using the Date/Time Control The Date/Time Control is found throughout VectorVest RealTime, and allows you to select the date and time of the information displayed. At some point, you may select a past date or time in Viewers, QuickTest, or UniSearch. This will stop the information from ticking in real time, but does not disconnect the datafeed. To bring the status back to RealTime, use the RealTime Button located on the Local Toolbar, or click here for more details about the program's connection status. Selecting the Market Open or Close: Clicking "<< Open" will change the time to 9:30 AM ET on the date shown, or 8:00 AM ET if extended hours have been enabled.. Clicking "Close >>" will change the time to the 4:00 PM ET on the date shown, or 8:00 PM ET if extended hours have been enabled.. Changing the Date: 1. To change the date or time, access the calendar by left-clicking on the date and time shown. The calendar and time clock will appear 2. To change the year, left-click on the year shown at the top of the calendar, and select the year of your choice. 75
80 Intraday (minute-by-minute) data will be available for the five most recent trading days. Dates that have intraday data will be displayed on the calendar in bold. Selecting a date prior to this time period will display end of day data. Changing the Time: 1. To change the time, access the time clock by left-clicking on the date and time shown. The calendar and time clock will appear. 2. Use the up and down arrow controls surrounding the clock to increase or decrease the hour and minutes displayed. The I< clock control will automatically change the time to 9:30 AM ET, and the >I clock control will change the time to 4:00 PM ET. When extended hours have been enabled the market open will reflect 8:00 AM ET, and the market close will be displayed as 7:59 PM ET. The time control is only available when viewing data from the last five trading days. RealTime Connection Viewing End of Day Data will disconnect the RealTime feed. To reconnect the live data feed, left-click the RT Button on the Local Toolbar. Viewers Right Click Options Menu News Using the Options Menu The latest news can easily be obtained for any stock or index in the VecorVest database. To View the Stock News from Viewers: 1. Left-click the stock or index you would like to view. 2. Right-click on the selected stock. 3. Select "View Stock News" from the Options Menu that appears. 76
81 VectorVest 7 PDF This function allows you to view the historical data for a selected stock. View Historical Data To Access Historical Data on any Stock, ETF or Market Index: 1. Left-click the stock, ETF or Market Index you would like to view. 2. Right-click on the selected record. 3. Select "View Historical Data" from the Options Menu that appears. OR To Access Historical Data using the double click method: 1. View an ETF or Market Index by using the ETF Viewer or Market Index Viewer. 2. Double-click on any ETF or Market Index of interest. The "View Historical Data" window will appear. You can now view the historical data available in your database for this particular security. By default, the current day's history will be shown on a minute-by-minute basis. Intraday data can be viewed, one day at a time, for the most recent five day period. To switch to End of Day History, use the drop down box in the upper left corner of the History Screen. Click the drop down arrow next to Intraday, and select End of Day. Use the Date box to select the Start Date and End Date of your choice. Note: New securities are continuously being added to the VectorVest database, and will have historical data ranging from the date of entry to current. View Stocks in an Industry Group 77
82 VectorVest RealTime categorizes all stocks according to a unique array of 226 VectorVest Industry Groups. A ranked list of stocks within any Industry Group can be accessed quickly and easily. Viewing Stocks in an Industry Group (double-click method): 1. View a stock or list of stocks by using the Stock Viewer, or WatchLists (UniSearch results or a QuickList may also be used). 2. Double-click on any stock of interest. The "Stocks in Industry" window will appear displaying all the stocks within the same industry group. The stocks will be ranked by VST-Vector, in descending order. OR 1. Open the Industry Viewer. 2. Double-click on any industry of interest. The "Stocks in Industry" window will appear displaying all the stocks within the same industry group. The stocks will be ranked by VST-Vector, in descending order. Viewing Stocks in an Industry Group (right-click method): 1. Open any of the following Viewers: Stock Viewer, Industry Viewer, Market Index Viewer, ETF Viewer or WatchLists (UniSearch results or a QuickList may also be used) 2. Select a record by left-clicking on a stock, or industry group. 3. Right-click on the selected record to display the Options Menu. 4. Select "View Stocks in Industry Group". View Industries in a Business Sector Viewing Industry Groups within a Business Sector (double-click method): 1. Open the Sector Viewer. 2. Double-click on the desired Business Sector. 78
83 VectorVest 7 PDF Viewing Industry Groups within a Business Sector (right-click method): 1. Open any of the following Viewers: Stock Viewer, Industry Viewer, Sector Viewer, Market Index Viewer, ETF Viewer or WatchLists (UniSearch results or a QuickList may also be used). 2. Select a record by left-clicking on a stock, industry group, or sector. 3. Right-click on the record of interest to display the Options Menu. 4. Select "View Industries in Business Sector". All Business Sectors will automatically be ranked by RT (Relative Timing), but may be sorted and/or screened by any of the VectorVest RealTime parameters. Note: Some business areas are so small, that the Industry Group and Business Sector are the same. Quick Test The Quick Test feature will determine a stock or group of stocks' individual and overall gain or loss over a period of time. By default, the QuickTest start time will be the current time and date displayed in the Date/Time Control Window. In RealTime mode, the end time will also default to the current date and time. In End of Day Mode, the end date for the QuickTest will default to the close of the most recent trading day. For convenience, the gain and loss calculations are also reported as an annualized rate of return. The Compare feature allows the user to compare the performance of the tested stocks to that of another symbol. The Quick Test feature is available in all Viewer screens, and the UniSearch Tool. To QuickTest using the Local Toolbar: 1. Select the Viewers Tab or UniSearch. 2. Select a Viewer, or Watchlist, or Run a Search. 3. Left-click the first record listed, or tag the records that you wish to select. 4. Left-click the drop down arrow beside the QuickTest Button. 5. Choose All, Selected, or Top #. 79
84 Choosing Select All will QuickTest all the records visible on the Viewer Screen, QuickTest Selected will test only the stocks tagged, and QuickTest Top... will test the top number of stocks. Your QuickTest choice will saved, and you can repeat the same type of QuickTest just by clicking the QuickTest Button. To QuickTest using the Options Menu (right click method): 1. Left-click the stock, or tag multiple stocks, you would like to test. 2. Right-click on any of the selected records. 3. Select "Quicktest" from the Options Menu that appears. QuickFolio QuickFolios allow you to instantly create a long or short portfolio for a selected stock, or group of stocks, and can be created from several sections of the program including Stock Viewer, WatchLists, and the UniSearch Tool. The QuickFolio will automatically purchase the stocks you have selected at their current price. The initial investment of the QuickFolio can be customized, as well as the selections for margin and interest. The initial investment amount selected will be divided among the stock(s) selected using a dollar-weighted average. Quickfolio Using the Local Toolbar: 1. Select the Viewers Tab or UniSearch. 2. Select a Viewer, or Watchlist, or Run a Search. 3. Left-click the first record listed, or tag the records that you wish to select. 4. Left-click the drop down arrow beside the Quickfolio Button. 5. Choose All, Selected, or Top #. Choosing Select All will Quickfolio all the records visible on the Viewer Screen, Quickfolio Selected will only create a portfolio for the stocks tagged, and QuickFolio Top... will create a portfolio for top number of stocks. Your QuickFolio choice will saved, and you can repeat the same type of QuickFolio by clicking the QuickFolioButton. To QuickTest using the Options Menu (right click method): 80
85 VectorVest 7 PDF 1. Left-click to select a stock, or tag multiple stocks in the Stock Viewer, WatchList, or UniSearch Screens. 2. Right-click on any of the stocks selected. 3. Left-click "QuickFolio.." from the Options Menu that appears. 4. Type a name for your QuickFolio. 5. Edit preferences: Use the default Initial Investment amount, or type a new amount in the selection box. Use the default commission type/amount, or type a new amount in the selection box. Select or Deselect the Use Margin option. Select or Deselect the Use Interest option. 6. Click OK The new QuickFolio will be listed on the Portfolios tab. Setting QuickFolio Defaults: 1. Access the Program Settings Window by clicking the Configure Icon, (located next to the Alerts Button, in the top right corner of the program). 2. Click the Portfolio Tab. 3. Select QuickFolio from the left panel on the Portfolio Settings Window and make your selections for each of the options listed, 4. Click "Apply" to complete your changes. Note: you may also access Portfolio Default Settings Window by clicking the Portfolio Tab on the Main Menu Bar, then clicking the Settings Icon to the right of the Tab Label. Adding Stocks to a WatchList There are several convenient ways to add stocks to a WatchList. You may add stocks manually, use the right-click Options Menu, or drag and drop stocks from the Stock Viewer. Adding Stocks to a WatchList Manually: 81

86 1. Select the "Viewers" tab. 2. Select the WatchList to which you wish to add stocks. 3. Type the ticker symbols, separated by a comma, into the Add Symbol(s) Window located on the Local Toolbar. If you do not know the symbol start typing the company name and select it from the list that appears. 4. Left-click "OK" or press the Enter key on your keyboard when finished. Adding Stocks to a WatchList by Dragging and Dropping: 1. Select the "Viewers" tab. 2. Select the Stock Viewer or an existing WatchList. 3. Tag the stocks that you wish to add to a WatchList. 4. Hold down the left mouse button on any of the selected stocks. 5. Continue to hold down the left mouse button, while moving the mouse to the desired WatchList. 6. Release the left mouse button when the cursor is directly over the name of the WatchList to which the stocks will be added. Adding Stocks to a WatchList using the Right-Click Options Menu: 1. Select the "Viewers" tab. 2. Select the Stock Viewer or an existing WatchList. 3. Tag the stocks that you wish to add to a WatchList. 82
87 VectorVest 7 PDF 4. Leave your cursor on any of the selected stocks, and right-click to view the Options Menu. 5. Left-click "Add to WatchList". The "Add to WatchList" window will appear. 6. Select the group that contains the WatchList to which you would like to add stocks. 7. Left-click the WatchList to which you would like to add the stocks. (To create a new WatchList, click the New Icon at the top of the "Add to Watchist" window, or right-click on an existing group and use the Options Menu to select "New WatchList".) 8. Left-click "OK". Graphing using the Local Toolbar: Graphs 1. Select the Viewers Tab. 2. Select Stock, Industry, or Sector Viewer, or select a WatchList. 3. Left-click the top stock or record, or tag the records you wish to select. 4. Left-click the drop down arrow beside the Graph Button. 5. Choose All, Selected, or Top #. Choosing Select All will graph all the records visible on the Viewer Screen, Graph Selected will only graph the stocks you have tagged, and Graph Top... will graph the number of stocks you have chosen using the selection box. Your Graph choice will saved, and you can repeat the same graph selection just by clicking the Graph Button. You may also access the Graph feature by selecting a record, then right-clicking and choosing View Graph from the Options Menu, or by using the Graph Tab. Graphing using the Right-click Options Menu: 1. Left-click the stock, industry, or business sector to graph, or tag multiple records. 2. Right-click on the selected record(s). 3. Select "View Graph" from the Options Menu that appears. 83
88 Customizing Viewer Layouts Each Viewer within RealTime gives you the ability to customize the layout to your exact specifications! The layout you create is unique to each Viewer, letting you select different layouts for Viewers, Portfolios, and UniSearch. You can choose the sort, the number of stocks to display, the fields shown or even the font! The Layout Window will also allow you to create custom fields and make changes to your color scheme. Make as many changes as you like, the original Viewer layout can be easily restored with one click of the mouse. Accessing the Viewer Layout Window: 1. Select the Viewers Tab. 2. Select a Viewer (Stock, Industry, Sector, ETF, Market Index or WatchList) 3. Right click on any Stock, Industry Group, Business Sector, ETF or Market Index.. 4. Click "Layout...". A window will appear, showing you the columns which are currently being viewed (right), as well as a list of fields that can be added to the layout (left). 84

89 VectorVest 7 PDF Adding Fields to the Viewer: 1. Access the Viewer Layout Window (read instructions above) 2. To add a field, use the scroll bar for the left panel to locate the field, or click on any of the fields on the left and start typing the field name. The fields are grouped by category, but can be alphabetized by clicking the '"Grouped" Button. 3. Use the right arrow to move the indicator to the Fields Shown Panel. 4. Click "OK" after making your final selections. Removing Fields from the Viewer: 1. Access the Viewer Layout Window (read instructions above) 85
90 2. To remove a field, use the scroll bar for the right panel to locate the field you're interested in, or click on any of the fields on the right and start typing the field name. 3. Use the left arrow to move the indicator to the Fields Hidden Panel. 4. Click "OK" after making your final selections. Changing the Column Order: 1. Access the Viewer Layout Window (read instructions above) 2. Use the scroll bar along the right panel to locate and select the field you would like to move, or click on any of the fields on the right and start typing the field name. 3. Click the directional arrows to move the field up or down to the desired location. 4. Click "OK" after making your final selections. Changing the Default Number of Records: 1. Access the Viewer Layout Window (read instructions above) 2. Type the number of rows to display in the selection box, or click the "View All" Button. 3. Click "OK" after making your final selections. Changing the Viewer Font: 1. Access the Viewer Layout Window (read instructions above) 2. Left-click on the current font. 3. Select the new font type, style, and/or size you would like to use in the Font Window. 4. Click "OK" on the Font Window. 5. Click "OK" on the Viewer Layout Window after making your final selections. Creating Custom Fields in the Layout Window: 1. Access the Viewer Layout Window (read instructions above) 2. Click the F(x) Button. For more information about building custom fields, click here. Restoring the Viewer Defaults: 1. Access the Viewer Layout Window (read instructions above) 2. Click the "Restore Defaults" Button. 86
91 VectorVest 7 PDF 3. Click "OK" on the Viewer Layout Window. Using the Layout Window Splitter: The Splitter Bar is a line of dashes in the Layout Window. This Splitter allows you to 'freeze' the columns situated above it, so that these columns are always viewable when scrolling. 1. Access the Viewer Layout Window (read instructions above) 2. Left-click on the Splitter Bar in the right panel. 3. Use the directional arrows to move the Splitter Bar up or down, as desired. 4. Click "OK" on the Viewer Layout Window after making your final selections. Autofit Columns Autofit columns will resize the column width to fit the data displayed. Using Autofit: 1. Right click on any Stock, Industry Group, Business Sector, ETF or Market Index. 2. Left-click "Autofit" from the Options Menu that appears. Selecting the Number of Records to Print: Printing Use the "Display" box on the Local Toolbar to type or select the number of records to print. The maximum number of stocks that can be displayed while viewing RealTime data is 100. Printing from the Local Toolbar: 1. Access the Stock, Industry, Sector, or WatchList Viewer, or UniSearch Results. 2. Choose the number of records to print by changing the number of records to display. 3. Click the Printer Icon on the Local Toolbar. The Print Preview Window will appear. 4. Click the Printer Icon on the Print Preview page. The page orientation (landscape or portrait) and column layout may be changed using the Toolbar at the top of the Print Preview Window. 87
92 Printing from the Options Menu: 1. Access any Viewer Grid. (Stock, Industry, Sector, WatchLists, Unisearch, and Portfolios use Viewer Grids to display information.) 2. Right-click on any record in the Viewer Grid (any stock, industry, or sector). 3. Select "Print" from the Options Menu that appears. 4. Click the Printer Icon on the Print Preview Page. The page orientation (landscape or portrait) and column layout may be changed using the Toolbar at the top of the Print Preview Window. Changing the Paper Orientation: 1. From the Print Preview Window, left-click "Page Setup..." 2. Left-click the radio button beside "Portrait" (vertical orientation) or "Landscape" (horizontal orientation). 3. Click "OK". Changing the Print Margins: 1. From the Print Preview Window, left-click "Page Setup..." 2. Type the margin to be used for the left, right, top and bottom of page. 3. Click "OK". Selecting Columns to Print: 1. Left-click the drop down arrow next to "Column Layout", and select "Custom" (see picture below). The print preview screen will refresh. 2. Left-click "Customize..." next to the drop down menu. The Print Layout Window will appear. To remove a column: Select the column name in the "Columns in Grid Panel", and left-click the arrow pointing to the left. The column will be moved to the 'Field List', and will not be printed. To change the placement of a column, select the column name in the "Columns in Grid Panel", and use the up/down arrows to move the column to the desired location. 88
93 VectorVest 7 PDF To add a column, select the column name in the "Field List Panel", and leftclick the arrow pointing to the right. The column will be moved to the "Columns in Grid Panel", and will be printed. 3. Click "OK" when the changes are complete. Note: Multiple fields may be selected by tagging. Viewing Fields in the Print Layout Window: By default, the fields shown in the Print Layout Window will be grouped by category. Click the "Grouped" Button to display the fields without their groups. Creating Custom Fields from the Print Layout Window: 89
94 Custom Fields may be created and added directly from the Print Layout Window. To create a custom field click the "F(x)" Button. For more information about building custom fields, click here. Export to.csv A list of stocks, industries or sectors, may be exported from VectorVest RealTime in.csv (Comma delimited) format. The information can then be viewed using Excel, or imported into other programs that receive.csv files. Note: Only non-proprietary data can be exported. Exporting a list of stocks, industries, or sectors: 1. Select the Viewers tab. 2. Select any Viewer (Stock, Industry, Sector, or WatchList Viewer) 3. Select a record, or tag multiple records. 4. Right-click on any of the selected records. 5. Select "Export to.csv" from the Options Menu. 6. Select All Rows, or Selected Rows. 7. Remove any columns you do not wish to export by double-clicking on the Export Fields. By default, all columns will be selected for export. The columns may also be arranged in any order using the directional arrows in the middle of the window. 8. Click "OK". 9. Type a name for the file. 10. Select a destination to save the file. 11. Click "Save". About Graphs Graphs VectorVest RealTime provides powerful graphing features in a convenient, easy-to-use format. RealTime Graphs are completely customizable using Intraday, Daily, Weekly, or End of Week Data, and can be accessed from any section of the program. 90

95 VectorVest 7 PDF About Candlesticks Candlestick charts are the default graph type in VectorVest RealTime, and have the ability to convey much more information about a security's price movement than the standard line graph. Below is a basic explanation of how to interpret RealTime candlesticks. The color of the candlestick, red or green by default, is determined by where the current candlestick closed in relation to the previous candlestick. The candlestick will be red if it closes lower that the previous candle's close. The candlestick will be green if it closes higher that the previous candle's close. Some candlesticks will be filled (solid), and some will be unfilled (hollow) based on where the current candle closes relative to its open price. If the candlestick closes lower than it opened the candle will be filled (Tip: Think of the candle falling lower because it's heavy). If the candlestick closes higher than it opened, the candle will be unfilled. The purple line shows the open of each candlestick for demonstration. 91
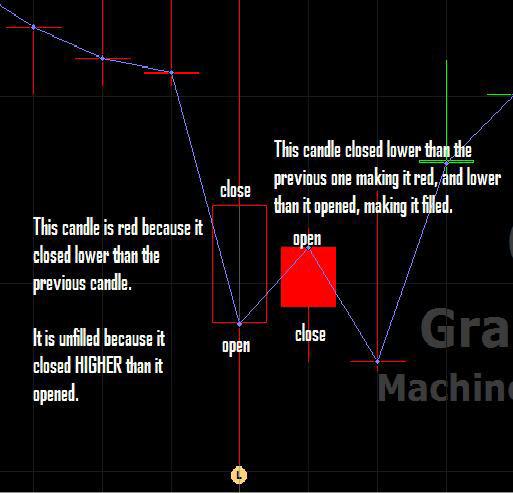
96 92
 located in the upper right corner of the main screen or on the Graphs tab. 2.")
97 VectorVest 7 PDF Accessing the Default Graph Tab: Default Graph Settings 1. Click the Options Icon (wrench) located in the upper right corner of the main screen or on the Graphs tab. 2. Click the 'Graphs' tab on the Settings window that appears. 93

98 Default Time Frame: The Default Time Frame section allows you to customize the type, frequency, and time span of your default graph. 94

99 VectorVest 7 PDF Type will allow you to select Intraday, End of Day, End of Week, or Weekly data as your initial graph type. Intraday: displays tick-by-tick information End of Day: displays the closing information for the security End of Week: displays information from the last trading day of the week Weekly: displays information from the beginning through the end of each week. By default, Intraday data will be selected. To change the selection, click the drop down arrow beside 'Type'. Click 'Apply Changes' when your selections are complete. Frequency is only available for Intraday data, and will allow you to select the number of minutes used to form each candlestick on the chart. By default, 1 minute bars will be selected. Click the drop down arrow next to the selection box to select a different time frame. Click 'Apply Changes' when your selections are complete. Span is available for all periods and will allow you to choose the amount of information on the chart. In addition to numerous time frames, the Best fit selection will display the optimal time frame for your screen resolution. Current day will only display information from the current day's open forward, while choosing 1 day, will display 24 hours of information. By default, 1 day is selected. Click the drop down arrow next to the selection box to select a different time frame. Click 'Apply Changes' when your selections are complete. 95

100 Other Settings: Other Settings will allow you to enable multiple graph tabs, as well as change several display aspects that affect margins, menu orientation, and graph labels., Right Margin will indent the right hand side of the chart. Click the up arrow to increase the right margin, and the down arrow to decrease it. The default margins are set to 0 so the graph will be displayed from edge to edge. Click 'Apply Changes' when your selections are complete. Grid Orientation will change whether the Parameter List is displayed on the right or the left side of the graph. The default display is set to the right side. To change, use the drop down arrow. The Parameter List can be completely hidden at anytime by using the show/hide arrows. Click 'Apply Changes' when your selections are complete. Main Watermark is the ticker symbol that is displayed in the background of each chart. This setting is already selected by default. To hide the watermark, un-check the selection box next to Main Watermark. Click 'Apply Changes' when your selections are complete. Company Name Watermark is the security name that is displayed in the background of each chart. This setting is already selected by default. To hide the watermark, un-check the selection box next to Company Name Watermark. Click 'Apply Changes' when your selections are complete. Industry/Sector Watermark is the name of the industry group and sector that is displayed in the background of each chart. This setting is already selected by default. To hide the watermark, un-check the selection box next to Company Name Watermark. Click 'Apply Changes' when your selections are complete. 96

101 VectorVest 7 PDF Axis Titles label the parameters displayed on each section of the chart. For example, Price, RT, and Volume are all displayed in separate sections of the chart and the axis title would be located at the top left of each section. This setting is already selected by default. To hide the axis titles, un-check the selection box next to Axis Titles. Click 'Apply Changes' when your selections are complete. Cursor Defaults: Cursor Defaults allow you to choose the type of cursor that is displayed on your chart. By default, no cursor is selected as the default. You may set the cursor defaults, or choose your cursor manually from the graphing toolbar. Save Cursor on Change will remember and save the last cursor manually selected, and use this cursor on successive charts. Check the selection box next to Save Cursor on Change to use this option. Click 'Apply" when your selections are complete. Cursor Type is a drop down selection for all the cursors available in VectorVest Realtime. This selection is only available when the Active selection box is checked. There are many cursor types available to choose from: Crosshair Cursor: Displays information from both the vertical and horizontal axis of the chart. The data displayed will be for the close of each bar. This is a dynamic cursor that will follow the motions of your mouse. Horizontal Cursor: Only displays information from the horizontal axis of the chart. This is a dynamic cursor that will follow the motions of your mouse. Vertical Cursor: Only displays information from the vertical axis of the chart. This is a dynamic cursor that will follow the motions of your mouse. DateLine Cursor: Displays information in the Parameter List. This is a static cursor. Left click on the data point to display the information for the date or time selected. 97

102 Cursor Active will enable you to choose a single default cursor that will appear on each new graph. This selection is not available when Save Cursor on Change is already selected. To enable this selection, check the selection box next to Active and use the drop down arrow next to Cursor Type to make your selection. Click 'Apply' when your selections are complete. Graph Theme: Graph Themes will allow you to make changes to the colors displayed on several areas of the graph. Graph Theme will allow you to select a pre-designed theme from the drop down list. There are three themes to choose from: Custom, Classic White, and VectorVest Black. VectorVest Black is the default choice. Selecting the Classic White theme will change the color scheme to a traditional white background. You may also change the color of the individual components of the graph screen, which will result in a Custom Theme. These components are listed below the themes, and include: Background, Axes, Labels, Grid Lines, Watermark, Extended Hours, Market Call Up, and Market Call Down. Each of these can be changed by clicking the drop down arrow to the right of the current color and using the color chart to select your new choice. Click 'Apply' when your selections are complete. Restore Defaults: You may restore the original default graph selections and colors by clicking the 'Restore Defaults' button located at the bottom of each section of the Settings Window. 98
103 VectorVest 7 PDF Viewing Multiple Graphs There are several display forms available to choose from when viewing multiple graphs in VectorVest RealTime. You may use the scroll bar to quickly move through multiple stocks in the same tab, you can create separate tabs for each stock or list of stocks, or view up to four symbols simultaneously using MultiView. Viewing Multiple Graphs on a Single Tab: 1. Access RealTime Graphs by clicking the Graphs Tab on the Main Menu Toolbar. 2. Type the ticker symbol(s), or company name, separated by a comma into the Add Symbol(s) Window located on the Local Toolbar. If you do not know the symbol, start typing the company name and select it from the list that appears. 3. Press Enter on your keyboard when finished. The first stock in your list will be displayed on the graph. 4. Click the down arrow on the scroll bar to move to the next symbol (the scroll bar is located to the right of the graph). OR 1. Select the stock, industry, sector, ETF or Market Index you wish to view or tag multiple records. 2. Right-click on any of the selected records. 3. Select View Graph from the Options Menu that appears. The first record will be displayed. 4. Click the down arrow on the scroll bar to move to the next symbol (the scroll bar is located to the right of the graph). Viewing Graphs using Multiple Tab View: 99
104 1. Access RealTime Graphs by clicking the Graphs Tab on the Main Menu Toolbar. 2. Type the ticker symbol(s) separated by a comma into the Add Symbol(s) Window located on the Local Toolbar, or you may choose a different graph type (industry, sector, market timing, or performance) by using the Graph Type Selector on the Local Toolbar. 3. If you have typed a list of symbols, press enter on your keyboard when finished. The graph will be displayed on the current tab. 4. To display the next record using a new tab, click the "Add New..." tab located directly above the Local Toolbar. 5. Continue steps 2-4, using as many tabs as desired. OR 1. Select the stock(s), industry, sector, ETF or Market Index you wish to view. 2. Right-click on any of the selected records. 3. Select View Graph from the Options Menu that appears.the first record will be displayed on the current tab. 4. To display the next record using a new tab, click the "Add New..." tab located directly above the Local Toolbar. 5. Continue steps 2-4, using as many tabs as desired. Viewing Graphs using the Multi-View Window: 1. Access RealTime Graphs by clicking the Graphs Tab on the Main Menu Toolbar.. 2. Left-click on the MultiView tab. 3. Use your mouse to select two vertical or horizontal frames, or select all four. 4. Use the graph toolbar at the top of each frame to customize each graph. You can also click the MultiView tab while you are viewing any of the VectorVest graphs. MultiView will load the current graph in one of the available frames selected. Detaching Graphs To detach a graph, left-click the Detach Icon located on the corner of each tab. 100

105 VectorVest 7 PDF Zooming a Graph Area The zoom feature allows you to magnify any portion of the graph for better viewing. RealTime allows you to continue using the same analysis tools and techniques on a zoomed graph as you would an un-zoomed graph. Zooming within VectorVest RealTime Graphs: 1. Access any graph. 2. Move your cursor to the starting point of the data you would like to enlarge. 3. Hold down the left mouse button, while moving the mouse from the beginning to the end of the data you would like to magnify. Please note that you can zoom into a minimum of four bars. 4. Release the left mouse button. To Undo the Zoom: 1. Hold down the left mouse button, while moving the mouse from the right of the screen to the left. This can be done over a very small area of the graph. 2. Release the left mouse button, after moving to the left.. Enlarging the Graph Viewing Area The Fill Mode Icon can be used to hide the Local Graph Toolbar, Shortcuts and Markers, providing a larger display area for the graph. Click the Icon to toggle Fill Mode on or off. 101
106 Timespan Scroll Bar The Timespan Scroll Bar can be found on all graphs. This tool identifies the amount of data currently being displayed on the screen, and allows the user to scroll to past data that is beyond the currently viewed area, or to increase the amount of data that is being shown. Viewing past data using the Timespan Scroll Bar: There are several ways to view past data using the Timespan Scroll Bar: 1. Click in the empty space beside the scroll bar to display the next block of time.. 2. Place the mouse cursor on the Timespan Bar, hold down the left mouse button, and drag the bar in the desired direction. 3. Use the white arrows on either end of the Timespan Scroll Bar to move the viewing area in smaller increments. Increasing Viewable Data using the Timespan Scroll Bar: 1. Place your cursor over the small black arrow on the Timespan Scroll Bar. Your cursor will change to a double-headed arrow. 2. Hold down the left mouse button and drag the Timespan Bar to the left. The increased time will be reflected on the scroll bar. 3. Release the mouse button when the desired amount of time is reached. 102

107 VectorVest 7 PDF Graph Markers Graph Markers bring significant data changes to your attention. There are eight markers included in the VectorVest Program, including Markers, High Low, Splits, Dividends, REC, Log, Last Close, and Calls. Display them all, or just the ones that are important to your trading. To show a graph marker left-click on the marker label on the bottom toolbar. To hide a graph marker repeat this process. Available Markers: Marker: The Real Time marker is shown on the right side of the screen and marks the current price-level. It is color coded, green when the price is higher than the previous bar's close, red when the price is lower than the previous bar's close, and yellow when the price is unchanged from the previous bars close. High Low: The High Low Marker will mark the high price and the low price for the viewable graph area. Splits: The Split Marker will be displayed at the point a stock has split, and show the amount of shares split. REC: The REC Marker is displayed at the top of the graph, and will show the VectorVest Buy, Sell, or Hold Recommendation for any security. 103

108 Log: The Log Marker allows you to view a Logarithmic chart when selected, or a Linear chart when un-selected. Calls: The Calls Marker displays the VectorVest Confirmed Market Calls. This marker is not available when viewing Intraday data. A down call is represented by a red arrow tip and an up call is represented by a green arrow tip. Hover your mouse over the up or down arrow tip and the time frame of the call will be visible. The time period will also be highlighted red or green on the graph. Last Close: The Last Close Marker marks the last closing price of the security. Date Range Button The Date Range Button allows you to set the begin date and end date for the information displayed. Using the Date Range Button: 104

109 VectorVest 7 PDF 1. Click the Date Range Button located along the bottom of the Graph Window. 2. Use the Date/Time Control on the left to select the begin date. 3. Use the Date/Time Control on the right to select the end date. 4. Click "OK". Click here for more information on using the Date/Time Control. Time Span Shortcuts The TimeSpan Shortcut Buttons allow the user to quickly select from several predefined time periods for the graph. Left-click on the desired period to change the time span shown. 105
110 Graph Types Stock Graphs Stock Graphs can be accessed from any section of the program. Graphing Stocks Using the Main Menu Bar: 1. Access RealTime Graphs by clicking the Graphs Tab on the Main Menu Toolbar. 2. Type the ticker symbol(s), or company name, separated by a comma into the Add Symbol(s) Window located on the Local Toolbar. If you do not know the symbol, start typing the company name and select it from the list that appears. 3. If you have typed a list of symbols, press enter on your keyboard when finished. Graphing Stocks Using the Local Toolbar: 1. Access the Stock Viewer, Watchlist, or UniSearch Results. 2. Left-click the stock you wish to select, or tag multiple stocks. 3. Left-click the drop down arrow beside the Graph Button. 4. Choose All, Selected, or Top #. 106
111 VectorVest 7 PDF Choosing Select All will graph all the records visible on the Viewer Screen, Selected will only graph the stocks you have tagged, and Top will graph the number of stocks you enter in the window. Your Graph choice will saved, and you can repeat the same graph selection just by clicking the Graph Button. You may also access the Graph feature by selecting a record, then right-clicking and choosing View Graph from the Options Menu, or by using the Graph Tab. Graphing Stocks Using the Options Menu: 1. Access the Stock Viewer, Watchlist, QuickList or UniSearch Results. 2. Left-click the stock you would like to graph, or tag multiple stocks. 3. Right-click on the selected record(s). 4. Select "View Stock Graph" from the Options Menu that appears. Industry Graph Graphing Industries Using the Main Menu Bar: 1. Access RealTime Graphs by clicking the Graphs Tab on the Main Menu Toolbar. 2. Click the Graph Type Selector, then choose Industry Graph. 3. Choose the Industry you wish to view from the selection box to the right of the Graph Type Selector. 107
112 Graphing Industries Using the Local Toolbar: 1. Access the Industry Viewer. 2. Left-click the Industry, or Industries, you wish to select or tag multiple records. 3. Left-click the drop down arrow beside the Graph Button. 4. Choose All, Selected, or Top #. Choosing Select All will graph all the records visible on the Viewer Screen, Selected will only graph the stocks you have tagged, and Top will graph the number of stocks you enter in the window. Your Graph choice will saved, and you can repeat the same graph selection just by clicking the Graph Button. You may also access the Graph feature by selecting a record, then right-clicking and choosing View Graph from the Options Menu, or by using the Graph Tab. Graphing Industries Using the Options Menu: 1. Access the Stock Viewer, Industry Viewer, ETF Viewer, Market Index Viewer, Watchlist, QuickList or UniSearch. 2. Left-click the record you would like to graph or tag multiple records. 3. Right-click on the selected record. 4. Select "View Industry Graph" from the Options Menu that appears. Sector Graph Graphing Sector(s) Using the Main Menu Bar: 108
113 VectorVest 7 PDF 1. Access RealTime Graphs by clicking the Graphs Tab on the Main Menu Toolbar. 2. Click the Graph Type Selector then choose Sector Graph. 3. Choose the Sector you wish to view from the selection box to the right of the Graph Type Selector. Graphing Sector(s) Using the Local Toolbar: 1. Access the Sector Viewer. 2. Left-click the Sector(s) you wish to select or tag multiple records.. 3. Left-click the drop down arrow beside the Graph Button. 4. Choose All, Selected, or Top #. Choosing Select All will graph all the records visible on the Viewer Screen, Selected will only graph the stocks you have tagged, and Top will graph the number of stocks you enter in the window. Your Graph choice will saved, and you can repeat the same graph selection just by clicking the Graph Button. You may also access the Graph feature by selecting a record, then right-clicking and choosing View Graph from the Options Menu, or by using the Graph Tab. Graphing Sector(s) Using the Options Menu: 1. Access any Viewer, Watchlist, QuickList or UniSearch Results. 2. Left-click the record you would like to graph or tag multiple records. 3. Right-click on the selected record. 4. Select "View Sector Graph" from the Options Menu that appears. Market Timing Graph 109
114 Each and every day in the VectorVest Views, we analyze the movement of the VVC price, RT and the Buy/Sell Ratio. These three factors are combined into a master indicator, called the Market Timing Indicator (MTI). The Market Timing Graph is a graphical representation of this analysis, which you may work with much like any standard VectorVest RealTime Graph. Accessing the Market Timing Graph: 1. Access RealTime Graphs by clicking the Graphs Tab on the Main Menu Toolbar. 2. Click the Graph Type Selector then choose Market Timing. Performance Graphs A Performance Graph allows you to see the performance of any Stock, Industry, or Sector compared to any other Stock, Industry, or Sector. The graph presents the percentage change from the first point on the graph. Accessing the Performance Graph: 1. Access RealTime Graphs by clicking the Graphs Tab on the Main Menu Toolbar. 2. Click the Graph Type Selector then choose Performance. 110

115 VectorVest 7 PDF Adding Items to the Performance Graph: Use the drop down selection boxes found in the Parameter List to add items to the graph. The Parameter List can be located on the right, or left of the graph screen, depending on your Default Graph Choices. Removing Items from the Performance Graph: To remove items from the Performance Graph, uncheck the selection box next to the item found in the Parameter List, or click on the item in the Parameter List, and choose 'Remove Item'. About the Graphing Toolbar Graphing Toolbar The Local Toolbar for all the graph types can be found at the top of the Graph Screen. The Toolbar has many options and will allow you to select the graph type, the type and frequency of your data, cursors, drawing features and more. Graph Type Selector The Graph Type Selector allows you to select from the five graph types available in VectorVest RealTime. 111
 separated by a comma into the Add Symbol(s) Window located on the Local Toolbar.")
116 Using the Graph Type Selector: 1. Left-click on the Graph Type Selector 2. Click the graph type of your choice. Symbol Input Box for Graphs Using the Symbol Input Box: 1. Access the Graph Tab from the Main Toolbar. 2. Left-click in the Symbol Input Box. 3. Type the ticker symbol(s) separated by a comma into the Add Symbol(s) Window located on the Local Toolbar. If you do not know the symbol, start typing the company name and select it from the list that appears. 4. Press Enter on your keyboard when finished. The listed stocks will be displayed. Please note: When a Sector or Industry Graph is chosen, the Symbol Input Box will change to a drop down menu for selections. Frequency/Time Selector The Frequency/Time Selector will allow you to choose the type of data, the timespan between data points, and the amount of data that is displayed. Using the Frequency/Time Selector: 112
117 VectorVest 7 PDF 1. Left-click on the Frequency/Time Selector 2. Place your cursor over the type of data you wish to display- Intraday, End of Day, End of Week, or Weekly. 3. Slide the cursor over to the timespan between data points that you would like to choose. 4. Slide the cursor over to the time frame you wish to select and left-click. Note: Intraday: displays tick-by-tick information End of Day: displays the closing information for the security End of Week: displays information from the last trading day of the week Weekly: displays information from the beginning through the end of each week. Drawing Features There are several drawing features available in VectorVest RealTime. All drawings will be automatically saved to the graph until deleted. 113

118 Line Types: Vertical Line -Draws a vertical line on the graph. Horizontal Line -Draws a horizontal line on the graph, commonly used to define support and resistance. Freehand Line -Draws a line in any direction, commonly used to draw diagonal lines, or trend lines. Extended Line -Draws a line in any direction, but continues that line into the future as time passes. Selecting a Drawing Color: 1. Left-click the drop down arrow next to the Drawing Button 2. Select "Drawing Color..." 3. Click the color of choice on the Color Window. 4. Click "OK" on the Color Window. 5. Click the Drawing Button again, and select the line type or annotation. Drawing Lines: 1. Left-click the drop down arrow next to the Drawing Button 2. Left-click on the line type. 3. Move your cursor to the desired beginning point for the line. 4. Hold down the left mouse button, while moving the mouse to desired end point for the line. 5. Release the left mouse button when the end point is reached. 114
119 VectorVest 7 PDF The last drawing choice will be displayed on the Drawing Button. Left-click on the Drawing Button to use the drawing feature shown. Adjusting Lines: 1. Left-click the drop down arrow next to the Drawing Button 2. Left-click "Drawing Selector". 3. Left-click any point on the line you wish to adjust. 4. Move the cursor to the axis (white dot on the line) and hold down the left mouse. 5. Move the mouse in the desired direction to extend the line, shorten the line, or change the slope. 6. Release the left mouse button when changes are complete. Removing Lines: 1. Left-click the drop down arrow next to the Drawing Button 2. Left-click "Drawing Selector". 3. Right-click on the line you with to delete. 4. Left-click "Delete". You may also use the Drawing Selector and right click menu to change the color of a line that has already been drawn. The last drawing choice will be displayed on the Drawing Button. Left-click on the Drawing Button to use the drawing feature shown. Drawing Annotations: 1. Left-click the drop down arrow next to the Drawing Button 2. Left-click on "Annotation". 3. Move your cursor to the desired beginning point for the annotation. 4. Hold down the left mouse button, while moving the mouse diagonally to expand the annotation box. 5. Release the left mouse button when the annotation is the desired size. 6. Click inside the annotation until you see the cursor appear, then type your text. Once the annotation has been drawn, you may right click on the annotation to change the color, or remove it completely. The last drawing choice will be displayed on the Drawing Button. Left-click on the Drawing Button to use the drawing feature shown. Cursor Types: Cursors 115

120 There are four cursor choices available in VectorVest RealTime: Crosshair Cursor: Displays information from both the vertical and horizontal axis of the chart. The data displayed will be for the close of each bar. This is a dynamic cursor that will follow the motions of your mouse. Horizontal Cursor: Only displays information from the horizontal axis of the chart. This is a dynamic cursor that will follow the motions of your mouse. Vertical Cursor: Only displays information from the vertical axis of the chart. This is a dynamic cursor that will follow the motions of your mouse. DateLine Cursor: Displays information in the Parameter List. This is a static cursor. Left click on the data point to display the information for the date or time selected. Selecting a Cursor: 1. Left-click the drop down arrow next to the Cursor Button. 2. Left-click on the cursor you would like to use. The last cursor choice will be displayed on the Drawing Button. Left-click on the Drawing Button to activate the cursor shown. Note: You may choose a default cursor using Default Graph Settings. Printing Graphs: Printing a Graph 116
 While viewing a stock graph, you may want to check the news.")
121 VectorVest 7 PDF 1. Open any graph in VectorVest RealTime. 2. Click the Print Icon on the Local Toolbar. The Print Preview Window will appear. 3. Click the Print Button on the Print Preview Window. Viewing News (Graphs) While viewing a stock graph, you may want to check the news. To check the news for the stock you are currently viewing, click the News Button on the Local Toolbar to be linked directly to Yahoo's latest headlines for the company. Graph Layouts VectorVest RealTime allows you to customize the parameters displayed, moving averages, and color schemes then save these settings as named graph layouts. Note: The data type, time span, and frequency are not saved with a layout. Saving a Graph Layout: 117
. 5. Left-click \"Save/Modify Layouts.\" 6. Left-click \"Add New Layout\". 7. Type a name for the layout. 8. Click \"OK\".")
122 1. Access any graph type. 2. Add/display the parameters you would like saved to the layout. 3. Make any color changes you would like saved. 4. Select Graph Layouts in Graph Control Panel (see above image). 5. Left-click "Save/Modify Layouts." 6. Left-click "Add New Layout". 7. Type a name for the layout. 8. Click "OK". Applying a Saved Graph Layout: 1. Select Graph Layouts in Graph Control Panel. 2. Left-click the name of the layout you wish to view. Default Graph Layout: 1. The last layout selected is the default layout. Renaming a Graph Layout: 1. Select Graph Layouts in Graph Control Panel. 2. Left-click "Save/Modify Layouts." 3. Select "Rename". 4. Type the new name. 5. Click "OK". 118
123 VectorVest 7 PDF Saving Changes to a Layout: 1. Select Graph Layouts in Graph Control Panel. 2. Left-click "Save/Modify Layouts." 3. Select "Save Changes". 4. You will receive the following message, "This will overwrite the selected layout with the current layout" 5. Click "OK". Deleting a Custom Graph Layout: 1. Select Graph Layouts in Graph Control Panel. 2. Left-click "Save/Modify Layouts." 3. Select "Delete". 4. You will receive the following message, "This will permanently delete the layout" 5. Click "OK". Hide/Show Parameter List Parameter List The Parameter List may be located on the right or left side of the graph, depending on your default graph settings. You may show or hide the Parameter List by clicking on the double arrows. 119

124 Adding Parameters to the Field List VectorVest RealTime gives you the ability to add any VectorVest parameter or Custom Field to a graph. Graphing Additional Parameters: 1. Click the Add Parameter Button at the top of the Parameter List 2. Parameters are grouped by category. To view the parameters in each category, place your cursor over that category. 3. Left-click on the parameter you would like to add. The parameter will be added to the bottom of the Parameter List. 4. Left-click the selection box next to the parameter to display it on the graph. 120

125 VectorVest 7 PDF Removing Parameters from the Parameter List: 1. Right-click on the parameter to be removed. 2. Select Remove Item. Rearranging the Parameter List You can change the order of the fields displayed in the Parameter List by dragging and dropping. Changing the Field Order of the Parameter List: 1. Place the mouse cursor over the Field Name to be moved. 2. Hold down the left mouse button, while moving the mouse cursor to the new location. 3. Release the left mouse button to drop the field into the new location. Parameter Settings Menu By clicking on any of the fields shown in the Parameter List, you have the ability to make changes to the parameters displayed. These changes include changing the graph 121
126 type, changing the parameter color, adding point markers, adding moving averages, and removing the parameter from the list. Changing the Graph Type: 1. Make sure selection box next to the parameter is checked. 2. Right click on the name of the field in the Parameter List. 3. Move your cursor to "Change Type" 4. Left-click area, bar, line, OHLC (open-high-low-close), or candlesticks. Note: Not all parameters will have every graph type. Adding Moving Averages: 1. Right click on the name of the field in the Parameter List. 2. Move your cursor to "Moving Average" 3. Left-click on the period of your choice or select Custom. Note: The frequency/timespan of the moving average will match the graph. For example, if you are looking at one-minute bars, the moving average would also be in minutes. Using Line Markers: 1. Make sure the selection box next to the parameter is checked. 2. Right click on the name of the field in the Parameter List. 3. Select "Change Style..." 4. Slide your cursor over to "Line marker size" 5. Left-click small, medium, or large To change the shape of the point marker, repeat steps 1-3, then choose "Line Marker Type". Removing Line Markers: 1. Make sure selection box next to the parameter is checked. 2. Right click on the name of the field in the Parameter List. 3. Select "Change Style..." 4. Select "None" from "Line Marker Type". Changing the Parameter Color: 1. Make sure selection box next to the parameter is checked. 122
127 VectorVest 7 PDF 2. Right click on the name of the field in the Parameter List. 3. Select "Change Style...". 4. Left-click on the color of your choice from "Series Color". 5. Click "OK" on the Color Window. Deleting Parameters from the List: 1. Right click on the name of the field in the Parameter List. 2. Click "Remove Item". UniSearch About UniSearch UniSearch is a master search tool that enables you to create custom searches and find Stocks, Industry Groups, or Business Sectors that are consistent with your investment style and objective. In addition to creating your own searches, you will find more than 200 pre-programmed searches that are ready to use. These searches are classified by investment style for easy reference, and can be modified to fit your investment preferences. You'll be able to find and sort stocks in just seconds using the unique array of parameters that can only be found in VectorVest. Not only does the UniSearch Tool have the ability to find stocks that are meeting specific conditions at a fixed point in time, but it can also find stocks that are meeting these conditions over multiple points in time-- weeks, days, even minutes can be used! Regardless of the type of stocks you want to find, the UniSearch Tool can make your search quicker and easier than ever before! Accessing UniSearch: Click the UniSearch Tab on the Main Menu Bar. The UniSearch Screen 123

128 Detaching the UniSearch Screen The UniSearch window can be detached from the main program by clicking the Detach Icon on the UniSearch Tab. To return UniSearch to the main viewer, close the detached window by clicking the 'X' in the top right corner. Running a Search Running a Search: 1. Select the UniSearch tab. 2. Left-click on the Search Group of your choice. 3. Left-click on the Search that you would like to run. 4. Click Run Search. 124
129 VectorVest 7 PDF OR 1. Select the UniSearch tab. 2. Left-click on the Search Group of your choice. 3. Double-click on the Search that you would like to run. Creating a Quickfolio from Search Results Instant portfolios or QuickFolios can be created from any search directly from the UniSearch Tab. You may also create both long or short portfolios using any of the searches in UniSearch from the Portfolios Tab. Creating a QuickFolio from UniSearch: 1. Run the desired search. 2. Highlight, or tag, the stocks that will be added to the QuickFolio. 3. Right-click on the highlighted area to show the Options Menu. 4. Left-click on "QuickFolio". 5. Type a name for the QuickFolio, and make your selections for initial capital, margin, interest and purchase type. 6. Left-click "OK". The new portfolio can be accessed by selecting the Portfolios tab. Changing the Run Date of a Search The UniSearch Tool enables you to run any search on a historical basis. Running a search on a past date, then using QuickTest to reveal the performance, is one way to evaluate the effectiveness of a search. By default, RealTime includes 5 days of Intraday data, and 10+ years of Daily historical data. Selecting the Run-Date for a Search: 1. Open UniSearch. 2. Choose a Search to run from the Search Directory at the left side of the screen. 3. Click the Date/Time Control on the Local Toolbar. 4. Use the calendar tool to select a date and/or time. 5. Click Run Search to run your search on the selected date. 125
130 Quick Test The Quick Test feature will determine a stock or group of stocks' individual and overall gain or loss over a period of time. By default, the QuickTest start time will be the current time and date displayed in the Date/Time Control Window. In RealTime mode, the end time will also default to the current date and time. In End of Day Mode, the end date for the QuickTest will default to the close of the most recent trading day. For convenience, the gain and loss calculations are also reported as an annualized rate of return. The Compare feature allows the user to compare the performance of the tested stocks to that of another symbol. The Quick Test feature is available in all Viewer screens, and the UniSearch Tool. To QuickTest using the Local Toolbar: 1. Select the Viewers Tab or UniSearch. 2. Select a Viewer, or Watchlist, or Run a Search. 3. Left-click the first record listed, or tag the records that you wish to select. 4. Left-click the drop down arrow beside the QuickTest Button. 5. Choose All, Selected, or Top #. Choosing Select All will QuickTest all the records visible on the Viewer Screen, QuickTest Selected will test only the stocks tagged, and QuickTest Top... will test the top number of stocks. Your QuickTest choice will saved, and you can repeat the same type of QuickTest just by clicking the QuickTest Button. To QuickTest using the Options Menu (right click method): 1. Left-click the stock, or tag multiple stocks, you would like to test. 2. Right-click on any of the selected records. 3. Select "Quicktest" from the Options Menu that appears. Changing a Sort You may sort the results of a Search using any combination of the VectorVest parameters. You may choose from one of the VectorVest parameters or one of the 126
131 VectorVest 7 PDF Custom Fields that you have created. The Sort Selection window allows you to change the Primary and Secondary Sorts. If you have added a custom sort into the system, it will be listed with the available Primary and Secondary sorts. Changing a Sort in UniSearch: 1. Open UniSearch 2. Select your Search from the Search Directory on the left. 3. Click the Sorting Button located on the Local Toolbar. A Sort Selection window will appear. 4. Click the drop down arrow below Primary Sort. Sorts are listed in alphabetical order. Use the Scroll Bar to find the desired sort or use your keyboard to type the first letter of the sort you wish to choose. 5. Click the desired Sort. 6. Click the drop down arrow below Secondary Sort. 7. Click the desired Sort. 8. Select Asc or Desc. This will sort the records in Ascending (lowest to highest) or Descending (highest to lowest) order. 9. Click OK. Your search is now ready to run with the new sort. OR 1. Open UniSearch. 2. Select your Search from the Search Directory on the left. 3. Click "Run Search". 4. Left click on the column heading of the parameter you would like to sort by. This will sort the records by the parameter you have chosen in Descending Order (highest to lowest). 5. Click on the column heading again to change the sort to Ascending Order (lowest to highest). Adding Search Results to a WatchList or QuickFolio After running a search in UniSearch, you may want to add the results to a WatchList or a QuickFolio to track the list of stocks that you found. 127
132 Adding Search Results to a WatchList: 1. Open UniSearch 2. Select a Search. 3. Click "Run Search" 4. Tag the stocks that you wish to add to a WatchList. 5. Leave your cursor on any of the selected stocks, and right click to view the Options Menu. 6. Left-click "Add to WatchList". The Add to WatchList Window will appear. 7. Select the Group that contains the WatchList to which you would like to add stocks or add new group by selecting "New Group". 8. Left click the WatchList to which you would like to add the stocks. (If you would like to create a new WatchList instead, you may do so by clicking the New Icon at the top of the Add to WatchList Window.) 9. Click OK. Adding Search Results to a QuickFolio: 1. Open UniSearch 2. Select a Search. 3. Click "Run Search" 4. Tag the stocks that you wish to add to a QuickFolio. 5. Leave your cursor on any of the selected stocks, and right click to view the Options Menu. 6. Left-click "QuickFolio...". 7. Type a name for your QuickFolio then fill out the "Quickfolio Settings" 8. Click "OK" OR 1. Repeat steps Select "Quickfolio" in upper right corner of screen near the print icon 3. Choose All, Selected, or Top #. *Choosing Select All will Quickfolio all the records visible on the Viewer Screen, Quickfolio Selected will only create a portfolio for the stocks tagged, and QuickFolio Top... will create a portfolio for top number of stocks. 128
133 VectorVest 7 PDF The new QuickFolio will be listed on the Portfolios tab. Filtering Search Results By default, searches will be run on all the stocks in the VectorVest database. UniSearch has the ability to "filter" your searches using specific Industry Groups, Business Sectors or WatchLists. Narrowing your searches to the hottest Industry Groups, the strongest Sectors, or an overall strong list of stocks in a specified WatchList can enhance your investment results. Using the Filter By Feature: 1. Open UniSearch. 2. Select a search from the Search Directory 3. Click the first empty field in the Parameter Column. 4. Select Stocks; then Filter by. You are then given the option of running your search on a specific exchange, Industry Group, Business Sector, Portfolio, WatchList or Stock. 5. Click in the next empty field to select the Operator; Click the = sign. 6. Continue to the next empty field directly below Value. 7. Make your selection from the menu that appears. Locating a Search By default, all searches are grouped into categories, but these categories can be hidden to display the searches in alphabetical order. To Locate a Search: 1. Open UniSearch. 2. Click the A-Z Icon on the Search Directory Toolbar. 129
134 3. Use the scroll bar on the right to locate the search name or click on any of the searches listed and start typing the search name. Editing a VectorVest Search RealTime gives you the ability to edit any of the pre-existing VectorVest searches and save them under a new name. To Edit a VectorVest Search: 1. Open UniSearch. 2. Click the name of the Group that contains the search you wish to customize. 3. Click once on the search to be modified. This will highlight the search name. The criteria for the selected search will appear in the Criteria Grid to the right of the Search Directory. 4. Once the search has been selected, you may then add, remove or change any of the criteria for the search. To remove criteria, right click on the parameter you wish to delete then click "Delete Parameter". To change criteria, click on the parameter or value you wish to change, and select from the available choices. To add criteria, click in the empty space under Parameter and select from the available choices. Continue across. Once you have made the appropriate changes, use the following steps to save the search: 1. Click on the Save Icon on the Search Directory Toolbar. A Save Search window will appear. 2. Type in a name for the new search, then left-click on the Group in which you would like to store the search. 3. Select whether the search should be used for Long, Short, or Neutral trades. 4. Click "OK". Note: If you change the criteria of a search and try to select another search before saving the current one, then you will be asked if you would like to save it. If selecting Yes then follow steps 2-4 as stated above. Creating a Custom Search 130
135 VectorVest 7 PDF Creating a New Search Group UniSearch Groups provide a place to store and organize your searches. To Create a New Search Group: 1. Open UniSearch. 2. Click on the drop down arrow next to the New Icon on the Search Directory Toolbar. 3. Select "New Group..." in the pop-up menu that appears. A "New Group" window appears. 4. Type a Name for your Search Group. 5. Click in the text area labeled "Comments" to type any notes about this Search Group. This step is optional, but descriptive comments about the purpose of the group can save confusion later. 6. Click OK or use Enter on your keyboard to complete your Group. OR 1. Open UniSearch. 2. Right click on any Search Group 3. Select "New Group" from the pop-up menu that appears. The "New Group" window will open. 4. Type a Name for your Search Group. 5. Click in the text area labeled "Comments" to type any notes about this Search Group. This step is optional, but descriptive comments about the purpose of the group can save confusion later. 6. Click "OK" or use Enter on your keyboard to complete your Group. Deleting a Unisearch Group: Deleting a Search Group 1. Open UniSearch. 2. Click on the name of the Group to be deleted. This will highlight the Group. 3. Click on the Delete Icon on the Search Directory Toolbar. You will be prompted "Are you sure you want to delete this group and all of its contents?" 4. Click "Yes" to remove the Search Group and all associated searches, or "No" to cancel the action. 131
136 1. Open UniSearch. OR 2. Right-click on the name of the Group to be deleted. 3. Select Delete from the Options Menu that appears. You will be prompted "Are you sure you want to delete this group and all of its contents?" 4. Click "Yes" to remove the Search Group and all associated searches, or "No" to cancel the action. *Please note that VectorVest searches cannot be deleted. You can rename any Stock Search Group you have created. Renaming a UniSearch Group To Rename A Search Group: 1. Select the UniSearch Tab. 2. Left click on the Name of the Group you wish to change. 3. Click on the Edit Icon on the Search Directory Toolbar. 4. Click in the text box labeled "Name" and use the Backspace or Delete key on the keyboard to remove the current name. 5. Type in the new name for the Search Group. 6. Click OK. OR 1. Select the UniSearch Tab. 2. Right click on the Name of the Group you wish to change. 3. Select Edit from the options menu that appears. 4. Click in the text box labeled "Name" and use the Backspace or Delete key on the keyboard to remove the current name. 5. Type in the new name for your Search Group. 6. Click OK. Note that the name of the Search Group has changed in the list to reflect your changes. Creating a Custom Search 132
137 VectorVest 7 PDF UniSearch allows you to create an unlimited variety of searches for Stocks, ETF's, Industry Groups or Business Sectors. Building your own searches is as simple as filling in the blanks. The following example will demonstrate how to create a New Search: Building a Custom Search: 1. Open UniSearch. 2. Click the New Icon on the Search Directory Toolbar. An empty criteria grid will be dislayed to the right. 3. Left-click in each blank cell of the Criteria Grid to select the parameters for your search. Begin with the first blank cell on the left. Date/Time: Date/Time allows you to specify the time or date that your criteria is being met. Time of Search is most commonly used, which means the criteria you select is being met at the exact time/date that you choose to run the search, but you can also specify that your criteria be met a certain number of minutes, days or weeks ago. For example, if you entered Time of Search VST>1.00, than at the time you were running the search, the VST would need to be greater than Parameter: Parameter is the specific condition that you wish to find. For example, in VST>1.00, VST would be the parameter. Parameters are grouped by category. Click on each category to view the selections. Operator: Operator is the mathematical operator used to help determine the level of your parameter. Depending on the parameter selected, you may choose > (greater than), >= (greater than or equal to), < (less than), <= (less than or equal to), <> not equal to, = (equal),near (within 5% of value), Display Only, trending (to specify up or down trends over any period of days, weeks, or minutes), delta (to specify a percent change over any period of days, weeks, or minutes), new high, new low. Value: Value allows you to select the desired level of your parameter. For example, for VST>1.00, you would click in the value cell, select "custom value", then type a '1'. Note: As you complete each line, a new line will appear below it for any additional parameters you wish to add. Once you have completed your search, use the following steps to save it: 1. Click on the Save Icon on the Search Directory Toolbar. A Save Search window will appear. 2. Type in a name for the new search, then left-click on the Group in which you would like to store the search. 3. Select whether the search should be used for Long, Short, or Neutral trades. 133
138 4. Click "OK". Note: If you change the criteria of a search and try to select another search before saving the current one, then you will be asked if you would like to save it. If selecting Yes, follow the steps 1-4 as stated above. Editing a Custom Search: Editing a Custom Search 1. Open UniSearch. 2. Click the name of the Group that contains the search you wish to edit. 3. Click once on the search to be modified. This will highlight the search name. The criteria for the selected search will appear in the Criteria Grid to the right of the Search Directory. 4. Once the search has been selected, you may then add, remove or change any of the criteria for the search. To remove criteria, right click on the parameter you wish to delete, and click "delete". To change criteria, click on the parameter or value you wish to change, and select from the available choices. To add criteria, click in the empty space under Parameter and select from the available choices. Continue across. You can choose to save your changes by overwriting the current search using the Save function, or save your changes as a new search using the Save As...function. Creating a Custom Search Saving a Custom Search Saving a Custom Search: Saving a Custom Search 1. Click on the drop down arrow next to the Save Icon on the Search Directory Toolbar. Select "Save As" if you would like to save the changes as a new search, or are saving a search for the first time, then continue with steps 2-4. If you have made changes to an existing custom search, and would like to 134
139 VectorVest 7 PDF overwrite the existing search, simply click the Save Icon and select "Save" to complete the process. 2. Type in a name for the new search, then left-click on the Group in which you would like to store the search. 3. Select whether the search should be used for Long, Short, or Neutral trades then description of the search in "Comments" section. 4. Click "OK". Note: If you change the criteria of a search and try to select another search before saving the current one, then you will be asked if you would like to save it. If selecting Yes, follow the steps 1-4 as stated above. To Delete a Custom Search: Deleting a Custom Search 1. Select the UniSearch tab. 2. Click on the Group containing the Search you wish to delete. 3. Click on the name of the Search you wish to delete. 4. Click on the Delete Icon on the Search Directory Toolbar 5. You will now be prompted "Are you sure you wish to delete the Search?" 6. Click "Yes" to completely remove the Search or click "No" to cancel this operation. OR 1. Select the UniSearch tab. 2. Click on the Group containing the Search you wish to delete. 3. Right-click on the name of the Search you wish to delete. 4. You will now be prompted "Are you sure you wish to delete the Search?" 5. Click "Yes" to completely remove the search or click "No" to cancel this operation. OR 1. Select the UniSearch tab. 2. Click on the Group containing the Search you wish to delete. 3. Select the "Delete" key on your keyboard. 4. You will now be prompted "Are you sure you wish to delete the Search?" 135

140 5. Click "Yes" to completely remove the search or click "No" to cancel this operation. Renaming a Custom Search Note: Only user-created searches can be renamed. Renaming a Custom Search: 1. Select the UniSearch Tab. 2. Select the Search to rename. 3. Click the Edit Icon on the Search Directory Toolbar. 4. Click in the text box labeled "Name" and use the Backspace or Delete key on the keyboard to remove the current name. 5. Type in the new name for your Search Group. 6. Click OK. OR 1. Select the UniSearch Tab. 2. Right-click on the search to be renamed.. 3. Click in the text box labeled "Name" and use the Backspace or Delete key on the keyboard to remove the current name. 4. Type in the new name for your Search Group. 5. Click OK. Portfolios 136

141 VectorVest 7 PDF About Portfolios VectorVest RealTime enables you to track multiple portfolios of stocks, whether created manually or using any of the VectorVest Searches. Use the management tools to add dividends and simulate interest payments, or the Reporting features to simplify the task of analyzing any portfolio's performance. Just a glance at the Portfolio Information Screen will provide you with up-to-the-minute information on the day's gain or loss, buying power, total value and more. The Portfolio MiniGraph visually displays the portfolio's current status. Additional portfolio features include Portfolio Automation and Portfolio Alerts. Now you can automate the trading in their simulated portfolio by setting Portfolio Automation for long or short positions. Choose to have trades executed automatically or choose custom alerts to provide notification of your stop-losses. Adding a New Portfolio Creating a New Portfolio: 1. Click Portfolios on the Main Menu Bar 2. Click the "New" Icon. 3. Type a name for the Portfolio. 4. Change the default investment amount if desired. (Use the delete key on your keyboard or highlight the investment amount to type over it.) 5. Click the drop down arrow next to Com. Type, and select the commission type you would like to use: None, Percent, Per Share, or Per Trade. 6. Enter the amount of the commission in the Commission box. 7. Click the selection boxes next to Interest and Margin to enable or disable these items. (A check mark is enabled, and an empty selection box is disabled.) 8. Use the Description Box to type any comments about your portfolio, if desired. 9. Click "OK". Your new portfolio will be listed on the left. 137

142 Setting Portfolio Defaults Adding Stocks to Your Portfolio. Editing Portfolio Settings You may rename your portfolios, or make changes to interest, margin, or commission using the Edit Icon or selecting Edit from the Manage Portfolio Menu. Note: The initial investment amount may not be changed. Cash may be added or withdrawn by using the Manage Portfolio Menu. Editing Portfolio Settings (Edit Icon): 1. Left-click the Edit Icon next to the Portfolio you would like to change. 2. Make the desired changes. 3. Click "OK". Editing Portfolio Settings (Manage Portfolio Menu): 138

143 VectorVest 7 PDF 1. Select a portfolio. The selected portfolio will be highlighted on the left side. 2. Left-click Manage Portfolio on the Local Toolbar. 3. Click 'Edit Portfolio'. 4. Make the desired changes. 5. Click "OK". Copying a Portfolio Multiple copies of a portfolio may be useful in testing a variety of money management techniques. You may make additional copies of their portfolios by using the Copy Icon. Copying a Portfolio: 1. Left-click the Copy Icon next to the Portfolio you would like to replicate. 2. Click "Yes" when asked "Are you sure you want to copy this portfolio?". A copy of the Portfolio will be added to the Portfolio Directory. Deleting a Portfolio: Deleting a Portfolio 1. Left-click the Delete Icon next to the Portfolio to be deleted. 139

: Click the Settings Icon to display the Portfolio Mini Graph Toolbar Graph Span: The first selection box on the Portfolio Mini Graph Toolbar")
144 2. Click "Yes" when asked "Are you sure you want to delete this portfolio?". The portfolio will be deleted from the Portfolio Directory. OR 1. Select the portfolio to be deleted. 2. Click the Delete Button on the Portfolio Toolbar. 3. Click "Yes" when asked "Are you sure you want to delete this portfolio?" Portfolio Mini Graph Settings The Portfolio MiniGraph displays the current status of your portfolio.. Customizing the Portfolio MiniGraph (Portfolio Tab): Click the Settings Icon to display the Portfolio Mini Graph Toolbar Graph Span: The first selection box on the Portfolio Mini Graph Toolbar allows you to select from Intraday or EOD (end of day)data. By default, Intraday will be selected. Change Series Color: Click to choose the color of the shaded area on the Portfolio Mini Graph. Size of Graph: Select small, medium or large to change the size of the graph. Initial Investment: Click this button to display a graph marker for your initial investment. By default, this marker will be selected. 140
145 VectorVest 7 PDF Show Change: Click this button to display the amount your portfolio has increased or decreased.. Detaching the Portfolio MiniGraph: To detach the Portfolio MiniGraph click the detach icon to the right of the Settings icon. Buying & Selling Stocks in Your Portfolio Place Trade Menu Any trade (long, short, buying, or selling) can be completed using the same steps. All portfolios are simulated. To execute an actual trade you must contact your broker. Buying Long, Selling Long, Selling Short, or Covering Short Positions: 1. Select a portfolio. The selected portfolio will be highlighted on the left side. 2. Click the "Add Trade" button on the local toolbar. 3. Complete the information on the Place Trade Window. Trade Type: Use the drop down arrow to select whether you would like to buy long, sell long, sell short, or cover short. Symbol: Type the ticker symbol or company for the stock you wish to trade, and hit enter or use the tab key on your keyboard to select a symbol. Trade Date: To change the current trade date, Click the "edit viewer timer" button to use the calendar to select your preference. Click here for more information on how to use the date/time control. Quantity: Type the number of shares you wish to trade. Price/Share: Type the price per share, or click the Get Price Button to fill in the price for the date and time you have selected. Commission: This information will already be completed based on your Portfolio Settings, but can be changed by clicking the Edit Button. Cost Basis: This field will automatically be calculated based on commission, price per share, and quantity. If you do not know the price per share paid, you can enter the entire amount of the transaction in the cost basis window by clicking the Edit Button. Intitial Margin Requirement: This information will already be completed based on your Portfolio Settings, but can be changed by clicking the Edit Button. 141
146 Buying Power: Available buying power will be displayed in the bottom right be be corner of the Place Trade Window Current Day's Close: Purchase stocks at time the market closed for the current day. Current Day's Open: Purchase stocks at time the market open for the current day. Next Day's Open: Purchase stocks at time of Next Day's Open. You must using a previous date to utilize this feature. Next Day's Close: Purchase stocks at time of Next Day's Close. You must using a previous date to utilize this feature. 5. Click "Apply". The transaction will be shown in the 'Pending Trades' section of the window. 6. Click "OK" when you are finished adding trades 7. Click "Yes" on the confirmation screen that appears. The stocks will be shown in your Portfolio. Removing Trades from the Pending Trades Window: Trades appearing in the lower section of the place trade window may be removed individually, or in total. 1. Left-click on the trade you would like to delete. 2. Click the blue 'X' and the trade will be deleted. Note: Clicking the red 'X' will remove ALL trades listed. Buying Stocks using a Search: Adding Stocks from a Search 1. Select a portfolio. The selected portfolio will be highlighted on the left side. 2. Click the "Manage Portfolio" Button on the Local Toolbar. 3. Select "Buy From Search". 4. Complete the information on the Buy from Search Window. (See below for more information) 142
147 VectorVest 7 PDF 5. Select a Search from the Search Directory, located on the left. 6. Click "Buy Stocks". The Buy From Search/Short From Search Window Explained: The Search Directory may be shown or hidden. Use the double arrows to display or hide the directory, as needed. Invest all or specified amount/total: This option will invest the total amount of the available buying power into the number of stocks selected. Invest all or specified amount/per Position: This option will limit the minimum and maximum amount invested in a position to the dollar amount specified by the user. Invest average value of portfolio/per Position: This option will calculate the average value of the positions in your portfolio, and invest a similar amount into new positions. If the available buying power is more than the average value, the excess buying power will be reserved. Max stocks per industry: Click the selection box to limit the number of positions in any one industry, then select the number you wish to choose. Max stocks per sector: Click the selection box to limit the number of positions in any one sector, then select the number you wish to choose. # of stocks: Use this option to select the number of stocks you wish to purchase. No Duplicates: Click the selection box to prevent buying additional shares of an existing position. Max % Avg Vol: Click the selection box to place a limit on the number of shares purchased to a maximum percentage of the average volume, then select the desired percentage. Max % Shares: Click the selection box to place a limit on the number of shares purchased to a maximum percentage of the actual shares traded the day of purchase, then select the desired percentage. Date/Time Control: You may use the date time control to select a past purchase date/time for your stock selections. Current Day's Close: Current Day's Open: Next Day's Open: Next Day's Average: 143

148 Shorting Stocks from a Search Shorting Stocks from a Search: 1. Select a portfolio. The selected portfolio will be highlighted on the left side. 2. Click the "Manage Portfolio" Button on the Local Toolbar. 3. Select "Short From Search". 4. Complete the information on the Short from Search Screen. 5. Select a Search from the Search Directory, located on the left. 6. Click "Short Stocks". The Buy From Search/Short From Search Window Explained: The Search Directory may be shown or hidden. Use the double arrows to display or hide the directory, as needed. 144
149 VectorVest 7 PDF Invest all or specified amount/total: This option will invest the total amount of the available buying power into the number of stocks selected. Invest all or specified amount/per Position: This option will limit the minimum and maximum amount invested in a position to the dollar amount specified by the user. Invest average value of portfolio/per Position: This option will calculate the average value of the positions in your portfolio, and invest a similar amount into new positions. If the available buying power is more than the average value, the excess buying power will be reserved. Max stocks per industry: Click the selection box to limit the number of positions in any one industry, then select the number you wish to choose. Max stocks per sector: Click the selection box to limit the number of positions in any one sector, then select the number you wish to choose. # of stocks: Use this option to select the number of stocks you wish to purchase. No Duplicates: Click the selection box to prevent buying additional shares of an existing position. Max % Avg Vol: Click the selection box to place a limit on the number of shares purchased to a maximum percentage of the average volume, then select the desired percentage. Max % Shares: Click the selection box to place a limit on the number of shares purchased to a maximum percentage of the actual shares traded the day of purchase, then select the desired percentage. Date/Time Control: You may use the date time control to select a past purchase date/time for your stock selections. Current Day's Close: Purchase stocks at time the market closed for the current day. Current Day's Open: Purchase stocks at time the market open for the current day. Next Day's Open: Purchase stocks at time of Next Day's Open. You must be using a previous date to utilize this feature. Next Day's Close: Purchase stocks at time of Next Day's Close. You must be using a previous date to utilize this feature. Editing Portfolio Settings Manage Portfolio Menu 145
150 You may rename their portfolios, or make changes to interest, margin, or commission using the Edit Icon or selecting Edit from the Manage Portfolio Menu. Note: The initial investment amount may not be changed. Cash may be added or withdrawn by using the Manage Portfolio Menu. Editing Portfolio Settings (Edit Icon): 1. Left-click the Edit Icon next to the Portfolio you would like to change. 2. Make the desired changes. 3. Click "OK". Editing Portfolio Settings (Manage Portfolio Menu): 1. Select a portfolio. The selected portfolio will be highlighted on the left side. 2. Left-click Manage Portfolio on the Local Toolbar. 3. Click 'Edit Portfolio'. 4. Make the desired changes. 5. Click "OK". Deposit Cash The Deposit Cash feature allows you to increase the portfolio's available buying power. Depositing Cash to a Portfolio: 1. Select a portfolio. The selected portfolio will be highlighted on the left side. 2. Click the "Manage Portfolio" Button on the Local Toolbar. 146
151 VectorVest 7 PDF 3. Select "Deposit Cash". 4. Enter the amount of cash you would like to deposit. 5. Use the Date/Time Control to select the date of the deposit. 6. Click "OK". Withdraw Cash The Withdraw Cash feature allows you to decrease the portfolio's available buying power. Withdrawing Cash from a Portfolio: 1. Select a portfolio. The selected portfolio will be highlighted on the left side. 2. Click the "Manage Portfolio" Button on the Local Toolbar. 3. Select "Withdraw Cash". 4. Enter the amount of cash you would like to withdraw. 5. Use the Date/Time Control to select the date of the withdrawal. 6. Click "OK". Add Interest The Add Interest feature allows you to add interest payments received, or paid, to your portfolio. Adding Interest Payments to a Portfolio: 1. Select a portfolio. The selected portfolio will be highlighted on the left side. 2. Click the "Manage Portfolio" Button on the Local Toolbar. 3. Select "Add Interest Payment". 4. Use the drop down selection box to choose Receive Interest, or Pay Interest. 5. Enter the amount paid/received. 6. Use the Date/Time Control to select the date of the deposit. 7. Click "OK". Add Dividend The Add Dividend feature allows you to add dividend payments to your portfolio. Adding Dividends to a Portfolio: 1. Select a portfolio. The selected portfolio will be highlighted on the left side. 147
152 2. Click the "Manage Portfolio" Button on the Local Toolbar. 3. Select "Add Dividend Payment". 4. Enter the amount of the dividend you wish to add. 5. Use the Date/Time Control to select the date the dividend was paid. 6. Click "OK". Set Automation Portfolio Automation allows you to set buying and/or selling rules and alerts for a portfolio that can be transacted automatically. You may choose from long or short automation, or choose to maintain the portfolio manually. Note: All portfolios are simulated. To execute an actual trade you must contact your broker. Enabling Portfolio Automation: 1. Select a portfolio. The selected portfolio will be highlighted on the left side. 2. Click the "Manage Portfolio" Button on the Local Toolbar. 3. Select "Set Automation". 4. Left-click Long, Short, or Manual. 5. Make your selections from the Portfolio Automation Window. Please see Editing Portfolio Automation for more information. 6. Click "OK". Disabling Portfolio Automation: 1. Select a portfolio. The selected portfolio will be highlighted on the left side. 2. Click the "Manage Portfolio" Button on the Local Toolbar. 3. Select "Set Automation". 4. Left-click "Manual". Edit Automation Edit Automation will allow you to set up the buying and/or selling rules and alerts that you would like to use for a portfolio. Any transactions will be executed automatically when Portfolio Automation has been enabled. Note: All portfolios are simulated. To execute an actual trade you must contact your broker. Editing Portfolio Automation: 1. Select a portfolio. The selected portfolio will be highlighted on the left side. 148

153 VectorVest 7 PDF 2. Click the "Manage Portfolio" Button on the Local Toolbar. 3. Select "Edit Automation". 4. Make your selections. See below. 5. Click "OK". To enable Portfolio Automation, please see Set Automation. The Portfolio Automation Window: When Stop Criteria is met: Do nothing, Send Alert, Close Position Choose Stop Criteria: Use the drop down menu to choose your exit criteria. To view a definition of the stop criteria, select it from the list then click the question mark to the 149
154 right of the selection box. This option will only be enabled if you have chosen Send Alert, or Close Position, when Stop Criteria is met. Check during extended hours: Check the selection box if you would like to allow trading prior to 9:30 am or after 4:00 pm to trigger your stop criteria. This option will only be enabled if you have chosen Send Alert, or Close Position, when Stop Criteria is met. Automatically acquire new positions: Check this box if you would like to have the program automatically replace closed positions. This option will only be enabled if you have chosen Send Alert, or Close Position, when Stop Criteria is met. Replacement Search: Click the ellipses to choose the replacement search you would like to use. This option will only be active if Automatically acquire new positions is selected. # of positions to hold: Select the optimal number of stocks you wish to maintain in your portfolio. This option will only be active if Automatically acquire new positions is selected. Spend all available buying power: Select this option if you would like the entire amount of buying power used when purchasing positions (regardless of the number of stocks found by the selected search.) This option will only be active if Automatically acquire new positions is selected. Spend per position: Select his option if you would like to specify the minimum and maximum dollar amount invested in new positions. This option will only be active if Automatically acquire new positions is selected. Spend average value: This option will calculate the average value of the positions in your portfolio, and invest a similar amount into new positions. If the available buying power is more than the average value, the excess buying power will be reserved. This option will only be active if Automatically acquire new positions is selected. Lots: Select Round if you would like to purchase in lots of 100 shares only, otherwise select Odd. This option will only be active if Automatically acquire new positions is selected. No Duplicates: Click the selection box to prevent buying additional shares of an existing position. This option will only be active if Automatically acquire new positions is selected. Max stocks per industry: Click the selection box to limit the number of positions in any one industry, then select the number you wish to choose. This option will only be active if Automatically acquire new positions is selected. Max stocks per sector: Click the selection box to limit the number of positions in any one sector, then select the number you wish to choose. This option will only be active if Automatically acquire new positions is selected. 150
155 VectorVest 7 PDF Max % Avg Vol: Click the selection box to place a limit the number of shares purchased to a maximum percentage of the average volume, then select the desired percentage. This option will only be active if Automatically acquire new positions is selected. Max % Shares: Click the selection box to place a limit the number of shares purchased to a maximum percentage of the actual shares traded the day of purchase, then select the desired percentage. This option will only be active if Automatically acquire new positions is selected. Viewing the Transaction Log Reports Menu The Portfolio Manager also gives you the ability to view a list of each and every transaction which has occurred in your portfolio in chronological order. This list includes cash deposits and withdrawals, interest paid or received, short sales and covers. Using the transaction log, you are able to view, edit or delete any transaction you have made in your portfolio. Please note that any time you delete a transaction, the effects of the transaction are removed from the portfolio. That is, if you delete the sale of a Long position, its profits (or losses) will be removed from the portfolio. Accessing the Transaction Log: 1. Select a portfolio. The selected portfolio will be highlighted on the left side. 2. Click the "Reports" Button on the Local Toolbar. 3. Select "View Transaction Log". 4. Click "OK" to close the window. After reviewing the report, you may choose to Edit a transaction, Export, Print, or Close the information screen. Exporting the Transaction Log: 1. Select a portfolio. The selected portfolio will be highlighted on the left side. 2. Click the "Reports" Button on the Local Toolbar. 3. Select "View Transaction Log". 4. Click "Export" at the bottom of the Transaction Log Window. 5. Select a destination to save your file, and the file name box to type the name of the file. 6. Click "Save". 151
156 The file will be exported as a.csv (comma separated value) file, and can be opened with Excel, or imported into compatible programs. Note: Proprietary information will not be exported. Printing the Transaction Log: 1. Select a portfolio. The selected portfolio will be highlighted on the left side. 2. Click the "Reports" Button on the Local Toolbar. 3. Select "View Transaction Log". 4. Click "Print" at the bottom of the Transaction Log Window. The Print Window will appear. 5. Click the Print Button to send the report to the printer. Deleting a Trade using the Transaction Log: 1. Select a portfolio. The selected portfolio will be highlighted on the left side. 2. Click the "Reports" Button on the Local Toolbar. 3. Select "View Transaction Log". 4. Left-click on the stock or transaction to be deleted. 5. Click "Delete" at the bottom of the Transaction Log Window. 6. Click "Yes" to confirm the deletion. 7. The transaction will be removed and the portfolio will be updated. Editing a Trade using the Transaction Log: 1. Select a portfolio. The selected portfolio will be highlighted on the left side. 2. Click the "Reports" Button on the Local Toolbar. 3. Select "View Transaction Log". 4. Left-click on the stock or transaction to be edited. 5. Click "Edit" at the bottom of the Transaction Log Window. The Edit Transaction Window will appear. 6. Make the desired changes to the date and/or time of the transaction, number of shares, price, commissions, or cost basis. 7. Click "OK" when changes are complete. 8. Click "OK" again to close the Transaction Log. Printing Current Holdings: Print Current Holdings 152
157 VectorVest 7 PDF 1. Select a portfolio. The selected portfolio will be highlighted on the left side. 2. Click the "Reports" button on the Local Toolbar. 3. Select "Print Current Holdings". The Print Preview Window will appear. 4. Click the Printer Icon to print the page as shown. Changing the Layout in the Print Preview Window: 1. Click the drop down arrow next to the Column Layout Box. 2. Select "Custom". 3. Click "Customize..." To remove columns, select the column name under 'Columns In Grid' and use the left arrow to remove the field. To change the position of a column, select the column name under 'Columns In Grid' use the up and down arrows to move the column to the desired location. To add a column, select the column name under 'Field List' and use the right arrow to add the field to the 'Columns in Grid'. 4. Use the Layout Window to select the columns to print. 5. Click "OK". Viewing a Portfolio Summary The Portfolio Summary Report shows the percent winners and losers since your portfolio has been created, total gains, total losses, and total commissions paid. The summary will also show you the status of your current long and short positions. Accessing the Portfolio Summary Report: 1. Select a portfolio. The selected portfolio will be highlighted on the left side. 2. Click the "Reports" Button on the Local Toolbar. 3. Select "View Summary Report". The Portfolio Summary Report includes the following topics: Current Values as of the current date. This section mirrors the information available on the main Portfolio Manager screen, when a portfolio is selected. It includes the values for Investment, Buying Power, Cash, Equity, Margin, Total Value, Net, and Percent Gain/Loss. Winners / Losers: The Winners/Losers section displays the total number of current and closed long and short trades. This report is divided into columns for winners, losers, totals and a percentage column. This section of the report also summarizes wins and losses for all closed positions, as well as an overall summary. 153
158 Average Gain - Winners / Losers: This section of the Portfolio Summary Report displays the average gain and loss in dollars. It is broken down by winners and losers for both short and long positions in the portfolio. Best/Worst Trades: Displays the description and Net Gain / Loss for the biggest winner and loser in the portfolio. Fees: This section summarizes the Total Commission paid and Interest paid or received for the portfolio. Graphs: Portfolio Value displays a line graph of the change in the portfolio s value over time. Gain / (Loss) on Positions is a bar graph summarizing the gains/losses for short, long, open and closed positions. Current positions by Industry shows a pie chart depicting the portfolio s diversification among industries. Current positions by Symbol shows a pie chart depicting your portfolio s diversification among stocks. Diversification Graph The Diversification Graph is a pie chart that shows the allocation of portfolio resources by stock, or by industry on a percentage basis. The Diversification Graph can also be found in the Portfolio Summary Report. Viewing the Diversification Graph: 1. Select a portfolio. The selected portfolio will be highlighted on the left side. 2. Click the "Reports" Button on the Local Toolbar. 3. Select "View Diversification Graph". 4. Click the radio button next to Stocks or Industries. 154

159 VectorVest 7 PDF Viewing Trade History VectorVest RealTime Portfolios will automatically record all trades for any portfolio, recording the open and close dates for each position, the opening and closing prices, the VectorVest recommendations, the net gain or loss, as well as the percentage gain or loss. Note: The Trade history report displays only completed trades. Accessing the Trade History Report: 1. Select a portfolio. The selected portfolio will be highlighted on the left side. 2. Click the "Reports" Button on the Local Toolbar. 3. Select "View Trade History". After reviewing the report, you may choose to Export, Print, or Close the information screen. Exporting the Trade History Report: 1. Select a portfolio. The selected portfolio will be highlighted on the left side. 2. Click the "Reports" Button on the Local Toolbar. 3. Select "View Trade History". 4. Click "Export" at the bottom of the Trade History Window. 5. Select a destination to save your file and type the name in the file name box. 155
160 6. Click "Save". The file will be exported as a.csv (comma separated value) file, and can be opened with Excel, or imported into compatible programs. Note: Proprietary information will not be exported. Printing the Trade History Report: 1. Select a portfolio. The selected portfolio will be highlighted on the left side. 2. Click the "Reports" Button on the Local Toolbar. 3. Select "View Trade History". 4. Click "Print" at the bottom of the Trade History Window. 5. Click the Print Button on the Print Window. Tax Report The VectorVest RealTime Tax Report has the ability to sort Long and Short holdings, for the portfolios entire history or calendar year. The report will give the stock name, date acquired, date sold, sales price, cost basis, and net gain or loss. The Tax Report may be further sorted by Long Term Holding (more than a year), Short Term Holding (less than a year), or All Holdings. Accessing the Tax Report: 1. Select a portfolio. The selected portfolio will be highlighted on the left side. 2. Click the "Reports" Button on the Local Toolbar. 3. Select "View Tax Report". After reviewing the report, you may choose to Export, Print, or Close the information screen. Exporting the Tax Report: 1. Select a portfolio. The selected portfolio will be highlighted on the left side. 2. Click the "Reports" Button on the Local Toolbar. 3. Select "View Tax Report". 4. Click "Export" at the bottom of the Tax Report Window. 5. Select a destination to save your file and type the name of the file in the file name box. 6. Click "Save". 156
161 VectorVest 7 PDF The file will be exported as a.csv (comma separated value) file, and can be opened with Excel, or imported into compatible programs. Note: Proprietary information will not be exported. Printing the Tax Report: 1. Select a portfolio. The selected portfolio will be highlighted on the left side. 2. Click the "Reports" Button on the Local Toolbar. 3. Select "View Tax Report". 4. Click "Print" at the bottom of the Tax Report Window. 5. Click the Print Button on the Print Window. About the VectorVest Views Views The VectorVest Views is a daily newsletter that keeps traders abreast of the market conditions. A complete edition of the VectorVest Views is available each Friday by midnight EST. Monday through Thursday, the VectorVest Views will include a Timing section that is updated on a daily basis by 8 PM EST. The following sections are included in the Views: Overview: The Overview section will include important contact information for communicating with VectorVest, upcoming VectorVest events, seminars, and specials, and a weekly essay that is applicable to the current market conditions. Valuation: The Valuation section reports whether the market is over or undervalued by comparing the VVC (VectorVest Composite) and (DJIA) Dow Jones Industrial Average to their respective VectorVest valuations. Timing: The Timing section is reported on a daily basis and reviews the current status, as well as any changes, to the VectorVest timing indicators, the VVC, VVC RT (Relative Timing), BSR (Buy Sell Ratio), MTI (Market Timing Indicator). This section also identifies the direction of the Primary Wave, and Underlying Trend of the market. The daily version will include a recap of the market's activity, as well as guidance for prudent and aggressive investors based on the current day's trading. Strategy: The Strategy section will include a recap of the market's activity, as well as guidance for prudent and aggressive investors based on the current day's trading. Monday through Thursday, this section will be part of Timing, but the Friday edition will be listed separately and include a Strategy of the Week. The Strategy of the Week, will change each week, and is meant as a tutorial, not a suggestion to change your stock selection strategy each week. Climate: The Climate section reviews the status and change in the most influential economic factors driving the market - interest, inflation, and earnings. 157
162 Indicators in this section include: CPI Inflation, CRB Inflation, 90 Day Treasury Bills, 10 Year Treasury Notes, 10 Year AAA Corporate Bonds, S%P 500 Earnings, S7P 500 Index, NYSE Advance/Decline, % Bullish Advisors, and a Composite of these indicators. In addition to showing the current level, these indicators are shown on the VectorVest scale of 0-2 to make identifying their trends quick and easy (above 1.00 favorable, below 1.00 unfavorable). Based on the trends of these indicators VectorVest will define the current market as a Bull or Bear Market according to the information found on the Truth Chart (VectorVest Views, 3/21/03). Stocks: The Stocks section will include Selected Stocks chosen by thier numerical value of selected indicators. Portfolio: The Portfolio section recaps changes made to the VSA Model Portfolio (For those of you who are Riding the Wave). User Groups: The User Group section will list all the current National and International VectorVest User Groups. Contact information for a specific group can be obtained by contacting our customer service department, toll-free, Products: The Product Section is list of all our products, services and pricing information. Special Note: Many users find it useful to read historical issues of the VectorVest Views in order to see what we have said at critical times in the market or to learn useful trading strategies. Views Manager The Views Manager allows you to access a chronological list of the Friday Essays, the Strategy of the Week, or Confirmed Market Calls from the Views Manager. you may also search any section of archived Views for a specific word or phrase. Using the Views Manager: 158
163 VectorVest 7 PDF To view a historical list of essays, select Essay Viewer. To view a historical list of featured Strategies, select Strategy of the Week. To view a historical list of the Confirmed Calls, select Market Calls Viewer. Navigating the Views The VectorVest Views Screen has several features that facilitate navigation. The Views Toolbar, located at the top left corner of the screen, allows you to select a date, select a specific section, or print the Views. A search bar, at the bottom left corner of the screen, allows you to search for a word or phrase in the displayed document, and the toolbar located in the opposite bottom corner, allows you to scroll and choose the display size of the text. 159

164 Using the Views Toolbar: To move to an earlier date, click on the date displayed on the toolbar. Use the calendar to make your selection. To move to a specific section of the Views, click the button that currently says 'All'. Click on the desired section using the drop down list that appears. To print the Views, click the Print Views button. Click 'Print' on the Print Window that appears. Changing the Text Size in the Views: To increase text size, click the '+' icon, or drag the slider bar to the right. To decrease text size, click the '-' icon, or drag the slider bar to the left. 160

165 VectorVest 7 PDF Searching the VectorVest Views You may search any section of archived Views for a specific word or phrase. To Search the VectorVest Views Archive: 1. Select the "Views" tab. 2. Click "Search Views" from the Views Manager. 3. Type the desired word or phrase in the "Text to Search for:" box. You may choose to search "All Sections" of the Views or limit the search to "Selected Sections" such as the Overview or Strategy section. 161
Getting Ready to Trade
 Section VI. Getting Ready to Trade In This Section 1. Adding new securities 78 2. Updating your data 79 3. It's important to keep your data clean 80 4. Using Real-Time Alerts 81 5. Monitoring your tickers
FUTURESOURCE TRADER 1 WELCOME 6 THE FUTURESOURCE TRADER WINDOW 7. Changing Your Password 8. Viewing Connection Status 8 DOMTRADER 9
 FutureSource Trader FUTURESOURCE TRADER 1 WELCOME 6 THE FUTURESOURCE TRADER WINDOW 7 Changing Your Password 8 Viewing Connection Status 8 DOMTRADER 9 Adding a DOMTrader 9 DOMTrader Components 10 Title
Learning TradeStation. News, Time & Sales, Research, Browser, and Ticker Bar
 Learning TradeStation News, Time & Sales, Research, Browser, and Ticker Bar Important Information No offer or solicitation to buy or sell securities, securities derivative or futures products of any kind,
Training Tuesday. Time Stamps. Navigating VectorVest 7. provided by your host Glenn Thompkins
 Training Tuesday Navigating VectorVest 7 Time Stamps provided by your host Glenn Thompkins Session 1 The Homepage What is the Homepage 11:39 What is the Dashboard 52:10 What is the Color Guard 14:07 How
Gtrade manual version 2.04 updated
 Gtrade manual version 2.04 updated 9.30.2016 Table of Contents Contents Table of Contents2 Getting started, Logging in and setting display language in TurboTick Pro3 Level 25 Order Entry8 Streamlined Order
Contents. Introduction
 Getting Started Introduction O&M Profiler User Guide (v6) Contents Contents... 1 Introduction... 2 Logging In... 2 Messages... 3 Options... 4 Help... 4 Home Screen... 5 System Navigation... 5 Dashboard...
Principia Research Mode Online Basics Training Manual
 Principia Research Mode Online Basics Training Manual Welcome to Principia Research Mode Basics Course, designed to give you an overview of Principia's Research Mode capabilities. The goal of this guide
Policy. Chapter 6. Accessing the Policy. Nexsure Training Manual - CRM. In This Chapter
 Nexsure Training Manual - CRM Policy In This Chapter Accessing the Policy Adding a Thank You Letter Editing the Policy Adding, Editing and Removing Assignments Admitted Carrier Identification Summary of
Directions to build Stochastics & EMA Crossover search
 Directions to build Stochastics & EMA Crossover search 1. Click the UniSearch tab at the top of the program. 2. Click the drop down arrow next to the New icon. 3. Click on New Search. 4. Click in the empty
Our primary focus is on the market trend.
 Our primary focus is on the market trend. Through two decades of experience, we ve found this to be the most powerful influence on traders success. We begin by identifying the short-term trend of the market
MotiveWave What s New in Version 6 Beta MotiveWave Software
 MotiveWave What s New in 2019 MotiveWave Software Table of Contents 1 Introduction... 2 2 Cloud Workspaces... 3 2.1 Synchronization... 3 2.2 Limitations... 3 2.3 Creating/Editing Cloud Workspaces... 3
å Follow these steps to delete a list: å To rename a list: Maintaining your lists
 Maintaining your lists TradingExpert Pro provides a number of functions for maintaining the data contained in your Group/Sector List and all other lists that you have created. This section lists the data
You should already have a worksheet with the Basic Plus Plan details in it as well as another plan you have chosen from ehealthinsurance.com.
 In earlier technology assignments, you identified several details of a health plan and created a table of total cost. In this technology assignment, you ll create a worksheet which calculates the total
BELEX.info User Manual
 www.belex.info User Manual Belgrade Stock Exchange September, 2014 Welcome W Saddeeee Sadr Guidelines Through the Improved Version of the Belgrade Stock Exchange Service for Distribution of Real-Time Trading
Qualify Your Instruments & Find High Probability Setups
 +1.888.537.0070 x 750 support@marketprofilescan.com www.marketprofilescan.com TAS knows the value of accurate and timely market generated information. Providing high probability trading setups is our business.
PRODUCT GUIDE. The Value Line Investment Survey Smart Investor. Smart research. Smarter investing.
 PRODUCT GUIDE The Value Line Investment Survey Smart Investor Smart research. Smarter investing. 2017 Value Line, Inc. All Rights Reserved. Value Line, the Value Line logo, The Value Line Investment Survey,
TRADING FOREX ON THE FabTraderGO PLATFORM
 TRADING FOREX ON THE FabTraderGO PLATFORM WHAT IS FABTRADER GO? Designed to be fast and as easy-to-use as possible, the FabTraderGo is a web-based trading platform that can be used from any HTML5-compatible
Any symbols displayed within these pages are for illustrative purposes only, and are not intended to portray any recommendation.
 WebTrader Users Guide December 2010 WebTrader Release 5.3 2010 Interactive Brokers LLC. All rights reserved. Any symbols displayed within these pages are for illustrative purposes only, and are not intended
MT4 Supreme Edition Trade Terminal
 MT4 Supreme Edition Trade Terminal In this manual, you will find installation and usage instructions for MT4 Supreme Edition. Installation process and usage is the same in new MT5 Supreme Edition. Simply
Investoscope 3 User Guide
 Investoscope 3 User Guide Release 3.0 Copyright c Investoscope Software Contents Contents i 1 Welcome to Investoscope 1 1.1 About this User Guide............................. 1 1.2 Quick Start Guide................................
GL Budgets. Account Budget and Forecast. Account Budgets and Forecasts Menu
 Account Budget and Forecast The Account Budget and Forecast function allows you to enter and maintain an unlimited number of budgets and/or forecasts values and types. When setting up the account budgets
1.1 Installation from the Web 1.2 Logging On
 1 1.1 Installation from the Web 1.2 Logging On 2.1 WH Expert Elite Display and Menu Bars 2.2 The Icon Bar 2.2.1 Icon Bar Type 1 2.2.2 Icon Bar Type 2 2.2.3 Icon Bar Type 3 2.3 Right Mouse Click Support
ShareChart User s Guide February Disclaimer
 Sharechart ShareChart User s Guide February 2011 Disclaimer ShareChart is share technical analysis software aiming at providing investors and/or traders a useful tool in analysing shares. It does not take
Metatrader 4 (MT4) User Guide
 User Guide") Metatrader 4 (MT4) User Guide Installation Download the MetaTrader4 demo platform from the Tradesto website:- https://members.tradesto.com/tradestoco4setup.exe Launch the installation file the same way
Metatrader 4 (MT4) User Guide Installation Download the MetaTrader4 demo platform from the Tradesto website:- https://members.tradesto.com/tradestoco4setup.exe Launch the installation file the same way
Draftworx Manual. Thank you for choosing Draftworx
 Draftworx Manual Thank you for choosing Draftworx Contents Installing the program... 4 Activating the program... 5 Getting going... 6 Training videos... 6 Filter bar... 6 Regional Settings... 8 Client
Certifying Mortgages for Freddie Mac. User Guide
 Certifying Mortgages for Freddie Mac User Guide December 2017 The Freddie Mac Single-Family Seller/Servicer (Guide) requires a Seller/Servicer selling Mortgages to Freddie Mac to forward the Notes, assignments
Using the Clients & Portfolios Module in Advisor Workstation
 Using the Clients & Portfolios Module in Advisor Workstation Disclaimer - - - - - - - - - - - - - - - - - - - - - - - - - - - - - - - - - - - - - 1 Overview - - - - - - - - - - - - - - - - - - - - - -
StreetSmart Pro User Guide
 StreetSmart Pro User Guide - 1 - Table of Contents StreetSmart Pro User Guide 1 Table of Contents 2 Getting Started 5 Getting Started 5 New Features 7 Logging On & Off 7 Main Menu Bar 8 Demo Mode 18 Customizing
4. Viewing account information
 4. Viewing account information Overview Individual transactions and positions are displayed in the Account Information section of the Portfolio Manager window. Of the seven tabs at the top of this section,
DUS DocWay TM Loan Documents User Guide. January 2019
 DUS DocWay TM Loan Documents User Guide January 2019 Table of Contents Getting Started with DUS DocWay... 1 Welcome Page Navigation... 3 Loan Documents Navigation... 6 Update Document Category and Type...
Contents 1. Login Layout Settings DEFAULTS CONFIRMATIONS ENVIRONMENT CHARTS
 USER GUIDE Contents 1. Login... 3 2. Layout... 4 3. Settings... 5 3.1. DEFAULTS... 5 3.2. CONFIRMATIONS... 6 3.3. ENVIRONMENT... 6 3.4. CHARTS... 7 3.5. TOOLBAR... 10 3.6. DRAWING TOOLS... 10 3.7. INDICATORS...
+44 (0)
") FXCM Inc., a publicly traded company listed on the New York Stock Exchange (NYSE: FXCM), is a holding company and its sole asset is a controlling equity interest in FXCM Holdings, LLC. Forex Capital Markets
FXCM Inc., a publicly traded company listed on the New York Stock Exchange (NYSE: FXCM), is a holding company and its sole asset is a controlling equity interest in FXCM Holdings, LLC. Forex Capital Markets
Insurance Tracking with Advisors Assistant
 Insurance Tracking with Advisors Assistant Client Marketing Systems, Inc. 880 Price Street Pismo Beach, CA 93449 800 643-4488 805 773-7985 fax www.advisorsassistant.com support@climark.com 2015 Client
PRODUCT GUIDE. The Value Line Investment Survey Investor 600. Smart research. Smarter investing.
 PRODUCT GUIDE The Value Line Investment Survey Investor 600 Smart research. Smarter investing. 2017 Value Line, Inc. All Rights Reserved. Value Line, the Value Line logo, The Value Line Investment Survey,
3. Entering transactions
 3. Entering transactions Overview of Transactions functions When you place an order to buy or short sell, you should immediately enter the transaction into the appropriate portfolio account so that the
Merrill Edge MarketPro Alerts
 Merrill Edge MarketPro Alerts Alerts provide notifications when market activity meets the defined criteria. TOOLBAR GUIDE 1 2 3 4 1 2 3 4 Add add a new alert Action allows an action (edit, reactivate,
TAA Scheduling. User s Guide
 TAA Scheduling User s Guide While every attempt is made to ensure both accuracy and completeness of information included in this document, errors can occur, and updates or improvements may be implemented
COUNT ONLINE BROKING USER GUIDE
 Welcome to the Count Online Broking website, offering market-leading functionality to help you get more from your online trading and investing: Powerful charting giving you valuable insight into client
Finance. Training Manual
 Finance Training Manual Introduction to Finance Module Shepherd s Staff Finance module lets you keep track of your church s financial information. This manual will walk you through setting up a chart of
Welcome to the VectorVest Model Portfolios, a collection of complete trading-systems
 Welcome to the VectorVest Model Portfolios, a collection of complete trading-systems that remove all the guesswork from investing and deliver phenomenal investment success. These systems have been created
INTUIT PROA DVISOR PR O G RAM. QuickBooks Desktop Certification
 INTUIT PROA DVISOR PR O G RAM QuickBooks Desktop Certification Getting Started Guide Table of Contents TABLE OF CONTENTS QuickBooks ProAdvisor Training Objectives... 1 What s in the Workbook?... 2 Chapter
Using an Excel spreadsheet to calculate Andrew s 18th birthday costs
 Using an Excel spreadsheet to calculate Andrew s 18th birthday costs Open a new spreadsheet in Excel. Highlight cells A1 to J1. Prevocational Mathematics 1 of 17 Planning an event Using an Excel spreadsheet
Streaming Real Time Quotes Service User Guide. Version 5.3
 Streaming Real Time Quotes Service User Guide www.easecurities.com.hk Version 5.3 Table of Content 1. Introduction... 3 2. System requirement... 4 2.1 Hardware requirements... 4 2.2 Software requirements...
Commsec Adviser Services User Guide
 Commsec Adviser Services User Guide Welcome to the CommSec Adviser Services trading website, offering market-leading functionality to help you get more from your online trading and investing: Powerful
Volcone Users Manual V2.0
 Volcone Users Manual V2.0 Thank you for purchasing our new Volcone Analyzer PRO V 2.0 software. This program will become a very important part of your option trading arsenal, if used properly. Please review
Master User Manual. Last Updated: August, Released concurrently with CDM v.1.0
 Master User Manual Last Updated: August, 2010 Released concurrently with CDM v.1.0 All information in this manual referring to individuals or organizations (names, addresses, company names, telephone numbers,
TRADE TERMINAL. Page 1 of 13
 v TRADE TERMINAL 1. Overview of the Trade Terminal... 2 1.1 Opening the Trade Terminal... 2 1.2 Components of the Trade Terminal... 2 2. Market watch... 3 2.1 Placing buy/sell orders... 3 2.2 Placing pending
INTRODUCTION CHAPTER 1
 INTRODUCTION CHAPTER 1 Autochartist offers traders automated market-scanning tools that highlight trade opportunities based on support and resistance levels. Autochartist products include: Chart pattern
Welcome to Trader Vision 20/20 (Version 2)
") Welcome to Trader Vision 20/20 (Version 2) First of all, thank you again for your purchase. It is our greatest hope that you find Trader Vision 20/20 (aka TV20/20) to be a tremendous aid and a tool that
Welcome to Trader Vision 20/20 (Version 2) First of all, thank you again for your purchase. It is our greatest hope that you find Trader Vision 20/20 (aka TV20/20) to be a tremendous aid and a tool that
WinTen² Budget Management
 Budget Management Preliminary User Manual User Manual Edition: 4/13/2005 Your inside track for making your job easier! Tenmast Software 132 Venture Court, Suite 1 Lexington, KY 40511 www.tenmast.com Support:
How to Use Fundamental Data in TradingExpert Pro
 Chapter VII How to Use Fundamental Data in TradingExpert Pro In this chapter 1. Viewing fundamental data on the Fundamental Report 752 2. Viewing fundamental data for individual stocks 755 3. Building
Maintaining Budget Change Requests
 Maintaining Budget Change Requests This document describes the functions used in TEAMS to enter and approve requests to move funds from one General Ledger account to another. In this document: Request
STREETSMART PRO MARKET DATA TOOLS
 STREETSMART PRO MARKET DATA TOOLS StreetSmart Pro Market Data Tools... 279 Watch Lists...280 Tickers...294 Top Ten...303 Options Top Ten...306 Highs & Lows...309 Sectors...313 279 StreetSmart Pro User
HedgeTools User Manual
 HedgeTools User Manual A real-time monitoring and analysis of the stocks on the NYSE and NASDQ exchanges Last update: August 29, 2018 Charles Brauer Cypress Point Technologies, LLC Carmel, California 93923
Release Notes. November 2014
 Release Notes November 2014 Trade & Orders Options Account Management Chart General Trade Armor Options o New tab with ability to view and trade single leg and select multi-leg options. o Upcoming earnings
Learning TradeStation. Order-Entry Tools and Preferences
 Learning TradeStation Order-Entry Tools and Preferences Important Information No offer or solicitation to buy or sell securities, securities derivative or futures products of any kind, or any type of trading
Finance Manager: Budgeting
 : Budgeting Overview is a module that facilitates the preparation, management, and analysis of fiscal year budgets. Streamlined for efficiency and designed to solve the cumbersome process of budget creation,
Full details on how to use them within.
 From advanced order execution and management to sophisticated alarms and messaging plus the latest market news and data, optimise your trading opportunities with our 12 feature-rich apps. Full details
User Guide OPF TRADER. Copyright Oriental Pacific Futures Sdn Bhd. All Rights Reserved.
 User Guide OPF TRADER Copyright Oriental Pacific Futures Sdn Bhd. All Rights Reserved. Table of Contents System Requirement Checklist... 2 Section 1: Login to OPF Trader... 3 Section 2: View Live Quotes...
1. Overview of the Trade Terminal Opening the Trade Terminal Components of the Trade Terminal Market watch
 USER MANUALS Trade Terminal Tick Chart Trader Stealth Orders Smart Lines Session Map Sentiment Trader Renko Bar Indicator Order History Indicator Mini Terminal Market Manager High-Low Indicator Freehand
Money Management (MX) Frequently Asked Question s
 Frequently Asked Question s") Money Management (MX) Frequently Asked Question s Account Maintenance How do I get rid of duplicate accounts? How do I permanently delete an account? How do I hide/exclude an account? How do I rename my
Money Management (MX) Frequently Asked Question s Account Maintenance How do I get rid of duplicate accounts? How do I permanently delete an account? How do I hide/exclude an account? How do I rename my
Spreadsheet Directions
 The Best Summer Job Offer Ever! Spreadsheet Directions Before beginning, answer questions 1 through 4. Now let s see if you made a wise choice of payment plan. Complete all the steps outlined below in
StockFinder Workbook. Fast and flexible sorting and rule-based scanning. Charting with the largest selection of indicators available
 StockFinder Workbook revised Apr 23, 2009 Charting with the largest selection of indicators available Fast and flexible sorting and rule-based scanning Everything you need to make your own decisions StockFinder
And Training Manual. Version 1.1. P a g e 1 22
 And Training Manual Version 1.1 P a g e 1 22 Contents 1 Workspaces 3 2 Watchlist.. 5 3 Graphs.. 8 4 Order Entry 11 5 Linking Panels Together 16 6 Blotter (Positions, Trades, Orders, Order Book).. 17 7
TRADING CFDs ON THE itradego PLATFORM
 TRADING CFDs ON THE itradego PLATFORM The Vineyards Office Estate, Farm 1 99 Jip de Jager Drive, Welgemoed Cape Town 7530 Private Bag x8 / Tygervalley 7536 South Africa 0219502879 cfd@sanlamitrade.co.za
ULTRA II User Manual. Ultra II is a new Internet security trading system that has been developed to facilitate Bualuang i-trading's customers.
 ULTRA II User Manual Ultra II is a new Internet security trading system that has been developed to facilitate Bualuang i-trading's customers. 1. Over View Ultra II consists of 5 main category pages: 1.1
Forex Online Trading User Guide
 Forex Online Trading User Guide WING FUNG FOREX LIMITED Tel (HK) : (852) 2303 8690 Tel (China) : 400 120 1080 Fax (HK) : (852) 2331 9505 Fax (China) : 400 120 1003 Email : cs@wfgold.com Website : www.wfgold.com
Special Notice. 2017, Copyright VectorVest, Inc.
 2017, Copyright VectorVest, Inc. ALL RIGHTS RESERVED. No part of this publication may be reproduced in any form or by any means without the prior written permission of the publisher and the copyright holder,
MT4 Advanced USER GUIDE
 MT4 Advanced USER GUIDE 1 TABLE OF CONTENTS 1. MINI TERMINAL... 03 2. TRADE TERMINAL... 07 3. ALARM MANAGER...15 4. EXCEL RTD... 32 5. MARKET MANAGER... 41 6. CORRELATION MATRIX... 47 7. CORRELATION TRADER...
P2 Explorer for Qbyte FM
 P2 Explorer for Qbyte FM 1 Introduction 2 Overview the Interface 3 P2 Explorer Framework 4 Administration Settings 4.1 Charts 4.2 Line Graphs 4.3 Bar Graphs 4.4 Sparklines 4.5 Bullet Graphs 5 Getting Started
Using the New Budgeted Financial Statement: Fall Release 2006
 Using the New Budgeted Financial Statement: Fall Release 2006 Introduction The Budgeted Financial Statement is one of the more frequently used reports in the financial analyst s toolkit. Shelby designed
Vivid Reports 2.0 Budget User Guide
 B R I S C O E S O L U T I O N S Vivid Reports 2.0 Budget User Guide Briscoe Solutions Inc PO BOX 2003 Station Main Winnipeg, MB R3C 3R3 Phone 204.975.9409 Toll Free 1.866.484.8778 Copyright 2009-2014 Briscoe
StockFinder 5 Workbook
 StockFinder 5 Workbook Updated Februar y 2010 STOCKFINDER 5 WORKBOOK Worden Brothers, Inc. www.worden.com Five Oaks Office Park 4905 Pine Cone Drive Durham, NC 27707 STOCKFINDER 5 WORKBOOK 2010 Worden
Part 5. Quotes Application. Quotes 691
 Part 5. Quotes Application Quotes 691 692 AIQ TradingExpert Pro User Manual Quotes Application In This Section Overview 694 Getting Started 695 News headline monitor 696 The quotes monitor 697 Quotes 693
CFD Marketmaker v5.0 New Charting User Guide. 7 th June 2005 v1.2
 CFD Marketmaker v5.0 New Charting User Guide 7 th June 2005 v1.2 Contents Page Introduction...3 Charting...4 How to View a Chart... 4 Main Chart Window... 6 Date/Time & Value where the mouse is... 6 Value
Claims. Chapter 11. Adding a Claim. HOW to Add a Claim. Nexsure Training Manual - CRM. In This Chapter
 Nexsure Training Manual - CRM Claims In This Chapter Adding a Claim Populating the Claim form Tracking the Claim Delivering the Claim form Closing and Reopening the Claim Adding a Claim When a claim is
AASTOCKS Market Intelligence Express (MIE)
") AASTOCKS Market Intelligence Express (MIE) User Guide Version 1.3.4 Provided by AASTOCKS.com LIMITED AASTOCKS.com LIMITED A TOM Group Company Unit 4706, 47/F, The Center, 99 Queen s Road Central, Hong
AASTOCKS Market Intelligence Express (MIE) User Guide Version 1.3.4 Provided by AASTOCKS.com LIMITED AASTOCKS.com LIMITED A TOM Group Company Unit 4706, 47/F, The Center, 99 Queen s Road Central, Hong
Autochartist User Manual
 Autochartist User Manual compliance@ifxbrokers.com www.ifxbrokers.com +27 42 293 0353 INTRODUCTION Chapter 1 Autochartist offers traders automated market-scanning tools that highlight trade opportunities
THE CM TRADING METATRADER 4 USER GUIDE:
 THE CM TRADING METATRADER 4 USER GUIDE: THE MAIN SCREEN Main menu (access to the program menu and settings); Toolbars (quick access to the program features and settings); Market Watch window (real-time
Data Sheet for Trendline Trader Pro
 Data Sheet for Trendline Trader Pro Introduction Trendline Trader Pro is a hybrid software application which used a JavaFX based interface to communicate with an underlying MetaTrader MT4 Expert Advisor.
Money Management FAQs
 Page 1 Money Management FAQs What is Money Management? Money Management is a PFM, Personal Financial Management tool, that helps you budget and manage your finances. It allows you to import all of your
CQG Trader User Guide. October 5, 2012 Software version 4.4 R3
 CQG Trader User Guide October 5, 2012 Software version 4.4 R3 2012 CQG Inc. Table of Contents About this Document... 1 What's New in this Release... 2 Related Documents... 3 Customer Support... 4 CQG Trader...
CQG Integrated Client 7.6 New Features User s Guide
 CQG Integrated Client 7.6 New Features User s Guide December 2007 version 2007-02 Copyright 2007 CQG Inc. All rights reserved. Table of Contents CQG Integrated Client 7.6...5 New Features... 5 New Enhancements...
Creating and Monitoring Defined Contribution Plans in Advisor Workstation
 Creating and Monitoring Defined Contribution Plans in Advisor Workstation Disclaimer - - - - - - - - - - - - - - - - - - - - - - - - - - - - - - - - - - - - - 1 Overview - - - - - - - - - - - - - - - -
Chapter 6- Reports Chapter 6- Reports
 Using a computer to keep your farm records makes record keeping easier.and enhances your farm record data. Time savings may be the greatest benefit. While you may not save time during the data entry stage,
Medici Lending Training Guide
 Medici Lending Training Guide This publication was written for Medici Publication Information Medici Lending Training Guide Material ID Number: 280816 Revision: January, 2013 Distributed Subject to Terms
BULLION TRADING PLATFORM ONLINE USER S MANUAL
 BULLION TRADING PLATFORM ONLINE USER S MANUAL CATALOG WING FUNG BULLION INVESTMENT LIMITED Tel (HK) : (852) 2303 8690 Tel (China) : 400 120 1080 Fax (HK) : (852) 2331 9505 Fax (China) : 400 120 1003 Email
UBS Quotes Broad financial information and news
 UBS Online Services UBS Quotes Broad financial information and news What is UBS Quotes? UBS Quotes provides wide-ranging data and information on the global financial markets. You will find information
Frequently Asked Questions for Members
 Frequently Asked Questions for Members m y i n s i g h t p e r s o n a l f i n a n c i a l m a n a g e m e n t t o o l GENERAL What is MyInsight? MyInsight is an intuitive online money management tool
Mutual Fund & Stock Basis Keeper
 A Guide To Mutual Fund & Stock Basis Keeper By Denver Tax Software, Inc. Copyright 1995-2006 Denver Tax Software, Inc. Denver Tax Software, Inc. P.O. Box 5308 Denver, CO 80217-5308 Telephone (voice): Toll-Free:
Aliceblue Mobile App. User Manual
 Aliceblue Mobile App User Manual Introduction Aliceblue Mobile Application gives the Investor Clients of the Brokerage House the convenience of secure and real time access to quotes and trading. The services
Product Eligibility and Pricing Services. Loan Originator User Guide
 Product Eligibility and Pricing Services Loan Originator User Guide Table of Contents Table of Contents Log In... 1 Enter New Loan Data... 1 Evaluate Products... 6 Analyze Search Results... 6 Update Search
MotiveWave Volume and Order Flow Analysis Version: 1.3
 Volume and Order Flow Analysis Version: 1.3 2018 MotiveWave Software Version 1.3 2018 MotiveWave Software Page 1 of 40 Table of Contents 1 Introduction 3 1.1 Terms and Definitions 3 1.2 Tick Data 5 1.2.1
Margin Direct User Guide
 Version 2.0 xx August 2016 Legal Notices No part of this document may be copied, reproduced or translated without the prior written consent of ION Trading UK Limited. ION Trading UK Limited 2016. All Rights
How To Place And Manage Your Orders With Your MT4 Platform
 How To Place And Manage Your Orders With Your MT4 Platform I. How To Place A Simple Buy/Sell Order To place an Order (Sell or Buy), you have to open the Order window (Pic. 1). Pic. 1 - Order window There
Public Financial Management Database Users' Guide
 Public Financial Management Database Users' Guide FEBRUARY 2015 CONTENTS Executive summary.............................................1 The public financial management database...........................2
Bell Aliant PC Phone Installation/Removal Guide
 Bell Aliant PC Phone Installation/Removal Guide Version 10.4 (January 2017) bellaliant.ca/unifiedcommunications 1 Before you begin You will need to login into your Personal Agent, and change your password,
In this chapter: Budgets and Planning Tools. Configure a budget. Report on budget versus actual figures. Export budgets.
 Budgets and Planning Tools In this chapter: Configure a budget Report on budget versus actual figures Export budgets Project cash flow Chapter 23 479 Tuesday, September 18, 2007 4:38:14 PM 480 P A R T
Bond Amortization. amortization schedule. the PV, FV, and PMT functions. elements. macros
 8 Bond Amortization N LY O LEARNING OBJECTIVES a bond amortization schedule Use the PV, FV, and PMT functions Protect worksheet elements Automate processes with macros A T IO N Create E V A LU Financial
MINI TERMINAL User Guide
 MINI TERMINAL User Guide 1 CONTENTS 1. PLACING TRADES USING THE MINI TERMINAL 4 1.1 Placing buy/sell orders 4 1.1.1 Calculators 4 1.2 Placing pending orders 4 1.2.1 Placing pending orders directly from