P2 Explorer for Qbyte FM
|
|
|
- Thomasina Baldwin
- 5 years ago
- Views:
Transcription
1 P2 Explorer for Qbyte FM 1 Introduction 2 Overview the Interface 3 P2 Explorer Framework 4 Administration Settings 4.1 Charts 4.2 Line Graphs 4.3 Bar Graphs 4.4 Sparklines 4.5 Bullet Graphs 5 Getting Started 5.1 Launching P2 Explorer for Qbyte Financial 5.2 Navigating and Accessing the Dashboards 5.3 Changing Your Password 5.4 Logging Out 6 Using P2 Explorer Dashboards 6.1 Toolbar 6.2 Dashboard Sharing Functions 6.3 Printing 6.4 Exporting 6.5 Linking 6.6 Save Dashboards 6.7 Tooltips 6.8 Browser Tips Browser Toolbar Browser Settings 6.9 Search 7 Accounting Dashboards 7.1 Selections 7.2 Linked Dashboards 7.3 Top CorporateTargets 7.5 Key Performance Indicators KPIs 7.6 Operating Income 7.7 Operating Income Year To Date 7.8 Operating Income 7.9 Operating Income per BOE 7.10 Operating Income per BOE 7.11 Operating Income - Percentage of Sales 7.12 Sales 7.13 Sales Year to Date 7.14 Sales by Product 7.15 Daily Sales Volumes 7.16 Product Sales by Major Area 7.17 Oil Sales 7.18 Oil Sales Year to Date 7.19 Oil Sales by Major Area 7.20 Oil Sales Volumes 7.21 Oil Sales Trend by Major Area 7.22 Average Price by Major Area 7.23 Gas Sales 7.24 Gas Sales Year-to-Date 7.25 Gas Sales by Major Area 7.26 Gas Sales Volumes 7.27 Gas Sales Trend by Major Area 7.28 Average Price by Major Area 7.29 NGL Sales 7.30 NGL Sales Year to Date 7.31 NGL Sales by Major Area 7.32 NGL Sales Volume 7.33 NGL Sales Trend by Major Area 7.34 Average Price by Major Area 7.35 Royalties 7.36 Royalties Year-to-Date 7.37 Royalties by Product 7.38 Royalties % of Sales 7.39 Royalties by Major Area 7.40 Operating Expenses 7.41 Operating Expenses Year to Date
2 7.42 Operating Expenses Trend 7.43 Operating Expenses Per BOE 7.44 Operating Expenses by Major Area 7.45 Monthly Operating Expenses by Major Area 7.46 Capital Expenditures 7.47 Capital Expenditures Year-to-Date 7.48 Capital By Type 7.49 Top Ten Capital Spend 7.50 Capital Expenditure by Type Trend 7.51 Capital Budget Comparisons 7.52 Afe Variances 8 Glossary 8.1 Dashboard 8.2 Entity 8.3 Hierarchy 8.4 Snapshot 8.5 Tag Value 8.6 Trend Introduction P2 Explorer for Qbyte Financial provides a series of report pages based on industry key performance indicators using your organization's corporate hierarchy. The primary focus is on Operating Income and Capital Expenditures. The dashboards show charts and graphical representations for Sales, Royalties, Operating Expenses and Capital Expenditures by product, using your selections for different reporting levels with links to P2 Optix reports for transaction information that supports the graphs and charts. P2 Explorer for Qbyte Financial includes the following consoles: 1. Key Performance Indicators Key Performance Indicators Explorer shows Financial KPI s calculated year to date with the target percentage, the trend for the last 12 months and bullet graph for comparison to target for your Top Ten for Operating Income and Capital Spend for the selected reporting level. 2. Operating Income Operating Income Explorer chart shows year to date totals in thousands of dollars for Operating Income, Sales, Royalty and expenses Year to Date with target percentage, the trend for the last 12 months and bullet graph for comparison to target for your Top Ten. Operating Income, Operating Income per BOE and Operating Income Percentage of Sales graphs for the last 12 months. 3. Sales Sales Explorer chart shows Sales Year to Date with supporting volumes and prices by product and a bullet graph for comparison to target for your Top Ten. Graphs show Sales by Product, Daily Sales Volumes and Product Sales by Major Area for the last 12 months. 4. Sales Oil Oil Sales Explorer chart shows Oil Sales Year to Date with supporting volumes and prices, oil sales trends for the last 12 months and a bullet graph for comparison to target for your Top Ten. Graphs show Oil sales by Major Area, Sales Volumes, Oil Sales Trend by Major Area and Average Price by Major Area for the last 12 months. 5. Sales Gas Gas Sales Explorer chart shows Gas Sales Year to Date with supporting volumes and prices, sales trend for the last 12 months and a bullet graph for comparison to target for your Top Ten. Graphs show Gas sales by Major Area, Sales Volumes, Gas Sales Trend by Major Area and Average Price by Major Area for the last 12 months. 6.Sales NGL NGL Sales Explorer chart shows NGL Sales Year to Date with supporting volumes and prices, sales trend for the last 12 months and a bullet graph for comparison to target for your Top Ten. Graphs show NGL sales by Major Area, Sales Volumes, NGL Sales Trend by Major Area and Average Price by Major Area for the last 12 months. 7.Royalties

3 Royalties chart shows Total Royalties Year to Date with supporting royalties by product with royalties by product as a percentage of sales for your Top Ten. Graphs show Royalties by Major Area by Product, Royalties by Product and Royalties % of Sales by Product for the last 12 months. 8.Operating Expenses Operating Expense chart shows Total Operating Expenses, Operating Expenses per BOE with breakdown between Operating Expenses and Transportation for your Top Ten selections. Graphs show Operating Expenses by Major Area, Operating Expenses Trend, Operating Expenses per BOE and Monthly Operating Expenses by Major Area for the last 12 months. 9. Capital Expenditures Capital by Type chart shows the total dollars spent with the number of projects year to date for Land, Drilling and Facilities with sparklines to illustrate the capital spending trend. Top 10 Capital Spend shows the total dollars spent with the number of projects year to date for Land, Drilling and Facilities with sparklines to illustrate the capital spending trend for your Top Ten. Graph shows Capital Expenditure by Type for the last 12 months with a comparison to Budget. 10. AFE Variances AFE actual costs are compared to AFE estimates with calculated variance and variance percentage. AFE variance percentages are shown graphically. Overspent AFE s will be displayed in red. Overview the Interface P2 Explorer for Accounting Dashboards is a P2 application that operates within the P2 Explorer framework. The following screen displays the home page of P2 Explorer for Qbyte Financial. All P2 Explorer for Qbyte Financial pages have the following sections:
4 P2 Explorer Header P2 Explorer for P2 Qbyte is an application that operates within the P2 Explorer framework. Although a brief introduction is included in this guide, refer to the P2 Explorer Help for detailed information. Workspaces The categories in which various dashboards appear. Workspaces may have different access permissions. There are two special workspaces: All, which displays all the dashboards across all workspaces; and Saved, which displays the saved workspace snapshots.
5 Search Bar The search bar allows you to search for keywords on the dashboard pages. It also allows you to select multiple pages for deletion. Dashboard Thumbnails Select the thumbnail to open the corresponding dashboard. P2 Explorer Framework P2 Explorer for Qbyte Financial is an application that operates within the P2 Explorer framework. The framework provides a number of advanced functions that are incorporated into the dashboards, including: Trends Charts
6 Tables For detailed information on how to use the functions in the P2 Explorer Framework, refer to the P2 Explorer Help in the framework. Administration Settings Administration settings are only available to users with administrative privileges, and allow you to specify the default dashboard to present in various workspaces and to various users. To change the administration settings, select the gear icon and make the relevant changes. Charts Charts or tables are used to display individual values. They can display quantitative values that include more than one unit of measure, ex. volumes and dollars. Line Graphs Line Graphs are used to plot changes in data over time such as changes in average prices by product. When plotting changes in data over time, time is plotted along the horizontal (x-axis) and amounts along the vertical (y axis). You can use these changes to find trends in your data and predict future results. Bar Graphs Bar graphs are used to show amounts using a vertical bar, the taller the bar the greater the amount. Bar graphs make it easy to differences in the data being compared. Stacked bar graphs are used to compare the parts to the whole. The bars in a stacked bar graph are divided into categories. Each bar represents a total. Grouped or clustered bar graphs are used to represent different values item that share the same category like a reporting level. Sparklines A sparkline is a very small line chart, typically drawn without axes or coordinates. It presents the general shape of the variation over time in some measurement, either volumes or dollars, in a simple and highly condensed way.

7 Bullet Graphs The bullet graph features a single, primary measure (for example, current year-to-date revenue), compares that measure to a target and displays it in the context of qualitative ranges of performance, such as poor, satisfactory, and good. The qualitative ranges are displayed as varying intensities of a single hue to make them discernible by those who are color blind and to keep the use of colors on the dashboard to a minimum. Getting Started Before you start you will need: Username and password Normally this will be your standard network login. Check with your System Administrator if you are unsure. Web address (URL) for accessing P2 Production Explorer Available from your System Administrator. A web browser and access to the corporate intranet Required to access P2 Explorer for Qbyte Financial. Launching P2 Explorer for Qbyte Financial To launch P2 Explorer for Qbyte Financial and log in: 1. Open a browser, such as Internet Explorer. 2. Enter the URL supplied by your System Administrator in the address bar. For example, The link to P2 Explorer for P2 Qbyte is usually available via P2 Explorer or on your corporate intranet. Click any links required to access P2 Production Explorer, as directed by your System Administrator. If automatic login fails, or if you have logged out, the login page appears. 3. To log in from the logon page, you can select Log on automatically to log on using your network or portal credentials. Alternatively: a. Enter your network user name in the User Name box. You may need to also specify the domain name., for example: DOMAIN\user.nameb.
. 5. Once the Dashboard is open, select Top Ten, and choose the areas for which you want to display data.")
8 Enter your password in the Password box.c. Select Log on. P2 Explorer opens, displaying the Accounting workspace. 4. Select one of the thumbnails to open a dashboard (for example, Key Performance Indicators). 5. Once the Dashboard is open, select Top Ten, and choose the areas for which you want to display data. You can choose a maximum of 10 areas. Navigating and Accessing the Dashboards The P2 Explorer for Qbyte Financial landing page displays a number of dashboard workspaces. The dashboards and workspaces that you will have access to depend on your licensing arrangements. To view additional dashboards, contact P2 Customer Support. To view the Accounting dashboards, select the Accounting tab. The Accounting tab displays a series of thumbnails, with each thumbnail representing a dashboard. Select a thumbnail to view the corresponding dashboard.


9 Select the x on the tab to close a dashboard. Select the new tab icon to open a dashboard. Changing Your Password Contact your System Administrator to change your password. Logging Out Select your Name > Logout to log out of P2 Explorer.

10 Using P2 Explorer Dashboards This section provides you with some useful hints on how to get the most out of P2 Explorer. Toolbar Dashboards in P2 Explorer by default display a toolbar, which allows you to do a number of things relating to the dashboard. The toolbar provides: A breadcrumb trail, so you can see your location in the Accounting workspace. Dashboard editing functions (for advanced users). Dashboard sharing functions. 1. To hide the toolbar,select the Settings icon and choose Hide Toolbar. 2. To display a toolbar that has been previously hidden, select the Settings icon and choose Show Toolbar. Dashboard Sharing Functions P2 Explorer allows you to: Print a dashboard Export a dashboard as a.csv file Send a link to a dashboard Save a snapshot of a dashboard. 1. Select the Share icon on the toolbar to access the dashboard sharing functions.

11 Printing P2 Explorer uses the browser s built-in print functionality to print a dashboard. The dashboard will be printed exactly as it appears in the preview window. To print a dashboard select the share icon > Print Dashboard. Make any required adjustments to print settings before selecting Print. Note: You should change the layout to landscape and modify the page size to A3 to accommodate the dashboards. Exporting You can export the currently opened dashboard as a.csv file, to view the individual data points that are displayed in charts and graphs. To export a dashboard, select the share icon > Export to CSV. The file downloads to the file location specified in your browser settings. Linking When you have a dashboard open, you can obtain a direct link to the dashboard to send to other people. To link a dashboard: 1. Select the share icon. 2. Select Send Link. 3. In the Link to current dashboard window, highlight the text displayed in the Link box. You can check to see if the link is working by selecting Click to test link. 4. Copy the highlighted text to the Windows clipboard (CTRL & V) 5. Paste the link into an or other document. 6. Close the Link to current dashboard window.
12 Save Dashboards You can save a snapshot of the currently opened dashboard, retaining the dashboard s current settings. For example, you can change the pre-selected hierarchy, period, and currency, and save it as a snapshot. If the original dashboard changes, those changes will be reflected in the snapshot and you may need to take another snapshot with your preferred settings. 1. Make any changes to the hierarchy and other dashboard settings, as required. 2. Select the share icon. 3. Select Save Dashboard. 4. In the Save Current Dashboard window, enter the following: Name: The name of the snapshot. This will appear as a subtitle below the dashboard name in the thumbnail. Description: A description of the snapshot. 5. Select Save. Snapshots are stored in the Saved workspace on the dashboard landing page. Tooltips On all charts and graphs you can hover over a column to display the actual value for that column in a tooltip at the top of the column.
13 Browser Tips It is not recommended to use the browser navigation to navigate outside of P2 Explorer. If you use your browser to navigate, all open pages except the home page will close when you use the browser's Back button to return to the P2 Explorer page. Browser Toolbar If you need to maximize the size of your P2 Explorer page, press the F11 key to switch to full-screen mode. Press F11 again to exit full-screen mode. Browser Settings Ensure you have the following settings enabled. If you are unsure how to change settings, check with your System Administrator. Allow Popups Add the P2 Explorer server URL (for example: to your trusted sites Correct Security settings for the Internet zone. Sometimes, a Windows update will change these settings in your browser, which may result in some pages not working correctly. If you think this has occurred, contact your System Administrator to change them.
14 Search P2 Explorer s search facility allows you to search for specific dashboards within a workspace. 1. To search for a dashboard, place your cursor in the Search Dashboards box and start typing any part of the name of a dashboard. As you type, the thumbnails in the workspace disappear as they are filtered out of the search. The search applies across all workspaces. 2. Select a workspace to view the search results for that workspace. If you want to view search results across all workspaces, select ALL workspaces. If you select Enter, the first dashboard in the list of results will open. Accounting Dashboards P2 Explorer for P2 Qbyte pages are organized so that you can drill down from the Corporate Summary page to more detailed views. In the Accounting dashboards, oil sales are green, gas sales are red and NGL sales are purple. Selections In the upper-right corner of every dashboard, you will find your selection options. For the P2 Explorer Accounting Dashboards you will be able select how you would like to see your information. For each selection, there is a default defined. Select the arrow beside the default selection to display the available options. The settings are: Currency The currency in which monetary units are to be displayed. You can select from several available reporting currencies. Default: CAD Amount
15 You can present amounts as either Gross or Net. Gross amounts displayed are your organizations managed interest. Default value is Net. Volumes You can display volumes using either the Imperial or Metric measurement system. Default value is Imperial. Period Type You can specify either an Accounting or Production period. If not explicitly specified, the period type will default to Accounting. Period End Reports are presented for the 12 months prior to the selected month/year period. If not explicitly specified, the period end will default to the current month and year. Level The reporting level allows you to define your major reporting groups by selecting the appropriate level in the reporting hierarchy. The reporting level will default to the parent hierarchy level for cost centres for operations reporting and to AFE for Capital reporting. Linked Dashboards All of the dashboards, except for Corporate Targets, are by default linked to other dashboards. This is indicated by a green chainlink icon on the tab. When dashboards are linked, the selections are carried through to all other dashboards that you open. For example, if you open the KPI dashboard and change the currency to USD, then the next dashboard that you open will automatically have the currency set to USD. Additionally, whenever you change a selection on any of the linked dashboards, the selections will then change on all of the linked open dashboards. If you do not want to link a dashboard, select the green chainlink icon, and it will change to a broken link icon, indicating that the dashboard will not be linked to any other dashboards that you open. You can link or unlink a dashboard by selecting the chainlink icon on the tab. A grey chainlink icon on the toolbar indicates if the actively displayed dashboard is linked or not. In the example below, the Key Performance Indicator dashboard is linked, so that when you open other dashboards the selections will follow through. However, the Operating Income dashboard is not linked, so the selections may be changed independently without affecting the other dashboards.
16 Top 10 You can select the business units, areas or other reporting level that you would like to display as your Top Ten for charts at the major reporting level you have selected. All other revenue and expenses for the reporting level that are not listed will be totalled and displayed in charts as Other. If you have not listed a Top Ten, the first ten within the selected reporting level for your reporting hierarchy will be displayed. To select your Top Ten for the selected reporting level, select Top Ten in the right hand corner of the explorer. A side panel will open that will display the options within the selected reporting level. The panel consists of several sections:
17
18 Favorites Select this button to save your selections. You may save a maximum of 10 selections, but you can save several selection 'sets'. Search entities Search the hierarchy for a specific entity. Start typing the entity s name, or part of the entity s name, and the relevant matches will be listed.
19 Hierarchy filter If you want to search for entities in a specific hierarchy, select the hierarchy and then type the entity name in the Find Under box. Find Under Search the selected hierarchy for a specific entity. Start typing the entity s name, or part of the entity s name, and the relevant matches will be listed.
20 Entities Select an entity to add it to your top 10 selection. Select the entity that you want to select. A check mark will indicate that the entity has been selected and will appear in the selections list below. If there are already ten selections, the new selection will be added and the first entry that was added to the selection list (located at the bottom of the list) will be removed. Selections Initially, the selection list displays the default selection. When new items are added and there are already 10 items in the list, the oldest item (located at the bottom of the list) will be removed and the newest item will be added to the top of the list. You can remove an item from the selection list by selecting the X next to it. Important: Every time you open P2 Explorer you must select a Favorite from the Top Ten in order to display data inside the dashboards. CorporateTargets Corporate targets are entered in Qbyte Financial by accounting period. You can view corporate targets in two ways: 1. From the Accounting tab in P2 Explorer select the Corporate Targets dashboard thumbnail.
21 2. From the Key Performance Indicators dashboard, select the Targets link above the KPIs table. Key Performance Indicators The main dashboard provides an overview of KPIs, with each KPI showing a sparkline, bullet graph, point value, and targets. 1. From the Accounting tab in P2 Explorer, select the Key Performance Indicators dashboard thumbnail.
22 The dashboard is divided into three sections: KPIs, Operating Income, and Capital Spend. KPIs Operating Income Shows year-to-date amounts for Sales, Royalties, Expenses and Operating Income with a graph showing the trend for the last 12 months. Indicators are displayed when corporate targets will not be met. Sales Shows the year-to-date sales by product with comparison to corporate targets and the trend for the last 12 months. Indicators are displayed when corporate targets will not be met. Daily Production Shows year-to-date daily sales by product with comparison to corporate targets and the trend for the last 12 months. Indicators are displayed when corporate targets will not be met. Netback per BOE Shows year-to-date Sales, Royalties, Operating Expenses, Netback and General and Admin expenses per BOE with comparison to corporate targets and the trend for the last 12 months. Indicators are displayed when corporate targets will not be met. Capital by Type Shows year-to-date amounts for capital expenditures for Land, Drilling and Facilities with comparison to corporate targets and a graph showing

23 the trend for the last 12 months. Indicators are displayed when corporate targets will not be met. Operating Income You can display up to ten selections for any reporting level in your corporate hierarchy. For each of your selections, Operating Income, Sales, Royalty and Expense year to date amounts with a graph showing the operating income trend for the last 12 months. Capital Spend You can display up to ten selections for any reporting level in your corporate hierarchy. For each of your selections, total capital expenditures and the breakdown for Land Drilling and Facilities year to date amounts with a graph showing the capital expenditure trend for the last 12 months. Operating Income Operating Income chart shows year-to-date amounts for Sales, Royalties, Expenses and Operating Income with a graph showing the trend for the last 12 months. Detail graphs for Operating Income, Operating Income per BOE and Operating Income Percentage of Sales show the trend for the last twelve months based on the Period Ended selection. The charts and graphs on the Operating Income dashboard show the results based on your Top Ten for the selected reporting level in your corporate hierarchy. Sales, royalty, expense, transportation are defined as account class codes at the major account level. Unit of measure, conversion rates and product type (Oil, Gas, and NGL) are defined in the products table. Product code is assigned at the account level.
24 Operating Income Year To Date The Operating Income Year to Date chart shows year-to-date amounts for Sales, Royalties, Expenses and Operating Income with a graph showing the trend for the last 12 months. The charts and graphs on the Operating Income dashboard show the results based on your Top Ten for the selected reporting level in your corporate hierarchy. Sales, royalty and expenses are based on account class codes at the major account level. When you select a reporting level from your Top Ten, the detailed graphs will display information for only the selected area. Click again and the graphs will display information for all the selected reporting levels. To drill down to more detailed information for Sales, Royalty or Expenses click on the icon beside the column headings. Operating Income
25 The Operating Income graph shows the trend for the last 12 months based on the selected Period End for Sales, Royalties, Expenses and Operating Income. The results are based on your Top Ten for the selected reporting level in your corporate hierarchy. Sales, royalty and expenses are based on account class codes at the major account level. To display the actual value for a column, hover over the column. The selected month and amount in thousands of dollars will display above the column.
26 Operating Income per BOE
27 The Operating Income per BOE graph shows the trend for the last 12 months based on the selected Period End for Sales, Royalties, Expenses and Operating Income per BOE (barrel of oil equivalent) The graph shows the results based on your Top Ten for the selected reporting level in your corporate hierarchy. Sales, royalty and expenses are based on account class codes at the major account level. Unit of measure, conversion rates and product type (Oil, Gas, NGL) are defined in the products table. Product code is assigned at the account level. To display the actual value for a column, hover over the column. The selected month and amount in thousands of dollars will display above the column.

28 Operating Income per BOE

29 The Operating Income per BOE graph shows the trend for the last 12 months based on the selected Period End for Sales, Royalties, Expenses and Operating Income per BOE (barrel of oil equivalent). The graph shows the results based on your Top Ten for the selected reporting level in your corporate hierarchy. Sales, royalty and expenses are based on account class codes at the major account level. Unit of measure, conversion rates and product type (Oil, Gas, NGL) are defined in the products table. Product code is assigned at the account level. To display the actual value for a column, hover over the column. The selected month and amount in thousands of dollars will display above the column. Operating Income - Percentage of Sales The Operating Income - Percentage of Sales shows the trend for the last 12 months based on the selected Period End for Royalties, Expenses and Operating Income shown as a percentage of total sales. The graph shows the results based on your Top Ten for the selected reporting level in your corporate hierarchy. Sales, royalty and expenses are based on account class codes at the major account level. To display the actual value for a column, hover over the column. The selected month and amount in thousands of dollars will display above the column. Sales Sales chart shows year to date amounts for Volumes, Price and Oil, Gas and NGL Sales in thousands of dollars. Detail graphs for Sales by Product, Daily Sales Volumes and Product Sales by Major Area show the trend for the last twelve months based on the Period Ended selection.
 are defined in the products table.")
30 The charts and graphs on the Sales show the results based on your Top Ten for the selected reporting level in your corporate hierarchy. Sales are defined as account class codes at the major account level. Unit of measure, conversion rates and product type (Oil, Gas, NGL) are defined in the products table. Product code is assigned at the account level. Sales Year to Date
31 The Sales Year to Date chart shows year to date sales amounts and volumes for your Top Ten based on the selected reporting level. Volumes are displayed in either metric or imperial units of measure based your selection. When you click on a reporting level from your Top Ten, the detailed graphs will display information for only the selected area. Click again and the graphs will display information for all the selected reporting levels. To drill down to more detailed information for Oil, Gas or NGL Sales, select the icon beside the column headings. To drill down to more detailed information for one of your Top Ten, select the icon at the end of the row for the Reporting Level. This will launch an Optix report that will provide you with sales information for all of the cost centres included in the selected reporting level for the last twelve months. You will be able to drill down to transactions or master information from the Optix report. Sales by Product

32 Sales by Product shows the trend for the last twelve months based on the selected Period End for oil, gas and NGL sales shown in a stacked column graph. In the Accounting Explorers, oil sales are green, gas sales are red and NGL sales are purple. Daily Sales Volumes
33 Daily Sales Volumes shows the sales volume trend for the last twelve months based on the selected Period End for oil, gas, and NGL sales. Oil sales are shown green, gas sales are red and NGL sales are purple. Product Sales by Major Area
34 Sales by Product shows the trend for the year to date sales dollars shown in thousands of dollars for your Top Ten selections for oil, gas, and NGL shown in a stacked column graph. In the Accounting Explorers, oil sales are green, gas sales are red and NGL sales are purple. Oil Sales Oil Sales chart shows year to date amounts for Volumes, Price and Sales in thousands of dollars with the trend for the last twelve months and a bullet graph that displays actuals compared to budget for your Top Ten compared to budgets. Detailed graphs show Sales by Major Area, Sales Volumes, Oil Sales Trend and Average Price for your top ten selections for the reporting level.

35 Oil Sales Year to Date

36 The Oil Sales Year to Date chart shows year to date amounts for Oil Sales, Volume and Prices with a graph showing the trend for the last twelve months and a bullets graph comparing actual oil sales to budget. The charts and graphs show the results based on your Top Ten for the selected reporting level in your corporate hierarchy. When you click on a reporting level from your Top Ten, the detailed graphs will display information for the selected area. Click again and the graphs will display information for all the selected reporting levels. Oil Sales by Major Area
37 Oil Sales by Major Area shows the trend for the year to date sales shown in thousands of dollars for your Top Ten selection. To display the actual value for a column, hover over the column. The selected month and amount in thousands of dollars will display above the column. Oil Sales Volumes

38 Oil Sales Volumes shows the trend for the last twelve months in either metric or imperial measurement systems for your Top Ten selections. To display the actual value for a column, hover over the column. The selected month and volume dollars will display above the column Oil Sales Trend by Major Area
39 Oil Sales trend by Major Area shows the trend for the last twelve months shown in thousands of dollars for each or your Top Ten selections. Average Price by Major Area
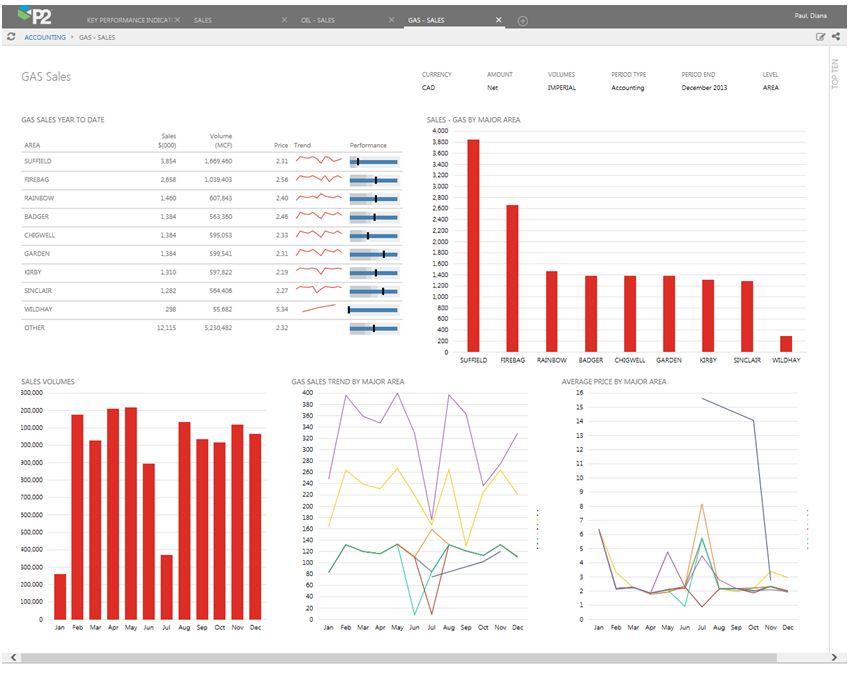
40 Average Price by Major Area shows the average oil price trend for the last twelve months shown for each of your Top Ten selections. Gas Sales The Gas Sales chart shows year to date amounts for Volumes, Price and Sales in thousands of dollars with the trend for the last twelve months and bullet graph that displays actuals compared to budget for your Top Ten compared to budgets. Detailed graphs show Sales by Major Area, Sales Volumes, Gas Sales Trend and Average Price for your top ten selections for the reporting level.
41 Gas Sales Year-to-Date

42 Gas Sales Year to Date chart shows year to date amounts for Gas Sales, Volume and Prices with a graph showing the trend for the last twelve months and a bullets graph comparing actual oil sales to budget. The charts and graphs show the results based on your Top Ten for the selected reporting level in your corporate hierarchy. When you select a reporting level from your Top Ten, the detailed graphs will display information for the selected area. Select again and the graphs will display information for all the selected reporting levels. Gas Sales by Major Area


43 Gas Sales by Major Area shows the trend for the year-to-date sales shown in thousands of dollars for your Top Ten selection. To display the actual value for a column, hover over the column. The selected month and amount in thousands of dollars will display above the column. Gas Sales Volumes

44 Gas Sales Volumes shows the trend for the last twelve months in either metric or imperial measurement systems for your Top Ten selections. To display the actual value for a column, hover over the column. The selected month and volume dollars will display above the column Gas Sales Trend by Major Area
45 Gas Sales trend by Major Area shows the trend for the last twelve months shown in thousands of dollars for each or your Top Ten selections. Average Price by Major Area
46 Average Price by Major Area shows the average gas price trend for the last twelve months shown for each of your Top Ten selections. NGL Sales NGL Sales chart shows year to date amounts for Volumes, Price and Sales in thousands of dollars with the trend for the last twelve months and bullet graph that displays actuals compared to budget for your Top Ten compared to budgets. Detailed graphs show Sales by Major Area, Sales Volumes, NGL Sales Trend and Average Price for your top ten selections for the reporting level.

47 NGL Sales Year to Date
48 NGL Sales Year to Date chart shows year to date amounts for NGL Sales, Volume and Prices with a graph showing the trend for the last twelve months and a bullets graph comparing actual oil sales to budget. The charts and graphs show the results based on your Top Ten for the selected reporting level in your corporate hierarchy. When you select a reporting level from your Top Ten, the detailed graphs will display information for the selected area. Click again and the graphs will display information for all the selected reporting levels. NGL Sales by Major Area
49 NGL Sales by Major Area shows the trend for the year to date sales shown in thousands of dollars for your Top Ten selection. To display the actual value for a column, hover over the column. The selected month and amount in thousands of dollars will display above the column.
50 NGL Sales Volume
51 NGL Sales Volumes shows the trend for the last twelve months in either metric or imperial measurement systems for your Top Ten selections. To display the actual value for a column, hover over the column. The selected month and volume dollars will display above the column NGL Sales Trend by Major Area
52 NGL Sales trend by Major Area shows the trend for the last twelve months shown in thousands of dollars for each or your Top Ten selections. Average Price by Major Area
53 Average Price by Major Area shows the average gas price trend for the last twelve months shown for each of your Top Ten selections. Royalties Royalties chart shows year to date amounts for total royalties, oil royalties, gas royalties, and NGL royalties in thousands of dollars with calculation of royalty amount as a percentage of sales for your Top Ten. Detailed graphs show Royalties by Product, Royalties % of Sales and Royalties by Major Area for your top ten selections for the reporting level. Royalties Year-to-Date
54 Royalties chart shows year to date amounts for total royalties, oil royalties, gas royalties, and NGL royalties in thousands of dollars with calculation of royalty amount as a percentage of sales for your Top Ten. Royalties by Product Royalties by Product shows royalties by product trend for the last twelve months for your Top Ten selections. Standard colours for products (Oil - Green, Gas Red and NGL Purple) apply.
55 Royalties % of Sales Royalties % of Sales by Product shows royalties by product trend for the last twelve months for your Top Ten selections. Standard colours for products (Oil - Green, Gas Red and NGL Purple) apply. Royalties by Major Area
56 Royalties by Major Area shows the trend for the year to date royalties shown in thousands of dollars for your Top Ten selections. To display the actual value for a column, hover over the column. The selected month and amount in thousands of dollars will display above the column. Oil royalties are displayed by default when the dashboard is opened. To display Gas Royalties by Major Area, click on Gas in the right hand corner of the graph. Operating Expenses Operating Expenses chart shows year to date amounts for total expenses, expenses per BOE (barrel of oil equivalent), transportation and Operating Expenses. Detailed graphs show Operating Expenses Trend, Operating Expenses per BOE trend, Operating Expenses by Major Area, and Monthly Operating Expenses by Major Area.

57 Operating Expenses Year to Date

58 Operating Expenses Year to Date chart shows year to date amounts for Total Expenses, Expenses per BOE, Transportation and Operating Expenses. The charts and graphs show the results based on your Top Ten for the selected reporting level in your corporate hierarchy. When you select a reporting level from your Top Ten, the detailed graphs will display information for the selected area. Click again and the graphs will display information for all the selected reporting levels. Operating Expenses Trend Operating Expenses graph shows the trend for the last twelve months for Operating Expenses and Transportation for the last twelve months

59 based on the Period End for your Top Ten selections. Operating Expenses Per BOE Operating Expenses graph shows the trend for the last twelve months for Operating Expenses and Transportation per BOE for the last twelve months based on the Period End for your Top Ten selections. Operating Expenses by Major Area
60 Operating Expenses by Major Area shows the trend for the year to date operating expenses by defined categories shown in thousands of dollars for your Top Ten selections. The categories are defined in Qbyte Financial using account groups. Monthly Operating Expenses by Major Area
61 Monthly Operating Expenses by Major Area shows the trend for the last twelve months based on the Period End for operating expenses by defined categories shown in thousands of dollars for your Top Ten selections. The categories are defined in Qbyte Financial using account groups. Capital Expenditures The Capital Expenditures chart shows year to date amounts for total capital expenditures by Capital Type Land, Drilling and Facilities. Count represents the number of land acquisitions, wells or facilities represented by cost centres. Trend shows the capital spending by month for the selected year. Top Ten Capital Spend shows Total capital expenditures, year to date trend, amounts and amount by capital type for your top ten selections for the reporting level. Detailed graph shows the capital expenditure by type trend with budget comparison. Capital Expenditures Year-to-Date
62 Capital By Type Capital Expenditures chart shows year-to-date amounts for total capital expenditures by Capital Type Land, Drilling and Facilities. Count represents the number of land acquisitions, wells or facilities represented by cost centres. Trend shows the capital spending by month for the selected year. Top Ten Capital Spend
63 Top Ten Capital Spend shows Total capital expenditures, year-to-date trend, amounts and amount by capital type for your top ten selections for the reporting level Capital Expenditure by Type Trend Capital Expenditure by Type Trend shows the monthly capital expenditure by capital Type in a stacked column graph with a budget comparison by area shown as a trend line. Capital Budget Comparisons Capital Budget Comparisons shows total capital expenditures, AFE Estimates and Capital Budget for your Top Ten selections for the selected reporting level.

64 Afe Variances The AFE Variances chart shows the AFE number, Name, AFE Estimate, AFE Actual, Variance and Variance % Detailed graph displays the AFE variance % overspent or underspent. Underspent AFEs are shown in green and overspent AFEs are shown in red.
65 Glossary Dashboard A graphical presentation that displays the current status of key performance indicators (KPIs) for an enterprise. Entity The unique name given to a piece of data within P2 Explorer. The entity is configured so that applications can use, find and change the data it represents. An entity may be a physical item or a logical grouping. Hierarchy A hierarchical structure of entities configured to make data easy to locate. Entities can be located in different places within the same hierarchy and in multiple hierarchies. The organization of the hierarchies is a very important part of P2 Explorer because it provides a user-friendly way to navigate through the tens of thousands of data items. Snapshot A linked dashboard that has been saved with specific user settings. If the original dashboard changes, the snapshot will also change. Tag Value A piece of data on a page. Trend The graphical representation of over time.
PFM MoneyMobile. Product Overview Guide. August 2013
 PFM MoneyMobile Product Overview Guide August 2013 1 Contents MoneyMobile iphone App... 3 New Navigation Menu... 5 Accounts... 6 Transactions... 13 Excluded Transactions... 16 Spending Wheel... 17 Bubble
DUS DocWay TM Loan Documents User Guide. January 2019
 DUS DocWay TM Loan Documents User Guide January 2019 Table of Contents Getting Started with DUS DocWay... 1 Welcome Page Navigation... 3 Loan Documents Navigation... 6 Update Document Category and Type...
PVCC S STRATEGIC PLANNING ONLINE SYSTEM (SPOL)
") PVCC S STRATEGIC PLANNING ONLINE SYSTEM (SPOL) Strategic Planning Online (SPOL) is a web based software solution specifically designed to help institutions automate the planning and budgeting process.
PVCC S STRATEGIC PLANNING ONLINE SYSTEM (SPOL) Strategic Planning Online (SPOL) is a web based software solution specifically designed to help institutions automate the planning and budgeting process.
Contents. Introduction
 Getting Started Introduction O&M Profiler User Guide (v6) Contents Contents... 1 Introduction... 2 Logging In... 2 Messages... 3 Options... 4 Help... 4 Home Screen... 5 System Navigation... 5 Dashboard...
SBA Lender Portal Overview. April 2018
 SBA Lender Portal Overview April 2018 Table of Contents Overview Logging in to the SBA Lender Portal - https://sbalenderportal.dnb.com Navigating the Portal Downloading Lender Report Downloading Loan Report
Multifamily Securities Investor Access Desk Reference Manual
 Multifamily Securities Investor Access Manual February 2013 Contents 1 Application Overview... 3 2 Minimum Browser Requirements... 3 3 Contacting Investor Access Tool Administrator... 3 4 Accessing and
USER GUIDE. October 2015
 TM USER GUIDE October 2015 CONTENTS ACCESS SMARTCLOSE TO INITIATE COLLABORATION... 1 INVITE COLLABORATORS... 3 PIPELINE VIEW... 4 INSIDE SMARTCLOSE... 5 OWNER DROPDOWN... 5 THE AUDIT SYSTEM... 6 THE MESSAGING
Your Wealth Management Portal
 Your Wealth Management Portal As part of your Wealth Management Service, you have a personal secure electronic document vault located on a secure server and accessed exclusively through your Wealth Management
BudgetPak User Guide FY1718
 BudgetPak User Guide FY1718 Contents Overview... 2 About Your FY1718 Budget... 2 Logging In to BudgetPak... 3 Reviewing Current and Historical Budget and Actual Information... 4 Creating Your FY1718 Budget...
INVESTOR360 : ADDITIONAL ASSETS
 INVESTOR360 : ADDITIONAL ASSETS The Additional Assets section displays a list of outside assets associated with the account, such as bank accounts, loans, and credit cards, as well as assets manually entered
Financial Edge (FE) Instructions
 Instructions") Financial Edge (FE) Instructions Welcome to the CU Foundation s accounting system! Please report any issues or make suggestions to accounting@cufund.org. Step 1: Password Set up and Change at the Manage
Financial Edge (FE) Instructions Welcome to the CU Foundation s accounting system! Please report any issues or make suggestions to accounting@cufund.org. Step 1: Password Set up and Change at the Manage
Policy. Chapter 6. Accessing the Policy. Nexsure Training Manual - CRM. In This Chapter
 Nexsure Training Manual - CRM Policy In This Chapter Accessing the Policy Adding a Thank You Letter Editing the Policy Adding, Editing and Removing Assignments Admitted Carrier Identification Summary of
Construction Budget Application Using Procorem
 Construction Budget Application Using Procorem User Guide Updated: August 2, 2018 Trademarked names may appear throughout this document. Rather than list the names and entities that own the trademark or
Atradius Atrium. July version 3.0. Atradius Atrium. User manual. Atradius Atrium - User Manual Version 3.0
 July 2018 - version 3.0 User manual 1 - User Manual Version 3.0 Drive your business forward with powerful, easy-to-use credit management tools is the Atradius online platform, which offers you one place
Learning TradeStation. News, Time & Sales, Research, Browser, and Ticker Bar
 Learning TradeStation News, Time & Sales, Research, Browser, and Ticker Bar Important Information No offer or solicitation to buy or sell securities, securities derivative or futures products of any kind,
Using the CTELL Portfolio
 Using the CTELL Portfolio This document is intended to provide users of the CTELL cases an overview of how to use the portfolio. The information is organized in the following categories: Accessing the
BudgetPak User Guide. Lewis & Clark College. October 2016
 BudgetPak User Guide Lewis & Clark College October 2016 Contents Overview... 2 Definitions and Set Up... 2 Logging In to BudgetPak... 3 Reviewing Current and Historical Budget and Actual Information...
Budgetary Reporting System For Executive Users
 Budgetary Reporting System For Executive Users ProClarity Web Reporting Training Guide Version 3.2 4/23/2012 BOARD OF REGENTS UNIVERSITY SYSTEM OF GEORGIA Office of Fiscal Affairs 270 Washington Street,
Synaptic Analyser USER GUIDE
 Synaptic Analyser USER GUIDE Version 1.0 October 2017 2 Contents 1 Introduction... 3 2 Logging in to Synaptic Analyser... 3 3 Client Screen... 5 3.1 Client Details... 6 3.2 Holdings... 6 3.3 Income Sources...
Frequently Asked Questions for Members
 Frequently Asked Questions for Members m y i n s i g h t p e r s o n a l f i n a n c i a l m a n a g e m e n t t o o l GENERAL What is MyInsight? MyInsight is an intuitive online money management tool
FMS View Expense Budget Information
 FMS View Expense Budget Information Budget Information Queries To view your operating expense budget (Fund 110) in the Financial Management System (FMS), you create a budget query with specific criteria;
Business Intelligence (BI) Budget Reports Training Manual
 Budget Reports Training Manual") Business Intelligence (BI) Budget Reports Training Manual Topic Page Initial Setup 2 BI Login 3 Running BI Reports 4 Personalization 5 Understanding Report Content 7 Basic Navigation / Toolbar Legend 13
Business Intelligence (BI) Budget Reports Training Manual Topic Page Initial Setup 2 BI Login 3 Running BI Reports 4 Personalization 5 Understanding Report Content 7 Basic Navigation / Toolbar Legend 13
Dashboard. Dashboard Page
 Website User Guide This guide is intended to assist you with the basic functionality of the Journey Retirement Plan Services website. If you require additional assistance, please contact our office at
To Enable Access to Encompass LO Connect: 1. On the Encompass menu bar, click Encompass, and then click Settings.
 Using Encompass Loan Officer Connect Encompass Loan Officer (LO) Connect is an extension of Encompass that provides loan originators with quick, secure access to loan files. Encompass LO Connect enables
Money Management FAQs
 Page 1 Money Management FAQs What is Money Management? Money Management is a PFM, Personal Financial Management tool, that helps you budget and manage your finances. It allows you to import all of your
State Analytical Reporting System (STARS)
") Table of Contents Financial Analytics Dashboards and Reports... 3 CASH FLOW:... 4 TRIAL BALANCE REVIEW... 5 Budgetary Control Analytics Dashboard and Reports... 7 BUDGETARY CONTROLS... 8 FUNDS ANALYSIS...
Table of Contents Financial Analytics Dashboards and Reports... 3 CASH FLOW:... 4 TRIAL BALANCE REVIEW... 5 Budgetary Control Analytics Dashboard and Reports... 7 BUDGETARY CONTROLS... 8 FUNDS ANALYSIS...
Money Management (MX) Frequently Asked Question s
 Frequently Asked Question s") Money Management (MX) Frequently Asked Question s Account Maintenance How do I get rid of duplicate accounts? How do I permanently delete an account? How do I hide/exclude an account? How do I rename my
Money Management (MX) Frequently Asked Question s Account Maintenance How do I get rid of duplicate accounts? How do I permanently delete an account? How do I hide/exclude an account? How do I rename my
WinTen² Budget Management
 Budget Management Preliminary User Manual User Manual Edition: 4/13/2005 Your inside track for making your job easier! Tenmast Software 132 Venture Court, Suite 1 Lexington, KY 40511 www.tenmast.com Support:
Reports in NUPlans Web
 Reports in Web In Web, budgeters can find budget preparation reports that facilitate an analysis and review of budgets. While Contributor views are limited to the Budget Grouping level, the reports in
Principia Research Mode Online Basics Training Manual
 Principia Research Mode Online Basics Training Manual Welcome to Principia Research Mode Basics Course, designed to give you an overview of Principia's Research Mode capabilities. The goal of this guide
Radian Mortgage Insurance
 LOS Interface Administrator/User Guide Radian Mortgage Insurance 2012 PCLender, LLC Contents Introduction... 3 Interface Features... 3 Interface Requirements... 3 Interface Considerations... 4 How Does
Tutorial. Morningstar DirectSM. Quick Start Guide
 April 2008 Software Tutorial Morningstar DirectSM Quick Start Guide Table of Contents Quick Start Guide Getting Started with Morningstar Direct Defining an Investment Lineup or Watch List Generating a
Any symbols displayed within these pages are for illustrative purposes only, and are not intended to portray any recommendation.
 PortfolioAnalyst Users' Guide October 2017 2017 Interactive Brokers LLC. All Rights Reserved Any symbols displayed within these pages are for illustrative purposes only, and are not intended to portray
Client Software Feature Guide
 RIT User Guide Build 1.01 Client Software Feature Guide Introduction Welcome to the Rotman Interactive Trader 2.0 (RIT 2.0). This document assumes that you have installed the Rotman Interactive Trader
Certifying Mortgages for Freddie Mac. User Guide
 Certifying Mortgages for Freddie Mac User Guide December 2017 The Freddie Mac Single-Family Seller/Servicer (Guide) requires a Seller/Servicer selling Mortgages to Freddie Mac to forward the Notes, assignments
Global Liquidity Fund service user guide
 Global Liquidity Fund service user guide Contents Page 1 Welcome 1 2 Using the Global Liquidity Fund service for the first time 2 3 Account maintenance 4 4 Investment Reports 7 5 Create New Investment
AudaDashboard Quick Start Guide
 AudaDashboard Quick Start Guide G E T T I N G S T A R T E D A N D U N D E R S T A N D I N G M E T R I C S OVERVIEW AudaDashboard is a Repairer / Bodyshop management information tool that provides an at-a
Access and User Management
 Date published: 25.06.2018 Estimated reading time: 30 minutes Authors: Editorial Team The bookmarks and navigation in this tutorial are optimized for Adobe Reader. Access and User Management 1. Introduction
Budget Status by Account. SSB Training: SSB Basic Querying Tools. Logging in to Self Service Banner (SSB)
") Logging in to Self Service Banner (SSB) SSB is accessed through the CSM web portal Trailhead. To login, follow these steps: 1. Go to http://trailhead.mines.edu 2. Enter your login information 3. Click
Logging in to Self Service Banner (SSB) SSB is accessed through the CSM web portal Trailhead. To login, follow these steps: 1. Go to http://trailhead.mines.edu 2. Enter your login information 3. Click
Lender Connect Collaboration
 Lender Connect Collaboration When working in files that were originated via RealEC/Closing Insight, the Lender will send over a Closing product with Event Code 431 - Closing Instructions. Below provides
Collaborative Planning Principal Investigator
 Document review management Collaborative Planning Principal Investigator user guide Created by Optimum Technology Transfer Ltd www.optimum.co.uk Version: [****] Copyright notice Optimum Technology Transfer
Gtrade manual version 2.04 updated
 Gtrade manual version 2.04 updated 9.30.2016 Table of Contents Contents Table of Contents2 Getting started, Logging in and setting display language in TurboTick Pro3 Level 25 Order Entry8 Streamlined Order
Public Financial Management Database Users' Guide
 Public Financial Management Database Users' Guide FEBRUARY 2015 CONTENTS Executive summary.............................................1 The public financial management database...........................2
Clearing Admin. Broker Permissioning User Guide
 Clearing Admin Broker Permissioning User Guide This material may not be reproduced or redistributed in whole or in part without the express, prior written consent of IntercontinentalExchange, Inc. Copyright
Longview for Budget Planning Quick Reference Guide
 Longview for Budget Planning Quick Reference Guide How to perform essential tasks in LBP November 12, 2018 Version 8.4 Table of Contents REFERENCE GUIDE UPDATES... 4 LONGVIEW FOR BUDGET PLANNING (LBP)
OMNILIFE USER GUIDE 1.0 QUOTE... 2
 OMNILIFE USER GUIDE 1.0 QUOTE... 2 1.1 QUOTE SETTINGS... 2 1.2 PREMIUMS... 2 1.3 SPLIT PREMIUM FERQUENCIES... 3 1.4 ACTIONS DROPDOWN... 3 1.5 GRAPHS... 4 1.6 ACCIDENT ONLY... 6 1.7 SUPERLINK / FLEXILINK...
Insurer User Manual Chapter 4: Insurer Home Page
 Insurer User Manual Chapter 4: Insurer Home Page 2018 HCAI Communications Table of Contents Navigating the Insurer Page... 2 Primary Navigation Bar... 3 Dashboard... 3 Plans and Invoices... 4 Claims...
Collaborative Planning Management Reporting
 Document review management Collaborative Planning Management Reporting user guide Created by Optimum Technology Transfer Ltd www.optimum.co.uk Version: [****] Copyright notice Optimum Technology Transfer
FMS Account Summary Inquiry View Budget Information
 FMS Account Summary Inquiry View Budget Information Account Summary Inquiry The Account Summary Inquiry (ASI) in our Financial Management System (FMS) displays budget, expenditure, encumbrance, and available
IPO VITAL SIGNS. Participant Training Guide
 IPO VITAL SIGNS http://ipovitalsigns.com February, 2008 Table of Contents Introduction...2 Course Objectives...2 IPO Vital Signs Login...3 Search IPO Vital Signs...4 Using the IPO Process for Law Firms
Guide to working with Smart Pension via pensionsync
 Guide to working with Smart Pension via pensionsync Contents Open an account with Smart Pension... 2 How to apply for a new pension scheme with Smart Pension... 2 Can I apply for a pension scheme with
Manual Asset Based Finance Manager
 Deutsche Bank Global Transaction Banking Manual Asset Based Finance Manager January 2018 Table of Contents 1. Working with Deutsche Bank Asset Based Finance Manager (ABF Manager) 03 2. Before you start
How to Manage THD Budgets. Step One Create New Project Budget
 Version 1.0 How To: Manage THD Budgets: - Create New Project Budget - How would I create subsequent budgets? - Create Report to Compare Budgets - How is the Budget Versions Comparison Report Printed? How
SBA 7(a) Lender Portal Overview
 Lender Portal Overview") SBA 7(a) Lender Portal Overview May 2017 Prepared by: SBA s Office of Credit Risk Management (OCRM) (in Partnership with) LLMS contract GS00F022DA Table of Contents Overview Log-in to the SBA Lender Portal
SBA 7(a) Lender Portal Overview May 2017 Prepared by: SBA s Office of Credit Risk Management (OCRM) (in Partnership with) LLMS contract GS00F022DA Table of Contents Overview Log-in to the SBA Lender Portal
PROFITstar November PROFITstar Budget Manager Reference Guide. Hosted Version
 Table of Contents Welcome to Budget Manager... 1 Budget Administrators... 2 Prerequisites for Completing a Budget... 2 Exporting Data... 2 User Setup and Permissions... 4 Fixed Asset Setup...10 Open Budget
Bank Reconciliation Processing SYSTEM ADMINISTRATION AND PROCESSING GUIDE. Last revised: 8/19/10 12:22 PM
 Bank Reconciliation Processing SYSTEM ADMINISTRATION AND PROCESSING GUIDE Last revised: 8/19/10 12:22 PM New World Systems 1 CONTENTS Contents... 1 Introduction... 3 System Administrator Guide... 4 Company
BEx Analyzer (Business Explorer Analyzer)
") BEx Analyzer (Business Explorer Analyzer) Purpose These instructions describe how to use the BEx Analyzer, which is utilized during budget development by account managers, deans, directors, vice presidents,
BEx Analyzer (Business Explorer Analyzer) Purpose These instructions describe how to use the BEx Analyzer, which is utilized during budget development by account managers, deans, directors, vice presidents,
Seller Procedures Delegated. Seller Portal
 Seller Procedures Delegated 1 Seller Portal Summary 2 Introduction to the Seller Portal (EZCLD.LHFS.com) and review of the Loan Submission phases. TOOLS AND FUNCTIONALITY LeftNav Menu Loan Actions Menu
BudgetPak Getting Started Guide for Users
 BudgetPak Getting Started Guide for Users Overview This Getting Started Guide contains instructions for how to complete your FY2016 Budget. BudgetPak supports several levels of users. In your budget there
Guide to working with Aviva
 Retirement Investments Insurance Health Guide to working with Aviva via pensionsync Contents Open an account with Aviva 3 How to apply for a new pension scheme with Aviva 4 Can I apply for an Aviva scheme
SAP Business Intelligence (BI) Reporting Training
 Reporting Training") 2011 SAP Business Intelligence (BI) ing Training Created by the Budget Office Millersville University of PA 6/1/2011 Contact Information Please contact the following with any questions, for assistance
2011 SAP Business Intelligence (BI) ing Training Created by the Budget Office Millersville University of PA 6/1/2011 Contact Information Please contact the following with any questions, for assistance
UCAA Expansion Application Insurer User Guide December 2017
 UCAA Expansion Application Insurer User Guide December 2017 2017 National Association of Insurance Commissioners All rights reserved. Revised Edition National Association of Insurance Commissioners NAIC
Introduction to Client Online
 Introduction to Client Online Trade Finance Guide TradeFinanceNewClientsV2Sept15 Contents Introduction 3 Welcome to your introduction to Client Online 3 If you have any questions 3 Logging In 4 Welcome
Metatrader 4 (MT4) User Guide
 User Guide") Metatrader 4 (MT4) User Guide Installation Download the MetaTrader4 demo platform from the Tradesto website:- https://members.tradesto.com/tradestoco4setup.exe Launch the installation file the same way
Metatrader 4 (MT4) User Guide Installation Download the MetaTrader4 demo platform from the Tradesto website:- https://members.tradesto.com/tradestoco4setup.exe Launch the installation file the same way
Quality Control Advisor SM. User Guide. January 2018
 Quality Control Advisor SM User Guide January 2018 Notice The information in this document is intended to provide general guidance to Freddie Mac Seller/Servicers. The information is offered as an aid
Loan Quality Advisor User Guide
 Loan Quality Advisor User Guide December 2017 This document is not a replacement or substitute for the information found in the Single-Family Seller/Servicer Guide, and /or terms of your Master Agreement
Vivid Reports 2.0 Budget User Guide
 B R I S C O E S O L U T I O N S Vivid Reports 2.0 Budget User Guide Briscoe Solutions Inc PO BOX 2003 Station Main Winnipeg, MB R3C 3R3 Phone 204.975.9409 Toll Free 1.866.484.8778 Copyright 2009-2014 Briscoe
This document will provide a step-by-step tutorial of the RIT 2.0 Client interface using the Liability Trading 3 Case.
 RIT User Guide Client Software Feature Guide Rotman School of Management Introduction Welcome to Rotman Interactive Trader 2.0 (RIT 2.0). This document assumes that you have installed the Rotman Interactive
MOBILE (iphone/ipad)
") MOBILE (iphone/ipad) USER GUIDE www.fxbtrading.com 1 CONTENTS Download and installation...3 Quotes...5 Chart...8 Trade...9 Type of orders...10 Setting Stop Loss & Take Profit (Modify order)...12 History...14
MOBILE (iphone/ipad) USER GUIDE www.fxbtrading.com 1 CONTENTS Download and installation...3 Quotes...5 Chart...8 Trade...9 Type of orders...10 Setting Stop Loss & Take Profit (Modify order)...12 History...14
Gettin Ready for Hyperion
 Gettin Ready for Hyperion Presented by: Jay Chapman, M.A., University Budget Analyst July 11, 2014 Objective Become familiar with the different types of budgets and funding sources. Understand the chart
Middlebury s Planning
 and Budgeting Cloud Services (PBCS): Middlebury s Planning Last update: 1/19/2016, Version 4 Table of Contents Introduction to Planning:... 3 Middlebury's Planning: Logging-In.. 5 Planning Administration:..7
UDW+ Grants Management Dashboard Quick Start Guide. Program Services Office & Decision Support Group. Version 1.4
 UDW+ Grants Management Dashboard Quick Start Guide Version 1.4 Program Services Office & Decision Support Group 1 Accessing UDW+ Login to UDW+ using your Net ID as the user name, and NYUHome password Navigate
Using REEFS Payments and Escrow Functions
 16-Nov-2017 C A Y M A N I S L A N D S MONETARY AUTHORITY Using REEFS Payments and Escrow Functions 16-Nov-2017 Page 2 of 14 Contents 1 Summary... 3 2 User Roles for accessing the features... 3 3 Payments
Online access to your pension account 24/7
 Online access to your pension account 24/7 The following is a list of features that you will find as you work your way through the portal: Current account balance Investment profile changes Account balance
MSU Report User Guide
 MSU Report User Guide 2/12/2015 Contents 1. Adaptive Insights... 2 2. Browsers... 2 3. Nomenclature... 2 4. Logging into Adaptive Insights... 3 5. New Report Navigation... 3 6. Viewing Reports... 5 7.
Guide to working with NEST via pensionsync
 Guide to working with NEST via pensionsync Contents Open an account with NEST... 1 How to apply for a new pension scheme with NEST... 2 Can I apply for a pension scheme with NEST directly?... 2 How do
Freddie Mac Servicing Success Program. Reference Guide. December 2017
 Freddie Mac Servicing Success Program Reference Guide December 2017 Notice The information in this publication is intended to provide general guidance to Freddie Mac Servicers. The information is offered
Hyperion Process Guide
 Hyperion Process Guide Information Management Client Support Services DCATS 210 567 7777 / Option 5 Hyperion Process Guide Version 1 Jan 2013 Table of Contents What is Hyperion?... 3 System Compatibility...
Quick Reference Guide. Employer Health and Safety Planning Tool Kit
 Operating a WorkSafeBC Vehicle Quick Reference Guide Employer Health and Safety Planning Tool Kit Effective date: June 08 Table of Contents Employer Health and Safety Planning Tool Kit...5 Introduction...5
Fannie Mae Connect Release Notification
 Fannie Mae Connect Release Notification June 26, 2017 During the weekend of June 24, 2017, Fannie Mae will implement Fannie Mae Connect Version 7.0, which will provide a new, easy-to-use design and layout.
Employer Portal epayment User Guide
 Employer Portal epayment User Guide Table of Contents Introduction to epayment... 3 Access the epayment Site... 3 Navigate the epayment Site... 4 Account Summary... 5 Outstanding Invoices... 5 Scheduled
PHILLIP FUTURES PTA. POEMS Installation and Quick Start User Guideline
 PHILLIP FUTURES PTA POEMS 1.8.3 Installation and Quick Start User Guideline NOTICE The best effort has been put in to ensure that the information given in this POEMS Professional 1.8.3 Quick Start User
FINANCIAL PROJECTION TOOL (FPT)
") FINANCIAL PROJECTION TOOL (FPT) User Guide IMSS Created: 9 May 2013 Updated: 11 June 2013 Version: 1 TABLE OF CONTENTS Financial Projection Tool (FPT) Overview... 4 What Data Is Used?... 4 What Makes a
FINANCIAL PROJECTION TOOL (FPT) User Guide IMSS Created: 9 May 2013 Updated: 11 June 2013 Version: 1 TABLE OF CONTENTS Financial Projection Tool (FPT) Overview... 4 What Data Is Used?... 4 What Makes a
I added my Checking and Savings accounts from another financial institution. Why didn t my loans and other accounts import as well?
 What is MoneyDesktop? MoneyDesktop is a PFM, Personal Financial Management tool, that helps you budget and manage your finances. It allows you to import all of your accounts, across multiple institutions,
Rudd and Wisdom Web-Based Benefit Estimator
 Rudd and Wisdom Web-Based Benefit Estimator Our secure Web-Based Benefit Estimator provides fast and easy access to pension benefit information from any location with an internet connection. Rudd and Wisdom,
User Guide to the Budget Process
 User Guide to the Budget Process 2/22/2018 Contents 1. Adaptive Insights... 2 2. Browsers... 2 3. Nomenclature... 2 4. User Security - Roles and Levels... 2 5. Logging into Adaptive Insights... 3 6. Budget
1. Overview of the Trade Terminal Opening the Trade Terminal Components of the Trade Terminal Market watch
 USER MANUALS Trade Terminal Tick Chart Trader Stealth Orders Smart Lines Session Map Sentiment Trader Renko Bar Indicator Order History Indicator Mini Terminal Market Manager High-Low Indicator Freehand
DALHOUSIE UNIVERSITY FINANCIAL SERVICES
 DALHOUSIE UNIVERSITY FINANCIAL SERVICES Table of Contents Overview... 3 Web Address... 3 Parameters for Budget Queries... 9 Budget Status by Account... 10 Creating a Query by Account... 11 Budget Query
Seller Procedures Non-Delegated. Seller Portal
 Seller Procedures Non-Delegated 1 Seller Portal Summary 2 Introduction to the Seller Portal (EZCLD.LHFS.com) and review of the Loan Submission phases. TOOLS AND FUNCTIONALITY LeftNav Menu Loan Actions
Using REEFS Payments and Escrow Functions
 25-Jun-2018 C A Y M A N I S L A N D S MONETARY AUTHORITY Using REEFS Payments and Escrow Functions 25-Jun-2018 Page 2 of 16 Contents 1 Summary... 3 2 User Roles for accessing the features... 3 3 Payments
My Benefits: Standard Enrollment HELP MENU MANUAL
 My Benefits: Standard Enrollment HELP MENU MANUAL TABLE OF CONTENTS Page Numbers Access Employee Self-Service... 2 Enroll in Benefits... 3 Additional Information... 8 Add Qualifying Event... 8 Add Dependents
Quick Topic - Project Management Reference Guide
 Quick Topic - Project Management Reference Guide Title: Project Management Reference Guide Brief description: The purpose of this document is to act as a reference for the most common project management
Trading Diary Manual. Introduction
 Trading Diary Manual Introduction Welcome, and congratulations! You ve made a wise choice by purchasing this software, and if you commit to using it regularly and consistently you will not be able but
MFG110 - Trader Manual ComTrader
 MFG110 - Trader Manual ComTrader ComTrader 2.7 Deutsche Börse AG Mailing Address Mergenthalerallee 61 65760 Eschborn Web www.deutsche-boerse.com Chairman of the Supervisory Board Dr. Joachim Faber Version
UNIVERSITY OF GHANA OFFICE OF RESEARCH, INNOVATION AND DEVELOPMENT (ORID) Grant Application Guide
 Grant Application Guide") UNIVERSITY OF GHANA OFFICE OF RESEARCH, INNOVATION AND DEVELOPMENT (ORID) Grant Application Guide Step 1: Login Process 1. Visit the UG-Research Management Application Portal (UG-ReMAP) to initiate your
UNIVERSITY OF GHANA OFFICE OF RESEARCH, INNOVATION AND DEVELOPMENT (ORID) Grant Application Guide Step 1: Login Process 1. Visit the UG-Research Management Application Portal (UG-ReMAP) to initiate your
Inside... Your Pension Plan Web Site USER GUIDE. Your gateway to sound retirement planning
 Your gateway to sound retirement planning Inside... How to access the site Your password Browse safely How to use the Pension Projection tool What s in it for you Your Pension Plan Web Site USER GUIDE
User guide. Experian Access SM. Prescreen suite iscreen SM
 Experian Access SM Prescreen suite iscreen SM 2017 Experian Information Solutions, Inc. All rights reserved. Title and copyright in this document at all times belong to Experian. It shall be strictly confidential
Standard Accounts User Guide
 Standard Accounts User Guide v. 8.1, Windows February 2016 Table of Contents Table of Contents INTRODUCTION... 4 Installation and Starting of Standard Accounts... 4 Starting Standard Accounts for the first
Leveraged Online User Guide
 Leveraged Online User Guide Overview This brochure is a tool to help navigate you through the Online Service. Leverage Online is a secure Online Service that allows you to: monitor your loan facilities
Introduction to Client Online
 Introduction to Client Online Bibby Factors International Guide 1 InternationalFactoringNewClientBibbyUKopsSept15 Introduction 3 Logging In 5 Welcome Screen 6 Navigation 7 Viewing Your Account 9 Invoice