HELP! I m an Accidental Government Information Librarian
|
|
|
- Evan McKenzie
- 5 years ago
- Views:
Transcription

1 HELP! I m an Accidental Government Information Librarian Economic Indicators Mary G. Scanlon Brought to you by NCLA Government Resources Section
2 Economic indicators For each indicator: Definition Users & Uses Sources
3 Economic Indicators National Economy Financial Environment Commercial Environment Consumer or Household Environment
4 Economic Indicators National Economy Financial Environment Commercial Environment Consumer or Household Environment
5 National Economy Gross Domestic Product Inflation Employment & Unemployment
6 National Economy Gross Domestic Product (GDP) The value of all finished goods and services produced within a geographic area for a specified period of time. The % change over the prior period and trend are perhaps more important than the absolute number.
7 GDP Data is reported at multiple levels: National State MSA For various intervals: Annual Quarterly Monthly
8 GDP Domestic Sources: Bureau of Economic Analysis FRED: Federal Reserve Bank of St. Louis International Source: World Bank

9 GDP Sources: BEA
10 GDP Sources: BEA Table Gross Domestic Product [Billions of dollars] Seasonally adjusted at annual rates Bureau of Economic Analysis Last Revised on: February 28, Next Release Date March 28, 2013 Line I II III IV I II III IV 1 Gross domestic product 14, , , , , , , , Personal consumption exp. 10, , , , , , , , Goods 3, , , , , , , , Durable goods 1, , , , , , , , Nondurable goods 2, , , , , , , , Services 7, , , , , , , ,411.6
11 Brief Tangent The Federal Reserve Bank: our nation s Central Bank Has 12 district banks The Federal Reserve Bank of St. Louis FRED, ALFRED, CASSIDI, other databases Data, working papers, failed banks since 2007, TARP funds, and much more Free Interactive charts Download data into Excel

12 GDP Sources: FRED

13 GDP, % Change by State
14 GDP Sources: World Bank Free 331 economic and social indicators 214 countries Date range: from 1960 to 2011 Languages: Spanish, French, Arabic and Chinese Data by topic by country Download into Excel
15 GDP Sources: World Bank
16 Questions? GDP
17 Inflation Consumer Price Index (CPI) Producer Price Index (PPI)
18 Consumer Price Index (CPI) A measure of the average change over time in the prices paid by urban consumers for a market basket of consumer goods and services. (BLS.gov) It s an index: the years = 100 Price changes are indexed against those price levels.
19 CPI Categories Food & beverage Housing Apparel Transportation Medical Care Recreation Recreation Education & communication Other goods & services Commodity & services groups Special Indexes

20 CPI Sources: FRED
21 Producer Price Index (PPI) The Producer Price Index (PPI) program measures the average change over time in the selling prices received by domestic producers for their output (BLS.gov). Reported by the Bureau of Labor Statistics Producer Price Indexes at the BLS: bls.gov/ppi
22 Producer Price Index (PPI) A leading indicator for consumer inflation Reported for 18 categories, such as Finished goods Intermediate materials Industrial commodities Crude energy materials Fuels & related products Indexed, 1982 = 100
23 PPI Sources Bureau of Labor Statistics FRED
24 National Economy Employment Unemployment
25 Employment The BLS programs provide national totals of the number of employed people and also provide statistics on subjects such as: Occupational employment and wages Labor demand and turnover The dynamic state of the labor market Source: BLS Current Employment Statistics
26 Total Nonfarm Employment, Monthly, Employment, Hours, and Earnings from the Current Employment Statistics survey (National) Original Data Value Series Id: CES Seasonally Adjusted Super Sector: Total nonfarm Industry: Total nonfarm NAICS Code: - Data Type: ALL EMPLOYEES, THOUSANDS Years: 2003 to 2013 Year Jan Feb Mar Apr May Jun Jul Aug Sep Oct Nov Dec Annual , , , , , , , , , , , ,353 1,561, , , , , , , , , , , , ,372 1,577, , , , , , , , , , , , ,856 1,604, , , , , , , , , , , , ,927 1,633, , , , , , , , , , , , ,042 1,651, , , , , , , , , , , , ,425 1,642, , , , , , , , , , , , ,373 1,570, , , , , , , , , , , , ,395 1,558, , , , , , , , , , , , ,498 1,577, , , , , , , , , , , , ,691 1,604, , ,046

27 Total Nonfarm Employment (thousands)
28 Unemployment Persons are classified as unemployed if they do not have a job, have actively looked for work in the prior 4 weeks, and are currently available for work. Persons who were not working and were waiting to be recalled to a job from which they had been temporarily laid off are also included as unemployed. Receiving benefits from the Unemployment Insurance (UI) program has no bearing on whether a person is classified as unemployed. Source: BLS.gov/cps The unemployment rate represents the number unemployed as a percent of the labor force. Unemployment Rate in February 2013: 7.7%
29 Unemployment Sources Sources: Bureau of Labor Statistics FRED
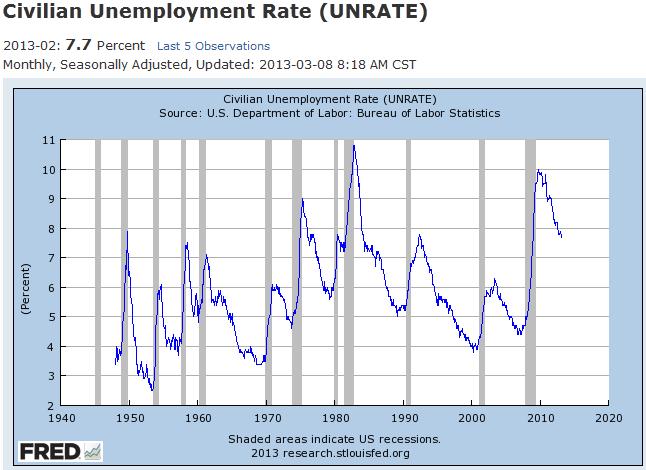
30 Unemployment Rate
31 National Economy We looked at indicators for: GDP Inflation Employment and unemployment Best sources: BEA: Bureau of Economic Analysis BLS: Bureal of Labor Statistics Fred: Federal Reserve Bank of St. Louis World Bank
32 Before we look at indicators of the financial environment are there any questions? National Economy
33 Financial Environment National Debt Balance Debt service Stock market Closing prices and trends
34 National Debt The term national debt refers to direct liabilities of the United States Government. There are several different concepts of debt that are at various times used to refer to the national debt. Public debt is the most significant form of debt. It exists as U. S. Treasury securities [which] primarily consist of marketable Treasury securities (i.e., bills, notes and bonds), savings bonds and special securities issued to state and local governments. Source: U. S. Treasury
35 National Debt On March 25, 2003, debt held by the public was $11,895,649,154,059.06
36 National Debt On March 25, 2003, debt held by the public was $11,895,649,154, TreasuryDirect provides a tool that lets the user look up the amount of public debt on a particular date or date range.
37 National Debt Terminology Components of debt: Principal: national debt Interest: debt service

38 National Debt Source: FRED

39 National Interest Payments Source: FRED
40 Stock Exchanges, U.S. New York Stock Exchange (NYSE) NASDAQ
41 NYSE Indices: DJ Industrials S&P 500
42 S&P 500 Sources NYSE.com Finance.Yahoo.com WSJ.com NYTimes.com

43 S&P 500 Sources

44 NASDAQ Source: Yahoo! Finance
45 Economic Indicators Thank you for joining us Questions? Mary Scanlon
46 Session Evaluation Please fill out our survey and let us know what you think!
47 Upcoming Accidental Librarian Webinars April 22: Our 25 th Webinar! Come Celebrate the Census with Bryna Coonin May: Basic Legal Resources Summer: Congressional research, Patents Part 2, and more Brought to you by the North Carolina Library Association s Government Resources Section. Join us!
North Carolina s June Employment Figures Released
 For Immediate Release: July 20, For More Information, Contact: Beth Gargan/919.814.4610 North Carolina s Employment Figures Released RALEIGH The state s seasonally adjusted unemployment rate was 4.2 percent,
North Carolina s April Employment Figures Released
 For Immediate Release: May 18, For More Information, Contact: Beth Gargan/919.814.4610 North Carolina s April Employment Figures Released RALEIGH The state s seasonally adjusted April unemployment rate
North Carolina s January Employment Figures Released
 For Immediate Release: March 13, For More Information, Contact: Beth Gargan/919.814.4610 North Carolina s January Employment Figures Released RALEIGH The state s seasonally adjusted January unemployment
Economic Indicators For Manufacturing Executives
 Economic Indicators For Manufacturing Executives Valuable Data for a Complex World Presented by: Cliff Waldman Chief Economist, MAPI Foundation cwaldman@mapi.net Today s Presentation The Value of Economic
Revised October 17, 2016
 Revised October 17, 2016 60 ISM Manufacturing Purchasing Managers Index (September 2015 September 2016) 58 56 54 52 50 48 46 44 42 Sept-15 Oct Nov Dec Jan-16 Feb Mar Apr May Jun Jul Aug Sept Purchasing
James K. Polk United States President ( ) Mecklenburg County NC
 Mecklenburg County NC") february 2006 James K. Polk United States President (1845-1849) Mecklenburg County NC http://www.whitehouse.gov/history/presidents/jp11.html January Highlights The Unemployment Rate (Seasonally Adjusted)
february 2006 James K. Polk United States President (1845-1849) Mecklenburg County NC http://www.whitehouse.gov/history/presidents/jp11.html January Highlights The Unemployment Rate (Seasonally Adjusted)
With the tax filing season in full swing, these summary
 NationalEconomicTrends March Income Taxes: Who Pays and How Much? With the tax filing season in full swing, these summary figures may provide some perspective on the issue of who is paying federal individual
North Carolina s June Employment Figures Released
 For Immediate Release: July 22, For More Information, Contact: Kim Genardo/919.814.4610 North Carolina s Employment Figures Released RALEIGH The state s seasonally adjusted unemployment rate was 4.9 percent,
On October 4, 2006, President Bush signed the
 NationalEconomicTrends December Political Economy of State Homeland Security Grants On October,, President Bush signed the Department of Homeland Security (DHS) Appro pri - ations Act for fiscal year 7
The Federal Reserve has set the target range for the federal
 NationalEconomicTrends October Monetary Policy Stance: The View from Consumption Spending The Federal Reserve has set the target range for the federal funds at to 5 percent and intends to keep this near
The chorus from Travis s 1947 song about the
 NationalEconomicTrends December 7 What Do You Get for Sixteen Tons? You load sixteen tons, and what do you get? Another day older and deeper in debt Merle Travis The chorus from Travis s 197 song about
Individual households and firms, as well as local, state,
 NationalEconomicTrends February 9 How Accu Are Forecasts in a Recession? Individual households and firms, as well as local, state, and federal governments, make economic decisions based on their view of
House prices in the United States were 14.1 percent
 NationalEconomicTrends August How Much Have US House Prices Fallen? House prices in the United States were 11 percent lower in the first quarter of than they were a year earlier, according to a widely
In 2010, the first of the Baby Boom generation will
 NationalEconomicTrends September 7 Can Social Security Survive the Baby Boomers? In 1, the first of the Baby Boom generation will reach age Many will choose to begin what they hope will be a long and financially
Indicators of the Kansas Economy
 Governor s Council of Economic Advisors Indicators of the Kansas Economy A Review of Economic Trends and the Kansas Economy 1000 S.W. Jackson St. Suite 100 Topeka, KS 66612-1354 Phone: (785) 296-0967 Fax:
There has been considerable discussion of the possibility
 NationalEconomicTrends February Housing and the R Word There has been considerable discussion of the possibility that ongoing troubles in the housing market could push the economy into recession 1 But
Sharp declines in home prices, followed by a financial
 NationalEconomicTrends April Household Retrenchment Sharp declines in home prices, followed by a financial crisis and a steep recession, rattled US households in Economic misfortunes have caused many to
The relatively slow growth of employment has
 NationalEconomicTrends August Please go to researchstlouisfedorg/publications/net for important information about your subscription Labor s Share The relatively slow growth of employment has been a prominent
NationalEconomicTrends
 NationalEconomicTrends August 1999 Historical CPI Inflation Under Current Calculation Methods During the 1990s, a much-discussed topic among policymakers and in financial markets has been the possibility
NationalEconomicTrends
 NationalEconomicTrends August 001 The Switch to NAICS Measuring economic activity when the composition and quality of goods and services being produced is rapidly changing presents a perpetual challenge.
Single-family home sales and construction are not expected to regain 2005 peaks
 Single-family home sales and construction are not expected to regain 25 peaks Millions of units 8. 7. 6. 5. Housing starts (right axis) 4. Home sales (left axis) 3. 2. 1. 198 1985 199 1995 2 25 21 215
In the past three decades, the share of foreign-born
 NationalEconomicTrends June New Views on Immigration In the past three decades, the share of foreign-born workers in US total employment has increased markedly, from percent in 197 to 1 percent in Among
Common stock prices 1. New York Stock Exchange indexes (Dec. 31,1965=50)2. Transportation. Utility 3. Finance
2. Transportation. Utility 3. Finance") Digitized for FRASER http://fraser.stlouisfed.org/ Federal Reserve Bank of St. Louis 000 97 98 99 I90 9 9 9 9 9 9 97 98 99 970 97 97 ""..".'..'.."... 97 97 97 97 977 978 979 980 98 98 98 98 98 98 987 988
Digitized for FRASER http://fraser.stlouisfed.org/ Federal Reserve Bank of St. Louis 000 97 98 99 I90 9 9 9 9 9 9 97 98 99 970 97 97 ""..".'..'.."... 97 97 97 97 977 978 979 980 98 98 98 98 98 98 987 988
Current Employment Statistics
 Current Employment Statistics October 2017 If you have any questions or seek additional information, please contact: Vermont Department of Labor Economic and Labor Market Information Division 802-828-4202
Current Employment Statistics
 Current Employment Statistics December 2017 If you have any questions or seek additional information, please contact: Vermont Department of Labor Economic and Labor Market Information Division 802-828-4202
Key West Cruise Ship Data - Passenger Counts Number of Passenger Arrivals
 Key West Cruise Ship Data - Passenger Counts Number of Passenger Arrivals (Source: City of Key West Port Operations Office) Month 2000 2001 2002 2003 2004 2005 2006 2007 2008 2009 2010 2011 2012 2013 2014
Key Labor Market and Economic Metrics
 Key Labor Market and Economic Metrics May Update Incorporates Data Available on May 27 th, 2016 This reference is the result of a collaboration between the Bureau of Labor Market Information and Strategic
Since the financial crisis began in mid-2007, media
 NationalEconomicTrends August Commercial Bank Lending Data during the Crisis: Handle with Care Since the financial crisis began in mid-7, media sources and academics alike have scrutinized data from the
ctrends Nominal Vs. Real Wage Growth Growth of Wages Percent Change From Year Ago August 1997
 ctrends August 1997 Nominal Vs. Real Wage Growth Nominal wages, measured by nonfarm compensation per hour, grew at an average annual rate of 5.5 percent between 1947 and 1973 and 6 percent between 1973
Inflation Education. September Spear Street, Suite 950 San Francisco, CA Phone:
 Inflation Education September 2014 150 Spear Street, Suite 950 San Francisco, CA 94105 Phone: 866-627-6984 DISCLAIMER The charts in this presentation are for illustrative purposes only. Individual clients
NationalEconomicTrends
 NationalEconomicTrends January 00 Stag-nations Economic growth in the United States has slowed substantially since the days of rapid expansion during the mid to late 1990s. According to preliminary estimates,
PERSONAL INCOME AND OUTLAYS: APRIL Personal income increased $69.8 billion, or 0.4 percent, and disposable personal income (DPI)
") NEWS RELEASE EMBARGOED UNTIL RELEASE AT 8:30 A.M. EDT, TUESDAY, MAY 31, 2016 BEA 16-25 Technical: Kurt Kunze (301) 278-9087 (Personal Income) piniwd@bea.gov Kyle Brown (301) 278-9086 (Personal Consumption
NEWS RELEASE EMBARGOED UNTIL RELEASE AT 8:30 A.M. EDT, TUESDAY, MAY 31, 2016 BEA 16-25 Technical: Kurt Kunze (301) 278-9087 (Personal Income) piniwd@bea.gov Kyle Brown (301) 278-9086 (Personal Consumption
The U.S. economy has experienced sustained trend
 NationalEconomicTrends October Some Incomes Are Less Average than Others The US economy has experienced sustained trend growth of GDP and a decline in the volatility of macroeconomic variables since the
Many analysts have argued that a housing boom preceded
 NationalEconomicTrends September The Financial Services Sector: Boom and Recession Many analysts have argued that a housing boom preceded the recent financial crisis and economic slowdown Innovations in
NationalEconomicTrends
 NationalEconomicTrends January 000 The Economic Outlook for 000: Bulls on Parade? The heartening U.S. economic performance during the past four years has seemingly benefited everyone except those in the
EMBARGOED UNTIL RELEASE AT 8:30 A.M. EDT, FRIDAY, MAY 31, 2013 BEA 13-22
 NEWS RELEASE EMBARGOED UNTIL RELEASE AT 8:30 A.M. EDT, FRIDAY, MAY 31, 2013 BEA 13-22 James Rankin: (202) 606-5301 (Personal Income) piniwd@bea.gov Harvey Davis: (202) 606-5302 (Personal Consumption Expenditures)
NationalEconomicTrends
 NationalEconomicTrends October 001 Give Me Your Skilled. A previous issue of National Economic Trends (January 001) identified the role of immigration in sustaining the rate of U.S. population growth in
LABOR SITUATION Office of Research
 Sharon Palmer Commissioner LABOR SITUATION Office of Research FOR IMMEDIATE RELEASE May 2013 Data CT Unemployment Rate = 8.0% US Unemployment Rate = 7.6% Nonfarm jobs rise 1,000 in May but the unemployment
DEPARTMENT OF LABOR AND INDUSTRIAL RELATIONS HAWAII'S UNEMPLOYMENT RATE AT NEW RECORD 2.0 PERCENT IN NOVEMBER
 DEPARTMENT OF LABOR AND INDUSTRIAL RELATIONS FOR IMMEDIATE RELEASE December 21, 20 D A V I D Y. I G E G O V E R N O R L E O N A R D H O S H I J O A C T I N G D I R E C T O R HAWAII'S UNEMPLOYMENT RATE
DEPARTMENT OF LABOR AND INDUSTRIAL RELATIONS. HAWAII'S UNEMPLOYMENT RATE AT 2.2 PERCENT IN SEPTEMBER Jobs Increase 11,600 Over the Year
 DEPARTMENT OF LABOR AND INDUSTRIAL RELATIONS FOR IMMEDIATE RELEASE October, 20 DAVID Y. IGE GOVERNOR LEONARD HOSHIJO DIRECTOR HAWAII'S UNEMPLOYMENT RATE AT 2.2 PERCENT IN SEPTEMBER Jobs Increase 11,600
Employment Data (establishment)
") Table 1: Major Indicators of Labor Market Activity for New Jersey Seasonally Adjusted (thousands) Benchmark Labor Force Data (resident) Current Month Previous Month One Year Ago Net Change Net Change May
Table 1: Major Indicators of Labor Market Activity for New Jersey Seasonally Adjusted (thousands) Benchmark Labor Force Data (resident) Current Month Previous Month One Year Ago Net Change Net Change May
The National Bureau of Economic Research (NBER)
") NationalEconomicTrends July Using Stock Market Liquidity to Forecast Recessions The National Bureau of Economic Research (NBER) Business Cycle Dating Committee (the committee that dates U.S. recessions)
NationalEconomicTrends July Using Stock Market Liquidity to Forecast Recessions The National Bureau of Economic Research (NBER) Business Cycle Dating Committee (the committee that dates U.S. recessions)
The effect that housing has on the economy has received
 NationalEconomicTrends May Boom & Gloom in Housing Markets: The Sequel The effect that housing has on the economy has received increased attention in recent years first for the recordhigh boom in house
Nonfarm Payroll Employment
 PRESIDENT'S REPORT TO THE BOARD OF DIRECTORS, FEDERAL RESERVE BANK OF BOSTON Current Economic Developments - June 10, 2004 Data released since your last Directors' meeting show the economy continues to
REAL EARNINGS DECEMBER 2018
 Transmission of material in this release is embargoed until 8:30 a.m. (EST), Friday, January 11, 2019 USDL-19-0019 Technical Information: (202) 691-6555 cesinfo@bls.gov www.bls.gov/ces Media Contact: (202)
Metro Area Unemployment Rates All Decline; Las Vegas Accounts for the Bulk of the Job Growth Over the Month
 SEPTEMBER SUB-STATE PRESS RELEASE For Immediate Release October 23, 2018 Metro Area Unemployment Rates All Decline; Las Vegas Accounts for the Bulk of the Job Growth Over the Month CARSON CITY, NV According
CONTENTS COMMENTARY CHARTS TABLES GLOSSARY. Section 1: Headline Inflation Section 2: Core Inflation
 COMMENTARY CONTENTS Section 1: Headline Inflation Section 2: Core Inflation CHARTS 1. National Rates of Inflation, January 2010 April 2013 2. Monthly Changes in the Cost-of-Living Index, January 2010 April
REAL EARNINGS AUGUST 2018
 Transmission of material in this release is embargoed until 8:30 a.m. (EDT), Thursday, September 13, 2018 USDL-18-1454 Technical Information: (202) 691-6555 cesinfo@bls.gov www.bls.gov/ces Media Contact:
nc today october 2006 Photo courtesy of NC Division of Tourism, Film and Sports development. Linn Cove Viaduct, Blue Ridge Parkway, NC
 nc today october 2006 Photo courtesy of NC Division of Tourism, Film and Sports development. Linn Cove Viaduct, Blue Ridge Parkway, NC September Highlights North Carolina Unemployment Rate (Seasonally
Michigan s January Unemployment Rate Moves Up Seasonally
 Labor Market News Michigan s March 2016 Vol. 72, Issue No. 1 Percent Michigan s January Unemployment Rate Moves Up Seasonally Michigan s unemployment rate (not seasonally adjusted) increased by 0.6 of
REAL EARNINGS JUNE 2018
 Transmission of material in this release is embargoed until 8:30 a.m. (EDT), Thursday, July 12, 2018 USDL-18-1144 Technical Information: (202) 691-6555 cesinfo@bls.gov www.bls.gov/ces Media Contact: (202)
Unemployment Rate Edges Lower to 5.0 Percent Employment Down in December
 Media Contact 609-984-2841 EMAIL: MediaCalls@dol.state.nj.us Unemployment Rate Edges Lower to 5.0 Percent Employment Down in December TRENTON, January 18, 2018 Preliminary monthly estimates released by
The U.S. economy s remarkable resilience in the face
 NationalEconomicTrends May Please see page for important information about your subscription Entrepreneurship The US economy s remarkable resilience in the face of shocks arguably owes to an array of institutions
Leading Economic Indicator Nebraska
 Nebraska Monthly Economic Indicators: December 20, 2017 Prepared by the UNL College of Business Administration, Bureau of Business Research Author: Dr. Eric Thompson Leading Economic Indicator...1 Coincident
Figure 1: Change in LEI-N August 2018
 Nebraska Monthly Economic Indicators: September 26, 2018 Prepared by the UNL College of Business, Bureau of Business Research Author: Dr. Eric Thompson Leading Economic Indicator...1 Coincident Economic
NATIONAL SUMMARY OF FIRST-TIME CLAIMANTS FOR UI
 2013 JAN 5 553,348 553,348 372,000 372,000 92,383,961 93,647,000 12 555,708 1,109,056 335,000 707,000 92,939,669 93,982,000 19 437,025 1,546,081 330,000 1,037,000 93,376,694 94,312,000 26 369,480 1,915,561
Recently the Federal Open Market Committee
 NationalEconomicTrends Deflation, Corrosive and Otherwise Recently the Federal Open Market Committee (FOMC) mentioned deflation as a possible risk for the U.S. economy. In the statement released after
Consumer Price Index (Base year 2014) Consumer Price Index
 Consumer Price Index") Consumer Price Index December 2017 (Base year 2014) Consumer Price Index 1 Release Date: January 2018 Detailed by: Expenditure groups Household welfare levels Household type Regions Briefing This publication
Consumer Price Index December 2017 (Base year 2014) Consumer Price Index 1 Release Date: January 2018 Detailed by: Expenditure groups Household welfare levels Household type Regions Briefing This publication
Unemployment Rates Declined in the Metro Areas in August
 For Immediate Release Sept.18, 2017 Unemployment Rates Declined in the Metro Areas in August CARSON CITY, NV Unemployment rates were down in all of the state s major population centers, both on a monthover-month
Status of the Unemployment Trust Fund and Related Issues. Commission on Unemployment Compensation. Ellen Marie Hess, Commissioner.
 Status of the Unemployment Trust Fund and Related Issues Commission on Unemployment Compensation August 8, 2018 Ellen Marie Hess, Commissioner 2 Trust Fund Data Standard Forecast (Millions of Dollars)
Vermont Tax Seminar. Comments on the 2017 Economic Outlook Presentation to the. December 8, 2016
 Comments on the 2017 Economic Outlook Presentation to the Vermont Tax Seminar December 8, 2016 Jeffrey B. Carr President and Senior Economist Economic & Policy Resources, Inc. Now the 4 th Longest Up-Cycle
Real GDP Growth Compounded annual rates of change. Consumer Price Index Percent change
 National Economic Trends Real Gross Domestic Product (DISCONTINUED) Real GDP Growth Compounded annual rates of change 6 5 Compounded Annual Rate of Change 4 3 2 1-1 Q1 214 Q1 215 Q1 216 Q1 217 195 196
Consumer Price Index (Base year 2014) Consumer Price Index
 Consumer Price Index") Consumer Price Index December 2016 (Base year 2014) Consumer Price Index 1 Release Date: January 2017 Detailed by: Expenditure groups Household welfare levels Household type Regions Briefing This publication
Consumer Price Index December 2016 (Base year 2014) Consumer Price Index 1 Release Date: January 2017 Detailed by: Expenditure groups Household welfare levels Household type Regions Briefing This publication
February 8, 2012 Robert Johnson Director of Economic Analysis
 Positive Surprises in Store for 2012? Macro Overview February 8, 2012 Robert Johnson Director of Economic Analysis 1 U.S. Economic Data 2011: Soft, but no recession, Growth Accelerated Through the Year
August 2015 Lutgert College Of Business FGCU Blvd. South Fort Myers, FL Phone
 Southwest Florida Regional Economic Indicators August 215 Lutgert College Of Business 151 FGCU Blvd. South Fort Myers, FL 33965 Phone 239-59-79 www.fgcu.edu/cob/reri Table of Contents Introduction: Regional
Consumer Price Index, Jobless Claims, Housing Starts Each of These Reports Have Favorable Aspects to Note
 Consumer Price Index, Jobless Claims, Housing Starts Each of These Reports Have Favorable Aspects to Note January 19, Asha G. Bangalore agb3@ntrs.com The Consumer Price Index (CPI) held steady in December,
Camarines Sur Consumer Price Index
 Inflation Rates (in Percent) Camarines Sur Consumer Price Index SR No. - 50 JULY Inflation rate in Camarines Sur increases to 6.4 percent in April The provincial headline inflation rate in Camarines Sur
Leading Economic Indicator Nebraska
 Nebraska Monthly Economic Indicators: June 21, 2017 Prepared by the UNL College of Business Administration, Bureau of Business Research Author: Dr. Eric Thompson Leading Economic Indicator...1 Coincident
Slight Employment Increase Persists in Nevada Metro Areas as State s Industry Growth Continues
 APRIL SUB-STATE PRESS RELEASE For Immediate Release May 22, 2018 Slight Employment Increase Persists in Nevada Metro Areas as State s Industry Growth Continues CARSON CITY, NV According to the Department
What Determines Long-Run Growth?
 September 1997 What Determines Long-Run Growth? In the first quarter of 1997, real gross domestic product (GDP) grew at a surprising 4.9 percent annual rate. The general consensus among economists is that
Economics. Market Indicators Session 2
 Economics Market Indicators Session 2 National Association of Credit Management Graduate School of Credit and Financial Management American University Washington, DC June 23, 2018 1 What you will learn
Consumer Price Index (Base year 2014) Consumer Price Index
 Consumer Price Index") Consumer Price Index July 207 (Base year 204) Consumer Price Index Release Date: Augest 207 Detailed by: Expenditure groups Household welfare levels Household type Regions Briefing This publication provides
Consumer Price Index July 207 (Base year 204) Consumer Price Index Release Date: Augest 207 Detailed by: Expenditure groups Household welfare levels Household type Regions Briefing This publication provides
Southwest Florida Regional Economic Indicators. June 2012
 Southwest Florida Regional Economic Indicators June 212 Regional Economic Research Institute Lutgert College Of Business Phone 239-59-7319 Florida Gulf Coast University 151 FGCU Blvd. South Fort Myers,
NEWS RELEASE EMBARGOED UNTIL RELEASE AT 8:30 A.M. EDT, FRIDAY, AUGUST 28, 2015 BEA 15-39
 NEWS RELEASE EMBARGOED UNTIL RELEASE AT 8:30 A.M. EDT, FRIDAY, AUGUST 28, 2015 BEA 15-39 Technical: James Rankin (202) 606-5301 (Personal Income) piniwd@bea.gov Harvey Davis (202) 606-5302 (Personal Consumption
MONTHLY ECONOMIC INDICATORS
 MONTHLY ECONOMIC INDICATORS SEPTEMBER 0 Table of Contents 1. INFLATION... 2 2. MONEY, CREDIT AND INTEREST RATES... 6 3. REAL SECTOR INDICATORS... 9 4. BALANCE OF PAYMENTS AND EXTERNAL SECTOR INDICATORS...
Nevada s Metro Areas Experience Drop in Unemployment in December
 For Immediate Release January 24, 2017 Nevada s Metro Areas Experience Drop in Unemployment in December CARSON CITY, NV The jobless rate in Las Vegas declined to 5 percent in December, down 0.2 percentage
Is Deflation Coming? Inflation. November 1997
 November 1997 Is Deflation Coming? Judging from the spate of newspaper articles and commentary on the subject, many analysts are becoming increasingly concerned about the possibility of sustained deflation,
Leading Economic Indicator Nebraska
 Nebraska Monthly Economic Indicators: June 17, 2016 Prepared by the UNL College of Business Administration, Department of Economics Authors: Dr. Eric Thompson, Dr. William Walstad Leading Economic Indicator...1
NATIONAL INCOME AND PRODUCT ACCOUNTS PERSONAL INCOME AND OUTLAYS: JUNE 2016 ANNUAL UPDATE: 2013 THROUGH MAY 2016
 EMBARGOED UNTIL RELEASE AT 8:30 A.M. EDT, TUESDAY, AUGUST 2, 2016 BEA 16-41 Technical: James Rankin (Personal Income) Kyle Brown (PCE) (301) 278-9087 (301) 278-9086 piniwd@bea.gov pce@bea.gov Kurt Kunze
The US Economic Outlook (with a Fed twist)
") The US Economic Outlook (with a Fed twist) Presentation prepared for the Economic Outlook Conference 2011 January 13, 2011 Chapter 1: Why the FOMC went with QE2, an interpretive dance by David Altig, who
The US Economic Outlook (with a Fed twist) Presentation prepared for the Economic Outlook Conference 2011 January 13, 2011 Chapter 1: Why the FOMC went with QE2, an interpretive dance by David Altig, who
Monthly Labour Force Survey Statistics December 2018
 800 Monthly Labour Force Survey Statistics CALGARY CMA Table 282-0135 Labour force survey estimates (LFS), by census metropolitan area based on 2011 census boundaries, 3-month moving average, seasonally
Monthly Labour Force Survey Statistics November 2018
 800 Monthly Labour Force Survey Statistics CALGARY CMA Table 282-0135 Labour force survey estimates (LFS), by census metropolitan area based on 2011 census boundaries, 3-month moving average, seasonally
Inflation rate in Camarines Sur increases to 6.8 percent in September 2017
 Inflation Rate (in Percent) [ Inflation rate in Camarines Sur increases to 6.8 percent in September Date of Release: October 30, Reference No. -83 The provincial headline inflation rate in September increased
WESTWOOD LUTHERAN CHURCH Summary Financial Statement YEAR TO DATE - February 28, Over(Under) Budget WECC Fund Actual Budget
 Budget WECC Fund Actual Budget") WESTWOOD LUTHERAN CHURCH Summary Financial Statement YEAR TO DATE - February 28, 2018 General Fund Actual A B C D E F WECC Fund Actual Revenue Revenue - Faith Giving 1 $ 213 $ 234 $ (22) - Tuition $ 226
WESTWOOD LUTHERAN CHURCH Summary Financial Statement YEAR TO DATE - February 28, 2018 General Fund Actual A B C D E F WECC Fund Actual Revenue Revenue - Faith Giving 1 $ 213 $ 234 $ (22) - Tuition $ 226
GIMA Pulse Date of Report: 04/12/2017 a monthly snapshot of the UK Economy from
 GIMA Pulse Date of Report: 04/12/2017 a monthly snapshot of the UK Economy from www.barometeroftrade.com Summary Inflation has slowed after reaching a 5-year-high last month, largely due to the weak performance
Will the Recovery Ever End? Certified Financial Planners
 Will the Recovery Ever End? Certified Financial Planners Place cover image here Richard Wobbekind Senior Economist and Associate Dean for Business and Government Relations January 25, 219 Attention: This
ECONOMIC AND FINANCIAL HIGHLIGHTS
 ECONOMIC AND FINANCIAL HIGHLIGHTS FEDERAL RESERVE BALANCE SHEET Assets and Liabilities 2-3 REAL ESTATE Construction Spending 4 CoreLogic Home Price Index 5 Mortgage Rates and Applications 6-7 CONSUMER
Babson Capital/UNC Charlotte Economic Forecast March 11, 2014
 Babson Capital/UNC Charlotte Economic Forecast March 11, 2014 The data used in this report comes from the websites for the U.S. Department of Commerce's Bureau of Economic Analysis (www.bea.gov) and the
State of Ohio Workforce. 2 nd Quarter
 To Strengthen Ohio s Families through the Delivery of Integrated Solutions to Temporary Challenges State of Ohio Workforce 2 nd Quarter 2 0 1 2 Quarterly Report on the State of Ohio s Workforce Reference
Economic Indicators MARCH Prepared for the Joint Economic Committee by the Council of Economic Advisers. 115th Congress, 1st Session
 115th Congress, 1st Session Economic Indicators MARCH 217 (Includes data available as of April 7, 217) Prepared for the Joint Economic Committee by the Council of Economic Advisers UNITED STATES GOVERNMENT
Decline in Economic Activity Larger Than Advance GDP Estimate February 27, 2009
 Northern Trust Global Economic Research 5 South LaSalle Chicago, Illinois 663 northerntrust.com Asha G. Bangalore agb3@ntrs.com Decline in Economic Activity Larger Than Advance GDP Estimate February 27,
Inflation rate in Camarines Sur decreases to 5.1 percent in December 2017
 Inflation Rate (in Percent) [ Inflation rate in Camarines Sur decreases to 5.1 percent in ember Date of Release: January 11, 2018 Reference No. 2018-4 The provincial headline inflation rate in ember decreased
XML Publisher Balance Sheet Vision Operations (USA) Feb-02
 Feb-02") Page:1 Apr-01 May-01 Jun-01 Jul-01 ASSETS Current Assets Cash and Short Term Investments 15,862,304 51,998,607 9,198,226 Accounts Receivable - Net of Allowance 2,560,786
Page:1 Apr-01 May-01 Jun-01 Jul-01 ASSETS Current Assets Cash and Short Term Investments 15,862,304 51,998,607 9,198,226 Accounts Receivable - Net of Allowance 2,560,786
GIMA Pulse Date of Report: 04/07/2017 a monthly snapshot of the UK Economy from
 GIMA Pulse Date of Report: 04/07/2017 a monthly snapshot of the UK Economy from www.barometeroftrade.com Summary The factor with the largest percentage change over the last month is crude oil prices. Having
Nonfarm jobs grow by 1,500 in October; unemployment rate unchanged at 4.2%
 Lincoln.dyer@ct.gov appears Office of Research Kurt Westby, Commissioner FOR IMMEDIATE RELEASE October 2018 Data CT Unemployment Rate = 4.2% US Unemployment Rate = 3.7% Nonfarm jobs grow by 1,500 in October;
Nonfarm jobs increase by 6,100 in June; unemployment rate at 4.4%
 Lincoln.dyer@ct.gov appears Office of Research Kurt Westby, Commissioner FOR IMMEDIATE RELEASE June 2018 Data CT Unemployment Rate = 4.4% US Unemployment Rate = 4.0% Nonfarm jobs increase by 6,100 in June;
Economic Indicators JUNE Prepared for the Joint Economic Committee by the Council of Economic Advisers. 113th Congress, 1st Session
 113th Congress, 1st Session Economic Indicators JUNE 2013 (Includes data available as of July 5, 2013) Prepared for the Joint Economic Committee by the Council of Economic Advisers UNITED STATES GOVERNMENT
Nonfarm jobs fall by 500 in September; unemployment rate falls to 4.2%
 Lincoln.dyer@ct.gov appears Office of Research Kurt Westby, Commissioner FOR IMMEDIATE RELEASE September 2018 Data CT Unemployment Rate = 4.2% US Unemployment Rate = 3.7% Nonfarm jobs fall by 500 in September;
Nonfarm jobs fall by 400 in February; unemployment rate unchanged at 3.8%
 Lincoln.dyer@ct.gov appears Office of Research Kurt Westby, Commissioner FOR IMMEDIATE RELEASE February 2019 Data CT Unemployment Rate = 3.8% US Unemployment Rate = 3.8% Nonfarm jobs fall by 400 in February;
Nonfarm jobs fall by 2,000 in March; unemployment rate at 4.5%
 Lincoln.dyer@ct.gov appears Office of Research Scott D. Jackson, Commissioner FOR IMMEDIATE RELEASE March 2018 Data CT Unemployment Rate = 4.5% US Unemployment Rate = 4.1% Nonfarm jobs fall by 2,000 in