Five Year Forecast Financial Report
|
|
|
- Marcia Simon
- 5 years ago
- Views:
Transcription
1 Five Year Forecast Financial Report May,
2 Table of Contents Table of Contents 2 Executive Summary 3 PAGE # Revenue Overview General Property Tax (Real Estate) Public Utility Personal Property Income Tax Unrestricted Grants-in-Aid & Restricted Grants-in-Aid Property Tax Allocation All Other Operating Revenues Total Other Financing Sources 12 Expenditures Overview Personnel Services Employee Benefits Purchased Services Supplies and Materials Capital Outlay Other Objects Total Other Financing Uses 20 Forecast Compare 21 Five Year Forecast 22 Year over Year Changes Revenues by recipt code 23 Expenditures by object 24 2

3 May, 2017 Executive Summary Five Year Forecast - Simplified Statement Fiscal Year Fiscal Year Fiscal Year Fiscal Year Fiscal Year Beginning Balance 8,880,504 4,408,990 3,838,746 2,682,876 1,544,379 + Revenue 17,071,026 16,937,062 16,989,822 17,348,862 17,553,365 + Proposed Renew/Replacement Levies Proposed New Levies Expenditures (21,542,540) (17,507,306) (18,145,691) (18,487,359) (19,243,782) = Revenue Surplus or Deficit (4,471,514) (570,244) (1,155,870) (1,138,497) (1,690,417) Ending Balance 4,408,990 3,838,746 2,682,876 1,544,379 (146,038) Revenue Surplus or Deficit w/o Levies (4,471,514) (570,244) (1,155,870) (1,138,497) (1,690,417) Ending Balance w/o Levies 4,408,990 3,838,746 2,682,876 1,544,379 (146,038) Summary: The five year forecast is a tool used to project the revenues and expenditures over a five year period with three years of historical balances in the General Fund. The data in the forecast is completed using a comprehensive analysis of historical trends in revenues and expenses. The Five Year Forecast is intended to assist the Board of Education in overseeing the management of the district's resources and planning for the district's future by illustrating trends and estimating future values for evaluation. The Treasurer is responsible for the reasonableness of the assumptions on which the forecast is based. Variances may arise between forecasted amounts and actual results when unexpected events and circumstances occur and/or changes in state laws and budgets happen, thus the assumption used to generate the forecasted amounts will change over time. The five year forecast is based on assumptions therefore the accuracy of the forecast is dependent on the basis and foresight of the assumptions that create the predicted trends. The district financial position is stable for the current forecast and the three year's to follow. The cash balance will remain adequate through the end of Fiscal Year 2019, however by Fiscal Year 2019 the district must have a plan to balance the budget and keep the expenditures at or below the revenues beyond that point. In Fiscal Year 2019 the cash balance is approaching a recommended bottom line cash on hand balance. In this fiscal year, without the $5,000,000 transfer to the Capital Improvement find 070, we are still on track to spend less than we received. In Fiscal year 2018 our actual expenses are projected to exceed our revenues. The practice of expenses exceeding revenues should not occur beyond Fiscal Year Plans to cut expenditures by fiscal year 2019 occurred at a work session meeting held on December 8, The administration came up with a plan to reduce expenses on supplies and capital outlay by 5% in each category which reduced the overall expenses by close to a million dollars. $25,000,000 $20,000,000 $21,542,540 Revenue vs. Expenditures $17,507,306 $18,145,691 $18,487,359 $19,243,782 $15,000,000 $10,000,000 $5,000,000 $17,071,026 $16,937,062 $16,989,822 $17,348,862 $17,553, Revenue Renew/Replacement Levies New Levies Expenditures 3

4 Revenue Overview Prev. 5-Year PROJECTED 5-Year Avg. Annual Fiscal Year Fiscal Year Fiscal Year Fiscal Year Fiscal Year Avg. Annual Change Change Revenue: Real Estate -0.47% -1.11% 0.49% 0.34% 1.01% 1.35% 0.41% Public Utility % 8.96% 12.73% 1.49% 1.49% 1.49% 5.23% Income Tax % 7.73% 2.50% 2.50% 2.50% 2.50% 3.55% State Funding 1.57% -0.49% -2.69% -0.18% 3.15% 0.90% 0.14% Restricted Aid 65.84% -0.53% 0.38% -2.52% -1.36% -0.16% -0.84% Restr Federal SFSF % 0.00% 0.00% 0.00% 0.00% 0.00% 0.00% Property Tax Alloc -4.22% 3.84% -4.18% 0.47% 1.10% 1.49% 0.54% All Other Operating 6.17% 12.64% 0.25% -0.60% -0.05% 0.26% 2.50% Total Revenue 3.52% 2.04% -0.44% 0.31% 2.12% 1.18% 1.04% Total Other Sources 69.82% % % 0.00% 0.00% 0.00% % Total Rev & Other Srcs 3.64% 1.87% -0.78% 0.31% 2.11% 1.18% 0.94% Lines 1.01 (General Property Tax), (Income Tax), (Unrestricted State Funding) and (All Other Operating Revenue) represent over 90% of the district's annual income. These lines are all significant and revenue expectations for these lines are based on historical trends. Revenues are largely effected by policies and circumstances that are beyond the district's control. Due to this factor, in order to provide the board with a realistic estimation of the future income streams I have not projected significant increases over the next five years. An over projection of increases in the future revenues would not be fiscally responsible and could potentially lead to even more deficit spending. The 3.52% total revenue increase over the past 5 years is affected in large by the Income tax which has not been in effect for the entire 5 year history. The 1% total revenue increase may seem conservative but is realistic given the uncertainty of the state budgets and the proposed cuts, the instability of the economy and job growth and the stability of the local property valuation with no significant changes. Public Utility 4.2% Income Tax % Real Estate 20.8% 20.3% Public Utility 4.2% 5.1% Income Tax 11.7% 13.2% State Funding 50.6% State 48.5% Prop Tax Allo 3.3% Funding 3.3% Real Estate All Othr Op Re 8.7% 50.6% 9.4% 20.8% Othr Sources 0.7% 0.2% Public Utility 5.1% Real Estate 20.3% Income Tax 13.2% 2021 State Funding 48.5% Othr Sources 0.7% All Othr Op Rev 8.7% Prop Tax Alloc 3.3% Othr Sources 0.2% All Othr Op Rev 9.4% Prop Tax Alloc 3.3% 4
5 $3,687,611 $3,085,156 $3,195,089 $3,342,418 $3,491,944 $3,453,206 $3,469,999 $3,481,787 $3,516,784 $3,564, General Property Tax (Real Estate) Revenue collected from taxes levied by a school district by the assessed valuation of real property using effective tax rates for class I (residential/agricultural) and class II (business). FY Real Estate as a % Projected General Property RevRenewal Tax (Real Levy Estate) Revenue Actual and Projected of Total Revenue $4,000, $3,687,611 $1 FY Rea $3,500, $3,085, $3,000, $3,195,089 $2,500, $3,342, % $2,000, $3,491,944 $1,500, $3,453,206 $1,000, $3,469,999 $500, $3,481, $3,516, $3,564, Projected Revenue Renewal Levy Revenue General Property Tax forecasted amounts are based on the district's total overall property valuation, which in 2016 was $215,158,190. Changes in valuation are postulated on historical growth, board of revision adjustments, new construction and the districts ability to collect. For outside or voted millage, currently the district is at the 20-mill floor on Class I property taxes which means as Agricultural and Residential valuations increase, tax collections will also increase because the district's millage rate cannot go any lower by state law. Currently the Class I valuation is $183,274,770. The district is at 25.2 mills on Class II property which includes mineral, industrial and commercial property which has a valuation of $12,197,280. Reductions in Real Estate tax collections come from delinquent taxes and Board of Revision challenges. I have forecasted an allowance of a 3.5% delinquency rate over the 5 years of the forecast based on historical collection rates. The increase in revenues for FY 16was due to increased delinquency collections (103.5%)over FY15. The forecast reflects the projected collections rates to be less than last year which is realistic due to the high delinquency percentage collected. Fiscal Year 17 more closely reflects FY15 collections with slight increases estimated. This revenue accounts for almost 21% of the district's overall general fund income % -5.0% % -2 Year-over-Year Revenue Trend Year-over- Actual 5-YeProjected 5-Year Average % -0.47% % -0.47% % -0.47% % -0.47% -0.47% % -0.47% % 0.41% % 0.41% % 0.41% % 0.41% % 0.41% 0.41% Year-over-Year Revenue Variance Actual 5-Year Average Projected 5-Year Average *Projected % trends include renewal levies 5
6 $42,412 $630,752 $605,685 $638,272 $702,415 $765,322 $862,727 $875,582 $888,628 $901, Public Utility Personal Property Revenue generated from public utility personal property valuations multiplied by the district's full voted tax rate. FY Public Utility as a % Projected Tangible RevRenewal Personal Property Levy Tax Revenue Actual and Projected FY of Pub Total Revenue $1,000, $42,412 $42, $630,752 $630,752 $800, $605,685 $605, % $600, $638,272 $638, $702,415 $702,415 $400, $765,322 $765, $862,727 $862,727 $200, $875,582 $875, $888,628 $888, $901, $901, Projected Revenue Renewal Levy Revenue Tangible Personal Property is being phased out as a result of HB66. What remains are Public Utilities. Valuations for tax revenue from the Public Utilities have shown slight increases. This has been due to new substations and transmission lines for electric providers in recent years. A slight 1.5% increase in has been projected for this line for the next five years of the forecast. This revenue source accounts for about 4% of the overall revenue for the district Year-over-Year Revenue Trend Year-over- Actual 5-YeProjected 5-Year Average % % 2013 ####### % % % % % % % % 5.23% % 5.23% % 5.23% % 5.23% % 5.23% % 5.23% Year-over-Year Revenue Variance Actual 5-Year Average Projected 5-Year Average *Projected % trends include renewal levies 6
7 $108,103 $1,127,635 $1,865,453 $1,954,287 $2,105,285 $2,157,918 $2,211,866 $2,267,163 $2,323,842 $- $- $- $- $ Income Tax Revenue collected from income tax earmarked specifically to support schools with a voter approved tax by residents of the school district; separate from federal, state and municipal income taxes. FY Income Tax as a % Projected RevRenewal Income Tax Actual Levy and Revenue Projected FY 2016 of - Inco Total Revenue 0 $2,500, $2,000, , ,127,635 $1,500, ,865, % ,954,287 $1,000, ,105, ,157,918 - $500, ,211, ,267, ,323, Projected Revenue Renewal Levy Revenue A 1% Earned Income Tax was passed effective January 1, 2013 and was renewed in Fiscal Year 2016 to continue through December 31, FY2015 was the first fiscal year of full collection. This revenue accounts for almost 12% of the districts general fund revenue which is slightly over $2 million. A conservative 2.5% increase was forecasted for this revenue stream for the remaining years. Since the district has not had this revenue stream for a long period of time and has collected income taxes at a full rate for an even shorter period of time future projection have been based on analysis of the census data of the average annual household income over the past 20 years for the district. This revenue stream as dynamic and will rise and fall with the economy and the prosperity of the district's residents % Year-over-Year Revenue Trend Year-over- Actual 5-YeProjected 5-Year Average 2012 n/a % 2013 n/a % % % % % % % % 3.55% % 3.55% % 3.55% % 3.55% % 3.55% 3.55% Year-over-Year Revenue Variance Actual 5-Year Average Projected 5-Year Average *Projected % trends include renewal levies 7
8 $8,001,574 $8,338,726 $8,255,078 $8,268,022 $8,296,154 $8,255,344 $8,032,890 $8,018,808 $8,271,486 $8,346, Unrestricted Grants-in-Aid Funds received through the State Foundation Program with no restriction. FY Unres State Aid as a % of Total Revenue FY Unr % $9,000,000 $8,000,000 $7,000,000 $6,000,000 $5,000,000 $4,000,000 $3,000,000 $2,000,000 $1,000,000 Unrestricted Grants-in-Aid Actual and Projected This line in the forecast reflects the State Foundation Payments which are received twice per month. The revenues that are included in this line are in areas such as: Opportunity Grant, Targeted Assistance, K-3 Literacy Finding, English Proficiency, Gifted Education funding, Special Education Additional Funding, Special Education Preschool Funding and Casino revenue. Ohio s biennium budget (HB64) was passed into law in for the FY16 and FY17 School Years on June 30 of Because the budget is bi-annual and based on factors that are subject to deliberations and approval of the Ohio General Assembly only Fiscal Year 16 and Fiscal Year 17 can be forecasted using this state budget. Several factors combine in determining the amount of state foundation we receive such as enrollment and the wealth of the community relative to the state. Clear Fork is currently subject to the transitional aid guarantee which means that we are projected to receive the same funding amount from the state foundation than we did in Fiscal Year 15. Changes in state funding for last year and this year is partly due to the graduation bonus, third grade reading guarantee bonus, changes in Career Tech Funding and changes in Special Education Additional Funding. The new Biennial budget for Fiscal years 2018 and 2019, House Bill 49, has currently has been accepted by the House Finance Committee and is pending. The Senate will be working on their version of the budget throughout May and June. The Governor's initial proposal would have constituted a $326,171 annual loss in state funding for the District. Because the budget is not certain and reductions have been proposed I have projected a reduction in the traditional aid grantee of slightly over $200,000, which is based on our ADM and a reduction in the state share of core funding. 5.0% 4.0% 3.0% 2.0% 1.0% -1.0% -2.0% -3.0% -4.0% Year-over-Year Revenue Trend Year-over-Year Revenue Variance Actual 5-Year Average Projected 5-Year Average 8
9 $391,765 $57,217 $265,987 $226,681 $179,259 $178,318 $178,995 $174,479 $172,114 $171, & Restricted Grants-in-Aid Funds received through the State Foundation Program or other allocations that are restricted for specific purposes. FY Rest State Aid as a % of Total Revenue FY Res 0 1.1% $450,000 $400,000 $350,000 $300,000 $250,000 $200,000 $150,000 $100,000 $50,000 Restricted Grants-in-Aid Actual and Projected Receipts in this line include Career Tech funding as well as the Economic Disadvantaged Funding implemented in the current funding formula. Changes in this line are due to the projections of the Local Wealth per Pupil changing compared to the state average wealth per pupil. Overall this revenue stream accounts for slightly more than 1% of the districts overall revenue so it is not a significant funding factor. Changes in this line are mainly due to changes in Career Tech funding because of projected changes in ADM Year-over-Year Revenue Trend Year-over-Year Revenue Variance Actual 5-Year Average Projected 5-Year Average 9
10 $525,165 $526,911 $534,069 $550,102 $558,344 $579,774 $555,547 $558,143 $564,275 $572, Property Tax Allocation Includes funds received for Tangible Personal Property Tax Reimbursement, Electric Deregulation, Homestead and Rollback. FY Prop Tax Property Tax Allocation Actual and Projected Projected RevRenewal Levy Revenue Allocation as a % of Total $700,000 FY Pro $525,165 Revenue $600, $526,911 $500, $534, $550, % $400, $558,344 $300, $579,774 $200, $555,547 $100, $558, $564, $572, Projected Revenue Renewal Levy Revenue Homestead Roll-back and Property Tax allocation is projected with minimal changes. This revenue comes from the state and is based on property tax exemptions which are influenced by property valuations and the payment of taxes. This projection is based upon two payments during each fiscal year. This funding amounts to slightly over 3% of our annual revenue. Year-over-Year Revenue Trend 1 5.0% -5.0% % % -4.22% Year-over- Actual 5-YeProjected 5-Year Average % -4.22% % -4.22% % -4.22% % -4.22% % -4.22% % 0.54% % 0.54% % 0.54% % 0.54% % 0.54% 0.54% -3 Year-over-Year Revenue Variance Actual 5-Year Average Projected 5-Year Average *Projected % trends include renewal levies 10
11 $1,366,736 $1,309,514 $1,357,161 $1,384,132 $1,460,326 $1,644,897 $1,648,986 $1,639,157 $1,638,412 $1,642, All Other Operating Revenues Operating revenue sources not included in other lines; examples include tuition, fees, earnings on investments, rentals, and donations. FY Other Operating Revenue as a % of Total FY Oth 0 Revenue 8.7% $1,800,000 $1,600,000 $1,400,000 $1,200,000 $1,000,000 $800,000 $600,000 $400,000 $200,000 All Other Operating Revenue Actual and Projected This revenue comes from things such as Interest on Investments, Open Enrollment, Preschool Tuition, Fees, Medicaid Reimbursements, Workers Compensation Refunds, Insurance Refunds, Rental Income and charges to other districts for shared services to list a few. The vast majority of this revenue comes from Open Enrollment and due to an increase in the funding amount per pupil by the state a slight increase is projected in this line for the remainder of the Forecast. At 8.7% of our overall revenue this funding is significant. Changes of less than 1% annually have been projected for the five years of this forecast because open enrollment is relatively steady and makes up over $1,000,000 of this revenue line. The changes in the other revenues have a minimal impact as they are not as significant. The increase in FY17 in this line was due in large part to an increase in tuition from other districts. 3 Year-over-Year Revenue Trend 25.0% % 1 5.0% -5.0% Year-over-Year Revenue Variance Actual 5-Year Average Projected 5-Year Average 11
12 $38,462 $50,073 $168,023 $73,111 $114,924 $88,881 $30,000 $30,000 $30,000 $30, Total Other Financing Sources Includes proceeds from sale of notes, state emergency loans and advancements, operating transfers-in, and all other financing sources like sale and loss of assets, and refund of prior year expenditures. FY Other Financing Sources as a % of Total FY Oth Revenue 0.7% $180,000 $160,000 $140,000 $120,000 $100,000 $80,000 $60,000 $40,000 $20,000 Other Operating Financing Sources Actual and Projected This line reflects the reimbursement of advances and any refunds from expenditures that occurred in the previous year or years. At.7% the revenue from this line is not significant in the funding of the district and since the overall dollar amount for this line is small any changes here are reflected at large percentage changes but are small dollar amounts relative to the entire revenues collected. 30 Year-over-Year Revenue Trend Year-over-Year Expenditure Variance Actual 5-Year Average Projected 5-Year Average 12
13 Expenditures Overview Prev. 5-Year PROJECTED 5-Year Avg. Annual Fiscal Year Fiscal Year Fiscal Year Fiscal Year Fiscal Year Avg. Annual Change Change Expenditures: Salaries 0.74% 5.82% 3.80% 2.78% 1.98% 3.36% 3.55% Benefits 2.59% 6.85% 0.51% 6.24% 5.97% 6.48% 5.21% Purchased Services 4.87% 11.55% 2.04% 1.28% 0.71% 6.05% 4.33% Supplies & Materials 5.85% 10.54% 2.95% -1.90% % -2.21% -2.19% Capital Outlay 94.88% % 27.40% % 3.89% -1.46% -3.08% Intergov n/a n/a n/a n/a n/a n/a n/a Debt n/a n/a n/a n/a n/a n/a n/a Other Objects -0.90% 13.02% 2.00% 2.00% 2.00% 2.00% 4.20% Total Expenditures 2.18% 6.20% 3.02% 2.90% 1.97% 4.31% 3.68% Total Other Uses 14.86% % % 17.92% 0.42% 0.40% % Total Exp & Other Uses 2.72% 37.96% % 3.65% 1.88% 4.09% 5.77% Lines (Personnel) and (Benefits) account for over 75% of the districts expenditures and when Purchased Services are included (line 3.030) that accounts for roughly 90% of the district's expenses. Expenses in these first three categories are significant and have the greatest impact on the overall expenditures. Estimated increases in expenses are based on negotiated agreements between the district and the labor unions, historical trends, market trends and district needs. A slightly higher increase in expenditures has been projected for the next five years than has occued over the previous five years due in part to lower than average insurance increases over the past several years. Focusing on line there is a 1.5% variation between the historical changes and the changes that have been projected for the next 5 years Othr Uses 2.6% Othr Objects 1.2% Intergo v & Debt Salaries 51.2% 49.4% Benefits 24.6% 25.7% Purch Salaries Serv 14.0% 14.0% Supp 51.2% & Mat 3.9% 2.7% Capital Outlay 2.5% 1.6% Benefits Intergov & Deb 24.6% Othr Objects 1.2% 1.2% Othr Uses 2.6% 5.4% Purch Serv 14.0% Capital Outlay 2.5% 2016 Supp & Mat 3.9% Othr Uses 5.4% Othr Objects 1.2% Intergo v & Debt Salaries 49.4% Capital Outlay 1.6% 2021 Purch Serv 14.0% Supp & Mat 2.7% Benefits 25.7% 13
14 $7,688,923 $7,696,993 $7,530,265 $7,835,306 $7,990,761 $8,456,149 $8,777,154 $9,021,365 $9,200,392 $9,509, Personnel Services Employee salaries and wages, including extended time, severance pay, supplemental contracts, etc. FY Salaries as a % of Total Expenditures FY Sala % $10,000,000 $9,000,000 $8,000,000 $7,000,000 $6,000,000 $5,000,000 $4,000,000 $3,000,000 $2,000,000 $1,000,000 Personnel Services Actual and Projected Expenses in this line are salaries that are based on the collective bargaining agreements between the Clear Fork Valley Education Association, the Ohio Association of Public School Employees local 282 and the Clear Fork Board of Education. Salaries constitute over 51% of the district's expenditures. New negotiated agreements gave both certified and classified staff salary increases of 1.5% in fiscal years 2017, 2018, and 2019 including steps. For fiscal years 2017 through 2021 an average step increases is assumed at 2.8% each year for certified staff which is a reflection of the salary schedule from the negotiated agreement. Also for fiscal years , an education step increase of.2% was projected to anticipate degree changes. Combined, the average step increase, the projected increase on the base and the projected increase for movement within the salary schedule is a 4.5% increase in salary for certified staff annually. Classified's annual average step increase is 2% and there is no option for degree changes. A 1.5% increase has been built in to Classified salaries for the remaining fiscal years resulting in an average total increase of 3.5% in Classified wages projected for the remainder of the forecast. Changes in staffing also effect the annual expenses in this line. In Fiscal Year 2017, personnel has increased 5.8% to $5,021 per pupil over Fiscal Year 2016 at $4,742 per pupil, which increased 2% over Fiscal Year 2015 at $4,480 per pupil. As enrollment declines the per pupil expenditures increase. 7.0% 6.0% 5.0% 4.0% 3.0% 2.0% 1.0% -1.0% -2.0% -3.0% Year-over-Year Expenditure Trend Year-over-Year Expenditure Variance Actual 5-Year Average Projected 5-Year Average 14
15 $3,780,232 $3,577,904 $3,374,846 $3,612,786 $3,846,158 $4,109,711 $4,130,615 $4,388,569 $4,650,544 $4,951, Employees' Benefits Retirement for all employees, Workers Compensation, early retirement incentives, Medicare, unemployment, pickup on pickup, and all health-related insurances. FY Benefits as a % of Total Expenditures FY Ben 0 $6,000,000 $5,000,000 $4,000,000 Employees' Benefits/Insurance Benefits Actual and Projected 24.6% $3,000,000 $2,000,000 $1,000,000 At 24.6% of the overall expenditures benefits constitute a significant portion of the district's annual expenditures. Expenditures in this line represent retirement, insurances, Medicare, workers compensation and tuition reimbursements. Projections are based on salary based fringe benefits calculated at 15.9% of salaries which is comprised of fringes for projected salaries in each fiscal year for STRS (14%), SERS (14%), Medicare (1.45%), and Worker's Comp (0.44%). Also included is the 2.45% composite increase in healthcare premiums for this fiscal year, the 2.31% composite increase for next year and a modest 8% increase healthcare premiums for FY2019 through FY2021. Benefits are in a large part tied to wages so as wages increase so do most benefits. Health insurance however is not tied to wages so as Health insurance costs rise at a higher rate than salaries, benefits become a larger percentage of total expenditures. 12.0% 1 8.0% 6.0% 4.0% 2.0% -2.0% -4.0% -6.0% -8.0% Year-over-Year Expenditure Trend Year-over-Year Expenditure Variance Actual 5-Year Average Projected 5-Year Average 15
16 $1,663,578 $2,018,536 $2,207,087 $2,387,102 $2,182,837 $2,434,983 $2,484,586 $2,516,493 $2,534,480 $2,687, Purchased Services Amounts paid for personal services rendered by personnel who are not on the payroll of the school district, and other services which the school district may purchase. FY Purchased Services as a % of Total Expenditures FY Pur 0 $3,000,000 $2,500,000 $2,000,000 Purchased Services Actual and Projected 14.0% $1,500,000 $1,000,000 $500,000 Purchased Services are 14% of the District's expenditures. Expenses accounted for in this line are costs that include professional services, special education and other therapy services, utilities, repairs and maintenance, staff professional development, transportation charges, property and liability insurances, equipment repair, contract agreements and tuition for open-enrollment out and community schools deductions to name a few. Increases for this line are due to instability in utility costs which can be affected a great deal by the weather and alterations in the types and amounts of special education services provided that will change with the needs of the student population. Increases in this line vary depending on the service, for example electricity and gas costs are projected at a 5% increase while waste disposal, water/sewer and telephone service are only projected to increase at 2%. Increases in these expenditures are based on the historical trends for that particular service. I have projected a 3% increase in post secondary expenses as the college-credit plus option becomes more widely utilized and enrollment in these classes is projected to increase, increasing the district's expenditures. Most other expenditures have been projected at a 3% annual increase to compensate for inflation. Many of these expenditures are not in the district's control as they are services dictated by specific students needs. The major increases in this line are from Special education Tuition and increases in open enrollment out. 25.0% Year-over-Year Expenditure Trend % 1 5.0% -5.0% % Year-over-Year Expenditure Variance Actual 5-Year Average Projected 5-Year Average 16
17 $585,916 $477,903 $585,403 $515,669 $606,025 $669,903 $689,663 $676,537 $539,047 $527, Supplies & Materials Expenditures for general supplies, instructional materials including textbooks and media material, bus fuel and tires, and all other maintenance supplies. FY Supplies & Materials as a % of Total FY Sup Expenditures 0 3.9% $800,000 $700,000 $600,000 $500,000 $400,000 $300,000 $200,000 $100,000 Supplies & Materials Actual and Projected Expenses in this line only constitute 4% of the overall annual district expenditures. Supplies and materials are based on the needs of the staff and are based on a per pupil budget amount that is provided to each principal to set their building budget. Because of the work session held on December 8, 2016 I have projected a 5% decrease in the most of the line items that make up these expenditures. However, items such as textbooks were not reduced because the curriculum replacement initiative is still ongoing and will continue and bus parts and fuel expenses are not reduced because the district cannot control those costs. 25.0% % 1 5.0% -5.0% % % Year-over-Year Expenditure Trend Year-over-Year Expenditure Variance Actual 5-Year Average Projected 5-Year Average 17
18 $282,720 $138,462 $471,779 $409,346 $389,744 $263,274 $335,413 $292,520 $303,903 $299, Capital Outlay This line includes expenditures for items having at least a five-year life expectancy, such as land, buildings, improvements of grounds, equipment, computers/technology, furnishings, and buses. FY Capital Outlay as a % of Total Expenditures FY Cap 0 2.5% $500,000 $450,000 $400,000 $350,000 $300,000 $250,000 $200,000 $150,000 $100,000 $50,000 Capital Outlay Actual and Projected The District has budgeted to purchase two buses each year for a period of eight years to reduce the amount spent on parts/repairs. Two were purchased in 2012, two in 2013 and two in 2015, 2016 and The remaining 5 years of this forecast have two bus purchases reflected in this line. Because at that rate of replacement the district will be keeping busses for years before they are replaced, this line reflects a continuation of that bus replacement program in anticipation of a continued need. Part of the decrease in Fiscal Year 2017 was due to the Straight A grant which not only purchased all the Chrome Books for the district but was also was implemented to reduce the annual expenditures on technology by not replacing desktop computers and transitioning to wireless personal devises with the one-to-one implementation the grant allowed. Starting next year Chrome books will need to be replaced so technology equipment was actually increased over the remaining years. Expenditures in this line only constitute 2.5% of the over expenditures Year-over-Year Expenditure Trend Year-over-Year Expenditure Variance Actual 5-Year Average Projected 5-Year Average 18
19 $188,097 $181,505 $163,377 $200,117 $190,777 $215,621 $219,933 $224,332 $228,818 $233, Other Objects Primary components for this expenditure line are membership dues and fees, ESC contract deductions, County Auditor/Treasurer fees, audit expenses, and election expenses. FY Other Objects as a % of Total Expenditures FY Oth 0 $250,000 $200,000 Other Objects Actual and Projected 1.2% $150,000 $100,000 $50,000 Increases of 2% per year were used for this line. At less than 1.5% of overall expenditures of overall, expenditures from this line are not significant and account for a minimal amount of the overall expenses. Items in this line are expenses such as County Auditor/Treasurer Fees, Bank Fees, Insurances, Audit costs and Board of Elections expenses. Expenditures in this line only constitute slightly over 1% of the over expenditures. 25.0% Year-over-Year Expenditure Trend % 1 5.0% % % Year-over-Year Expenditure Variance Actual 5-Year Average Projected 5-Year Average 19
20 $275,847 $469,831 $397,877 $457,643 $409,194 $5,392,900 $869,942 $1,025,875 $1,030,175 $1,034, Total Other Financing Uses Operating transfers-out, advances out to other funds, and all other general fund financing uses. FY Other Financing Uses as a % of Total FY Oth Expenditures 0 2.6% $6,000,000 $5,000,000 $4,000,000 $3,000,000 Other Financing Uses Actual and Projected $2,000,000 $1,000,000 This line includes transfers to the Athletic Fund to cover personnel expenses for supplemental contracts, bussing to extracurricular events, custodial overtime associated with extracurricular events, and the compensation for the athletic director. In September of Fiscal Year 2017 $5,000,000 was transferred to a Capital Projects Fund (070) to offset the cost of the OFCC Elementary facilities project. Other than that transfer these expenditures only account for 2.6% of the total general fund expenses. Because the bond to build new buildings is backed by the district's earned income tax where the proceeds come into the general fund, the bond payments are shown here being transferred from General Fund into the Bond Fund (002). That is the reason that for the increase in FY18-FY Year-over-Year Expenditure Trend Year-over-Year Expenditure Variance Actual 5-Year Average Projected 5-Year Average 20
21 Forecast Compare Comparison of Previous Forecast Amounts to Current Forecasted Numbers F.Y Column A Column B Column C Column D Previous Current Dollar Percent Forecast Forecast Difference Difference Amounts For Amounts For Between Between F.Y F.Y Previous Previous Prepared on: Prepared on: and and Revenue: 10/21/2016 5/2/2017 Current Current 1 Real Estate & Property Allocation $4,001,084 $4,032,980 $31, % 2 Public Utility Personal Property $757,609 $765,322 $7, % 3 Income Tax $2,003,144 $2,105,285 $102, % 4 State Foundation Restricted & Unrestricted $8,572,569 $8,433,661 -$138, % 5 Other Revenue $1,433,187 $1,644,897 $211, % 6 Other Non Operating Revenue $80,000 $88,881 $8, % 7 Total Revenue $16,847,593 $17,071,026 $223, % Expenditures: 8 Salaries $8,319,079 $8,456,149 $137, % 9 Fringe Benefits $3,866,969 $4,109,711 $242, % 10 Purchased Services $2,302,401 $2,434,983 $132, % 11 Supplies, Debt, Capital Outlay & Other $1,193,251 $1,148,797 -$44, % 12 Other Non Operating Expenditures $5,460,000 $5,392,900 -$67, % 13 Total Expenditures $21,141,701 $21,542,540 $400, % 14 Revenue Over/(Under) Expenditures -$4,294,107 -$4,471,514 -$177, %* 15 Ending Cash Balance $4,586,397 $4,408,990 -$177, %* *Percentage expressed in terms of total expenditures In comparing what I projected in the October Forecast to what I am projecting now there is less than a two percent variation in the overall revenues and expenses. 21
22 Actual FORECASTED Fiscal Year: # 2021 Revenue: General Prop 3,491,944 3,453,206 3,469,999 3,481,787 3,564, Public Utility 702, , , , , Income Tax 1,954,287 2,105,285 2,157,918 2,211,866 2,323, Unrestricted 8,296,154 8,255,344 8,032,890 8,018,808 # 8,346, Restricted Gr 179, , , , , Restricted Fe Property Tax 558, , , , , All Other Ope 1,460,326 1,644,897 1,648,986 1,639,157 1,642, Total Revenue 16,642,729 16,982,145 16,907,062 16,959,822 17,523,365 Other Financing Sources: Proceeds fro State Emerge Operating Tr Advances-In 92,120 50, All Other Fin 22,804 38,881 30,000 30,000 30, Total Other F 114,924 88,881 30,000 30,000 30, Total Rev & Oth 16,757,653 17,071,026 16,937,062 16,989,822 17,553,365 Expenditures: Personnel Se 7,990,761 8,456,149 8,777,154 9,021,365 9,509, Employee Be 3,846,158 4,109,711 4,130,615 4,388,569 4,951, Purchased Se 2,182,837 2,434,983 2,484,586 2,516,493 2,687, Supplies and 606, , , , , Capital Outla 389, , , , , Intergovernm Debt Service: Principal-All Principal - No Principal - St Principal - St Principal - HB Principal - Ot Interest and Other Object 190, , , , , Total Expendit 15,206,302 16,149,640 16,637,364 17,119,816 18,209,507 Other Financing Uses Operating Tr 338,570 5,410, ,942 1,025,875 1,034, Advances-Ou 70,000 50, All Other Fin 624 (67,100) Total Other F 409,194 5,392, ,942 1,025,875 1,034, Total Exp and O 15,615,496 21,542,540 17,507,306 18,145,691 19,243, Excess of Rev O 1,142,157 (4,471,514) (570,244) (1,155,870) (1,690,417) Cash Balance J 7,738,347 8,880,504 4,408,990 3,838,746 1,544, Cash Balance Ju 8,880,504 4,408,990 3,838,746 2,682,876 (146,038) Estimated En Reservations Fund Bal June 8,880,504 4,408,990 3,838,746 2,682,876 (146,038) Rev from Replacement/Renewal Levies & Income & Propert Cumulativ Fund Bal June 8,880,504 4,408,990 3,838,746 2,682,876 (146,038) Revenue from New Levies & Income & Propert Cumulative Unreserved F 8,880,504 4,408,990 3,838,746 2,682,876 (146,038) 22


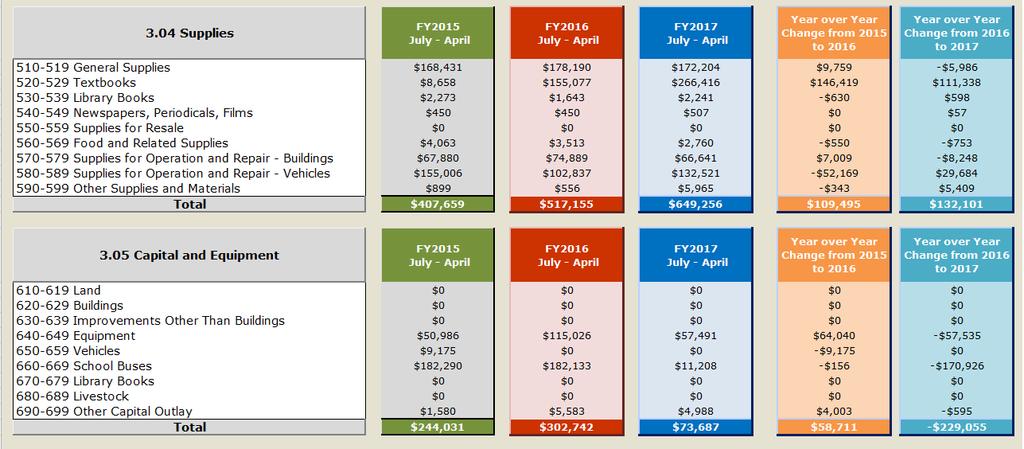
23 Supplemental Page 1 This page and the next page illustrate the revenue and expenditures for this year and the past 2 years, it compares the year over year change to date in FY15 to FY16 and in FY16 to FY17. This is helpful because it shows exactly line by line what has increase and what has decreased compared to last year and how significant the change is compared to the previous year. For example, the top line which are the receipt codes which is all local taxes the district actually received $175,573 more in FY 17 then we did in FY16 and in FY16 the district received $322,222 more than we did in FY15, the reason for which I explained in the revenue note in the assumptions. On the next page each object is illustrated so you can see that in FY17 supplies increased because there was $111,338 more spent on textbooks than there was in FY16. These are simply a deeper analysis of the revenues and expenditures on this year and a way to compare them to previous years. 23


24 Supplemental Page 2 24
Five Year Forecast Financial Report
 Five Year Forecast Financial Report October, 2017 1 Table of Contents Table of Contents 2 Executive Summary 3 PAGE # Revenue Overview 4 1.010 - General Property Tax (Real Estate) 5 1.020 - Public Utility
Five Year Forecast Financial Report
 Five Year Forecast Financial Report May, 2017 Brett Griffith, CFO 1 Table of Contents PAGE # Table of Contents 2 Executive Summary 3 Revenue Overview 4 1.010 General Property Tax (Real Estate) 5 1.020
Five Year Forecast Financial Report
 Five Year Forecast Financial Report October, 2017 1 Table of Contents Table of Contents 2 Executive Summary 3 PAGE # Revenue Overview 4 1.010 - General Property Tax (Real Estate) 5 1.020 - Public Utility
Five Year Forecast Financial Report
 LOGO CLARK SHAWNEE LOCAL SCHOOL DISTRICT CLARK COUNTY Five Year Forecast Financial Report October, 2017 1 Table of Contents Table of Contents 2 Executive Summary 3 PAGE # Revenue Overview 4 1.010 General
Five Year Forecast Financial Report
 RIVER VALLEY LOCAL SCHOOL DISTRICT MARION COUNTY Five Year Forecast Financial Report May, 2017 1 Table of Contents Table of Contents 2 Executive Summary 3 PAGE # Revenue Overview 4 1.010 General Property
Loveland City Schools
 Financial Report Five Year Forecast Update May, 2016 Public Finance Resources, 2015 1 Table of Contents Table of Contents 2 Executive Summary 3 PAGE # Revenue Overview 4 1.010 General Property Tax (Real
Five Year Forecast Financial Report
 May, 2018 RIVERSIDE LOCAL SCHOOL DISTRICT - - LAKE COUNTY Five Year Forecast Financial Report 1 Table of Contents Table of Contents 2 Executive Summary 3 PAGE # Revenue Overview 4 1.010 - General Property
Five Year Forecast Financial Report
 Five Year Forecast Financial Report October, 2017 1 Table of Contents Table of Contents 2 Executive Summary 3 PAGE # Revenue Overview 4 1.010 General Property Tax (Real Estate) 5 1.020 Public Utility Personal
Shaker Heights City Schools
 Exhibit T-3 As Approved by Board of Education 5/10/2016 Insert Logo Shaker Heights City Schools Financial Report Five Year Forecast May, 2016 Public Finance Resources, 2015 1 Shaker Heights City Schools
Five Year Forecast Financial Report
 Five Year Forecast Financial Report October, 2017 Greg Slemons, CPA Chief Financial Officer 1 Table of Contents PAGE # Table of Contents 2 Executive Summary 3 Revenue Overview 4 1.010 General Property
Clear Fork Valley LSD
 Financial Report Five Year Forecast May, 2016 Treasurer/CFO: Bradd Stevens Table of Contents PAGE # Table of Contents 2 Executive Summary 3 Revenue Overview 4 1.010 - General Property Tax (Real Estate)
Five Year Forecast Financial Report
 Five Year Forecast Financial Report May, 2018 Terrah Floyd, Interim CFO 1 Table of Contents Table of Contents 2 Executive Summary 3 PAGE # Revenue Overview 4 1.010 General Property Tax (Real Estate) 5
Five Year Forecast Financial Report
 Five Year Forecast Financial Report October, 2017 Mark Astorino, Treasurer/CFO 1 Table of Contents PAGE # Table of Contents 2 Executive Summary 3 Revenue Overview 4 1.010 General Property Tax (Real Estate)
Five Year Forecast Financial Report
 LOGO SOUTHERN LOCAL SCHOOL DISTRICT - - MEIGS COUNTY Five Year Forecast Financial Report May, 2018 1 Table of Contents Table of Contents 2 Executive Summary 3 PAGE # Revenue Overview 4 1.010 - General
Berea City School District
 Financial Report Five Year Forecast May, 2018 Public Finance Resources, 2015 1 Table of Contents Table of Contents 2 Executive Summary 3 PAGE # Revenue Overview 4 1.010 General Property Tax (Real Estate)
Five Year Forecast Financial Report
 Five Year Forecast Financial Report October, 2016 1 Table of Contents Table of Contents 2 Executive Summary 3 PAGE # Revenue Overview 4 1.010 General Property Tax (Real Estate) 5 1.020 Public Utility Personal
Five Year Forecast Financial Report
 LOGO Springboro Community City Schools Five Year Forecast Financial Report May, 2017 Terrah Floyd, CFO 1 Table of Contents Table of Contents 2 Executive Summary 3 PAGE # Revenue Overview 4 1.010 General
Five Year Forecast Financial Report
 Five Year Forecast Financial Report October, 2018 Kevin Hawley, CFO 1 Table of Contents Table of Contents 2 Forecast Summary 3 Revenue Sources and Forecast Year-Over-Year Overview 4 1.010 - General Property
Five Year Forecast Financial Report
 Five Year Forecast Financial Report October, 2016 1 Table of Contents Table of Contents 2 Executive Summary 3 PAGE # Revenue Overview 4 1.010 - General Property Tax (Real Estate) 5 1.020 - Public Utility
Five Year Forecast Financial Report
 May, 2018 TEAYS VALLEY LOCAL SCHOOL DISTRICT PICKAWAY COUNTY Five Year Forecast Financial Report 1 Table of Contents Table of Contents 2 Executive Summary 3 PAGE # Revenue Overview 4 1.010 General Property
Five Year Forecast Financial Report
 Five Year Forecast Financial Report May, 2018 1 Table of Contents Table of Contents 2 Executive Summary 3 PAGE # Revenue Overview 4 1.010 - General Property Tax (Real Estate) 5 1.020 - Public Utility Personal
Five Year Forecast Financial Report
 BRECKSVILLE-BROADVIEW HEIGHTS CITY SCHOOL DISTRICT - - CUYAHOGA COUNTY Five Year Forecast Financial Report October, 2018 Jeff Hall, CFO 1 Table of Contents Table of Contents 2 Forecast Summary 3 Revenue
Five Year Forecast Financial Report
 Exhibit T-2 As approved by Board of Education 10/09/18 LOGO Shaker Heights City Schools Five Year Forecast Financial Report October, 2018 1 Public Finance Resources, Inc. 2016 Shaker Heights City Schools
Paint Valley Local School District
 Paint Valley Local School District Financial Forecast Summary & Report May 5, 2016 Kristin O Dell, Treasurer Paint Valley Local Schools (kristin.odell@pvlsd.org) 1 Forecast Purpose This forecast is intended
FIVE-YEAR FINANCIAL FORECAST NOTES AND ASSUMPTIONS. For the Fiscal Years Ending June 30, 2014 through 2018
 FIVE-YEAR FINANCIAL FORECAST NOTES AND ASSUMPTIONS For the Fiscal Years Ending June 30, 2014 through 2018 October 19, 2013 The mission of the Dayton City Schools is to provide a high-quality education
HUDSON CITY SCHOOLS FINANCIAL REPORT. October 2014 Five-Year Forecast Update KATHRYN L. SINES TREASURER / CFO.
 HUDSON CITY SCHOOLS FINANCIAL REPORT October 2014 Five-Year Forecast Update KATHRYN L. SINES TREASURER / CFO www.sinesk@hudson.edu 1 Forecast Purpose This forecast is intended to assist the school district
Paint Valley Local School District
 Paint Valley Local School District Financial Forecast Summary & Report October 2014 Kristin O Dell, CFO Paint Valley Local Schools Kristin.odell@pvlsd.org 1 Forecast Purpose This forecast is intended to
Summary of Significant Forecast Assumptions Amanda-Clearcreek Local School District July 1, 2017 June 30, 2022 October 2017.
 Summary of Significant Forecast Assumptions Amanda-Clearcreek Local School District July 1, 2017 June 30, 2022 October 2017 Revenues: 1.010 Real Estate: This line item contains revenue collected from taxes
Springboro Community City School District
 Springboro Community City School District Updated Financial Forecast Summary & Report November 2014 Terrah Floyd, CFO tfloyd@springboro.org Forecast Purpose This forecast is intended to assist the school
Springboro Community City School District
 Springboro Community City School District Financial Forecast Summary & Report May 29, 2014 Terrah Floyd, CFO tfloyd@springboro.org 1 Forecast Purpose This forecast is intended to assist the school district
Hilliard City School District
 Hilliard City School District Five-Year Forecast For the Projected Years Ending June 30, 2018 through June 30, 2022 October 2017 Please visit the Ohio Department of Education website at ftp://ftp.ode.state.oh.us/geodoc/5-yrforecast/.
Loveland City School District
 Financial Forecast Summary & Report March 24, 2015 Brett Griffith, CFO Loveland City Schools (griffibr@lovelandschools.org) Forecast Purpose This forecast is intended to assist the school district in the
LAKEWOOD CITY SCHOOLS
 LAKEWOOD CITY SCHOOLS Financial Forecast and Summary Report May 2017 Kent R. Zeman, CPA CFO/Treasurer In Collaboration with: Lakewood Board of Education Members Mr. Jeff Patterson, Superintendent Administrative
Marietta City School District Assumptions for October year Forecast
 Marietta City School District Assumptions for October 2018 5 year Forecast Marietta City School District is articulating to users of forecasts that assumptions are the basis of any forecast. An assumption
LANCASTER CITY SCHOOL DISTRICT - - FAIRFIELD COUNTY IRN:
 LANCASTER CITY SCHOOL DISTRICT - - FAIRFIELD COUNTY IRN: 44206 Schedule of Revenues, Expenditures and Changes in Fund Balances ACTUAL AND FORECASTED OPERATING FUND Actual Forecasted Fiscal Year Fiscal
Forecast Provided By Newark City School District Treasurer's Office Julio Valladares, MBA, Treasurer/CFO
 Newark City School District Licking County SCHEDULE OF REVENUE, EXPENDITURES, AND CHANGES IN FUND BALANCES FOR THE FISCAL YEARS ENDED JUNE 30, 2015, 2016 and 2017 ACTUAL FORECASTED FISCAL YEARS ENDING
TECUMSEH LOCAL SCHOOL DISTRICT IRN # FIVE-YEAR FORECAST ASSUMPTIONS OCTOBER
 TECUMSEH LOCAL SCHOOL DISTRICT IRN #046243 2018 FIVE-YEAR FORECAST ASSUMPTIONS OCTOBER As stated on the Ohio Department of Education Five-Year Forecast Webpage: The reader should remember that a forecast
Summary of Significant Forecast Assumptions and Accounting Policies For the Fiscal Years Ending June 30, 2018 through 2022
 ONTARIO LOCAL SCHOOL DISTRICT RICHLAND COUNTY 1 Summary of Significant Forecast Assumptions and Accounting Policies For the Fiscal Years Ending June 30, 2018 through 2022 Note 1 - Nature and Limitations
NORTHRIDGE LOCAL SCHOOL DISTRICT - LICKING COUNTY SCHEDULE OF REVENUE, EXPENDITURES, AND CHANGES IN FUND BALANCES FOR THE FISCAL YEARS ENDED ACTUAL
 NORTHRIDGE LOCAL SCHOOL DISTRICT - LICKING COUNTY SCHEDULE OF REVENUE, EXPENDITURES, AND CHANGES IN FUND BALANCES FOR THE FISCAL YEARS ENDED ACTUAL JUNE 30, 2015, 2016, and 2017 FORECASTED FISCAL YEARS
7.020 Cash Balance June 30 3,709,735 4,692,492 5,469, % 5,455,806 5,183,533 4,810,736 4,205,146 3,345,106
 Ripley-Union-Lewis-Huntington S.D. Brown County Schedule of Revenues, Expenditures and Changes in Fund Balances For the Fiscal Years Ended June 30, 2015, 2016 and 2017 Actual; Forecasted Fiscal Years Ending
Licking Heights Local School District 5 Year Forecast Assumptions (FY 2013 FY 2017) Board Approved: October 24, Revenue:
 Board Approved: October 24, Revenue:") Licking Heights Local School District 5 Year Forecast Assumptions (FY 2013 FY 2017) Board Approved: October 24, 2012 Revenue: General Property Tax (Real Estate) Property values dropped 7.04% in aggregate
Licking Heights Local School District 5 Year Forecast Assumptions (FY 2013 FY 2017) Board Approved: October 24, 2012 Revenue: General Property Tax (Real Estate) Property values dropped 7.04% in aggregate
Brunswick City School District Five Year Financial Forecast Fiscal Year 2017 to Fiscal Year 2021 (Including Historical Data)
") Brunswick City School District Five Year Financial Forecast Fiscal Year 2017 to Fiscal Year 2021 (Including Historical Data) Prepared by the Office of the Treasurer/CFO 3643 Center Road Brunswick, Ohio
Brunswick City School District Five Year Financial Forecast Fiscal Year 2017 to Fiscal Year 2021 (Including Historical Data) Prepared by the Office of the Treasurer/CFO 3643 Center Road Brunswick, Ohio
Cash Balance June 30 15,940,136 15,271,647 13,479,243 12,241,640 11,698,295 10,837,831 9,756,394 8,379,673
 Whitehall City School District Schedule Of Revenue, Expenditures and Changes In Fund Balances Actual and Forecasted Operating Fund ACTUAL FORECASTED Fiscal Year Fiscal Year Fiscal Year Fiscal Year Fiscal
MARYSVILLE EXEMPTED VILLAGE SCHOOL DISTRICT- UNION COUNTY SCHEDULE OF REVENUE, EXPENDITURES, AND CHANGES IN FUND BALANCES FOR THE FISCAL YEARS ENDED
 MARYSVILLE EXEMPTED VILLAGE SCHOOL DISTRICT- UNION COUNTY SCHEDULE OF REVENUE, EXPENDITURES, AND CHANGES IN FUND BALANCES FOR THE FISCAL YEARS ENDED JUNE 30, 2014, 2015 and 2016 ACTUAL FORECASTED FISCAL
Forecast Provided By Fairborn City School District Treasurer's Office Nicole Marshall, Treasurer/CFO
 FAIRBORN CITY SCHOOL DISTRICT-GREENE COUNTY SCHEDULE OF REVENUE, EXPENDITURES, AND CHANGES IN FUND BALANCES FOR THE FISCAL YEARS ENDED JUNE 30, 2015, 2016 and 2017 ACTUAL FORECASTED FISCAL YEARS ENDING
XENIA COMMUNITY CITY SCHOOL DISTRICT-GREENE COUNTY SCHEDULE OF REVENUE, EXPENDITURES, AND CHANGES IN FUND BALANCES FOR THE FISCAL YEARS ENDED JUNE
 XENIA COMMUNITY CITY SCHOOL DISTRICT-GREENE COUNTY SCHEDULE OF REVENUE, EXPENDITURES, AND CHANGES IN FUND BALANCES FOR THE FISCAL YEARS ENDED JUNE 30, 2014, 2015 and 2016 ACTUAL FORECASTED FISCAL YEARS
Miami County, Ohio FIVE-YEAR FINANCIAL FORECAST NOTES AND ASSUMPTIONS. For the Fiscal Years Ending June 30, 2013 through 2017
 Miami County, Ohio FIVE-YEAR FINANCIAL FORECAST NOTES AND ASSUMPTIONS For the Fiscal Years Ending June 30, 2013 through 2017 May 13, 2013 General The Ohio Constitution assigns the state the responsibility
Forecast Provided By Dublin City School District Treasurer's Office Mr. Brian Kern, Treasurer/CFO. December 10, 2018 (revised)
") DUBLIN CITY SCHOOL DISTRICT - FRANKLIN COUNTY SCHEDULE OF REVENUE, EXPENDITURES, AND CHANGES IN FUND BALANCES FOR THE FISCAL YEARS ENDED JUNE 30, 2016, 2017 and 2018 ACTUAL FORECASTED FISCAL YEARS ENDING
DUBLIN CITY SCHOOL DISTRICT - FRANKLIN COUNTY SCHEDULE OF REVENUE, EXPENDITURES, AND CHANGES IN FUND BALANCES FOR THE FISCAL YEARS ENDED JUNE 30, 2016, 2017 and 2018 ACTUAL FORECASTED FISCAL YEARS ENDING
Brunswick City School District Five Year Financial Forecast Fiscal Year 2017 to Fiscal Year 2021 (Including Historical Data)
") Brunswick City School District Five Year Financial Forecast Fiscal Year 2017 to Fiscal Year 2021 (Including Historical Data) Prepared by the Office of the Treasurer/CFO Brunswick City School District 3643
Brunswick City School District Five Year Financial Forecast Fiscal Year 2017 to Fiscal Year 2021 (Including Historical Data) Prepared by the Office of the Treasurer/CFO Brunswick City School District 3643
Enclosure C-1-c. May 9, 2016
 Enclosure C-1-c May 9, 2016 WORTHINGTON CITY SCHOOL DISTRICT-FRANKLIN COUNTY SCHEDULE OF REVENUE, EXPENDITURES, AND CHANGES IN FUND BALANCES FOR THE FISCAL YEARS ENDED JUNE 30, 2013, 2014 and 2015 ACTUAL
Forecast Provided By Groveport-Madison School District Treasurer's Office John Walsh, Treasurer
 Groveport-Madison City School District Franklin County SCHEDULE OF REVENUE, EXPENDITURES, AND CHANGES IN FUND BALANCES FOR THE FISCAL YEARS ENDED JUNE 30, 2014, 2015 and 2016 ACTUAL FORECASTED FISCAL YEARS
BIG WALNUT LOCAL SCHOOL DISTRICT- DELAWARE COUNTY SCHEDULE OF REVENUE, EXPENDITURES, AND CHANGES IN FUND BALANCES FOR THE FISCAL YEARS ENDED JUNE 30,
 BIG WALNUT LOCAL SCHOOL DISTRICT- DELAWARE COUNTY SCHEDULE OF REVENUE, EXPENDITURES, AND CHANGES IN FUND BALANCES FOR THE FISCAL YEARS ENDED JUNE 30, 2015, 2016 and 2017 ACTUAL FORECASTED FISCAL YEARS
Miami County, Ohio FIVE-YEAR FINANCIAL FORECAST NOTES AND ASSUMPTIONS. For the Fiscal Years Ending June 30, 2012 through 2016
 Miami County, Ohio FIVE-YEAR FINANCIAL FORECAST NOTES AND ASSUMPTIONS For the Fiscal Years Ending June 30, 2012 through 2016 April 9, 2012 General The Ohio Constitution assigns the state the responsibility
WORTHINGTON CITY SCHOOL DISTRICT-FRANKLIN COUNTY SCHEDULE OF REVENUE, EXPENDITURES, AND CHANGES IN FUND BALANCES FOR THE FISCAL YEARS ENDED JUNE 30,
 WORTHINGTON CITY SCHOOL DISTRICT-FRANKLIN COUNTY SCHEDULE OF REVENUE, EXPENDITURES, AND CHANGES IN FUND BALANCES FOR THE FISCAL YEARS ENDED JUNE 30, 2012, 2013 and 2014 ACTUAL FORECASTED FISCAL YEARS ENDING
Cloverleaf Local School District Five-Year Financial Forecast
 Cloverleaf Local School District Five-Year Financial Forecast Jason Myers President Michael Maloney Vice President Jane Rych Board Member Jim Curran Board Member Bill Schmock Board Member James Hudson
Summary of Significant Forecast Assumptions and Accounting Policies For the Fiscal Years Ending June 30, 2013 through 2017
 ONTARIO LOCAL SCHOOL DISTRICT RICHLAND COUNTY 1 Summary of Significant Forecast Assumptions and Accounting Policies For the Fiscal Years Ending June 30, 2013 through 2017 Note 1 - Nature and Limitations
Bellefontaine City School District. Fiscal Year Five Year Forecast
 Bellefontaine City School District Fiscal Year 2018 Five Year Forecast Adopted May 21, 2018 Compiled By: Keith E. Krieger, Treasurer/CFO PURPOSE OF THE FORECAST BELLEFONTAINE CITY SCHOOL DISTRICT The five-year
EASTWOOD LOCAL SCHOOL DISTRICT
 EASTWOOD LOCAL SCHOOL DISTRICT Five Year Forecast Notes and Assumptions May 15, 2017 HOME OF THE EAGLES REVENUE ASSUMPTIONS School districts operate from three sources of tax revenue: Local Property Taxes,
MILFORD EXEMPTED VILLAGE SCHOOL DISTRICT FISCAL YEAR 2014 FIVE-YEAR FORECAST ASSUMPTIONS
 The Ohio Department of Education (ODE) requires the submission of a five year forecast of revenue and expenditures for the general operating fund of public school districts which is legally adopted by
Forecast Provided By Dublin City School District Treasurer's Office Mr. Brian Kern, Treasurer/CFO
 DUBLIN CITY SCHOOL DISTRICT-FRANKLIN COUNTY SCHEDULE OF REVENUE, EXPENDITURES, AND CHANGES IN FUND BALANCES FOR THE FISCAL YEARS ENDED JUNE 30, 2015, 2016 and 2017 ACTUAL FORECASTED FISCAL YEARS ENDING
MOHAWK LOCAL SCHOOL DISTRICT Wyandot COUNTY, OHIO IRN #050740
 MOHAWK LOCAL SCHOOL DISTRICT Wyandot COUNTY, OHIO IRN #050740 605 State Highway 231 Sycamore, Ohio 44882 FIVE YEAR FINANCIAL FORECAST FISCAL 2012-2016 Prepared by Treasurer, Roy B. Swartz, CPA October
Northwest Local School District (Hamilton County) 5-Year Forecast Assumptions May 11, 2015
 5-Year Forecast Assumptions May 11, 2015") Northwest Local School District (Hamilton County) 5-Year Forecast Assumptions May 11, 2015 Disclaimers The 5-year forecast for Northwest Local School District (Hamilton County) is derived from the last
Northwest Local School District (Hamilton County) 5-Year Forecast Assumptions May 11, 2015 Disclaimers The 5-year forecast for Northwest Local School District (Hamilton County) is derived from the last
Change
 CLEARVIEW LOCAL SCHOOL DISTRICT Lorain County Schedule of Revenues, Expenditures and Changes in Fund Balances For the Fiscal Years Ended June 30, 2015, 2016, and 2017 Actual Forecasted Fiscal Years Ending
DUBLIN CITY SCHOOL DISTRICT - FRANKLIN COUNTY
 DUBLIN CITY SCHOOL DISTRICT - FRANKLIN COUNTY SCHEDULE OF REVENUE, EXPENDITURES, AND CHANGES IN FUND BALANCES FOR THE FISCAL YEARS ENDED ACTUAL JUNE 30, 2014, 2015, 2016 FORECASTED FISCAL YEARS ENDING
Public School Finance 101
 Public School Finance 101 FREQUENTLY ASKED QUESTIONS When were new operating tax levies passed in the Eastwood district? Continuing Operating Property Tax Levies were passed by district voters in 1976,
Harrison Hills City School District Treasurer's Office Roxane Harding, Treasurer
 HARRISON HILLS CITY SCHOOL DISTRICT HARRISON COUNTY SCHEDULE OF REVENUE, EXPENDITURES, AND CHANGES IN FUND BALANCES FOR THE FISCAL YEARS ENDED JUNE 30, 2011, 2012 and 2013 ACTUAL FORECASTED FISCAL YEARS
HUBER HEIGHTS CITY SCHOOL DISTRICT MONTGOMERY COUNTY SCHEDULE OF REVENUE, EXPENDITURES, AND CHANGES IN FUND BALANCES FOR THE FISCAL YEARS ENDED JUNE
 HUBER HEIGHTS CITY SCHOOL DISTRICT MONTGOMERY COUNTY SCHEDULE OF REVENUE, EXPENDITURES, AND CHANGES IN FUND BALANCES FOR THE FISCAL YEARS ENDED JUNE 30, 2016, 2017 and 2018 ACTUAL FORECASTED FISCAL YEARS
Mansfield City School District Richland County, Ohio
 Richland County, Ohio Fiscal Emergency Termination Local Government Services Section Richland County Fiscal Emergency Termination Table of Contents Certification... 3 Report on Termination of the Financial
Copley-Fairlawn City Schools, Summit County Five Year Forecast Assumptions May, 2011
 Copley-Fairlawn City Schools, Summit County Five Year Forecast Assumptions May, 2011 The Copley-Fairlawn City School District has achieved Excellent with Distinction status as measured and reported in
The Notes To The Five Year Forecast Are An Integral Part Of This Presentation.
 ACTUAL ACTUAL ACTUAL ACTUAL ACTUAL ESTIMATED ESTIMATED ESTIMATED ESTIMATED ESTIMATED 7/06-6/07 7/07-6/08 7/08-6/09 7/09-6/10 7/10-6/11 7/11-6/12 7/12-6/13 7/13-6/14 7/14-6/15 7/15-6/16 OPERATING REVENUES:
LAKOTA LOCAL SCHOOL DISTRICT-BUTLER COUNTY SCHEDULE OF REVENUE, EXPENDITURES, AND CHANGES IN FUND BALANCES FOR THE FISCAL YEARS ENDED JUNE 30, 2013,
 LAKOTA LOCAL SCHOOL DISTRICT-BUTLER COUNTY SCHEDULE OF REVENUE, EXPENDITURES, AND CHANGES IN FUND BALANCES FOR THE FISCAL YEARS ENDED JUNE 30, 2013, 2014 and 2015 ACTUAL FORECASTED FISCAL YEARS ENDING
CINCINNATI CITY SCHOOL DISTRICT-HAMILTON COUNTY SCHEDULE OF REVENUES, EXPENDITURES, AND CHANGES IN FUND BALANCES FOR THE FISCAL YEARS ENDED JUNE 30,
 CINCINNATI CITY SCHOOL DISTRICT-HAMILTON COUNTY SCHEDULE OF REVENUES, EXPENDITURES, AND CHANGES IN FUND BALANCES FOR THE FISCAL YEARS ENDED JUNE 30, 2013, 2014 and 2015 ACTUAL FORECASTED FISCAL YEARS ENDING
LAKOTA LOCAL SCHOOL DISTRICT-BUTLER COUNTY SCHEDULE OF REVENUE, EXPENDITURES, AND CHANGES IN FUND BALANCES FOR THE FISCAL YEARS ENDED JUNE 30, 2014,
 LAKOTA LOCAL SCHOOL DISTRICT-BUTLER COUNTY SCHEDULE OF REVENUE, EXPENDITURES, AND CHANGES IN FUND BALANCES FOR THE FISCAL YEARS ENDED JUNE 30, 2014, 2015 and 2016 ACTUAL FORECASTED FISCAL YEARS ENDING
Loveland City Schools FY Revenue
 FREQUENTLY ASKED QUESTIONS 1. Where does the Loveland City School District revenue come from? In Ohio, the funding of schools is shared by the state and local school districts. The Ohio General Assembly
Tipp City Exempted Village Schools. Miami County
 Tipp City Exempted Village Schools Miami County Assumptions for Five-Year Financial Forecast Projected Fiscal years June 30, 2014 through June 30, 2018 Forecast provided by: Tipp City Exempted Village
LICKING HEIGHTS LOCAL SCHOOL DISTRICT LICKING COUNTY, OHIO
 FINANCIAL FORECAST NOTES OCTOBER 2015 Nick Roberts, CFO/Treasurer njroberts@laca.org Licking Heights Five Year Forecast FISCAL YEAR 2016 Actual Forecasted 2013 2014 2015 2016 2017 2018 2019 2020 1.010
Miami Trace Local School District Fayette County Actual Forecasted Revenues Other Financing Sources Expenditures Other Financing Uses
 Miami Trace Local School District Fayette County Schedule of Revenues, Expenditures and Changes in Fund Balances For the Fiscal Years Ended June 30, 2015, 2016 and 2017 Actual; Forecasted Fiscal Years
Riverside Local School District
 Riverside Local School District Five Year Forecast Presentation October 22, 2018 Presented by: Gary A. Platko Guidance The Ohio Department of Education (ODE) has developed a guide to assist teachers, administrators,
Popular Annual Financial Report
 H I L L I A R D C I T Y S C H O O S L Popular Annual Financial Report FOR THE YEAR ENDING JUNE 30, 2015 COLUMBUS, OHIO Numbers Behind Hilliard City Schools EMPLOYEES STUDENTS 2015 GRADUATES 1,695 16,045
Forecast Provided By Trotwood-Madison City School District Treasurer's Office Janice Allen, Treasurer
 Trotwood-Madison City School District Montgomery County SCHEDULE OF REVENUE, EXPENDITURES, AND CHANGES IN FUND BALANCES FOR THE FISCAL YEARS ENDED JUNE 30, 2011, 2012 and 2013 ACTUAL FORECASTED FISCAL
Five Year Plan Assumptions For Fiscal Years Ending June 30, 2016 Through 2020
 Five Year Plan Assumptions For Fiscal Years Ending June 30, 2016 Through 2020 Non Controllable Forecast Variables: Forecast Variables: State Funding Student Enrollment Educational Needs of Students Property
Copley-Fairlawn City Schools, Summit County Five Year Forecast Assumptions October, 2011
 Copley-Fairlawn City Schools, Summit County Five Year Forecast Assumptions October, 2011 The Copley-Fairlawn City School District has achieved Excellent status as measured and reported in the state issued
Ferndale School District #502 Business and Support Services Budget Summary Citizens' Budget General Fund
 Ferndale School District #502 Business and Support Services 2018-19 Budget Summary Citizens' Budget General Fund 7/31/2018 Prepared by: Mark Deebach, Assistant Superintendent for Business & Support Services
UPPER SCIOTO VALLEY LOCAL SCHOOL DISTRICT-HARDIN COUNTY SCHEDULE OF REVENUE, EXPENDITURES, AND CHANGES IN FUND BALANCES FOR THE FISCAL YEARS ENDED
 UPPER SCIOTO VALLEY LOCAL SCHOOL DISTRICT-HARDIN COUNTY SCHEDULE OF REVENUE, EXPENDITURES, AND CHANGES IN FUND BALANCES FOR THE FISCAL YEARS ENDED JUNE 30, 2015, 2016 and 2017 ACTUAL FORECASTED FISCAL
CUYAHOGA HEIGHTS LOCAL SCHOOL DISTRICT CUYAHOGA COUNTY REGULAR AUDIT
 CUYAHOGA HEIGHTS LOCAL SCHOOL DISTRICT CUYAHOGA COUNTY REGULAR AUDIT FOR THE YEAR ENDED JUNE 30, 2014 CUYAHOGA HEIGHTS LOCAL SCHOOL DISTRICT CUYAHOGA COUNTY TABLE OF CONTENTS TITLE PAGE Independent Auditor
Piqua City School District 719 East Ash Street Piqua, Ohio ASSUMPTIONS TO THE FIVE-YEAR FORECAST May 2018
 Piqua City School District 719 East Ash Street Piqua, Ohio 45356 ASSUMPTIONS TO THE FIVE-YEAR FORECAST May 2018 INTRODUCTION TO FIVE YEAR FORECAST All school districts in Ohio are required to file a five
Piqua City School District 719 East Ash Street Piqua, Ohio ASSUMPTIONS TO THE FIVE-YEAR FORECAST October 2013
 Piqua City School District 719 East Ash Street Piqua, Ohio 45356 ASSUMPTIONS TO THE FIVE-YEAR FORECAST October 2013 INTRODUCTION TO FIVE YEAR FORECAST All school districts in Ohio are required to file
ANNUAL SCHOOL BUDGET
 FORM SBM-1 The University of the State of New York THE STATE EDUCATION DEPARTMENT Room 876 Education Building Annex Albany, New York 12234 - - SCHOOL DISTRICT CODE: (FOR DEPT. USE) ANNUAL SCHOOL BUDGET
LAKOTA LOCAL SCHOOL DISTRICT-BUTLER COUNTY SCHEDULE OF REVENUE, EXPENDITURES, AND CHANGES IN FUND BALANCES FOR THE FISCAL YEARS ENDED JUNE 30, 2013,
 LAKOTA LOCAL SCHOOL DISTRICT-BUTLER COUNTY SCHEDULE OF REVENUE, EXPENDITURES, AND CHANGES IN FUND BALANCES FOR THE FISCAL YEARS ENDED JUNE 30, 2013, 2014 and 2015 ACTUAL FORECASTED FISCAL YEARS ENDING
Cleveland Municipal School District
 Cleveland Municipal School District Five Year Financial Forecast October 2015 1 Five Year Forecast -Contents Major Assumptions General Fund Revenues General Fund Expenditures Five Year Forecast Summary
Northwest Local School District (Hamilton County) 5-Year Forecast Assumptions May 27, 2011
 5-Year Forecast Assumptions May 27, 2011") Northwest Local School District (Hamilton County) 5-Year Forecast Assumptions May 27, 2011 Disclaimers The 5-year forecast for Northwest Local School District (Hamilton County) is derived from the last
Northwest Local School District (Hamilton County) 5-Year Forecast Assumptions May 27, 2011 Disclaimers The 5-year forecast for Northwest Local School District (Hamilton County) is derived from the last
GLOSSARY OF SCHOOL FINANCE TERMS
 GLOSSARY OF SCHOOL FINANCE TERMS Any study of school finance can be confusing because of the enormous number of technical terms used in describing the process. The following is a glossary of the terms
CARLISLE LOCAL SCHOOL DISTRICT WARREN COUNTY TABLE OF CONTENTS. Independent Accountants Report Management s Discussion and Analysis...
 WARREN COUNTY TABLE OF CONTENTS TITLE PAGE Independent Accountants Report... 1 Management s Discussion and Analysis... 3 Basic Financial Statements: Government-Wide Financial Statements: Statement of Net
Financial Readiness for Leaders
 Financial Readiness for Leaders Prepared by: Public Finance Resources, Inc. In today s era of uncertainty, the data contained in this report will provide you with the tools and training needed to maximize
in the main office and
 TO: DATE: FROM: Dr. Scottt Helton Board of Education September 14, 2013 Mr. Edward Hoster RE: Fiscal Year 2013-14 Budget and Resolution for Adoption At the June 24, 2013 Board of Education Meeting the
North Olmsted City Schools Major Assumptions Used in the Preparation of the Five-Year Forecast Prepared October 12, 2017
 North Olmsted City Schools Major Assumptions Used in the Preparation of the Five-Year Forecast Prepared October 12, 2017 Financial Summary Enclosed is a summary of major assumptions used in the preparation
Findlay City School District Hancock County Five Year Forecast for Fiscal Years 2016 through 2023
 Findlay City School District Hancock County Five Year Forecast for Fiscal Years 2016 through 2023 Actual Forecasted Fiscal Year Fiscal Year Fiscal Year Average Fiscal Year Fiscal Year Fiscal Year Fiscal
NORTHSHORE SCHOOL DISTRICT BUDGET SUMMARY
 THE BUDGET CONSISTS OF FIVE SEPARATE FUNDS GENERAL FUND The general fund is used to account for all financial resources except those required to be accounted for in another fund. Revenues for the general
Excess of Revenues/Other Fin. Sources Over/(Under) Exp. and Other Fin. Uses 0 0 5,543,050-24,512, ,000- Fund Summary Page
 Exp. and Other Fin. Uses 0 0 5,543,050-24,512, ,000- Fund Summary Page") BUDGET AND EXCESS LEVY SUMMARY - FISCAL YEAR 2003-2004 SECTION A: BUDGET SUMMARY Associated Debt Capital Transportation General Student Body Service Projects Vehicle Fund Fund Fund Fund Fund Total Revenues
BUDGET AND EXCESS LEVY SUMMARY - FISCAL YEAR 2003-2004 SECTION A: BUDGET SUMMARY Associated Debt Capital Transportation General Student Body Service Projects Vehicle Fund Fund Fund Fund Fund Total Revenues
LACENTER SCHOOL DISTRICT No. 101 RUN NOV 02, 10:26 BUDGET AND EXCESS LEVY SUMMARY - FISCAL YEAR
 BUDGET AND EXCESS LEVY SUMMARY - FISCAL YEAR 2006-2007 SECTION A: BUDGET SUMMARY Associated Debt Capital Transportation General Student Body Service Projects Vehicle Fund Fund Fund Fund Fund Total Revenues