Shaker Heights City Schools
|
|
|
- Valerie Jemima Norman
- 5 years ago
- Views:
Transcription
1 Exhibit T-3 As Approved by Board of Education 5/10/2016 Insert Logo Shaker Heights City Schools Financial Report Five Year Forecast May, 2016 Public Finance Resources,
2 Shaker Heights City Schools Table of Contents Table of Contents 2 Executive Summary 3 PAGE # Revenue Overview General Property Tax (Real Estate) Public Utility Personal Property Income Tax Unrestricted Grants-in-Aid & Restricted Grants-in-Aid Property Tax Allocation All Other Operating Revenues Total Other Financing Sources 12 Expenditures Overview Personnel Services Employee Benefits Purchased Services Supplies and Materials Capital Outlay Intergovernmental & Debt Other Objects Total Other Financing Uses 21 Forecast Compare 22 Five Year Forecast 23 Forecast Purpose/Objectives Ohio Department of Education's purposes/objectives for the five-year forecast are: To engage the local board of education and the community in the long range planning and discussions of financial issues facing the school district. To serve as a basis for determining the school district's ability to sign the certificate required by O.R.C , commonly known as the "412 certificate. To provide a method for the Department of Education and Auditor of State to identify school districts with potential financial problems. Public Finance Resources,
 (95,631,775)")
3 Shaker Heights City Schools Executive Summary Fiscal Year Fiscal Year Fiscal Year Fiscal Year Fiscal Year Beginning Balance 31,941,176 39,063,470 42,668,980 43,726,490 42,270,100 + Revenue 98,577,592 99,237,285 99,301,285 99,524,285 99,401,285 + Proposed Renew/Replacement Levies Proposed New Levies Expenditures (91,455,298) (95,631,775) (98,243,775) (100,980,675) (105,016,125) = Revenue Surplus or Deficit 7,122,294 3,605,510 1,057,510 (1,456,390) (5,614,840) Ending Balance 39,063,470 42,668,980 43,726,490 42,270,100 36,655,260 Revenue Surplus or Deficit w/o Levies 7,122,294 3,605,510 1,057,510 (1,456,390) (5,614,840) Ending Balance w/o Levies 39,063,470 42,668,980 43,726,490 42,270,100 36,655,260 Executive Summary: With this forecast, the District continues to generate an operating excess of revenues over expenditures through Fiscal 2018, after which expenditures begin to exceed revenues. Fund balance is reduced to 29.6% of total expenditures by the end of Fiscal 2020 from a projected peak of 38.8% in Fiscal 2017 & At this time there is no projected operating levy presumed during the forecast period. $120,000,000 $100,000,000 Revenue vs. Expenditures $91,455,298 $95,631,775 $98,243,775 $100,980,675 $105,016,125 $80,000,000 $60,000,000 $40,000,000 $20,000,000 $98,577,592 $99,237,285 $99,301,285 $99,524,285 $99,401, Revenue Renew/Replacement Levies New Levies Expenditures Public Finance Resources,


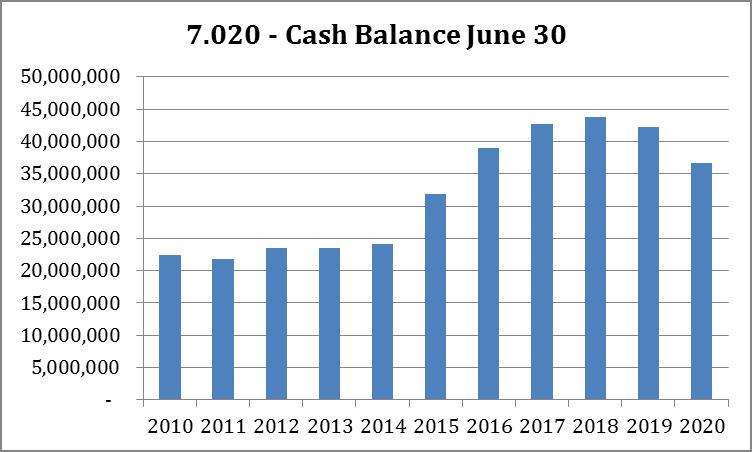
4 Operating Revenue and Expenditures & Year End Fund Balance Shaker Heights City Schools $120,000,000 $100,000,000 $80,000,000 $60,000,000 $40,000,000 $20,000, Total Revenue Total Expenditures Cash Balance June 30 ACTUAL FORECASTED Total Revenue 88,389,457 90,413,224 95,303,674 98,577,592 99,237,285 99,301,285 99,524,285 99,401, Total Expenditures 88,204,869 87,379,950 87,215,681 90,810,298 95,361,775 97,948, ,660, ,671, Cash Balance June 30 23,486,173 24,073,183 31,941,176 39,063,470 42,668,980 43,726,490 42,270,100 36,655,260
5
6
7


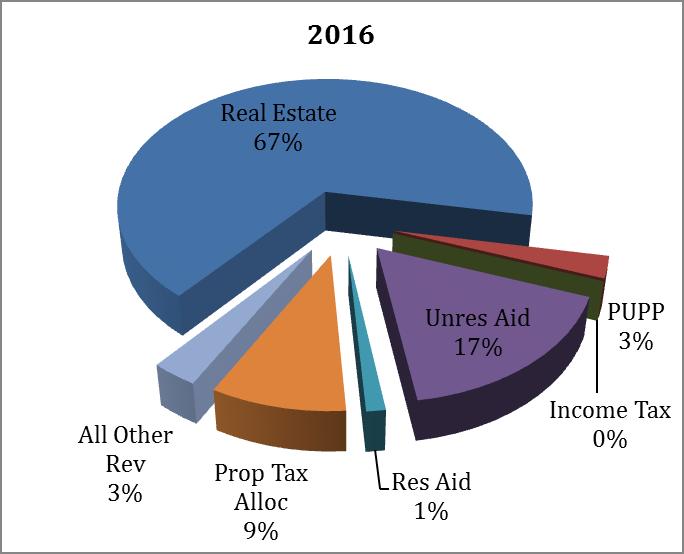
8 Shaker Heights City Schools Revenue Overview Prev. 5-Year PROJECTED 5-Year Avg. Annual Fiscal Year Fiscal Year Fiscal Year Fiscal Year Fiscal Year Avg. Annual Change Change Revenue: Real Estate 2.01% 4.25% 0.00% 0.00% 0.00% 0.00% 0.85% Public Utility % % 0.00% 0.00% 0.00% 0.00% -2.04% Income Tax n/a n/a n/a n/a n/a n/a n/a State Funding 3.25% 6.85% 6.22% 0.00% 0.00% 0.00% 2.61% Restr Aid % % 0.86% 0.85% 0.84% 0.84% -8.15% Restr Federal SFSF % n/a n/a n/a n/a n/a n/a Property Tax Alloc 2.22% -0.25% 0.00% 0.00% 0.00% 0.00% -0.05% All Other Operating R -0.12% 37.83% % 1.97% 7.71% -4.52% 6.05% Total Revenue 2.21% 3.44% 0.67% 0.06% 0.22% -0.12% 0.85% Total Other Financing n/a n/a n/a n/a n/a n/a n/a Total Revenues and Oth 2.21% 3.44% 0.67% 0.06% 0.22% -0.12% 0.85% Fiscal 2016 and subsequent fiscal years reflect the collection of the second half or about $2.6 million of the new operating levy amount which began in January Increase in State Foundation funding due to new State budget bill. Reduction in State Restricted Aid due to expected return to annual payments of catastrophic aid Real Estate 66.3% 66.3% Public Utility 3.0% 2.6% Real Estate Income Tax 66.3% State Funding 18.9% 19.2% Prop Tax Alloc 9.4% 9.0% All Othr Op Re 2.4% 2.8% Public Othr Sources Utility 3.0% Prop Tax State Alloc Funding 9.4% 18.9% Real Estate 66.3% 2020 Prop Tax Alloc 9.0% State Funding 19.2% Public Utility 2.6% Othr Sources All Othr Op Rev 2.4% Income Tax Othr Sources All Othr Op Rev 2.8% Income Tax Public Finance Resources,
9 General Property Tax (Real Estate) Shaker Heights City Schools Revenue collected from taxes levied by a school district by the assessed valuation of real property using effective tax rates for class I (residential/agricultural) and class II (business). FY Real Estate as a % of Total Revenue FY Rea % $70,000,000 $60,000,000 $50,000,000 $40,000,000 $30,000,000 $20,000,000 $10,000,000 General Property Tax (Real Estate) Actual and Projected $58,306,411 $61,348,484 $61,138,496 $60,663,636 $63,215,714 $65,900,000 $65,900,000 $65,900,000 $65,900,000 $65,900,000 Collection of the other half or about $2.6 million of the new operating levy which began January No Decline in Property Tax Assessed Valuation. No projected operating levy included in this forecast. 6.0% Year-over-Year Revenue Trend 5.0% 4.0% 3.0% 2.0% 1.0% 2.01% 0.85% -1.0% -2.0% Year-over-Year Revenue Variance Actual 5-Year Average Projected 5-Year Average Public Finance Resources,
10 Public Utility Personal Property Revenue generated from public utility personal property valuations multiplied by the district's full voted tax rate. Shaker Heights City Schools FY Public Utility as a FY 2015 % of - Pub Total Revenue [PERC ENTAG E] $4,000,000 $3,500,000 $3,000,000 $2,500,000 $2,000,000 $1,500,000 $1,000,000 $500,000 Tangible Personal Property Tax Actual and Projected $2,043,378 $2,033,595 $2,143,982 $3,524,862 $2,895,898 $2,600,000 $2,600,000 $2,600,000 $2,600,000 $2,600,000 This line reflects the breakout of the Public Utility Tangible payments previously included with the real estate tax revenues. Note Fiscal 2014 & 2015 included the $1.2 million and $181,460, respectively of non-recurring delinquent tangible personal property settlement payments. Year-over-Year Revenue Trend % -2.04% Year-over-Year Revenue Variance Actual 5-Year Average Projected 5-Year Average Public Finance Resources,
11 Income Tax Shaker Heights City Schools Revenue collected from income tax earmarked specifically to support schools with a voter approved tax by residents of the school district; separate from federal, state and municipal income taxes. FY Income Tax as a % FY 2015 of - Inco Total Revenue 0 $1 $1 $1 $1 $1 $1 Income Tax Actual and Projected N/A for the District % Year-over-Year Revenue Trend 0.00% Year-over-Year Revenue Variance Actual 5-Year Average Projected 5-Year Average Public Finance Resources,
12 Shaker Heights City Schools Unrestricted Grants-in-Aid Funds received through the State Foundation Program with no restriction. FY Unres State Aid as a % of Total Revenue FY Unr % $20,000,000 $18,000,000 $16,000,000 $14,000,000 $12,000,000 $10,000,000 $8,000,000 $6,000,000 $4,000,000 $2,000,000 Unrestricted Grants-in-Aid Actual and Projected $12,940,373 $12,760,883 $13,127,080 $14,140,592 $15,683,307 $16,758,307 $17,800,000 $17,800,000 $17,800,000 $17,800,000 Increase in State Foundation funding due to new State biennial budget bill, House Bill No. 64, of $1.1 million in Fiscal 2016 and another $1.0 million in Fiscal Assumption of continuation of Fiscal 2017 amount after end of current biennium. 12.0% 1 8.0% 6.0% 4.0% 2.0% -2.0% -4.0% -6.0% Year-over-Year Revenue Trend 2.61% 3.25% Year-over-Year Revenue Variance Actual 5-Year Average Projected 5-Year Average Public Finance Resources,
13 1.040 & Restricted Grants-in-Aid Funds received through the State Foundation Program or other allocations that are restricted for specific purposes. Shaker Heights City Schools FY Rest State Aid as a % of Total Revenue FY Res 0 2.4% $4,500,000 $4,000,000 $3,500,000 $3,000,000 $2,500,000 $2,000,000 $1,500,000 $1,000,000 $500,000 Restricted Grants-in-Aid Actual and Projected $4,278,827 $1,497,591 $551,136 $276,534 $2,299,171 $1,284,000 $1,295,000 $1,306,000 $1,317,000 $1,328,000 Reduction in State Restricted Aid due to expected return to single annual payments of catastrophic aid in Fiscal Year-over-Year Revenue Trend -8.15% % Year-over-Year Revenue Variance Actual 5-Year Average Projected 5-Year Average Public Finance Resources,
14 Property Tax Allocation Shaker Heights City Schools Includes funds received for Tangible Personal Property Tax Reimbursement, Electric Deregulation, Homestead and Rollback. FY Prop Tax Allocation as a % of Total Revenue FY Pro 0 9.4% $10,000,000 $9,000,000 $8,000,000 $7,000,000 $6,000,000 $5,000,000 $4,000,000 $3,000,000 $2,000,000 $1,000,000 Property Tax Allocation Actual and Projected $8,624,596 $9,057,675 $9,043,942 $8,975,200 $8,967,738 $8,945,285 $8,945,285 $8,945,285 $8,945,285 $8,945,285 Due to State change in the previous State budget bill, there is no increase in Homestead Exemption RollBack (HERB) payments from the State for levies after 2013, thus no change projected in this item from current levels. 8.0% 7.0% 6.0% 5.0% 4.0% 3.0% 2.0% 1.0% -1.0% -2.0% Year-over-Year Revenue Trend 2.22% -0.05% Year-over-Year Revenue Variance Actual 5-Year Average Projected 5-Year Average Public Finance Resources,
15 All Other Operating Revenues Shaker Heights City Schools Operating revenue sources not included in other lines; examples include tuition, fees, earnings on investments, rentals, and donations. FY Other Operating Revenue as a % of Total FY Oth 0 Revenue 2.4% $3,500,000 $3,000,000 $2,500,000 $2,000,000 All Other Operating Revenue Actual and Projected $1,500,000 $1,000,000 $500,000 $1,977,010 $1,984,232 $2,384,821 $2,832,400 $2,241,846 $3,090,000 $2,697,000 $2,750,000 $2,962,000 $2,828,000 Fiscal 2014 included.7 million of Medicaid reimbursement settlement payments for Fiscal 2010 & 2011, not recurring in Fiscal The projected Fiscal 2016 receipts include the estimated Fiscal 2012 settlement payment. 5 Year-over-Year Revenue Trend % % -2-3 Year-over-Year Revenue Variance Actual 5-Year Average Projected 5-Year Average Public Finance Resources,
16 Total Other Financing Sources Shaker Heights City Schools Includes proceeds from sale of notes, state emergency loans and advancements, operating transfers-in, and all other financing sources like sale and loss of assets, and refund of prior year expenditures. FY Other Financing Sources as a % of Total FY Oth Revenue $1 $1 $1 $1 $1 $1 Other Operating Financing Sources Actual and Projected N/A for the District at this time % Year-over-Year Revenue Trend 0.00% Year-over-Year Expenditure Variance Actual 5-Year Average Projected 5-Year Average Public Finance Resources,
17
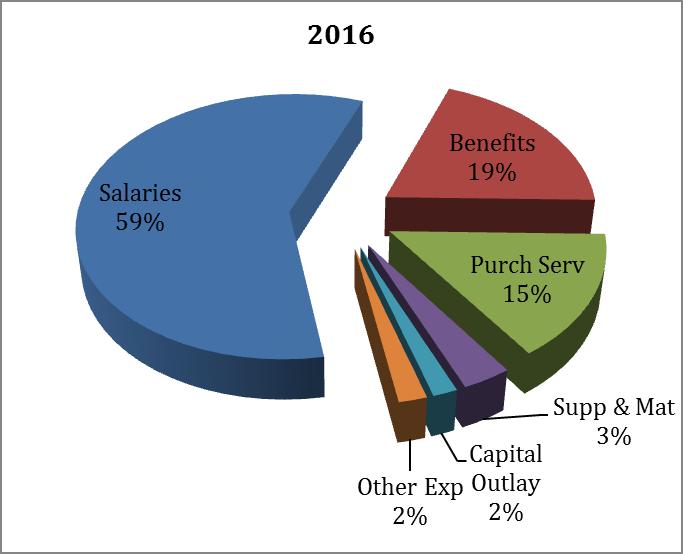
18 Shaker Heights City Schools Expenditures Overview Prev. 5-Year PROJECTED 5-Year Avg. Annual Fiscal Year Fiscal Year Fiscal Year Fiscal Year Fiscal Year Avg. Annual Change Change Revenue: Salaries -0.43% 4.45% 3.67% 3.19% 3.09% 3.11% 3.50% Benefits -2.31% 4.81% 7.38% 6.37% 6.47% 6.71% 6.35% Purchased Services -0.66% 3.45% 5.11% 4.29% 2.97% 3.65% 3.89% Supplies & Materials 2.11% -0.95% 8.24% -4.59% 1.58% 1.56% 1.17% Capital Outlay 25.24% 10.55% 5.00% 5.01% 5.02% 5.01% 6.12% Intergov n/a n/a n/a n/a % 2.00% 52.00% Debt n/a % 11.29% % % 2.30% -9.68% Other Objects 8.32% % 16.37% 4.46% 4.43% 4.46% 3.46% Total Expenditures -0.50% 4.12% 5.01% 2.71% 2.77% 3.98% 3.72% Total Other Financing % % % 9.26% 8.47% 7.81% 32.12% Total Expenditures and -0.55% 4.60% 4.57% 2.73% 2.79% 4.00% 3.74% Expenditures reflect the salary & wage growth in accordance with the collective bargaining agreement settlements, replacement savings from retirees and other terminations, added positions, expected increases in related fringe benefits and other District operating expenditures. Also reflected are new continuing budget savings of $1.0 million in each of Fiscal Years 2018 and 2019 (note-fiscal 2016 & 2017 savings have been identified and reflected in respective expense line items) Salaries 58.2% 57.6% Benefits 19.4% 21.9% Purch Salaries Serv 15.1% 15.2% Supp & 58.2% Mat 3.5% 3.0% Capital Outlay 1.6% 1.7% Intergov & Deb 0.1% -1.7% Othr Objects 1.9% Benefits 1.9% 19.4% Othr Uses 0.3% 0.3% Salaries 55.7% 2020 Benefits 21.2% Othr Uses 0.3% Othr Objects Intergov 1.9% & Debt 0.1% Capital Outlay 1.6% Purch Serv 15.1% Supp & Mat 3.5% Othr Uses 0.3% Othr Objects 1.8% Intergov & Debt Capital -1.6% Outlay 1.7% Purch Serv 14.7% Supp & Mat 2.9% Public Finance Resources,
19 Shaker Heights City Schools Personnel Services Employee salaries and wages, including extended time, severance pay, supplemental contracts, etc. FY Salaries as a % of Total Expenditures FY Sala % $70,000,000 $60,000,000 $50,000,000 $40,000,000 $30,000,000 $20,000,000 $10,000,000 Personnel Services Actual and Projected $51,139,605 $50,210,780 $50,745,269 $50,647,786 $50,924,709 $53,192,000 $55,144,000 $56,901,000 $58,661,000 $60,483,000 Reflects economic provisions of current collective bargaining agreements, including SHTA, OAPSE-Clerical, OAPSE-Security & Local 200 three-year contracts. Major Growth Rates Used-Payroll SHTA 3, 2.5, & 2.5% base salary increases effective 1/1/15, 16 & 17, respectively per new contract; All Others 2, 2 & 2% base salary increases effective 7/1/15, 16 & 17, respectively; Beyond last year of contracts, assumed 2%/year base salary growth plus steps; Reflects replacement savings from retirements and other terminations, as well as added positions. 5.0% 4.0% 3.0% 2.0% 1.0% Year-over-Year Expenditure Trend 3.50% -1.0% -2.0% -3.0% -0.43% Year-over-Year Expenditure Variance Actual 5-Year Average Projected 5-Year Average Public Finance Resources,
20 Employees' Benefits Shaker Heights City Schools Retirement for all employees, Workers Compensation, early retirement incentives, Medicare, unemployment, pickup on pickup, and all health-related insurances. FY Benefits as a % of Total Expenditures FY Ben 0 $25,000,000 $20,000,000 Employees' Benefits/Insurance Benefits Actual and Projected 19.4% $15,000,000 $10,000,000 $5,000,000 $19,851,154 $19,029,788 $17,578,940 $16,991,881 $16,919,876 $17,733,800 $19,042,300 $20,254,800 $21,565,300 $23,011,900 Major Growth Rates Used Health Care 10% (primarily due to current healthcare trend rates) in F16 and beyond based upon current recommendation from District insurance consultants. In accordance with new collective bargaining agreements, pojected years include estimated savings for the prescription drug changes implemented beginning July 2015 for the teachers and October 2015 for substantially all other employee groups % 6.0% 4.0% 2.0% -2.0% -4.0% -6.0% -8.0% -1 Year-over-Year Expenditure Trend 6.35% -2.31% Year-over-Year Expenditure Variance Actual 5-Year Average Projected 5-Year Average Public Finance Resources,
21 Purchased Services Shaker Heights City Schools Amounts paid for personal services rendered by personnel who are not on the payroll of the school district, and other services which the school district may purchase. FY Purchased Services as a % of Total Expenditures FY Pur % $18,000,000 $16,000,000 $14,000,000 $12,000,000 $10,000,000 $8,000,000 $6,000,000 $4,000,000 $2,000,000 Purchased Services Actual and Projected $12,910,557 $12,148,209 $13,205,518 $13,517,019 $13,196,942 $13,652,600 $14,350,600 $14,965,600 $15,409,600 $15,971,600 Major Growth Rates Used Out-of-District Tuition 5%; Out-of-District Transportation 5%; Repairs & Maintenance 4%; Gas 4% & Electricity 3%. Utilities: Natural 1 8.0% 6.0% 4.0% 2.0% -2.0% -4.0% -6.0% -8.0% Year-over-Year Expenditure Trend 3.89% -0.66% Year-over-Year Expenditure Variance Actual 5-Year Average Projected 5-Year Average Public Finance Resources,
22 Supplies & Materials Shaker Heights City Schools Expenditures for general supplies, instructional materials including textbooks and media material, bus fuel and tires, and all other maintenance supplies. FY Supplies & Materials as a % of Total FY Sup Expenditures 0 3.5% $3,500,000 $3,000,000 $2,500,000 $2,000,000 Supplies & Materials Actual and Projected $1,500,000 $1,000,000 $500,000 $2,491,226 $2,726,307 $3,331,501 $2,867,264 $3,027,687 $2,999,000 $3,246,000 $3,097,000 $3,146,000 $3,195,000 Major Growth Rates Used Bus Fuel 5% (including an additional allotment to cover any major price fluctuations); Also reflects cyclical textbook replacements. 25.0% % 1 5.0% -5.0% % -2 Year-over-Year Expenditure Trend 1.17% 2.11% Year-over-Year Expenditure Variance Actual 5-Year Average Projected 5-Year Average Public Finance Resources,
23 Capital Outlay Shaker Heights City Schools This line includes expenditures for items having at least a five-year life expectancy, such as land, buildings, improvements of grounds, equipment, computers/technology, furnishings, and buses. FY Capital Outlay as a % of Total Expenditures FY Cap 0 1.6% $2,000,000 $1,800,000 $1,600,000 $1,400,000 $1,200,000 $1,000,000 $800,000 $600,000 $400,000 $200,000 Capital Outlay Actual and Projected $582,184 $1,029,542 $1,755,200 $1,572,532 $1,357,753 $1,501,000 $1,576,000 $1,655,000 $1,738,000 $1,825,000 Assumes a 5% growth in capital outlay expenditures Year-over-Year Expenditure Trend 25.24% 6.12% Year-over-Year Expenditure Variance Actual 5-Year Average Projected 5-Year Average Public Finance Resources,
24 Intergovernmental & Debt Shaker Heights City Schools These lines account for pass through payments, as well as monies received by a district on behalf of another governmental entity, plus principal and interest payments for general fund borrowing. FY Intergov & Debt as a % of Total Expenditures FY Inte 0 0.1% $300,000 $250,000 $200,000 $150,000 Intergovernmental & Debt Service Actual and Projected $100,000 $50,000 $41,266 $245,563 $94,300 $247,898 $275,875 -$728,625 -$1,743,225 -$1,783,375 New continuing budget savings of $1.0 million in each of Fiscal Years 2018 and 2019 (note-f16 & F17 savings have been identified and reflected in respective expense line items). Other expenses in this category reflect unvoted debt service repayments Year-over-Year Expenditure Trend -9.68% 86.69% Year-over-Year Expenditure Variance Actual 5-Year Average Projected 5-Year Average Public Finance Resources,
25 Other Objects Primary components for this expenditure line are membership dues and fees, ESC contract deductions, County Auditor/Treasurer fees, audit expenses, and election expenses. Shaker Heights City Schools FY Other Objects as a % of Total Expenditures FY Oth 0 1.9% $2,500,000 $2,000,000 $1,500,000 Other Objects Actual and Projected $1,000,000 $500,000 $1,391,664 $1,447,904 $1,547,175 $1,537,905 $1,694,414 $1,484,000 $1,727,000 $1,804,000 $1,884,000 $1,968,000 Assumes a 5% growth in these expenditures. 25.0% Year-over-Year Expenditure Trend % 1 5.0% -5.0% % 3.46% -15.0% Year-over-Year Expenditure Variance Actual 5-Year Average Projected 5-Year Average Public Finance Resources,
26 Shaker Heights City Schools Total Other Financing Uses Operating transfers-out, advances out to other funds, and all other general fund financing uses. FY Other Financing Uses as a % of Total FY Oth Expenditures 0 0.3% $3,000,000 $2,500,000 $2,000,000 $1,500,000 Other Financing Uses Actual and Projected $1,000,000 $500,000 $405,000 $385,000 $205,000 $2,446,264 $220,000 $645,000 $270,000 $295,000 $320,000 $345,000 Fiscal 2014 reflected the transfer of $2.2 million to the District's capital fund. 120 Year-over-Year Expenditure Trend % 32.12% -20 Year-over-Year Expenditure Variance Actual 5-Year Average Projected 5-Year Average Public Finance Resources,
27 Shaker Heights City Schools Forecast Compare Comparison of Previous Forecast Amounts to Current Forecasted Numbers F.Y Column A Column B Column C Column D Previous Current Dollar Percent Forecast Forecast Difference Difference Amounts For Amounts For Between Between F.Y F.Y Previous Previous Prepared on: Prepared on: and and Revenue: Oct Apr-16 Current Current 1 Real Estate & Property Allocation $74,867,738 $74,845,285 -$22,453 2 Public Utility Personal Property $2,600,000 $2,600,000 3 Income Tax n/a 4 State Foundation Restricted & Unrestricted $17,842,307 $18,042,307 $200, % 5 Other Revenue $2,505,000 $3,090,000 $585, % 6 Other Non Operating Revenue n/a 7 Total Revenue $97,815,045 $98,577,592 $762, % Expenditures: 8 Salaries $53,942,000 $53,192,000 -$750, % 9 Fringe Benefits $17,408,800 $17,733,800 $325, % 10 Purchased Services $14,022,600 $13,652,600 -$370, % 11 Supplies, Debt, Capital Outlay & Other $6,706,898 $6,231,898 -$475, % 12 Other Non Operating Expenditures $645,000 $645, Total Expenditures $92,725,298 $91,455,298 -$1,270, % 14 Revenue Over/(Under) Expenditures $5,089,747 $7,122,294 $2,032, %* 15 Ending Cash Balance $37,030,923 $39,063,470 $2,032, %* Notes: Fiscal 2016 State Foundation revenues increased from the May 2015 forecast due to the passage of the State biennial budget in June. Public Finance Resources,
28
29
30 Shaker Heights City Schools Actual FORECASTED Fiscal Year: Revenue: General Property Tax (Real Estate) 63,215,714 65,900,000 65,900,000 65,900,000 65,900,000 65,900, Public Utility Personal Property 2,895,898 2,600,000 2,600,000 2,600,000 2,600,000 2,600, Income Tax Unrestricted Grants-in-Aid 15,683,307 16,758,307 17,800,000 17,800,000 17,800,000 17,800, Restricted Grants-in-Aid 2,299,171 1,284,000 1,295,000 1,306,000 1,317,000 1,328, Restricted Federal Grants - SFSF Property Tax Allocation 8,967,738 8,945,285 8,945,285 8,945,285 8,945,285 8,945, All Other Operating Revenues 2,241,846 3,090,000 2,697,000 2,750,000 2,962,000 2,828, Total Revenue 95,303,674 98,577,592 99,237,285 99,301,285 99,524,285 99,401,285 Other Financing Sources: Proceeds from Sale of Notes State Emergency Loans and Adv Operating Transfers-In Advances-In All Other Financing Sources Total Other Financing Sources Total Rev & Other Sources 95,303,674 98,577,592 99,237,285 99,301,285 99,524,285 99,401,285 Expenditures: Personnel Services 50,924,709 53,192,000 55,144,000 56,901,000 58,661,000 60,483, Employee Benefits 16,919,876 17,733,800 19,042,300 20,254,800 21,565,300 23,011, Purchased Services 13,196,942 13,652,600 14,350,600 14,965,600 15,409,600 15,971, Supplies and Materials 3,027,687 2,999,000 3,246,000 3,097,000 3,146,000 3,195, Capital Outlay 1,357,753 1,501,000 1,576,000 1,655,000 1,738,000 1,825, Intergovernmental (1,000,000) (2,020,000) (2,060,400) Debt Service: Principal-All Years 80, Principal - Notes Principal - State Loans Principal - State Advances Principal - HB264 Loan - 140, , , , , Principal - Other - 80,000 80,000 80,000 85,000 85, Interest and Fiscal Charges 14,300 27,898 50,875 46,375 41,775 37, Other Objects 1,694,414 1,484,000 1,727,000 1,804,000 1,884,000 1,968, Total Expenditures 87,215,681 90,810,298 95,361,775 97,948, ,660, ,671,125 Other Financing Uses Operating Transfers-Out 220, , , , , , Advances-Out All Other Financing Uses Total Other Financing Uses 220, , , , , , Total Exp and Other Financing Uses 87,435,681 91,455,298 95,631,775 98,243, ,980, ,016, Excess of Rev Over/(Under) Exp 7,867,993 7,122,294 3,605,510 1,057,510 (1,456,390) (5,614,840) Cash Balance July 1 (No Levies) 24,073,183 31,941,176 39,063,470 42,668,980 43,726,490 42,270, Cash Balance June 30 (No Levies) 31,941,176 39,063,470 42,668,980 43,726,490 42,270,100 36,655, Estimated Encumbrances June 30 5,252,532 5,252,532 5,252,532 5,252,532 5,252,532 5,252, Reservations Subtotal 353, , , , , , Fund Bal June 30 for Cert of App 26,335,574 33,457,868 37,063,378 38,120,888 36,664,498 31,049,658 Rev from Replacement/Renewal Levies & Income & Property Tax-Renewal Cumulative Balance of Levies Fund Bal June 30 for Cert of Obligations 26,335,574 33,457,868 37,063,378 38,120,888 36,664,498 31,049,658 Revenue from New Levies & Income & Property Tax-New Cumulative Balance of New Levies Unreserved Fund Balance June 30 26,335,574 33,457,868 37,063,378 38,120,888 36,664,498 31,049,658 Ending Fund Balance as a % of Total Expenditures 36.6% 38.8% 38.8% 36.3% 29.6% Public Finance Resources,

31 10/09/15 Historic vs Projected Enrollment
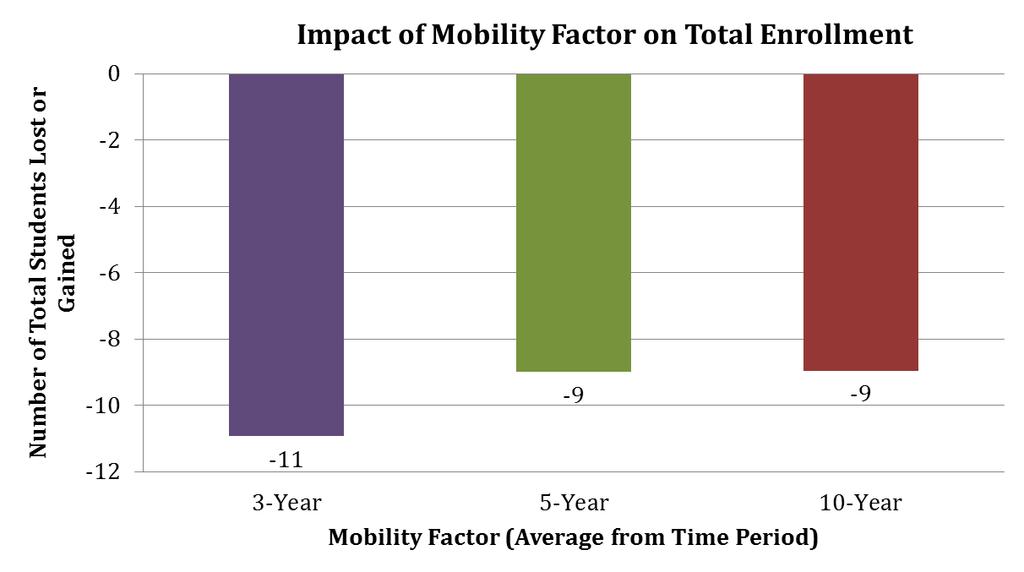
32 Enrollment-Mobility Last Year's Grade Enrollment (Blue Bar) Relative to Mobility Factor Average by Time Period Mobility Indicator Section 2016 Grade 2012 Class Size 10 Yr Avg 5 Yr Avg 3 Yr Avg 1 > > > > > > > > > > > > > > > > > > > > > > > > > > > > > > > > > > > > > > > > > > > > > > > > Current Year's Grade Level Reflecting Last Year's Class Enrollment Mobility Factor Averages by Time Period: Year 5-Year 10-Year The bars to the left reflect your district's enrollment from last year's grade level. For example, last year's 1st grade class enrollment is now reflected in this year's grade 2 class enrollment. 10/09/15
33 10/09/15 Enrollment-Mobility
34 Enrollment Projection Head Count Summary/Analysis Shaker Heights City Schools Prior Year Actual/Estimated Enrollment (October Count) 5,268 5,184 5,069 4,986 4,904 Projected Changes to Prior Year Enrollment Net All-Grade Level Mobility Factor (Change) to Prior Year Net Aggregate Manual Adjustments to Mobility Factor New Kindergartners In Loss of Seniors from Prior Year Net Change in Outgoing and Incoming Pupils Current Year Estimated Enrollment (Simulated October Count) 5,184 5,069 4,986 4,904 4,833 District Head Count Grade K Total Can Differ by Rounding 5,184 5,069 4,986 4,904 4,833 Year-Over-Year Percentage Change -1.59% -2.22% -1.64% -1.64% -1.45% 10/09/15

35 Enrollment-Kindergarten Kindergarten Enrollment Compared to Census Population and Resulting % of Census Population Enrolled % 97.6% 80.8% 102.2% 90.4% K Enrollment Census Enrollment to Census Ratio 10/09/15
Five Year Forecast Financial Report
 Exhibit T-2 As approved by Board of Education 10/09/18 LOGO Shaker Heights City Schools Five Year Forecast Financial Report October, 2018 1 Public Finance Resources, Inc. 2016 Shaker Heights City Schools
Five Year Forecast Financial Report
 Five Year Forecast Financial Report May, 2017 Brett Griffith, CFO 1 Table of Contents PAGE # Table of Contents 2 Executive Summary 3 Revenue Overview 4 1.010 General Property Tax (Real Estate) 5 1.020
Loveland City Schools
 Financial Report Five Year Forecast Update May, 2016 Public Finance Resources, 2015 1 Table of Contents Table of Contents 2 Executive Summary 3 PAGE # Revenue Overview 4 1.010 General Property Tax (Real
Five Year Forecast Financial Report
 Five Year Forecast Financial Report October, 2017 Greg Slemons, CPA Chief Financial Officer 1 Table of Contents PAGE # Table of Contents 2 Executive Summary 3 Revenue Overview 4 1.010 General Property
Five Year Forecast Financial Report
 RIVER VALLEY LOCAL SCHOOL DISTRICT MARION COUNTY Five Year Forecast Financial Report May, 2017 1 Table of Contents Table of Contents 2 Executive Summary 3 PAGE # Revenue Overview 4 1.010 General Property
Five Year Forecast Financial Report
 Five Year Forecast Financial Report October, 2017 1 Table of Contents Table of Contents 2 Executive Summary 3 PAGE # Revenue Overview 4 1.010 General Property Tax (Real Estate) 5 1.020 Public Utility Personal
Five Year Forecast Financial Report
 May, 2018 RIVERSIDE LOCAL SCHOOL DISTRICT - - LAKE COUNTY Five Year Forecast Financial Report 1 Table of Contents Table of Contents 2 Executive Summary 3 PAGE # Revenue Overview 4 1.010 - General Property
Five Year Forecast Financial Report
 LOGO CLARK SHAWNEE LOCAL SCHOOL DISTRICT CLARK COUNTY Five Year Forecast Financial Report October, 2017 1 Table of Contents Table of Contents 2 Executive Summary 3 PAGE # Revenue Overview 4 1.010 General
Five Year Forecast Financial Report
 Five Year Forecast Financial Report May, 2018 Terrah Floyd, Interim CFO 1 Table of Contents Table of Contents 2 Executive Summary 3 PAGE # Revenue Overview 4 1.010 General Property Tax (Real Estate) 5
Five Year Forecast Financial Report
 Five Year Forecast Financial Report October, 2017 Mark Astorino, Treasurer/CFO 1 Table of Contents PAGE # Table of Contents 2 Executive Summary 3 Revenue Overview 4 1.010 General Property Tax (Real Estate)
Five Year Forecast Financial Report
 Five Year Forecast Financial Report October, 2017 1 Table of Contents Table of Contents 2 Executive Summary 3 PAGE # Revenue Overview 4 1.010 - General Property Tax (Real Estate) 5 1.020 - Public Utility
Five Year Forecast Financial Report
 Five Year Forecast Financial Report October, 2018 Kevin Hawley, CFO 1 Table of Contents Table of Contents 2 Forecast Summary 3 Revenue Sources and Forecast Year-Over-Year Overview 4 1.010 - General Property
Five Year Forecast Financial Report
 LOGO Springboro Community City Schools Five Year Forecast Financial Report May, 2017 Terrah Floyd, CFO 1 Table of Contents Table of Contents 2 Executive Summary 3 PAGE # Revenue Overview 4 1.010 General
Berea City School District
 Financial Report Five Year Forecast May, 2018 Public Finance Resources, 2015 1 Table of Contents Table of Contents 2 Executive Summary 3 PAGE # Revenue Overview 4 1.010 General Property Tax (Real Estate)
Five Year Forecast Financial Report
 Five Year Forecast Financial Report October, 2016 1 Table of Contents Table of Contents 2 Executive Summary 3 PAGE # Revenue Overview 4 1.010 - General Property Tax (Real Estate) 5 1.020 - Public Utility
Five Year Forecast Financial Report
 May, 2018 TEAYS VALLEY LOCAL SCHOOL DISTRICT PICKAWAY COUNTY Five Year Forecast Financial Report 1 Table of Contents Table of Contents 2 Executive Summary 3 PAGE # Revenue Overview 4 1.010 General Property
Five Year Forecast Financial Report
 BRECKSVILLE-BROADVIEW HEIGHTS CITY SCHOOL DISTRICT - - CUYAHOGA COUNTY Five Year Forecast Financial Report October, 2018 Jeff Hall, CFO 1 Table of Contents Table of Contents 2 Forecast Summary 3 Revenue
Five Year Forecast Financial Report
 Five Year Forecast Financial Report October, 2016 1 Table of Contents Table of Contents 2 Executive Summary 3 PAGE # Revenue Overview 4 1.010 General Property Tax (Real Estate) 5 1.020 Public Utility Personal
Five Year Forecast Financial Report
 LOGO SOUTHERN LOCAL SCHOOL DISTRICT - - MEIGS COUNTY Five Year Forecast Financial Report May, 2018 1 Table of Contents Table of Contents 2 Executive Summary 3 PAGE # Revenue Overview 4 1.010 - General
Five Year Forecast Financial Report
 Five Year Forecast Financial Report May, 2018 1 Table of Contents Table of Contents 2 Executive Summary 3 PAGE # Revenue Overview 4 1.010 - General Property Tax (Real Estate) 5 1.020 - Public Utility Personal
Five Year Forecast Financial Report
 Five Year Forecast Financial Report May, 2017 1 Table of Contents Table of Contents 2 Executive Summary 3 PAGE # Revenue Overview 4 1.010 - General Property Tax (Real Estate) 5 1.020 - Public Utility Personal
Clear Fork Valley LSD
 Financial Report Five Year Forecast May, 2016 Treasurer/CFO: Bradd Stevens Table of Contents PAGE # Table of Contents 2 Executive Summary 3 Revenue Overview 4 1.010 - General Property Tax (Real Estate)
Five Year Forecast Financial Report
 Five Year Forecast Financial Report October, 2017 1 Table of Contents Table of Contents 2 Executive Summary 3 PAGE # Revenue Overview 4 1.010 - General Property Tax (Real Estate) 5 1.020 - Public Utility
Paint Valley Local School District
 Paint Valley Local School District Financial Forecast Summary & Report May 5, 2016 Kristin O Dell, Treasurer Paint Valley Local Schools (kristin.odell@pvlsd.org) 1 Forecast Purpose This forecast is intended
HUDSON CITY SCHOOLS FINANCIAL REPORT. October 2014 Five-Year Forecast Update KATHRYN L. SINES TREASURER / CFO.
 HUDSON CITY SCHOOLS FINANCIAL REPORT October 2014 Five-Year Forecast Update KATHRYN L. SINES TREASURER / CFO www.sinesk@hudson.edu 1 Forecast Purpose This forecast is intended to assist the school district
Springboro Community City School District
 Springboro Community City School District Updated Financial Forecast Summary & Report November 2014 Terrah Floyd, CFO tfloyd@springboro.org Forecast Purpose This forecast is intended to assist the school
Paint Valley Local School District
 Paint Valley Local School District Financial Forecast Summary & Report October 2014 Kristin O Dell, CFO Paint Valley Local Schools Kristin.odell@pvlsd.org 1 Forecast Purpose This forecast is intended to
Springboro Community City School District
 Springboro Community City School District Financial Forecast Summary & Report May 29, 2014 Terrah Floyd, CFO tfloyd@springboro.org 1 Forecast Purpose This forecast is intended to assist the school district
FIVE-YEAR FINANCIAL FORECAST NOTES AND ASSUMPTIONS. For the Fiscal Years Ending June 30, 2014 through 2018
 FIVE-YEAR FINANCIAL FORECAST NOTES AND ASSUMPTIONS For the Fiscal Years Ending June 30, 2014 through 2018 October 19, 2013 The mission of the Dayton City Schools is to provide a high-quality education
Loveland City School District
 Financial Forecast Summary & Report March 24, 2015 Brett Griffith, CFO Loveland City Schools (griffibr@lovelandschools.org) Forecast Purpose This forecast is intended to assist the school district in the
LANCASTER CITY SCHOOL DISTRICT - - FAIRFIELD COUNTY IRN:
 LANCASTER CITY SCHOOL DISTRICT - - FAIRFIELD COUNTY IRN: 44206 Schedule of Revenues, Expenditures and Changes in Fund Balances ACTUAL AND FORECASTED OPERATING FUND Actual Forecasted Fiscal Year Fiscal
Brunswick City School District Five Year Financial Forecast Fiscal Year 2017 to Fiscal Year 2021 (Including Historical Data)
") Brunswick City School District Five Year Financial Forecast Fiscal Year 2017 to Fiscal Year 2021 (Including Historical Data) Prepared by the Office of the Treasurer/CFO 3643 Center Road Brunswick, Ohio
Brunswick City School District Five Year Financial Forecast Fiscal Year 2017 to Fiscal Year 2021 (Including Historical Data) Prepared by the Office of the Treasurer/CFO 3643 Center Road Brunswick, Ohio
Tipp City Exempted Village Schools. Miami County
 Tipp City Exempted Village Schools Miami County Assumptions for Five-Year Financial Forecast Projected Fiscal years June 30, 2014 through June 30, 2018 Forecast provided by: Tipp City Exempted Village
Summary of Significant Forecast Assumptions Amanda-Clearcreek Local School District July 1, 2017 June 30, 2022 October 2017.
 Summary of Significant Forecast Assumptions Amanda-Clearcreek Local School District July 1, 2017 June 30, 2022 October 2017 Revenues: 1.010 Real Estate: This line item contains revenue collected from taxes
Brunswick City School District Five Year Financial Forecast Fiscal Year 2017 to Fiscal Year 2021 (Including Historical Data)
") Brunswick City School District Five Year Financial Forecast Fiscal Year 2017 to Fiscal Year 2021 (Including Historical Data) Prepared by the Office of the Treasurer/CFO Brunswick City School District 3643
Brunswick City School District Five Year Financial Forecast Fiscal Year 2017 to Fiscal Year 2021 (Including Historical Data) Prepared by the Office of the Treasurer/CFO Brunswick City School District 3643
Miami County, Ohio FIVE-YEAR FINANCIAL FORECAST NOTES AND ASSUMPTIONS. For the Fiscal Years Ending June 30, 2013 through 2017
 Miami County, Ohio FIVE-YEAR FINANCIAL FORECAST NOTES AND ASSUMPTIONS For the Fiscal Years Ending June 30, 2013 through 2017 May 13, 2013 General The Ohio Constitution assigns the state the responsibility
Miami County, Ohio FIVE-YEAR FINANCIAL FORECAST NOTES AND ASSUMPTIONS. For the Fiscal Years Ending June 30, 2012 through 2016
 Miami County, Ohio FIVE-YEAR FINANCIAL FORECAST NOTES AND ASSUMPTIONS For the Fiscal Years Ending June 30, 2012 through 2016 April 9, 2012 General The Ohio Constitution assigns the state the responsibility
Cash Balance June 30 15,940,136 15,271,647 13,479,243 12,241,640 11,698,295 10,837,831 9,756,394 8,379,673
 Whitehall City School District Schedule Of Revenue, Expenditures and Changes In Fund Balances Actual and Forecasted Operating Fund ACTUAL FORECASTED Fiscal Year Fiscal Year Fiscal Year Fiscal Year Fiscal
Hilliard City School District
 Hilliard City School District Five-Year Forecast For the Projected Years Ending June 30, 2018 through June 30, 2022 October 2017 Please visit the Ohio Department of Education website at ftp://ftp.ode.state.oh.us/geodoc/5-yrforecast/.
MARYSVILLE EXEMPTED VILLAGE SCHOOL DISTRICT- UNION COUNTY SCHEDULE OF REVENUE, EXPENDITURES, AND CHANGES IN FUND BALANCES FOR THE FISCAL YEARS ENDED
 MARYSVILLE EXEMPTED VILLAGE SCHOOL DISTRICT- UNION COUNTY SCHEDULE OF REVENUE, EXPENDITURES, AND CHANGES IN FUND BALANCES FOR THE FISCAL YEARS ENDED JUNE 30, 2014, 2015 and 2016 ACTUAL FORECASTED FISCAL
Licking Heights Local School District 5 Year Forecast Assumptions (FY 2013 FY 2017) Board Approved: October 24, Revenue:
 Board Approved: October 24, Revenue:") Licking Heights Local School District 5 Year Forecast Assumptions (FY 2013 FY 2017) Board Approved: October 24, 2012 Revenue: General Property Tax (Real Estate) Property values dropped 7.04% in aggregate
Licking Heights Local School District 5 Year Forecast Assumptions (FY 2013 FY 2017) Board Approved: October 24, 2012 Revenue: General Property Tax (Real Estate) Property values dropped 7.04% in aggregate
Findlay City School District Hancock County Five Year Forecast for Fiscal Years 2016 through 2023
 Findlay City School District Hancock County Five Year Forecast for Fiscal Years 2016 through 2023 Actual Forecasted Fiscal Year Fiscal Year Fiscal Year Average Fiscal Year Fiscal Year Fiscal Year Fiscal
Forecast Provided By Newark City School District Treasurer's Office Julio Valladares, MBA, Treasurer/CFO
 Newark City School District Licking County SCHEDULE OF REVENUE, EXPENDITURES, AND CHANGES IN FUND BALANCES FOR THE FISCAL YEARS ENDED JUNE 30, 2015, 2016 and 2017 ACTUAL FORECASTED FISCAL YEARS ENDING
XENIA COMMUNITY CITY SCHOOL DISTRICT-GREENE COUNTY SCHEDULE OF REVENUE, EXPENDITURES, AND CHANGES IN FUND BALANCES FOR THE FISCAL YEARS ENDED JUNE
 XENIA COMMUNITY CITY SCHOOL DISTRICT-GREENE COUNTY SCHEDULE OF REVENUE, EXPENDITURES, AND CHANGES IN FUND BALANCES FOR THE FISCAL YEARS ENDED JUNE 30, 2014, 2015 and 2016 ACTUAL FORECASTED FISCAL YEARS
NORTHRIDGE LOCAL SCHOOL DISTRICT - LICKING COUNTY SCHEDULE OF REVENUE, EXPENDITURES, AND CHANGES IN FUND BALANCES FOR THE FISCAL YEARS ENDED ACTUAL
 NORTHRIDGE LOCAL SCHOOL DISTRICT - LICKING COUNTY SCHEDULE OF REVENUE, EXPENDITURES, AND CHANGES IN FUND BALANCES FOR THE FISCAL YEARS ENDED ACTUAL JUNE 30, 2015, 2016, and 2017 FORECASTED FISCAL YEARS
Forecast Provided By Dublin City School District Treasurer's Office Mr. Brian Kern, Treasurer/CFO. December 10, 2018 (revised)
") DUBLIN CITY SCHOOL DISTRICT - FRANKLIN COUNTY SCHEDULE OF REVENUE, EXPENDITURES, AND CHANGES IN FUND BALANCES FOR THE FISCAL YEARS ENDED JUNE 30, 2016, 2017 and 2018 ACTUAL FORECASTED FISCAL YEARS ENDING
DUBLIN CITY SCHOOL DISTRICT - FRANKLIN COUNTY SCHEDULE OF REVENUE, EXPENDITURES, AND CHANGES IN FUND BALANCES FOR THE FISCAL YEARS ENDED JUNE 30, 2016, 2017 and 2018 ACTUAL FORECASTED FISCAL YEARS ENDING
Financial Readiness for Leaders
 Financial Readiness for Leaders Prepared by: Public Finance Resources, Inc. In today s era of uncertainty, the data contained in this report will provide you with the tools and training needed to maximize
Forecast Provided By Dublin City School District Treasurer's Office Mr. Brian Kern, Treasurer/CFO
 DUBLIN CITY SCHOOL DISTRICT-FRANKLIN COUNTY SCHEDULE OF REVENUE, EXPENDITURES, AND CHANGES IN FUND BALANCES FOR THE FISCAL YEARS ENDED JUNE 30, 2015, 2016 and 2017 ACTUAL FORECASTED FISCAL YEARS ENDING
TECUMSEH LOCAL SCHOOL DISTRICT IRN # FIVE-YEAR FORECAST ASSUMPTIONS OCTOBER
 TECUMSEH LOCAL SCHOOL DISTRICT IRN #046243 2018 FIVE-YEAR FORECAST ASSUMPTIONS OCTOBER As stated on the Ohio Department of Education Five-Year Forecast Webpage: The reader should remember that a forecast
DUBLIN CITY SCHOOL DISTRICT - FRANKLIN COUNTY
 DUBLIN CITY SCHOOL DISTRICT - FRANKLIN COUNTY SCHEDULE OF REVENUE, EXPENDITURES, AND CHANGES IN FUND BALANCES FOR THE FISCAL YEARS ENDED ACTUAL JUNE 30, 2014, 2015, 2016 FORECASTED FISCAL YEARS ENDING
Change
 CLEARVIEW LOCAL SCHOOL DISTRICT Lorain County Schedule of Revenues, Expenditures and Changes in Fund Balances For the Fiscal Years Ended June 30, 2015, 2016, and 2017 Actual Forecasted Fiscal Years Ending
Enclosure C-1-c. May 9, 2016
 Enclosure C-1-c May 9, 2016 WORTHINGTON CITY SCHOOL DISTRICT-FRANKLIN COUNTY SCHEDULE OF REVENUE, EXPENDITURES, AND CHANGES IN FUND BALANCES FOR THE FISCAL YEARS ENDED JUNE 30, 2013, 2014 and 2015 ACTUAL
7.020 Cash Balance June 30 3,709,735 4,692,492 5,469, % 5,455,806 5,183,533 4,810,736 4,205,146 3,345,106
 Ripley-Union-Lewis-Huntington S.D. Brown County Schedule of Revenues, Expenditures and Changes in Fund Balances For the Fiscal Years Ended June 30, 2015, 2016 and 2017 Actual; Forecasted Fiscal Years Ending
The Notes To The Five Year Forecast Are An Integral Part Of This Presentation.
 ACTUAL ACTUAL ACTUAL ACTUAL ACTUAL ESTIMATED ESTIMATED ESTIMATED ESTIMATED ESTIMATED 7/06-6/07 7/07-6/08 7/08-6/09 7/09-6/10 7/10-6/11 7/11-6/12 7/12-6/13 7/13-6/14 7/14-6/15 7/15-6/16 OPERATING REVENUES:
LAKEWOOD CITY SCHOOLS
 LAKEWOOD CITY SCHOOLS Financial Forecast and Summary Report May 2017 Kent R. Zeman, CPA CFO/Treasurer In Collaboration with: Lakewood Board of Education Members Mr. Jeff Patterson, Superintendent Administrative
Forecast Provided By Fairborn City School District Treasurer's Office Nicole Marshall, Treasurer/CFO
 FAIRBORN CITY SCHOOL DISTRICT-GREENE COUNTY SCHEDULE OF REVENUE, EXPENDITURES, AND CHANGES IN FUND BALANCES FOR THE FISCAL YEARS ENDED JUNE 30, 2015, 2016 and 2017 ACTUAL FORECASTED FISCAL YEARS ENDING
WORTHINGTON CITY SCHOOL DISTRICT-FRANKLIN COUNTY SCHEDULE OF REVENUE, EXPENDITURES, AND CHANGES IN FUND BALANCES FOR THE FISCAL YEARS ENDED JUNE 30,
 WORTHINGTON CITY SCHOOL DISTRICT-FRANKLIN COUNTY SCHEDULE OF REVENUE, EXPENDITURES, AND CHANGES IN FUND BALANCES FOR THE FISCAL YEARS ENDED JUNE 30, 2012, 2013 and 2014 ACTUAL FORECASTED FISCAL YEARS ENDING
HUBER HEIGHTS CITY SCHOOL DISTRICT MONTGOMERY COUNTY SCHEDULE OF REVENUE, EXPENDITURES, AND CHANGES IN FUND BALANCES FOR THE FISCAL YEARS ENDED JUNE
 HUBER HEIGHTS CITY SCHOOL DISTRICT MONTGOMERY COUNTY SCHEDULE OF REVENUE, EXPENDITURES, AND CHANGES IN FUND BALANCES FOR THE FISCAL YEARS ENDED JUNE 30, 2016, 2017 and 2018 ACTUAL FORECASTED FISCAL YEARS
Forecast Provided By Groveport-Madison School District Treasurer's Office John Walsh, Treasurer
 Groveport-Madison City School District Franklin County SCHEDULE OF REVENUE, EXPENDITURES, AND CHANGES IN FUND BALANCES FOR THE FISCAL YEARS ENDED JUNE 30, 2014, 2015 and 2016 ACTUAL FORECASTED FISCAL YEARS
Copley-Fairlawn City Schools, Summit County Five Year Forecast Assumptions May, 2011
 Copley-Fairlawn City Schools, Summit County Five Year Forecast Assumptions May, 2011 The Copley-Fairlawn City School District has achieved Excellent with Distinction status as measured and reported in
Harrison Hills City School District Treasurer's Office Roxane Harding, Treasurer
 HARRISON HILLS CITY SCHOOL DISTRICT HARRISON COUNTY SCHEDULE OF REVENUE, EXPENDITURES, AND CHANGES IN FUND BALANCES FOR THE FISCAL YEARS ENDED JUNE 30, 2011, 2012 and 2013 ACTUAL FORECASTED FISCAL YEARS
Forecast Provided By Trotwood-Madison City School District Treasurer's Office Janice Allen, Treasurer
 Trotwood-Madison City School District Montgomery County SCHEDULE OF REVENUE, EXPENDITURES, AND CHANGES IN FUND BALANCES FOR THE FISCAL YEARS ENDED JUNE 30, 2011, 2012 and 2013 ACTUAL FORECASTED FISCAL
CINCINNATI CITY SCHOOL DISTRICT-HAMILTON COUNTY SCHEDULE OF REVENUES, EXPENDITURES, AND CHANGES IN FUND BALANCES FOR THE FISCAL YEARS ENDED JUNE 30,
 CINCINNATI CITY SCHOOL DISTRICT-HAMILTON COUNTY SCHEDULE OF REVENUES, EXPENDITURES, AND CHANGES IN FUND BALANCES FOR THE FISCAL YEARS ENDED JUNE 30, 2013, 2014 and 2015 ACTUAL FORECASTED FISCAL YEARS ENDING
LAKOTA LOCAL SCHOOL DISTRICT-BUTLER COUNTY SCHEDULE OF REVENUE, EXPENDITURES, AND CHANGES IN FUND BALANCES FOR THE FISCAL YEARS ENDED JUNE 30, 2013,
 LAKOTA LOCAL SCHOOL DISTRICT-BUTLER COUNTY SCHEDULE OF REVENUE, EXPENDITURES, AND CHANGES IN FUND BALANCES FOR THE FISCAL YEARS ENDED JUNE 30, 2013, 2014 and 2015 ACTUAL FORECASTED FISCAL YEARS ENDING
Bellefontaine City School District. Fiscal Year Five Year Forecast
 Bellefontaine City School District Fiscal Year 2018 Five Year Forecast Adopted May 21, 2018 Compiled By: Keith E. Krieger, Treasurer/CFO PURPOSE OF THE FORECAST BELLEFONTAINE CITY SCHOOL DISTRICT The five-year
Summary of Significant Forecast Assumptions and Accounting Policies For the Fiscal Years Ending June 30, 2013 through 2017
 ONTARIO LOCAL SCHOOL DISTRICT RICHLAND COUNTY 1 Summary of Significant Forecast Assumptions and Accounting Policies For the Fiscal Years Ending June 30, 2013 through 2017 Note 1 - Nature and Limitations
Summary of Significant Forecast Assumptions and Accounting Policies For the Fiscal Years Ending June 30, 2018 through 2022
 ONTARIO LOCAL SCHOOL DISTRICT RICHLAND COUNTY 1 Summary of Significant Forecast Assumptions and Accounting Policies For the Fiscal Years Ending June 30, 2018 through 2022 Note 1 - Nature and Limitations
Copley-Fairlawn City Schools, Summit County Five Year Forecast Assumptions October, 2011
 Copley-Fairlawn City Schools, Summit County Five Year Forecast Assumptions October, 2011 The Copley-Fairlawn City School District has achieved Excellent status as measured and reported in the state issued
LAKOTA LOCAL SCHOOL DISTRICT-BUTLER COUNTY SCHEDULE OF REVENUE, EXPENDITURES, AND CHANGES IN FUND BALANCES FOR THE FISCAL YEARS ENDED JUNE 30, 2014,
 LAKOTA LOCAL SCHOOL DISTRICT-BUTLER COUNTY SCHEDULE OF REVENUE, EXPENDITURES, AND CHANGES IN FUND BALANCES FOR THE FISCAL YEARS ENDED JUNE 30, 2014, 2015 and 2016 ACTUAL FORECASTED FISCAL YEARS ENDING
EASTWOOD LOCAL SCHOOL DISTRICT
 EASTWOOD LOCAL SCHOOL DISTRICT Five Year Forecast Notes and Assumptions May 15, 2017 HOME OF THE EAGLES REVENUE ASSUMPTIONS School districts operate from three sources of tax revenue: Local Property Taxes,
Miami Trace Local School District Fayette County Actual Forecasted Revenues Other Financing Sources Expenditures Other Financing Uses
 Miami Trace Local School District Fayette County Schedule of Revenues, Expenditures and Changes in Fund Balances For the Fiscal Years Ended June 30, 2015, 2016 and 2017 Actual; Forecasted Fiscal Years
Ferndale School District #502 Business and Support Services Budget Summary Citizens' Budget General Fund
 Ferndale School District #502 Business and Support Services 2018-19 Budget Summary Citizens' Budget General Fund 7/31/2018 Prepared by: Mark Deebach, Assistant Superintendent for Business & Support Services
MOHAWK LOCAL SCHOOL DISTRICT Wyandot COUNTY, OHIO IRN #050740
 MOHAWK LOCAL SCHOOL DISTRICT Wyandot COUNTY, OHIO IRN #050740 605 State Highway 231 Sycamore, Ohio 44882 FIVE YEAR FINANCIAL FORECAST FISCAL 2012-2016 Prepared by Treasurer, Roy B. Swartz, CPA October
SHAKER HEIGHTS BOARD OF EDUCATION SHAKER HEIGHTS, OHIO. May 5, Members, Shaker Heights Board of Education
 SHAKER HEIGHTS BOARD OF EDUCATION SHAKER HEIGHTS, OHIO TO: FROM: SUBJECT: Members, Shaker Heights Board of Education Bryan C. Christman, Treasurer Financial and Miscellaneous Briefs I. GENERAL FUND (As
Cloverleaf Local School District Five-Year Financial Forecast
 Cloverleaf Local School District Five-Year Financial Forecast Jason Myers President Michael Maloney Vice President Jane Rych Board Member Jim Curran Board Member Bill Schmock Board Member James Hudson
BIG WALNUT LOCAL SCHOOL DISTRICT- DELAWARE COUNTY SCHEDULE OF REVENUE, EXPENDITURES, AND CHANGES IN FUND BALANCES FOR THE FISCAL YEARS ENDED JUNE 30,
 BIG WALNUT LOCAL SCHOOL DISTRICT- DELAWARE COUNTY SCHEDULE OF REVENUE, EXPENDITURES, AND CHANGES IN FUND BALANCES FOR THE FISCAL YEARS ENDED JUNE 30, 2015, 2016 and 2017 ACTUAL FORECASTED FISCAL YEARS
Marietta City School District Assumptions for October year Forecast
 Marietta City School District Assumptions for October 2018 5 year Forecast Marietta City School District is articulating to users of forecasts that assumptions are the basis of any forecast. An assumption
LICKING HEIGHTS LOCAL SCHOOL DISTRICT LICKING COUNTY, OHIO
 FINANCIAL FORECAST NOTES OCTOBER 2015 Nick Roberts, CFO/Treasurer njroberts@laca.org Licking Heights Five Year Forecast FISCAL YEAR 2016 Actual Forecasted 2013 2014 2015 2016 2017 2018 2019 2020 1.010
Public School Finance 101
 Public School Finance 101 FREQUENTLY ASKED QUESTIONS When were new operating tax levies passed in the Eastwood district? Continuing Operating Property Tax Levies were passed by district voters in 1976,
LAKOTA LOCAL SCHOOL DISTRICT-BUTLER COUNTY SCHEDULE OF REVENUE, EXPENDITURES, AND CHANGES IN FUND BALANCES FOR THE FISCAL YEARS ENDED JUNE 30, 2013,
 LAKOTA LOCAL SCHOOL DISTRICT-BUTLER COUNTY SCHEDULE OF REVENUE, EXPENDITURES, AND CHANGES IN FUND BALANCES FOR THE FISCAL YEARS ENDED JUNE 30, 2013, 2014 and 2015 ACTUAL FORECASTED FISCAL YEARS ENDING
Mansfield City School District Richland County, Ohio
 Richland County, Ohio Fiscal Emergency Termination Local Government Services Section Richland County Fiscal Emergency Termination Table of Contents Certification... 3 Report on Termination of the Financial
WEST IRON COUNTY PUBLIC SCHOOL DISTRICT. Financial Report with Supplemental Information Prepared in Accordance with GASB 34.
 Financial Report with Supplemental Information Prepared in Accordance with GASB 34 June 30, 2009 1 TABLE OF CONTENTS INDEPENDENT AUDITOR S REPORT... 4 ADMINISTRATION S DISCUSSION AND ANALYSIS... 7 BASIC
SHAKER HEIGHTS BOARD OF EDUCATION SHAKER HEIGHTS, OHIO. April 12, Members, Shaker Heights Board of Education
 SHAKER HEIGHTS BOARD OF EDUCATION SHAKER HEIGHTS, OHIO TO: FROM: SUBJECT: Members, Shaker Heights Board of Education Bryan C. Christman, Treasurer Financial and Miscellaneous Briefs I. GENERAL FUND (As
Riverside Local School District
 Riverside Local School District Five Year Forecast Presentation October 22, 2018 Presented by: Gary A. Platko Guidance The Ohio Department of Education (ODE) has developed a guide to assist teachers, administrators,
ANNUAL SCHOOL BUDGET
 FORM SBM-1 The University of the State of New York THE STATE EDUCATION DEPARTMENT Room 876 Education Building Annex Albany, New York 12234 - - SCHOOL DISTRICT CODE: (FOR DEPT. USE) ANNUAL SCHOOL BUDGET
Northwest Local School District (Hamilton County) 5-Year Forecast Assumptions May 11, 2015
 5-Year Forecast Assumptions May 11, 2015") Northwest Local School District (Hamilton County) 5-Year Forecast Assumptions May 11, 2015 Disclaimers The 5-year forecast for Northwest Local School District (Hamilton County) is derived from the last
Northwest Local School District (Hamilton County) 5-Year Forecast Assumptions May 11, 2015 Disclaimers The 5-year forecast for Northwest Local School District (Hamilton County) is derived from the last
Cleveland Municipal School District
 Cleveland Municipal School District Five Year Financial Forecast October 2015 1 Five Year Forecast -Contents Major Assumptions General Fund Revenues General Fund Expenditures Five Year Forecast Summary
GRANVILLE SCHOOLS CASH BALANCE GUIDELINES AND THE MAY 5-YEAR FORECAST
 GRANVILLE SCHOOLS CASH BALANCE GUIDELINES AND THE MAY 5-YEAR FORECAST Mike Sobul, CFO/Treasurer Dan Gibson, Member, Superintendent s Finance Committee May 2013 CASH BALANCE GUIDELINES Why Have Cash Balance
UPPER SCIOTO VALLEY LOCAL SCHOOL DISTRICT-HARDIN COUNTY SCHEDULE OF REVENUE, EXPENDITURES, AND CHANGES IN FUND BALANCES FOR THE FISCAL YEARS ENDED
 UPPER SCIOTO VALLEY LOCAL SCHOOL DISTRICT-HARDIN COUNTY SCHEDULE OF REVENUE, EXPENDITURES, AND CHANGES IN FUND BALANCES FOR THE FISCAL YEARS ENDED JUNE 30, 2015, 2016 and 2017 ACTUAL FORECASTED FISCAL
WHEELERSBURG LOCAL SCHOOL DISTRICT FINANCIAL REPORT: SUMMARY AND ANALYSIS OCTOBER 2018
 WHEELERSBURG LOCAL SCHOOL DISTRICT FINANCIAL REPORT: SUMMARY AND ANALYSIS OCTOBER 2018 Appendix A GENERAL FUND OCTOBER 2018 OCTOBER 2017 OCTOBER 2016 Beginning Balance October 1 $2,344,929.75 $2,122,361.29
Loveland City Schools FY Revenue
 FREQUENTLY ASKED QUESTIONS 1. Where does the Loveland City School District revenue come from? In Ohio, the funding of schools is shared by the state and local school districts. The Ohio General Assembly
ROBIN KLENK, TREASURER
 BASIC FINANCIAL STATEMENTS FOR THE FISCAL YEAR ENDED JUNE 30, 2012 ROBIN KLENK, TREASURER BASIC FINANCIAL STATEMENTS TABLE OF CONTENTS Table of Contents... 1 Accountant s Compilation Report... 2 Management
Piqua City School District 719 East Ash Street Piqua, Ohio ASSUMPTIONS TO THE FIVE-YEAR FORECAST May 2018
 Piqua City School District 719 East Ash Street Piqua, Ohio 45356 ASSUMPTIONS TO THE FIVE-YEAR FORECAST May 2018 INTRODUCTION TO FIVE YEAR FORECAST All school districts in Ohio are required to file a five
MADISON LOCAL SCHOOL DISTRICT RICHLAND COUNTY, OHIO
 BASIC FINANCIAL STATEMENTS (AUDITED) FOR THE FISCAL YEAR ENDED JUNE 30, 2009 ROBIN KLENK, TREASURER BASIC FINANCIAL STATEMENTS TABLE OF CONTENTS Independent Auditor s Report.... 1-2 Management s Discussion
North Olmsted City Schools Major Assumptions Used in the Preparation of the Five-Year Forecast Prepared October 12, 2017
 North Olmsted City Schools Major Assumptions Used in the Preparation of the Five-Year Forecast Prepared October 12, 2017 Financial Summary Enclosed is a summary of major assumptions used in the preparation
NORTH FORK LOCAL SCHOOL DISTRICT LICKING COUNTY SINGLE AUDIT
 LICKING COUNTY SINGLE AUDIT FOR THE YEAR ENDED JUNE 30, 2018 TITLE LICKING COUNTY JUNE 30, 2018 TABLE OF CONTENTS PAGE Independent Auditor s Report... 1 Prepared by Management: Management s Discussion
The property tax is the predominant method communities use to raise additional revenues in Ohio. The property tax comes in two forms:
 INTRODUCTION The cost to educate young people across the state is significant and those costs continue to rise. More Ohio tax dollars are spent for primary and secondary education than for any other single
Excess of Revenues/Other Fin. Sources Over/(Under) Exp. and Other Fin. Uses 0 0 5,543,050-24,512, ,000- Fund Summary Page
 Exp. and Other Fin. Uses 0 0 5,543,050-24,512, ,000- Fund Summary Page") BUDGET AND EXCESS LEVY SUMMARY - FISCAL YEAR 2003-2004 SECTION A: BUDGET SUMMARY Associated Debt Capital Transportation General Student Body Service Projects Vehicle Fund Fund Fund Fund Fund Total Revenues
BUDGET AND EXCESS LEVY SUMMARY - FISCAL YEAR 2003-2004 SECTION A: BUDGET SUMMARY Associated Debt Capital Transportation General Student Body Service Projects Vehicle Fund Fund Fund Fund Fund Total Revenues
CUYAHOGA HEIGHTS LOCAL SCHOOL DISTRICT CUYAHOGA COUNTY REGULAR AUDIT
 CUYAHOGA HEIGHTS LOCAL SCHOOL DISTRICT CUYAHOGA COUNTY REGULAR AUDIT FOR THE YEAR ENDED JUNE 30, 2014 CUYAHOGA HEIGHTS LOCAL SCHOOL DISTRICT CUYAHOGA COUNTY TABLE OF CONTENTS TITLE PAGE Independent Auditor
Brecksville-Broadview Heights City School District Cuyahoga County, Ohio. Audited Financial Statements
 Brecksville-Broadview Heights City School District Cuyahoga County, Ohio Audited Financial Statements For the Fiscal Year Ended June 30, 2018 Board of Education Brecksville-Broadview Heights City School