Data ENCJ Survey on the Independence of Judges. Co-funded by the Justice Programme of the European Union
|
|
|
- Rodney Jasper Johnston
- 5 years ago
- Views:
Transcription


1 Data ENCJ Survey on the Independence of Judges Co-funded by the Justice Programme of the European Union
2 Table of content 1. Introduction 3 2. Executive Summary of the outcomes of the survey 4 3. Methodology and questions 5 4. Response rate per country and representativeness 8 5. Main outcomes of the survey Results of survey per question in graphs Results of survey per question in tables 33 This publication has been produced with the financial support of the Justice Programme of the European Union. The contents of this publication are the sole responsibility of the ENCJ and can in no way be taken as the views of the European Commission. 2
3 1. Introduction In 2013 the ENCJ started the first independence and accountability project. The project focused on the development of indicators for the independence and accountability of EU judiciaries and the development of an ENCJ vision on independence and accountability. Since then, the ENCJ has successfully developed a normative vision on the independence and accountability of the Judiciary and an analytical framework identifying the essential constituents of the (i) independence and (ii) accountability of the Judiciary. A set of quantifiable indicators covering the essential constituents identified under the framework was developed, tested and applied in all judiciaries that participated in the project. At the General Assembly in Rome in 2014, it was noted that judges had never been asked how they perceive their own independence. This led to a blank spot in the indicators about subjective independence, and it was decided to develop and conduct a survey among European judges. This survey was conducted in 2015, and results for indicators and survey were reported to the General Assembly in Data from the survey have been incorporated in the 2016 EU Justice Scoreboard (Figure 57). 1 In 2015/2016 the questions of the survey were improved. In November 2016 the survey was executed and Austria, Croatia, the Czech Republic, Estonia, Finland, France and Germany joined the survey for the first time, leading to a total of 11,712 judges participating in the survey. On the other hand, Montenegro did not officially participate in the survey. 1 The ENCJ and the European Commission collaborate on some parts of the Justice Scoreboard. The data used in paragraph of the scoreboard on structural independence were collected through an updated questionnaire drawn up by the European Commission in close association with the ENCJ. 3
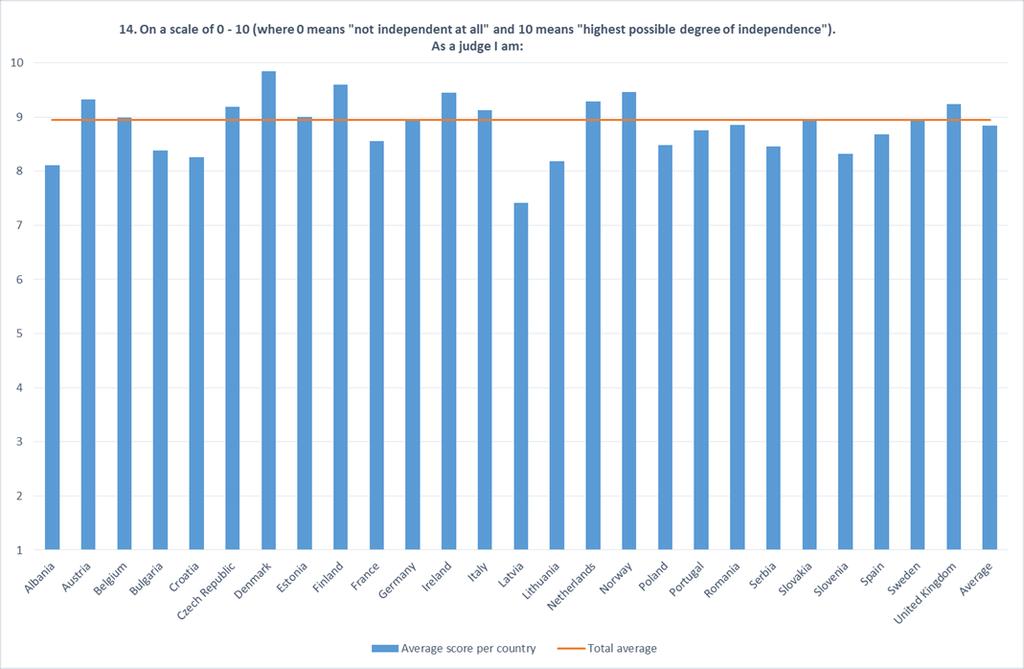
4 2. Executive summary of the outcomes of the survey To gather data on the perception of judges of their independence, the ENCJ, for the second time conducted a survey among the judges of Europe. This time in total 11,712 judges from 26 countries participated. The first time in 2014/2015 5,878 judges from 20 countries took part. The survey was conducted at the end of Some information was asked about the personal characteristics of the respondents: gender and experience. Gender has no impact on the score about the independence of the judges in the country. The impact of gender on the opinions about specific aspects of independence is also limited, although differences exist among countries and some countries jump out. The impact of experience is overall small, but in some countries substantial. There is a general tendency that very experienced judges score their independence higher than less experienced judges. The main findings are the following. (1) As to the overall perception of independence, on a 10-point scale the respondents rate the independence of the judges in their country between 6.5 and 10 on average per country. Five countries have scores between 6.5 and 7. (2) When judges experience inappropriate pressure, the three most given answers as to whom exerts this pressure are: court management including the court president (25%), closely followed by parties (24%) and their lawyers and at wider distance by the media (16%). (3) As to the prevalence of bribes, three categories of judiciaries can be distinguished: (i) judiciaries in which nearly all judges believe that no bribes are accepted; (ii) judiciaries in which a small percentage (less than 4%) of judges believe that bribes are accepted, and 10-20% are not sure whether or not bribes are accepted; and (iii) judiciaries in which a higher percentage of judges believe that bribery occurs and many more than 20% (up to 55%) are uncertain whether or not bribes are accepted. (4) The appointment and promotion decisions about judges are major issues, with 22% of judges (average across countries) believing that appointment decisions are not based on merit and experience and 38% believing this to be the case for promotion decisions. (5) The impact of the media on the decisions of judges is large in most countries and is increasing. The influence of social media is much smaller than that of the traditional media, but it is increasing in nearly all countries. (6) 22% of all participating judges feel that the Judiciary is not respected by government and parliament, with 34% thinking the same about the traditional media. The differences among judiciaries are very large. The (lack of) respect shown in the social media is generally seen as less problematic. (7) On average 33% of the judges do not believe that Councils for the Judiciary have the appropriate mechanisms and procedures in order to defend judicial independence effectively. (8) Judges were asked what would contribute most to the independence of the Judiciary in their country. The responses were very consistent: better working conditions regarding work load was mentioned most often, with working conditions regarding pay including pensions and retirement age in second place, and appointment and promotion based on ability and experience in third place. 4
5 3. Methodology and questions Within the framework of the ENCJ project on Independence, Accountability and Quality of the Judiciary, for the second time a survey among the judges of Europe was conducted. This time, in total 11,712 judges from 26 countries participated, comparing very favourably to the 5,878 judges from 20 countries who took part in The survey was conducted at the end of The raw data of the results of the survey can be provided upon request by sending an to office@encj.eu. 3.1 Methodology The survey was sent to all the ENCJ members and observers. All the members and observers that were willing to participate, distributed a letter of introduction and recommendation of the president of the ENCJ to the judges within their jurisdictions. The letter contained a link to the internet site of the ENCJ that hosted the survey. The respondents could fill in the survey on line anonymously. They were asked to specify the country in which they were working as a judge. The Councils had to decide for themselves whether or not to translate the letter of introduction and the survey itself. Judges could fill in the survey in any language into which the survey had been translated. Most Councils were able to distribute the letter of introduction directly to the judges, other councils had to send the letter to the court president who in his/her turn distributed the letter among the judges of his/her court. Some Councils secured the endorsement of the judges association of their country. The survey was addressed only to the professional judges. 3.2 Design of the survey and questions The survey was designed in such a way that it asked judges to give a general assessment of their independence as they perceive it to provide the data for the indicator, but also explored different aspects of independence in depth. In addition, they were asked some about some personal characteristics (gender and experience). The questions are essentially the same as the first time, but the just mentioned questions about personal characteristics as well as a question about the adequacy of the mechanisms available to Councils to defend the independence of the Judiciary and a question about possibilities for improvement of independence were added. As explained in last year s report, also some textual changes were made. The survey consisted of the following substantive statements and questions. 1.1 During the last two years I have been under inappropriate pressure to decide the outcome of a case in a specific way. 1.2 If you agree or strongly agree with 1.1, what was the frequency of such pressure? 1.3 If you agree or strongly agree with 1.1, by whom? Possibilities offered: Parties and their lawyers, Government, Parliament, other Judges (including an association of judges), Court Management (including the Court President), Council for the Judiciary, Supreme court, Constitutional court, Media, Social Media. 5
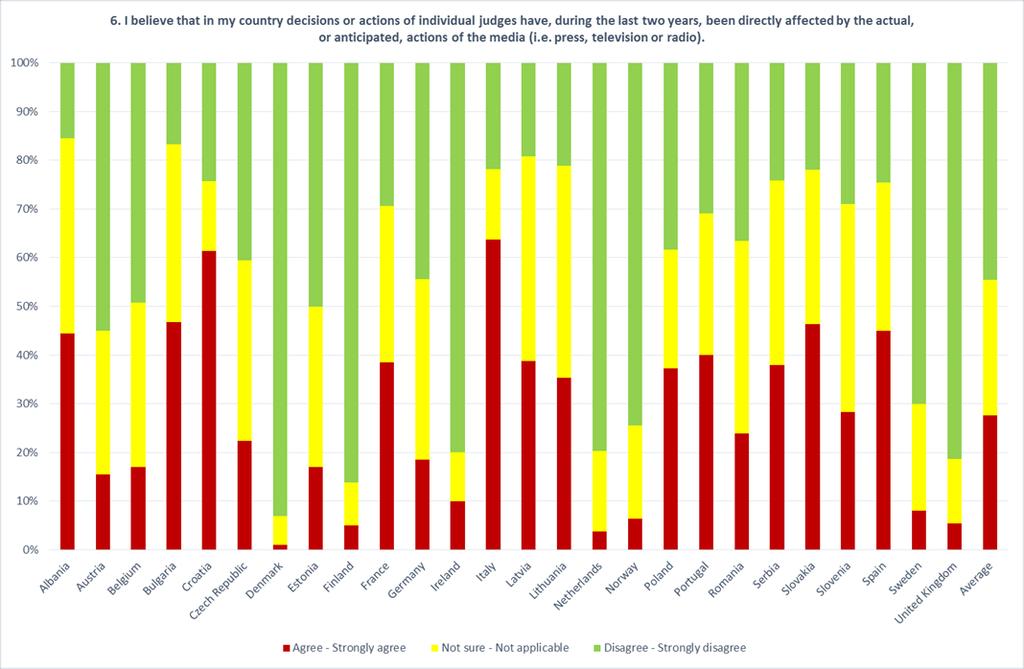
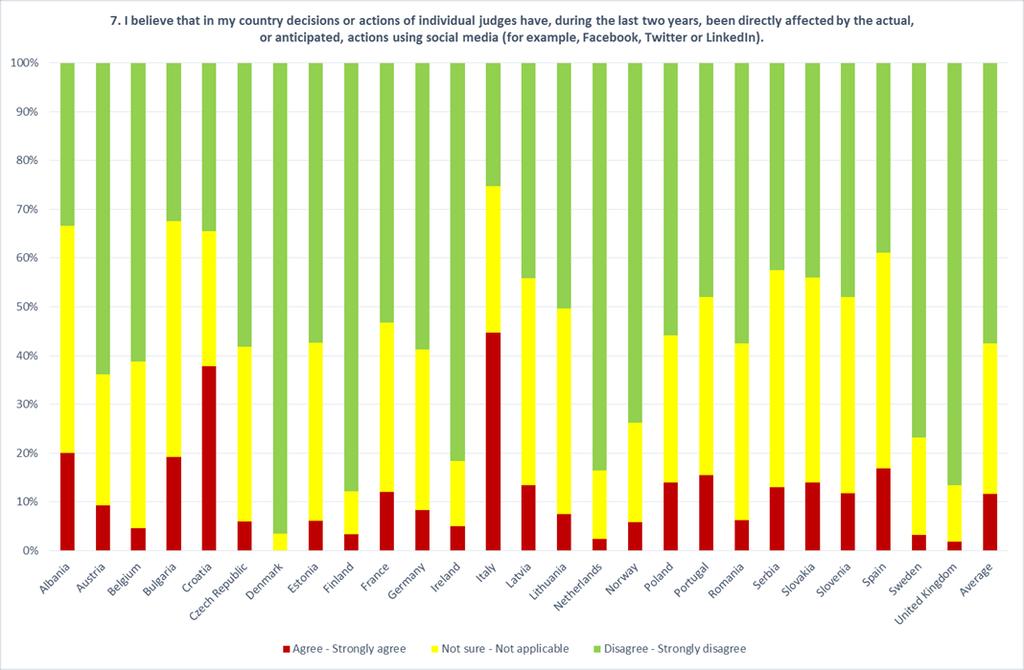
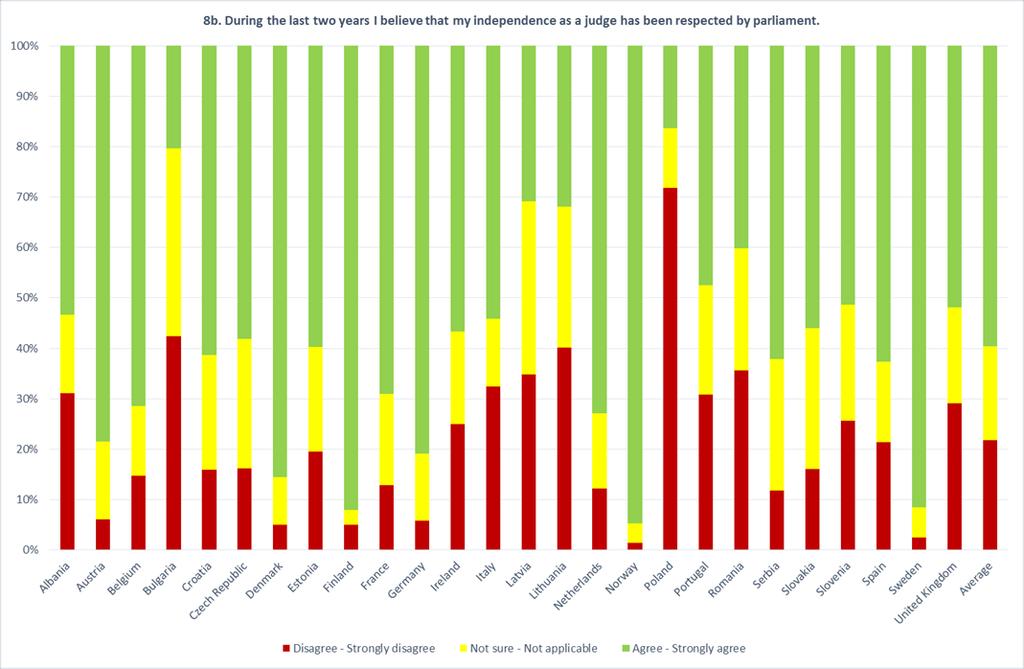
6 2.1 In my country I believe that during the last two years individual judges have accepted bribes as an inducement to decide case(s) in a specific way. 2.2 If you agree or strongly agree with 2.1, did this occur on a rare exception, occasionally or regularly. 3a. During the last two years I have been affected by a threat of, or actual, disciplinary or other action because of how I have decided a case. 3b. During the last two years my decisions or actions have been directly affected by a claim, or a threat of a claim, for personal liability. 4. I believe during the last two years cases have been allocated to judges other than in accordance with established rules or procedures in order to influence the outcome of the particular case. 5a. I believe judges in my country have been appointed other than on the basis of capacity and experience during the last two years. 5b. I believe judges in my country have been promoted other than on the basis of capacity and experience during the last two years. 6. I believe that in my country decisions or actions of individual judges have, during the last two years, been directly affected by the actual, or anticipated, actions of the media (i. e. press, television or radio). 7. I believe that in my country decisions or actions of individual judges have, during the last two years, been directly affected by actual, or anticipated, actions using social media (for example, Facebook, Twitter or LinkedIn). 8. During the last two years I believe that my independence as a judge has been respected by the following actors 8(a)to (8i) (list as above 1). 8j. I believe that in my country the Council of the Judiciary has the appropriate mechanisms and procedures in order to defend judicial independence effectively. 9.1 During the last two years negative changes occurred in my working conditions in relation to (multiple answers possible): (a) Pay, (b) Pensions, (c) Retirement age, (d) Caseload and (e) Court resources. Also, the following option was presented: (f) I was moved to another function, section or court. 9.2 I believe that changes which occurred in my working conditions in relation to the domains listed in 9.1 directly affected my independence (multiple answers possible). 6
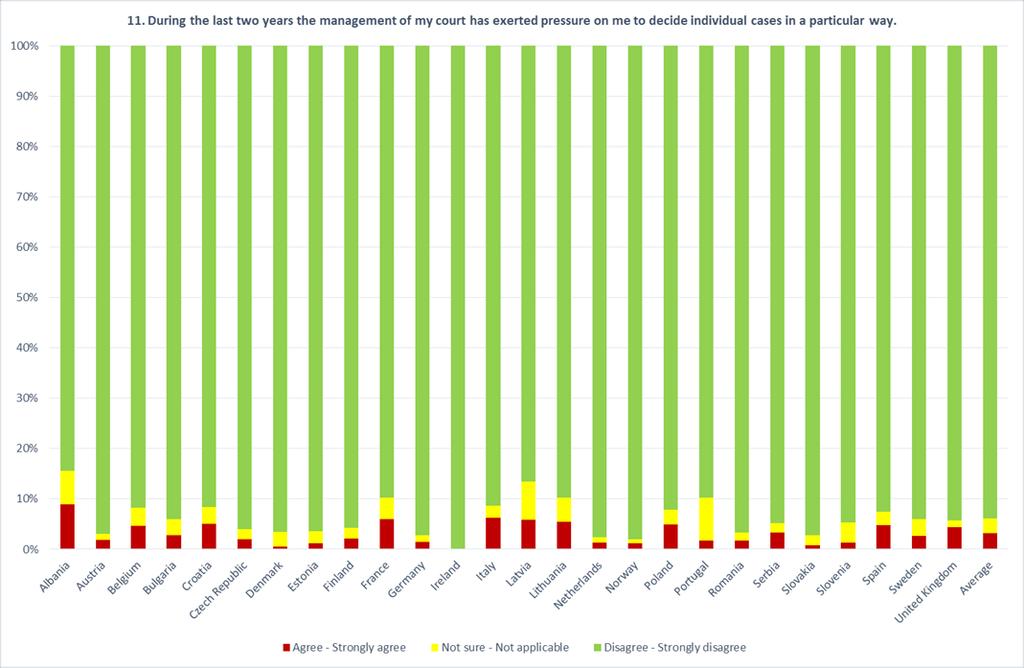
7 10. During the last two years I have had to take decisions in accordance with guidelines developed by judges of my rank. 11. During the last two years the management of my court has exerted pressure on me to decide individual cases in a particular way. 12. During the last two years the management of my court has exerted inappropriate pressure on me to decide individual cases within a particular time. 13. On a scale of 0-10 (where 0 means "not independent at all" and 10 means "the highest possible degree of independence), the professional judges in my country are not independent at all or completely independent. 14. On a scale of 0-10 (where 0 means "not independent at all" and 10 means "the highest possible degree of independence), as a judge I do not feel independent at all or feel completely independent. 15. What would, in your view, contribute most to the improvement of the independence of the judges in your country? Options: - A reduction of judicial corruption - Less use of (the threat of) disciplinary action by judicial authorities - Less use of (the threat of) claims for personal liability by parties - A more objective allocation of cases to judges - Appointment and promotion of judges strictly on the basis of ability and experience - Less pressure from the media - Less pressure from social media - Less guidelines by judges of my own rank - Less pressure from court management to decide cases in a particular way - Less pressure from court management to decide cases within a particular time - Better working conditions regarding pay including pensions and retirement age - Better working conditions regarding case load - Better working condition regarding court resources 7
8 4. Response rate per country and representativeness The figure below gives an overview of the response among the judges who received the survey in the participating countries. The countries are ranked from low to high response rates. *Number of judges based on CEPEJ data of total professional judges The response rate varies from 4 per cent in France to 61 per cent in Norway. The mean response rate over all participating countries is 24 per cent. For the representativeness of the results of the survey the absolute number of responses per country is important. Even if the response rate in a country is low, the results can be meaningful. In comparison, population surveys cover usually only a very small portion of the population, but are nevertheless statistically meaningful. The only caveat is that the response is not selective, in the sense that responding judges do not differ clearly from the not responding ones in aspects that are relevant to the results of the survey. This is relevant with each response rate which is not close to 100 per cent. The graph shows the number of responding judges per country, ranked by number. 8
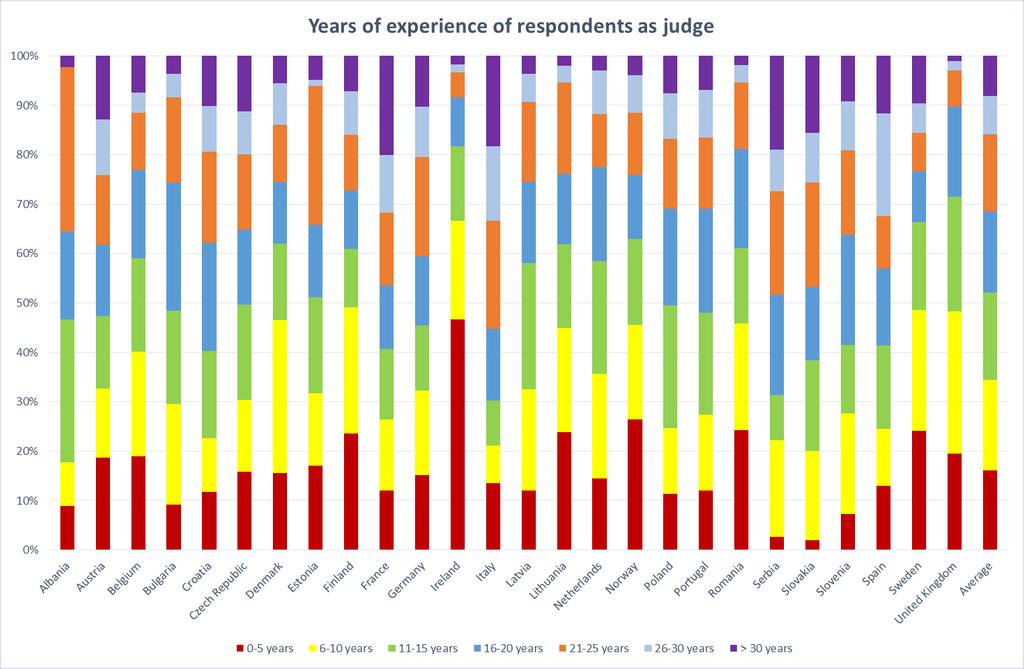
9 The number of responding judges varies from as few as 40 in Albania to as many as 3,017 in Germany. The confidence interval around the results for the countries with a small number of respondents (especially Albania, Ireland and Estonia) will be relatively large. For most countries, the numbers are high enough to distinguish meaningful differences which can be statistically checked by using the data that can be provided upon request by sending an to office@encj.eu. 2 Characteristics of the respondents The survey asked the respondents about their gender and experience. The following figures give the data. The mean female/male ratio is exactly 50%, whilst the differences between countries are substantial. Most respondents are very experienced judges. On average, only 17% had worked 0-5 years as a judge, whilst 65% had been a judge for more than 10 years. The differences among countries are substantial. Only the participants from Ireland report relatively short experience (47% have worked between 0 5 years). 2 For each question it can be established which percentage scores differ, for instance, significantly negatively from the mean score for all participating countries. When the answers are put into percentage scores, it can be calculated whether a country score is (e.g., at 5% level) significantly higher than the average score of all countries. The estimated standard deviation is based on that of a binomial probability distribution using the total percentage score over the countries and the number of responding judges of a country. When the answers are described by a mean score (questions 13 and 14), it is possible to calculate whether this score of a country is significantly lower than the total mean score over all countries by a t-test. The estimated standard deviation is based on the individual data for all countries and the number of responding judges of a country. To avoid technical analysis these calculations are not presented here. 9

10 As will be discussed later, the impact of gender and experience is limited. *2.9% the respondents did not answer the question. 10
11 11
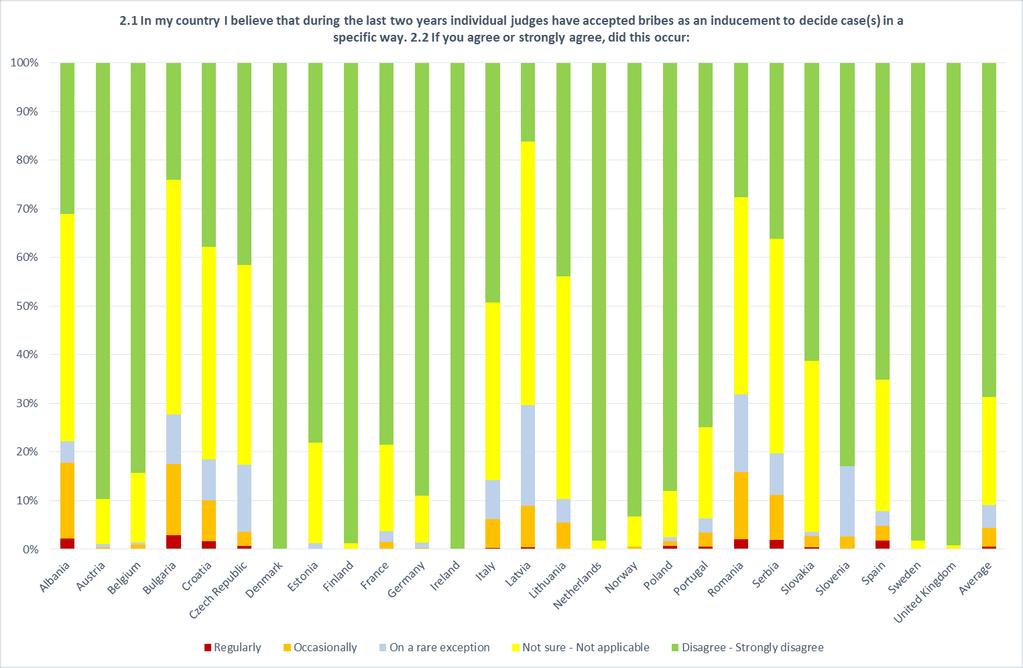
12 5. Main outcomes of the survey In this paragraph the outcomes of the survey are presented in tables per survey question for all participating countries. In this manner the data are made available concisely, as the opinions of 11,712 European judges about each subject are available at a glance. In addition to the results for each country, the average outcome across countries is given in all tables. Averages over all judges are not presented here, as big judiciaries with very many judges would dominate the outcome. Before turning to the tables, the outcomes are summarised. In this summary average outcomes refer to averages across countries, as just explained. Where large changes have occurred, a comparison is made with the previous survey, Overall perception of Independence On a 10-point scale judges rate the independence of the judges in their country between 6.5 and 10 on average per country. Five countries, all in Eastern Europe, have scores between 6.5 and 7. These countries are spread out between Albania and Latvia. The scores of six countries are between 9 and 10. These countries are the UK, Ireland, the Netherlands and the Scandinavian countries (except Sweden). These outcomes are consistent with the outcome that the vast majority of judges in Europe do not experience inappropriate pressure. 7% of the judges report inappropriate pressure (1% regularly, 3% occasionally and 3% very rarely). Percentages of 10% and higher are reported by Albania (24%), Croatia (12%), Lithuania (12%), Latvia (11%) and Spain (10%). In other countries, percentages are much lower with Denmark the lowest at 2%. The fact that judges are under inappropriate pressure does not mean, of course, that they yield to that pressure. When judges experience inappropriate pressure, the three most given answers as to who exerts this pressure are: (1) court management including the court president (25%), closely followed by (2) parties (24%) and their lawyers and at a wider distance by (3) the media (16%). Corruption As to the prevalence of bribes three categories of judiciaries can be distinguished. (1) Judiciaries in which nearly all judges are sure that no bribes are accepted. Countries are Denmark, Finland, Ireland, the Netherlands, Norway, Sweden and the UK. (2) Judiciaries in which a small percentage of judges (less than 4%) believes that bribes are accepted, and 10% - 20% is not sure whether or not bribes are accepted. Austria, Belgium, Estonia, France, Germany, Portugal and Poland fall into this category. And (3) judiciaries in which a higher percentage believes that bribery occurs and many more than 20% (up to 55%) are uncertain whether or not bribes are accepted. The fact that judges are uncertain about the occurrence of bribery is a bad sign in itself. On the positive side: when judges believe that bribery occurs, they seldom expect this to happen regularly. Internal aspects With regard to internal matters, case allocation and disciplinary action are distinguished in the survey. 10% or more of the judges in 7 countries believe that case allocation is used to influence the outcome of cases. The use of disciplinary action to influence judicial decisions is thought by more judges to happen than in the previous survey two years ago, but is still not widespread. Like two years ago the influence of management on how cases are decided is minimal. 12
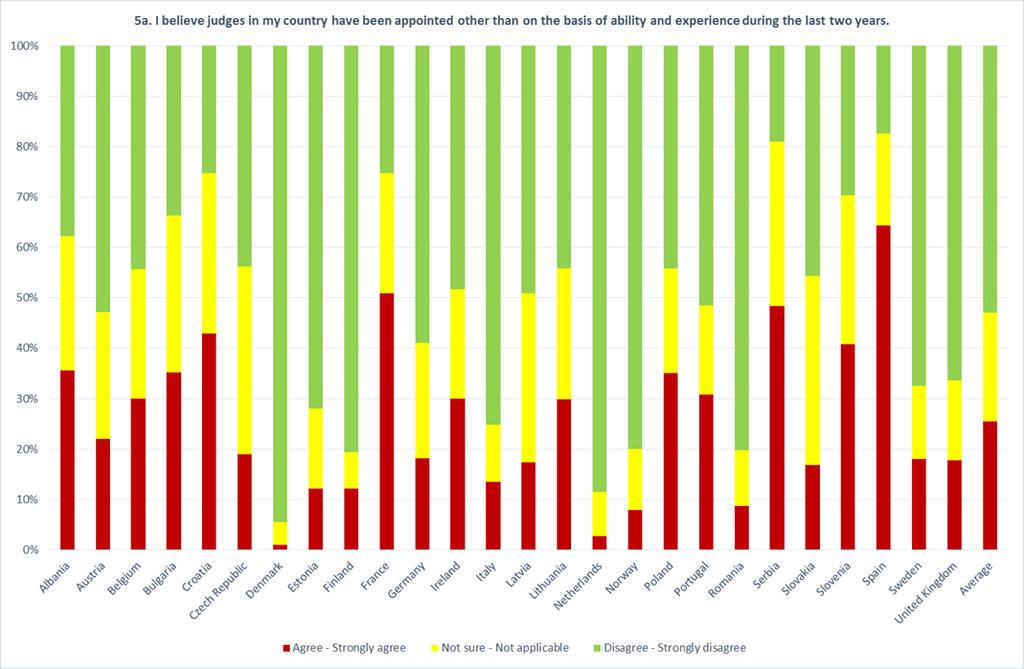
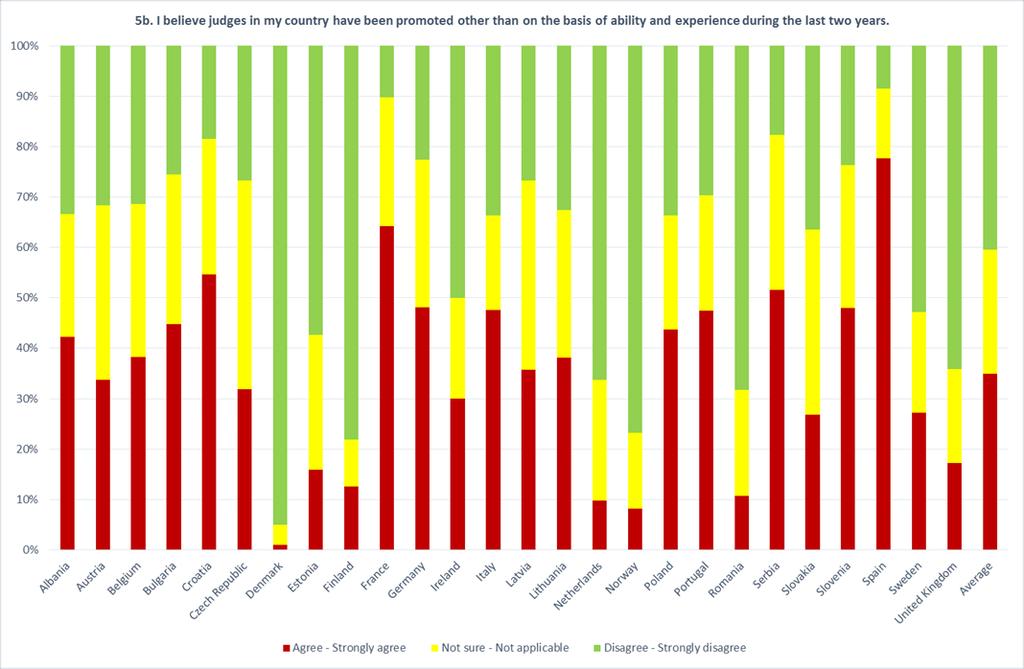
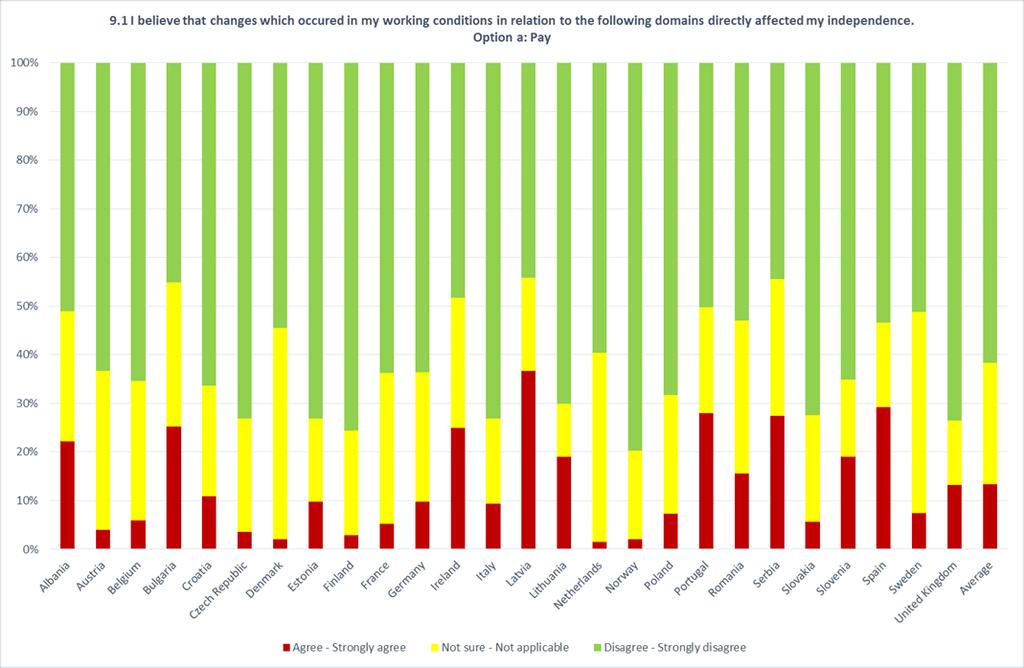
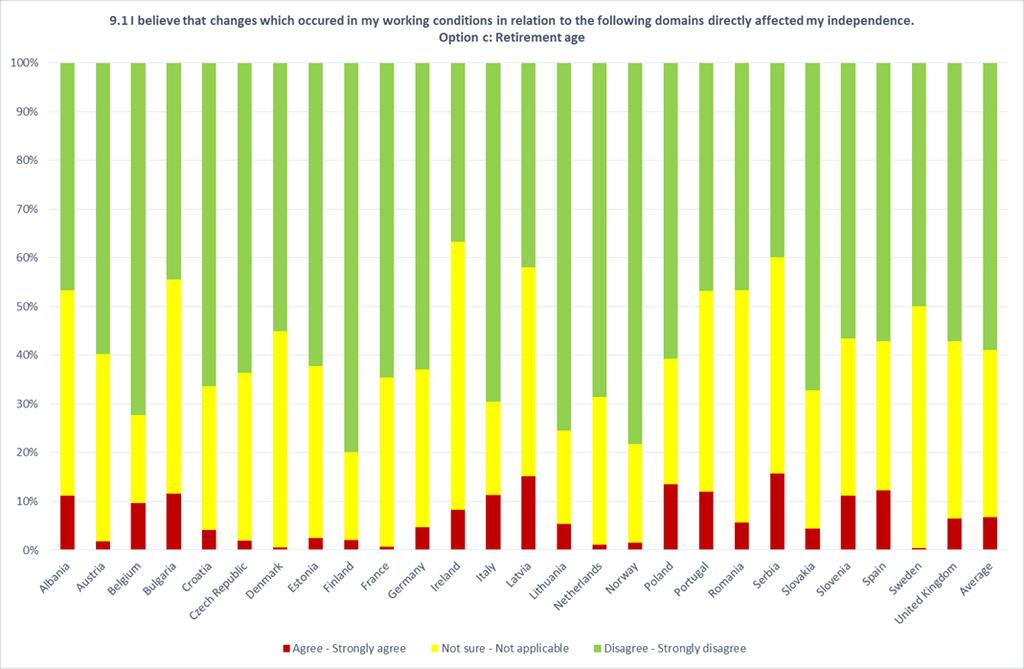
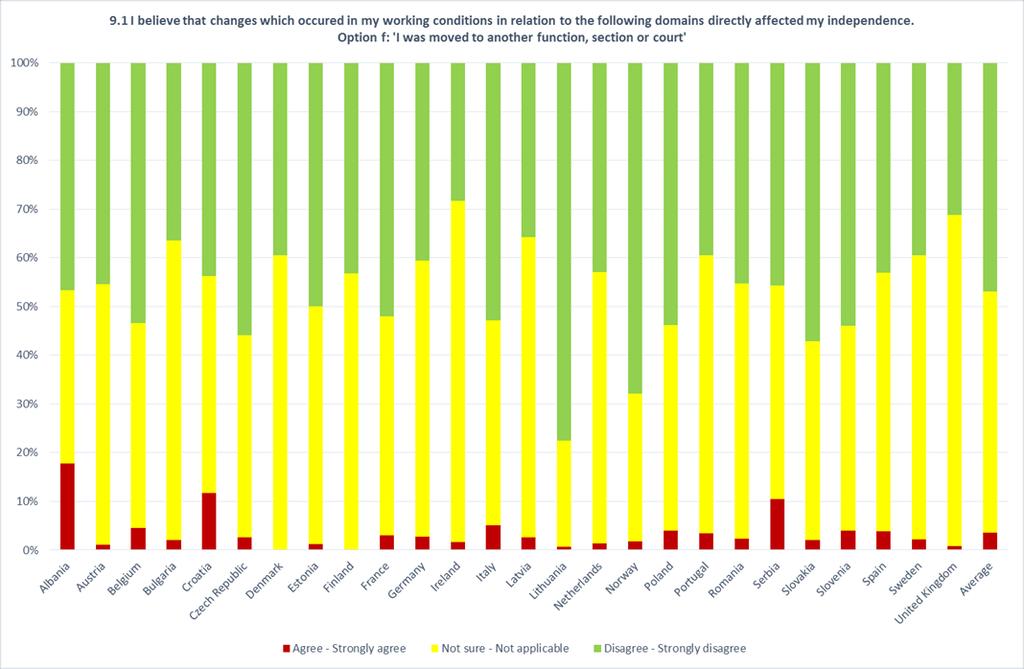
13 Influence of management and colleagues Whilst influence of management and colleagues is bad from the perspective of independence, it may be good from other perspectives, such as timeliness and the uniform application of the law. In many judiciaries, judges experience pressure from management to handle cases expeditiously. In the 2017 survey the word inappropriate was introduced in the relevant statement of the 2015 survey. It now reads: During the last two years the management of my court has exerted inappropriate pressure on me to decide individual cases within a particular time. This change provides inadvertently an interesting insight in the opinions of judges. Whilst in 2015 on average (across countries) 35% of the judges agreed with the statement, in 2017 only 15% agreed. In the Netherlands the score dropped from 44% to 5% and in Denmark from 23% to 3%. In other countries the drop was less pronounced, and in some countries it hardly occurred (e.g. for Spain it dropped only from 26 to 25% and in Italy from 23 to 20%). Apparently, pressure to decide cases within a particular time is not seen as inappropriate by many judges. Appointment and promotion The appointment and promotion decisions about judges are major issues. Many judges believe that appointment decisions are not based on merit and experience. Spain (65% of judges), France (50%) and Serbia (48%) stand out. Only in Denmark and the Netherlands do very few judges believe this to be the case (less than 5%). The situation with regard to promotion is even worse in most countries, with extremes in Spain (70%) and France (60%). On average, 38% versus 22% of judges have this view about promotion and appointment. Only five countries score below 10% on promotion with Denmark as the only country with a percentage below 5%. Impact of the (social) media The impact of the media on decisions of judges is large in most countries and is increasing. Only in Scandinavia, the Netherlands and the UK do well under 10% of judges believe this impact to exist. In other countries this percentage is higher: for instance, Germany and Czech Republic (20%), France, Spain and Poland (40%) and Italy and Croatia (60%). The influence of social media is much smaller than that of the traditional media, but it is increasing in nearly all countries. A particularly large influence is found in Italy and Croatia. Working conditions and independence Judges were also asked about changes in their working conditions which negatively impact independence. As in the first survey, pay, caseload and court resources are issues. The situation is essentially the same. With regard to pay, the situation is diverse. In quite a number of countries pay constitutes a problem, especially in Latvia, but also in Spain, Portugal, Ireland, Bulgaria, Serbia, Albania, Slovenia and Lithuania and (less so) in the UK. In other countries, it is not much of an issue. Caseload and court resource are a serious issue in many countries. Only in the Netherlands and some Scandinavian countries do well below 10% of judges believe these aspects to have an impact on their independence. France and Spain stand out at the other end of the spectrum. It should be noted that the transfer of judges is not an issue, except in Albania, Croatia and Serbia. 13
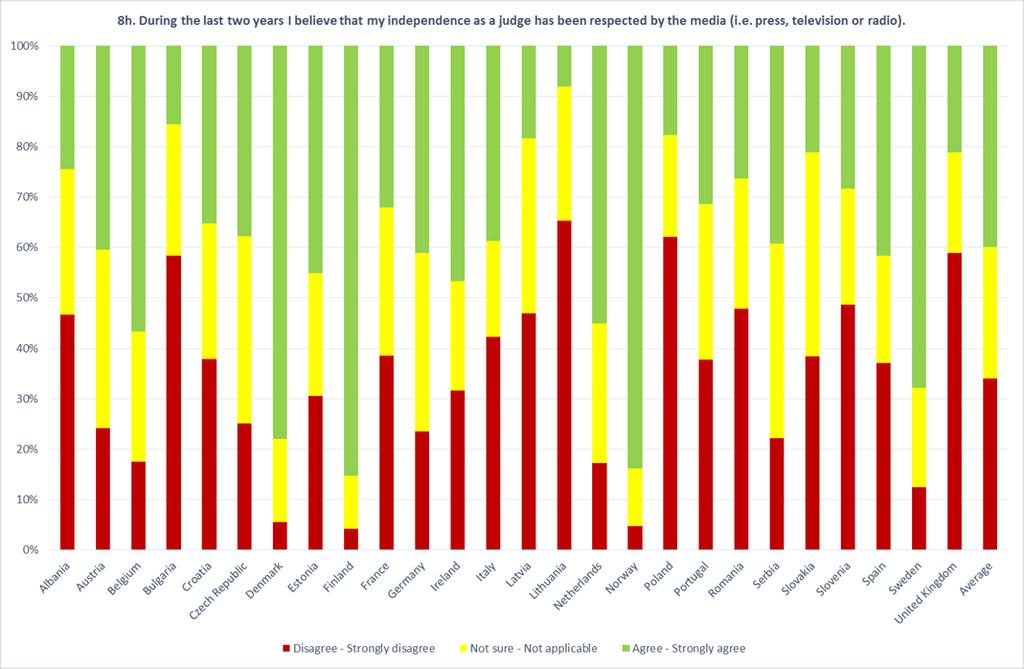
14 Respect for the Judiciary 22% of all participating judges feel that the Judiciary is not respected by government and parliament, and 34% by the media. The views about government and parliament are generally similar. The differences among judiciaries are very large. In Poland 75% of the judges feel not respected by government, in Bulgaria 55% and in the UK, Italy and Albania 40%. In Germany, Austria, Scandinavia and the Netherlands this percentage is well below 10%. Fluctuations over time can be large and need not be negative. For instance, in Italy the percentage dropped from 70% two years ago to 38% and in Slovakia from 48% to 17%. With regard to the media, the answers are consistent with the answers about the impact of the media on decisions discussed before. The issues are particularly large in Poland, UK, Lithuania and Bulgaria where around 60% of the respondents do not feel respected. In Germany, Czech Republic and Austria this percentage is still as much as 20%. The (lack of) respect shown in the social media is generally seen as less problematic, but in the UK, Poland, Bulgaria and Lithuania 50% of the judges and in quite a number of countries such as Germany and the Netherlands 30% of the judges do not feel respected. Mechanisms available to Councils to defend judicial independence On average, 33% of judges do not believe that Councils for the Judiciary have the appropriate mechanisms and procedures in order to defend judicial independence effectively. In Poland this percentage is 71%, whilst it is 62% in Spain, 50% in Portugal, 44% in Romania and 43% in Ireland. In France the percentage is 37% and in Italy 32%. Only in Denmark, the Netherlands and Norway the percentage is between 11% and 15%. Possibilities for improvement This time, the question was asked what would contribute most to the independence of the Judiciary in the country of the respondent. The respondents were asked to provide the three most important items. The responses were very consistent. Better working conditions regarding work load was mentioned most often (6,575 times), with working conditions regarding pay including pensions and retirement age in second place (5,737) and appointment and promotion based on ability and experience in third place (5,241). These items were followed by working conditions regarding court resources (4,748) and less pressure from the media (3,917). Other aspects were less frequently mentioned (less than 1,800). Impact of gender and experience As mentioned before, we also asked for some information about the personal characteristics of the respondents: gender and experience. Gender has no impact on the score about the independence of the judges in the country (on average for all countries 8.4 for male judges and 8.3 for female judges). The impact of gender on the opinions about specific aspects of independence is also limited, although differences exist among countries and some countries, in particular Albania, stand out. For instance, in Albania women disagree much more than men that judges are appointed solely on the basis of merit and experience. In general men are more critical, for instance about working conditions. The impact of experience is overall small, but in some countries substantial. There is a general tendency that very experienced judges score their independence higher than less experienced judges (score of 9.2 versus 8.8 for least experienced judges as average across all countries). 14
15 6. Results of survey per question in graphs 15
16 16
17 17
18 18
19 19
20 20
21 21

22 * Only results for countries that have a Council for the Judiciary are shown. 22
23 23
24 24


25 * Only results for countries that have a Council for the Judiciary are shown. 25
26 26
27 27
28 28
29 9.2:The three most frequently given answers to the question: I believe that changes which occurred in my working conditions in relation to the domains listed in 9.1 directly affected my independence (multiple answers possible): (a) Pay, (b) Pensions, (c) Retirement age, (d) Caseload and (e) Court resources. In addition, the following option was presented: (f) I was moved to another function, section or court. Country No.1 No.2 No.3 Albania Caseload Court resources Pay Austria Caseload Court resources Pay Belgium Court resources Pensions Caseload, Retirement age Bulgaria Pay Court resources Caseload Croatia Pay Court resources Caseload Czech Republic Caseload Court resources Pensions Denmark Court resources Caseload Pay Estonia Pay Caseload Court resources Finland Court resources Caseload Retirement age France Court resources Caseload Pay Germany Caseload Pay Court resources Ireland Court resources Pay Pensions Italy Court resources Caseload Retirement age Latvia Pay Caseload Court resources Lithuania Caseload Pay Court resources Montenegro Pay Caseload, Court resources Retirement age Netherlands Caseload Retirement age Court resources Norway Court resources Pay Pensions, Retirement age Poland Caseload Court resources Retirement age Portugal Pay Court resources Caseload Romania Caseload Pay Court resources Serbia Pay Court resources Caseload Slovakia Caseload Court resources Retirement age Slovenia Pay Court resources Caseload Spain Caseload Pay Court resources Sweden Caseload Court resources Pay United Kingdom Pensions Court resources Pay Average
30 Total Caseload Court resources Pay 30
31 31
32 32
33 7. Results of survey per question in tables For all the following tables it should be noted that: Average (per question) = the unweighted average of country percentages, excluding Montenegro or countries with 0 respondents; Total (per question) = the percentages of the total of all respondents, including Montenegro. Even though, Montenegro did not officially participate in the survey, eight respondents filled in Montenegro as their country of origin During the last two years I have been under inappropriate pressure to take a decision in a case or part of a case in a specific way. Question 1.1 Response Agree - agree Not sure - Not applicable Disagree - disagree Albania 45 24% 4% 71% Austria 648 4% 2% 95% Belgium 217 6% 4% 91% Bulgaria 250 3% 2% 94% Croatia % 6% 82% Czech Republic 990 5% 2% 93% Denmark 200 2% 1% 98% Estonia 82 7% 0% 93% Finland 238 4% 0% 96% France 265 6% 4% 90% Germany % 2% 95% Ireland 60 5% 2% 93% Italy 416 7% 2% 90% Latvia % 10% 79% Lithuania % 11% 77% Montenegro 8 0% 13% 88% Netherlands 575 3% 1% 95% Norway 340 3% 0% 97% Poland 696 7% 4% 89% Portugal 175 3% 2% 95% Romania 334 3% 1% 96% Serbia 153 5% 8% 86% Slovakia 250 6% 4% 90% Slovenia 152 9% 4% 88% Spain % 5% 85% Sweden 488 7% 2% 90% United Kingdom 905 5% 1% 94% Average - 7% 3% 90% Total % 3% 92% 33
34 1.1 During the last two years I have been under inappropriate pressure to take a decision in a case or part of a case in a specific way. 1.2 If you agree or strongly agree, did this occur: Question Respons Regularly Occasionally Very rarely Not sure - Not Disagree - disagree applicable Albania 45 0% 11% 13% 4% 71% Austria 648 0% 1% 2% 2% 95% Belgium 216 1% 2% 2% 4% 91% Bulgaria 249 0% 1% 2% 2% 96% Croatia 118 1% 3% 8% 6% 82% Czech Republic 986 0% 1% 3% 2% 93% Denmark 200 0% 1% 1% 1% 98% Estonia 82 1% 4% 2% 0% 93% Finland 237 0% 1% 2% 0% 96% France 264 0% 3% 3% 4% 90% Germany % 2% 1% 2% 95% Ireland 60 0% 3% 2% 2% 93% Italy 413 1% 4% 2% 2% 90% Latvia 224 1% 6% 4% 10% 79% Lithuania 146 1% 3% 8% 11% 77% Montenegro 8 0% 0% 0% 13% 88% Netherlands 572 0% 1% 2% 1% 95% Norway 340 0% 1% 2% 0% 97% Poland 695 1% 2% 4% 4% 90% Portugal 175 1% 1% 1% 2% 95% Romania 334 1% 1% 1% 1% 96% Serbia 154 1% 5% 1% 9% 87% Slovakia 248 0% 1% 4% 4% 90% Slovenia 152 1% 5% 3% 4% 88% Spain 717 2% 5% 3% 5% 85% Sweden 489 0% 3% 5% 2% 90% United Kingdom 901 1% 2% 2% 1% 94% Average - 1% 3% 3% 3% 90% Total % 2% 2% 3% 92% 34
35 1.3 If you agree or strongly agree with 1.1, by whom? Parties and their lawyers, Government, Parliament, other Judges (including an association of judges), Court Management (including the Court President), Council for the Judiciary, Supreme court, Constitutional court, Media, Social Media. 3 Most given answers per country: No.1 No.2 No.3 Albania Parties and their lawyers Media Government Austria Court Management Media, Parties and their lawyers Belgium Court Management Parties and their lawyers Other Judges (including an association of judges) Council for the Judiciary, Council for the Judiciary / High council of justice, Government, Media, Other Judges (including an association of judges) Bulgaria Other Judges (including an association of judges) Court Management, Parties and their lawyers Government Croatia Parties and their lawyers Court Management Czech Republic Parties and their lawyers Court Management, Media Other Judges (including an association of judges) Other Judges (including an association of judges) Denmark Court Management (incl. Court President), Government, Media, Other Judges (incl. association of judges), Parties and their lawyers - - Estonia Parties and their lawyers Media Supreme Court Finland Court Management, Parties and their lawyers Media, Other Judges (including an association of judges), Parliament - France Court Management (including a Court President) Parties and their lawyers Other Judges (including an association of judges) Germany Court Management (including a Court President) Parties and their lawyers Other Judges (including an association of judges) Ireland Media, Social Media Government, Parliament - Italy Parties and their lawyers Court Management (including a Court President) Other Judges (including an association of judges) Latvia Media Parties and their lawyers Court Management (including a Court President), Government Lithuania Court Management (including a Court President) Media Parties and their lawyers Montenegro Netherlands Court Management (incl. Court President), Other Council for the Judiciary / High council of justice, Parties and their lawyers Government, Media, Social Media 35
36 Judges (incl. association of judges) Norway Parties and their lawyers Court Management (including a Court President), Other Judges (including an association of judges) Media Poland Court Management (including a Court President) Media, Parties and their lawyers Government Portugal Parties and their lawyers Court Management (including a Court President) Council for the Judiciary Romania Council for the Judiciary Media, Parties and their lawyers, Supreme Court Constitutional Court, Government, Social Media Serbia Other Judges (including an association of judges), Parties and their lawyers Court Management (including a Court President) Council for the Judiciary, Media Slovakia Parties and their lawyers Media Court Management (including a Court President) Slovenia Media, Other Judges (including an association of judges) Parties and their lawyers Court Management (including a Court President) Spain Parties and their lawyers Media Court Management (including a Court President) Sweden Parties and their lawyers Court Management (including a Court President) Media United Kingdom Court Management (including a Court President) Government Other Judges (including an association of judges) Average Total Court Management (including a Court President) Parties and their lawyers Media 36
37 2.1 In my country I believe that during the last two years individual judges have accepted bribes as an inducement to decide case(s) in a specific way. Question 2.1 Response Agree - agree Not sure - Not applicable Disagree - disagree Albania 45 22% 47% 31% Austria 648 1% 9% 90% Belgium 217 1% 14% 84% Bulgaria % 48% 24% Croatia % 44% 38% Czech Republic % 41% 42% Denmark 200 1% 0% 100% Estonia 82 1% 21% 78% Finland 238 0% 1% 99% France 265 4% 18% 78% Germany % 10% 89% Ireland 60 0% 0% 100% Italy % 37% 49% Latvia % 54% 16% Lithuania % 46% 44% Montenegro 8 38% 38% 25% Netherlands 575 0% 2% 98% Norway 340 1% 6% 93% Poland 696 3% 9% 88% Portugal 175 6% 19% 75% Romania % 40% 28% Serbia % 44% 36% Slovakia 250 4% 35% 61% Slovenia % 0% 83% Spain 718 8% 27% 65% Sweden 488 0% 2% 98% United Kingdom 905 0% 1% 99% Average - 9% 22% 69% Total % 17% 76% 37
38 2.1 In my country I believe that during the last two years individual judges have accepted bribes as an inducement to decide case(s) in a specific way. 2.2 If you agree or strongly agree, did this occur: Question Response Regularly Occasionally On a rare exception Not sure/not applicable Disagree - disagree Albania 45 2% 16% 4% 47% 31% Austria 648 0% 0% 1% 9% 90% Belgium 217 0% 1% 0% 14% 84% Bulgaria 246 3% 15% 10% 48% 24% Croatia 119 2% 8% 8% 44% 38% Czech Republic 990 1% 3% 14% 41% 42% Denmark 199 0% 0% 0% 0% 100% Estonia 82 0% 0% 1% 21% 78% Finland 238 0% 0% 0% 1% 99% France 265 0% 2% 2% 18% 78% Germany % 0% 1% 10% 89% Ireland 60 0% 0% 0% 0% 100% Italy 416 0% 6% 8% 37% 49% Latvia 223 0% 9% 21% 54% 16% Lithuania 146 0% 5% 5% 46% 44% Montenegro 8 0% 25% 13% 38% 25% Netherlands 574 0% 0% 0% 2% 98% Norway 340 0% 1% 0% 6% 93% Poland 694 1% 1% 1% 10% 88% Portugal 175 1% 3% 3% 19% 75% Romania 333 2% 14% 16% 41% 28% Serbia 152 2% 9% 9% 44% 36% Slovakia 250 0% 2% 1% 35% 61% Slovenia 152 0% 3% 14% 0% 83% Spain 717 2% 3% 3% 27% 65% Sweden 488 0% 0% 0% 2% 98% United Kingdom 903 0% 0% 0% 1% 99% Average - 1% 4% 5% 22% 69% Total % 2% 4% 17% 76% 38
39 3a. During the last two years I have been affected by a threat of, or actual, disciplinary or other action because of how I have decided a case. Question 3a Response Agree - agree Not sure - Not applicable Disagree - disagree Albania 45 7% 7% 87% Austria 648 4% 3% 93% Belgium 217 7% 1% 92% Bulgaria 250 7% 5% 88% Croatia 119 8% 2% 90% Czech Republic 990 2% 2% 96% Denmark 200 1% 1% 98% Estonia 82 5% 6% 89% Finland 238 4% 1% 95% France 265 6% 1% 93% Germany % 1% 97% Ireland 60 10% 0% 90% Italy % 2% 87% Latvia % 9% 73% Lithuania % 6% 75% Montenegro 8 0% 0% 100% Netherlands 575 5% 1% 95% Norway 340 4% 0% 96% Poland % 3% 83% Portugal 175 6% 3% 90% Romania % 3% 83% Serbia 153 7% 1% 92% Slovakia 250 2% 4% 94% Slovenia 152 5% 6% 89% Spain % 6% 84% Sweden 488 2% 2% 96% United Kingdom 905 3% 1% 97% Average - 7% 3% 90% Total % 2% 92% 39
40 3b. During the last two years my decisions or actions have been directly affected by a claim, or a threat of a claim, for personal liability. Question 3b Response Agree - agree Not sure - Not applicable Disagree - disagree Albania 45 4% 18% 78% Austria % 3% 86% Belgium 217 8% 2% 90% Bulgaria 250 3% 6% 91% Croatia % 8% 74% Czech Republic 990 3% 1% 96% Denmark 200 1% 0% 99% Estonia 82 5% 4% 91% Finland 238 7% 1% 92% France % 5% 83% Germany % 3% 94% Ireland 60 5% 0% 95% Italy % 7% 78% Latvia 224 7% 8% 85% Lithuania 147 2% 3% 95% Montenegro 8 0% 13% 88% Netherlands 575 0% 0% 100% Norway 340 0% 1% 99% Poland % 6% 78% Portugal 175 7% 7% 86% Romania 334 9% 3% 87% Serbia 153 7% 4% 89% Slovakia 250 4% 6% 90% Slovenia 152 5% 4% 91% Spain % 6% 79% Sweden 488 2% 2% 96% United Kingdom 905 1% 1% 98% Average - 7% 4% 89% Total % 3% 91% 40
41 4. I believe during the last two years cases have been allocated to judges other than in accordance with established rules or procedures in order to influence the outcome of the particular case. Question 4 Response Agree - agree Not sure - Not applicable Disagree - disagree Albania 45 13% 31% 56% Austria 648 2% 9% 88% Belgium 217 7% 18% 76% Bulgaria % 24% 59% Croatia % 21% 69% Czech Republic 990 6% 19% 74% Denmark 200 1% 1% 99% Estonia 82 9% 13% 78% Finland 238 3% 4% 93% France % 22% 61% Germany % 6% 92% Ireland 60 0% 3% 97% Italy 416 6% 13% 80% Latvia % 30% 52% Lithuania 147 3% 23% 73% Montenegro 8 13% 38% 50% Netherlands 575 2% 6% 92% Norway 340 2% 5% 93% Poland 696 6% 10% 84% Portugal % 18% 67% Romania 334 2% 9% 88% Serbia 153 8% 20% 72% Slovakia 250 3% 10% 88% Slovenia 152 2% 18% 80% Spain % 26% 56% Sweden 488 6% 7% 87% United Kingdom 905 2% 5% 93% Average - 7% 14% 79% Total % 11% 83% 41
42 5a. I believe judges in my country have been appointed other than on the basis of ability and experience during the last two years. Question 5a Response Agree - agree Not sure - Not applicable Disagree - disagree Albania 45 36% 27% 38% Austria % 25% 53% Belgium % 26% 44% Bulgaria % 31% 34% Croatia % 32% 25% Czech Republic % 37% 44% Denmark 200 1% 5% 95% Estonia 82 12% 16% 72% Finland % 7% 81% France % 24% 25% Germany % 23% 59% Ireland 60 30% 22% 48% Italy % 11% 75% Latvia % 33% 49% Lithuania % 26% 44% Montenegro 8 63% 0% 38% Netherlands 575 3% 9% 89% Norway 340 8% 12% 80% Poland % 21% 44% Portugal % 18% 51% Romania 334 9% 11% 80% Serbia % 33% 19% Slovakia % 38% 46% Slovenia % 30% 30% Spain % 18% 17% Sweden % 15% 67% United Kingdom % 16% 66% Average - 25% 22% 53% Total % 22% 55% 42
43 5b. I believe judges in my country have been promoted other than on the basis of ability and experience during the last two years. Question 5b Response Agree - agree Not sure - Not applicable Disagree - disagree Albania 45 42% 24% 33% Austria % 35% 32% Belgium % 30% 31% Bulgaria % 30% 26% Croatia % 27% 18% Czech Republic % 41% 27% Denmark 200 1% 4% 95% Estonia 82 16% 27% 57% Finland % 9% 78% France % 26% 10% Germany % 29% 23% Ireland 60 30% 20% 50% Italy % 19% 34% Latvia % 38% 27% Lithuania % 29% 33% Montenegro 8 63% 13% 25% Netherlands % 24% 66% Norway 340 8% 15% 77% Poland % 23% 34% Portugal % 23% 30% Romania % 21% 68% Serbia % 31% 18% Slovakia % 37% 36% Slovenia % 28% 24% Spain % 14% 8% Sweden % 20% 53% United Kingdom % 19% 64% Average - 35% 25% 40% Total % 26% 36% 43
44 6. I believe that in my country decisions or actions of individual judges have, during the last two years, been inappropriately influenced by the actual, or anticipated, actions of the media (i. e. press, television or radio). Question 6 Response Agree - agree Not sure - Not applicable Disagree - disagree Albania 45 44% 40% 16% Austria % 29% 55% Belgium % 34% 49% Bulgaria % 36% 17% Croatia % 14% 24% Czech Republic % 37% 41% Denmark 200 1% 6% 93% Estonia 82 17% 33% 50% Finland 238 5% 9% 86% France % 32% 29% Germany % 37% 44% Ireland 60 10% 10% 80% Italy % 14% 22% Latvia % 42% 19% Lithuania % 44% 21% Montenegro 8 13% 38% 50% Netherlands 575 4% 17% 80% Norway 340 6% 19% 74% Poland % 24% 38% Portugal % 29% 31% Romania % 40% 37% Serbia % 38% 24% Slovakia % 32% 22% Slovenia % 43% 29% Spain % 30% 25% Sweden 488 8% 22% 70% United Kingdom 905 5% 13% 81% Average - 28% 28% 45% Total % 29% 47% 44
45 7. I believe that in my country decisions or actions of individual judges have, during the last two years, been inappropriately influenced by the actual, or anticipated, actions using social media (for example, Facebook, Twitter or LinkedIn). Question 7 Response Agree - agree Not sure - Not applicable Disagree - disagree Albania 45 20% 47% 33% Austria 648 9% 27% 64% Belgium 217 5% 34% 61% Bulgaria % 48% 32% Croatia % 28% 34% Czech Republic 990 6% 36% 58% Denmark 200 0% 4% 97% Estonia 82 6% 37% 57% Finland 238 3% 9% 88% France % 35% 53% Germany % 33% 59% Ireland 60 5% 13% 82% Italy % 30% 25% Latvia % 42% 44% Lithuania 147 7% 42% 50% Montenegro 8 0% 50% 50% Netherlands 575 2% 14% 83% Norway 340 6% 20% 74% Poland % 30% 56% Portugal % 37% 48% Romania 334 6% 36% 57% Serbia % 44% 42% Slovakia % 42% 44% Slovenia % 40% 48% Spain % 44% 39% Sweden 488 3% 20% 77% United Kingdom 905 2% 12% 87% Average - 12% 31% 57% Total % 30% 60% 45
46 8a. During the last two years I believe that my independence as a judge has been respected by: Government Question 8.1 Response Agree - agree Not sure - Not applicable Disagree - disagree Albania 45 38% 16% 47% Austria % 17% 8% Belgium % 18% 22% Bulgaria % 31% 54% Croatia % 27% 15% Czech Republic % 23% 21% Denmark % 12% 4% Estonia 82 55% 18% 27% Finland % 3% 5% France % 18% 15% Germany % 14% 8% Ireland 60 75% 5% 20% Italy % 12% 38% Latvia % 33% 34% Lithuania % 33% 29% Montenegro 8 63% 13% 25% Netherlands % 9% 6% Norway % 3% 1% Poland % 9% 74% Portugal % 20% 38% Romania % 26% 36% Serbia % 25% 13% Slovakia % 28% 17% Slovenia % 17% 18% Spain % 15% 28% Sweden % 5% 3% United Kingdom % 17% 43% Average - 59% 18% 24% Total % 16% 21% 46
47 8a. During the last two years I believe that my independence as a judge has been respected by: Parliament Question 8.2 Response Agree - agree Not sure - Not applicable Disagree - disagree Albania 45 53% 16% 31% Austria % 15% 6% Belgium % 14% 15% Bulgaria % 37% 42% Croatia % 23% 16% Czech Republic % 26% 16% Denmark % 10% 5% Estonia 82 60% 21% 20% Finland % 3% 5% France % 18% 13% Germany % 13% 6% Ireland 60 57% 18% 25% Italy % 13% 32% Latvia % 34% 35% Lithuania % 28% 40% Montenegro 8 63% 25% 13% Netherlands % 15% 12% Norway % 4% 1% Poland % 12% 72% Portugal % 22% 31% Romania % 24% 36% Serbia % 26% 12% Slovakia % 28% 16% Slovenia % 23% 26% Spain % 16% 21% Sweden % 6% 2% United Kingdom % 19% 29% Average - 60% 19% 22% Total % 17% 19% 47
48 8a. During the last two years I believe that my independence as a judge has been respected by: Court Management (Including the president of the court) Question 8.3 Response Agree - agree Not sure - Not applicable Disagree - disagree Albania 45 87% 4% 9% Austria % 8% 6% Belgium % 4% 8% Bulgaria % 5% 6% Croatia % 11% 9% Czech Republic % 5% 4% Denmark % 3% 0% Estonia 82 78% 11% 11% Finland % 3% 5% France % 11% 6% Germany % 9% 6% Ireland 60 80% 12% 8% Italy % 5% 10% Latvia % 13% 11% Lithuania % 12% 7% Montenegro 8 100% 0% 0% Netherlands % 3% 3% Norway % 5% 2% Poland % 4% 5% Portugal % 12% 22% Romania % 9% 6% Serbia % 8% 6% Slovakia % 6% 4% Slovenia % 13% 5% Spain % 11% 16% Sweden % 4% 8% United Kingdom % 8% 12% Average - 85% 8% 7% Total % 7% 7% 48
49 8a. During the last two years I believe that my independence as a judge has been respected by: Council for the Judiciary Question 8.4 Respons Agree - agree Not sure - Not applicable Disagree - disagree Albania 45 84% 4% 11% Austria % 16% 2% Belgium % 10% 4% Bulgaria % 25% 23% Croatia % 15% 5% Czech Republic % 61% 1% Denmark % 2% 1% Estonia 82 71% 20% 10% Finland % 90% 0% France % 6% 1% Germany % 45% 1% Ireland 60 35% 63% 2% Italy % 7% 9% Latvia % 21% 4% Lithuania % 12% 4% Montenegro 8 75% 13% 13% Netherlands % 8% 4% Norway % 5% 3% Poland % 5% 3% Portugal % 14% 23% Romania % 21% 10% Serbia % 13% 8% Slovakia % 13% 2% Slovenia % 13% 3% Spain % 12% 26% Sweden % 9% 7% United Kingdom % 24% 3% Average - 73% 21% 7% Total % 27% 5% 49
50 8a. During the last two years I believe that my independence as a judge has been respected by: Supreme Court Question 8.5 Response Agree - agree Not sure - Not applicable Disagree - disagree Albania 45 82% 16% 2% Austria % 5% 0% Belgium % 6% 2% Bulgaria % 14% 4% Croatia % 12% 1% Czech Republic % 10% 2% Denmark % 4% 0% Estonia 82 78% 12% 10% Finland % 5% 1% France % 5% 1% Germany % 8% 1% Ireland 60 93% 5% 2% Italy % 7% 5% Latvia % 16% 6% Lithuania % 8% 2% Montenegro 8 75% 13% 13% Netherlands % 3% 1% Norway % 2% 0% Poland % 4% 2% Portugal % 11% 6% Romania % 13% 6% Serbia % 18% 5% Slovakia % 14% 2% Slovenia % 8% 3% Spain % 11% 5% Sweden % 9% 0% United Kingdom % 9% 2% Average - 88% 9% 3% Total % 8% 2% 50
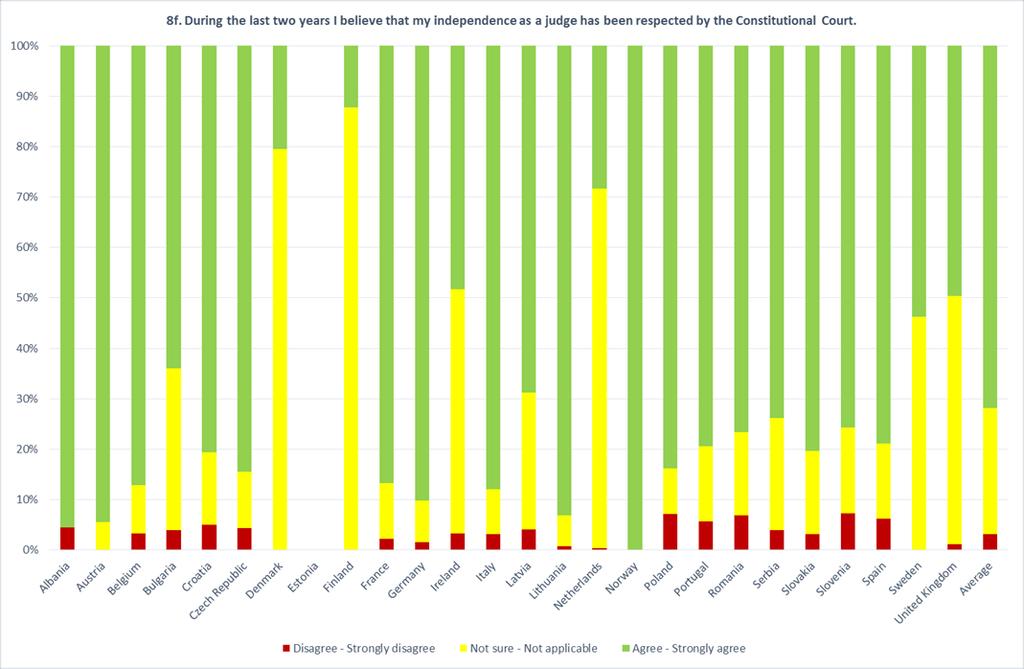
51 8a. During the last two years I believe that my independence as a judge has been respected by: Constitutional Court Question 8.6 Respons Agree - agree Not sure - Not applicable Disagree - disagree Albania 45 96% 0% 4% Austria % 6% 0% Belgium % 10% 3% Bulgaria % 32% 4% Croatia % 14% 5% Czech Republic % 11% 4% Denmark % 80% 0% Estonia Finland % 88% 0% France % 11% 2% Germany % 8% 2% Ireland 60 48% 48% 3% Italy % 9% 3% Latvia % 27% 4% Lithuania % 6% 1% Montenegro 8 63% 25% 13% Netherlands % 71% 0% Norway 1 100% 0% 0% Poland % 9% 7% Portugal % 15% 6% Romania % 16% 7% Serbia % 22% 4% Slovakia % 16% 3% Slovenia % 17% 7% Spain % 15% 6% Sweden % 46% 0% United Kingdom % 49% 1% Average - 72% 25% 3% Total % 22% 3% 51
52 8a. During the last two years I believe that my independence as a judge has been respected by: Association of Judges Question 8.7 Respons Agree - agree Not sure - Not applicable Disagree - disagree Albania 45 87% 9% 4% Austria % 2% 1% Belgium % 10% 3% Bulgaria % 27% 5% Croatia % 12% 5% Czech Republic % 21% 2% Denmark % 4% 0% Estonia 82 71% 21% 9% Finland % 6% 1% France % 10% 3% Germany % 6% 1% Ireland 60 93% 3% 3% Italy % 12% 7% Latvia % 25% 6% Lithuania % 10% 5% Montenegro 8 50% 25% 25% Netherlands % 7% 1% Norway % 5% 1% Poland % 5% 2% Portugal % 15% 5% Romania % 10% 6% Serbia % 16% 5% Slovakia % 16% 3% Slovenia % 11% 2% Spain % 13% 5% Sweden % 16% 1% United Kingdom % 13% 2% Average - 85% 12% 3% Total % 10% 2% 52
53 8a. During the last two years I believe that my independence as a judge has been respected by: Media (i.e. press, television or radio) Question 8.8 Respons Agree - agree Not sure - Not applicable Disagree - disagree Albania 45 24% 29% 47% Austria % 35% 24% Belgium % 26% 18% Bulgaria % 26% 58% Croatia % 27% 38% Czech Republic % 37% 25% Denmark % 17% 6% Estonia 82 45% 24% 30% Finland % 11% 4% France % 29% 38% Germany % 35% 23% Ireland 60 47% 22% 32% Italy % 19% 42% Latvia % 35% 47% Lithuania 147 8% 27% 65% Montenegro 8 25% 38% 38% Netherlands % 28% 17% Norway % 11% 5% Poland % 20% 62% Portugal % 31% 38% Romania % 26% 48% Serbia % 39% 22% Slovakia % 40% 38% Slovenia % 23% 49% Spain % 21% 37% Sweden % 20% 13% United Kingdom % 20% 59% Average - 40% 26% 34% Total % 28% 32% 53
54 8a. During the last two years I believe that my independence as a judge has been respected by: Social Media (for example Facebook, Twitter or LinkedIn) Question 8.9 Respons Agree - agree Not sure - Not applicable Disagree - disagree Albania 45 27% 40% 33% Austria % 45% 31% Belgium % 34% 18% Bulgaria % 38% 50% Croatia % 39% 29% Czech Republic % 55% 18% Denmark % 43% 6% Estonia 82 33% 48% 20% Finland % 33% 17% France % 39% 31% Germany % 44% 28% Ireland 60 20% 47% 33% Italy % 34% 36% Latvia % 49% 34% Lithuania 147 7% 47% 46% Montenegro 8 25% 38% 38% Netherlands % 38% 30% Norway % 36% 9% Poland % 39% 47% Portugal % 37% 35% Romania Serbia % 48% 15% Slovakia % 52% 27% Slovenia % 31% 41% Spain % 31% 30% Sweden % 33% 20% United Kingdom % 37% 47% Average - 30% 41% 29% Total % 41% 30% 54
Pan-European opinion poll on occupational safety and health
 REPORT Pan-European opinion poll on occupational safety and health Results across 36 European countries Final report Conducted by Ipsos MORI Social Research Institute at the request of the European Agency
European Advertising Business Climate Index Q4 2016/Q #AdIndex2017
 European Advertising Business Climate Index Q4 216/Q1 217 ABOUT Quarterly survey of European advertising and market research companies Provides information about: managers assessment of their business
EU-28 RECOVERED PAPER STATISTICS. Mr. Giampiero MAGNAGHI On behalf of EuRIC
 EU-28 RECOVERED PAPER STATISTICS Mr. Giampiero MAGNAGHI On behalf of EuRIC CONTENTS EU-28 Paper and Board: Consumption and Production EU-28 Recovered Paper: Effective Consumption and Collection EU-28 -
Survey on the access to finance of enterprises (SAFE)
") Survey on the access to finance of enterprises (SAFE) Analytical Report 2017 Written by Ton Kwaak, Martin Clarke, Irena Mikolajun and Carlos Raga Abril November 2017 EUROPEAN COMMISSION Directorate-General
Survey on the access to finance of enterprises (SAFE) Analytical Report 2017 Written by Ton Kwaak, Martin Clarke, Irena Mikolajun and Carlos Raga Abril November 2017 EUROPEAN COMMISSION Directorate-General
Special Eurobarometer 465. Gender Equality 2017
 Summary Gender Equality 01 Gender Pay Gap Survey requested by the European Commission, Directorate-General for Justice and Consumers and co-ordinated by the Directorate-General for Communication This document
Live Long and Prosper? Demographic Change and Europe s Pensions Crisis. Dr. Jochen Pimpertz Brussels, 10 November 2015
 Live Long and Prosper? Demographic Change and Europe s Pensions Crisis Dr. Jochen Pimpertz Brussels, 10 November 2015 Old-age-dependency ratio, EU28 45,9 49,4 50,2 39,0 27,5 31,8 2013 2020 2030 2040 2050
Spain France. England Netherlands. Wales Ukraine. Republic of Ireland Czech Republic. Romania Albania. Serbia Israel. FYR Macedonia Latvia
 Germany Belgium Portugal Spain France Switzerland Italy England Netherlands Iceland Poland Croatia Slovakia Russia Austria Wales Ukraine Sweden Bosnia-Herzegovina Republic of Ireland Czech Republic Turkey
REPORT FROM THE COMMISSION TO THE EUROPEAN PARLIAMENT, THE COUNCIL, THE EUROPEAN ECONOMIC AND SOCIAL COMMITTEE AND THE COMMITTEE OF THE REGIONS
 EUROPEAN COMMISSION Brussels,.4.29 COM(28) 86 final/ 2 ANNEXES to 3 ANNEX to the REPORT FROM THE COMMISSION TO THE EUROPEAN PARLIAMENT, THE COUNCIL, THE EUROPEAN ECONOMIC AND SOCIAL COMMITTEE AND THE COMMITTEE
Survey on the access to finance of enterprises (SAFE)
") Survey on the access to finance of enterprises (SAFE) Analytical Report 2016 Written by Amber van der Graaf, Ton Kwaak and Paul van der Zeijden November 2016 EUROPEAN COMMISSION Directorate-General for
Survey on the access to finance of enterprises (SAFE) Analytical Report 2016 Written by Amber van der Graaf, Ton Kwaak and Paul van der Zeijden November 2016 EUROPEAN COMMISSION Directorate-General for
EU BUDGET AND NATIONAL BUDGETS
 DIRECTORATE GENERAL FOR INTERNAL POLICIES POLICY DEPARTMENT ON BUDGETARY AFFAIRS EU BUDGET AND NATIONAL BUDGETS 1999-2009 October 2010 INDEX Foreward 3 Table 1. EU and National budgets 1999-2009; EU-27
Single Market Scoreboard
 Single Market Scoreboard Performance per Member State Romania (Reporting period: 2017) Transposition of law In 2016, the Member States had to transpose 66 new directives, which represents a large increase
Developments for age management by companies in the EU
 Developments for age management by companies in the EU Erika Mezger, Deputy Director EUROFOUND, Dublin Workshop on Active Ageing and coping with demographic change Prague, 6 September 2012 12/09/2012 1
European Union Statistics on Income and Living Conditions (EU-SILC)
") European Union Statistics on Income and Living Conditions (EU-SILC) European Union Statistics on Income and Living Conditions (EU-SILC) is a household survey that was launched in 23 on the basis of a gentlemen's
European Union Statistics on Income and Living Conditions (EU-SILC) European Union Statistics on Income and Living Conditions (EU-SILC) is a household survey that was launched in 23 on the basis of a gentlemen's
NOTE. for the Interparliamentary Meeting of the Committee on Budgets
 NOTE for the Interparliamentary Meeting of the Committee on Budgets THE ROLE OF THE EU BUDGET TO SUPPORT MEMBER STATES IN ACHIEVING THEIR ECONOMIC OBJECTIVES AS AGREED WITHIN THE FRAMEWORK OF THE EUROPEAN
THE IMPACT OF THE PUBLIC DEBT STRUCTURE IN THE EUROPEAN UNION MEMBER COUNTRIES ON THE POSSIBILITY OF DEBT OVERHANG
 THE IMPACT OF THE PUBLIC DEBT STRUCTURE IN THE EUROPEAN UNION MEMBER COUNTRIES ON THE POSSIBILITY OF DEBT OVERHANG Robert Huterski, PhD Nicolaus Copernicus University in Toruń Faculty of Economic Sciences
The Architectural Profession in Europe 2012
 The Architectural Profession in Europe 2012 - A Sector Study Commissioned by the Architects Council of Europe Chapter 2: Architecture the Market December 2012 2 Architecture - the Market The Construction
ANNUAL REVIEW BY THE COMMISSION. of Member States' Annual Activity Reports on Export Credits in the sense of Regulation (EU) No 1233/2011
 No 1233/2011") EUROPEAN COMMISSION Brussels, 7.2.2017 COM(2017) 67 final ANNUAL REVIEW BY THE COMMISSION of Member States' Annual Activity Reports on Export Credits in the sense of Regulation (EU) No 1233/2011 EN EN
EUROPEAN COMMISSION Brussels, 7.2.2017 COM(2017) 67 final ANNUAL REVIEW BY THE COMMISSION of Member States' Annual Activity Reports on Export Credits in the sense of Regulation (EU) No 1233/2011 EN EN
Special Eurobarometer 418 SOCIAL CLIMATE REPORT
 Special Eurobarometer 418 SOCIAL CLIMATE REPORT Fieldwork: June 2014 Publication: November 2014 This survey has been requested by the European Commission, Directorate-General for Employment, Social Affairs
October 2010 Euro area unemployment rate at 10.1% EU27 at 9.6%
 STAT//180 30 November 20 October 20 Euro area unemployment rate at.1% EU27 at 9.6% The euro area 1 (EA16) seasonally-adjusted 2 unemployment rate 3 was.1% in October 20, compared with.0% in September 4.
Electricity & Gas Prices in Ireland. Annex Business Electricity Prices per kwh 2 nd Semester (July December) 2016
 2016") Electricity & Gas Prices in Ireland Annex Business Electricity Prices per kwh 2 nd Semester (July December) 2016 ENERGY POLICY STATISTICAL SUPPORT UNIT 1 Electricity & Gas Prices in Ireland Annex Business
Electricity & Gas Prices in Ireland Annex Business Electricity Prices per kwh 2 nd Semester (July December) 2016 ENERGY POLICY STATISTICAL SUPPORT UNIT 1 Electricity & Gas Prices in Ireland Annex Business
FCCC/SBI/2010/10/Add.1
 United Nations Framework Convention on Climate Change Distr.: General 25 August 2010 Original: English Subsidiary Body for Implementation Contents Report of the Subsidiary Body for Implementation on its
Raising the retirement age is the labour market ready for active ageing: evidence from EB and Eurofound research
 Raising the retirement age is the labour market ready for active ageing: evidence from EB and Eurofound research Robert Anderson, EUROFOUND, Dublin Reforming pension systems in Europe and Central Asia
EIOPA Statistics - Accompanying note
 EIOPA Statistics - Accompanying note Publication references: Published statistics: [Balance sheet], [Premiums, claims and expenses], [Own funds and SCR] Disclaimer: Data is drawn from the published statistics
11 th Economic Trends Survey of the Impact of Economic Downturn
 11 th Economic Trends Survey 11 th Economic Trends Survey of the Impact of Economic Downturn 11 th Economic Trends Survey COUNTRY ANSWERS Austria 155 Belgium 133 Bulgaria 192 Croatia 185 Cyprus 1 Czech
Approach to Employment Injury (EI) compensation benefits in the EU and OECD
 compensation benefits in the EU and OECD") Approach to (EI) compensation benefits in the EU and OECD The benefits of protection can be divided in three main groups. The cash benefits include disability pensions, survivor's pensions and other short-
Approach to (EI) compensation benefits in the EU and OECD The benefits of protection can be divided in three main groups. The cash benefits include disability pensions, survivor's pensions and other short-
Enterprise Europe Network SME growth forecast
 Enterprise Europe Network SME growth forecast 2017-18 een.ec.europa.eu Foreword Since we came into office three years ago, this European Commission has put the creation of more jobs and growth at the centre
EIOPA Statistics - Accompanying note
 EIOPA Statistics - Accompanying note Publication reference: Published statistics: [Balance sheet], [Premiums, claims and expenses], [Own funds and SCR] Disclaimer: Data is drawn from the published statistics
Gender pension gap economic perspective
 Gender pension gap economic perspective Agnieszka Chłoń-Domińczak Institute of Statistics and Demography SGH Part of this research was supported by European Commission 7th Framework Programme project "Employment
Flash Eurobarometer 470. Report. Work-life balance
 Work-life balance Survey requested by the European Commission, Directorate-General for Justice and Consumers and co-ordinated by the Directorate-General for Communication This document does not represent
Borderline cases for salary, social contribution and tax
 Version Abstract 1 (5) 2015-04-21 Veronica Andersson Salary and labour cost statistics Borderline cases for salary, social contribution and tax (Workshop on Labour Cost Survey, Rome, Italy 5-6 May 2015)
Economic and Social Council
 United Nations ECE/MP.PP/WG.1/2011/L.7 Economic and Social Council Distr.: Limited 25 November 2010 Original: English Economic Commission for Europe Meeting of the Parties to the Convention on Access to
Report Penalties and measures imposed under the UCITS Directive in 2016 and 2017
 Report Penalties and measures imposed under the Directive in 206 and 207 4 April 209 ESMA34-45-65 4 April 209 ESMA34-45-65 Table of Contents Executive Summary... 3 2 Background and relevant regulatory
June 2014 Euro area international trade in goods surplus 16.8 bn 2.9 bn surplus for EU28
 127/2014-18 August 2014 June 2014 Euro area international trade in goods surplus 16.8 bn 2.9 bn surplus for EU28 The first estimate for the euro area 1 (EA18) trade in goods balance with the rest of the
Consumer Credit. Introduction. June, the 6th (2013)
") Consumer Credit in Europe at end-2012 Introduction Crédit Agricole Consumer Finance has published its annual survey of the consumer credit market in 27 European Union countries (EU-27) for the sixth year
Consumer Credit in Europe at end-2012 Introduction Crédit Agricole Consumer Finance has published its annual survey of the consumer credit market in 27 European Union countries (EU-27) for the sixth year
January 2010 Euro area unemployment rate at 9.9% EU27 at 9.5%
 STAT//29 1 March 20 January 20 Euro area unemployment rate at 9.9% EU27 at 9.5% The euro area 1 (EA16) seasonally-adjusted 2 unemployment rate 3 was 9.9% in January 20, the same as in December 2009 4.
Fiscal rules in Lithuania
 Fiscal rules in Lithuania Algimantas Rimkūnas Vice Minister, Ministry of Finance of Lithuania 3 June, 2016 Evolution of National and EU Fiscal Regulations Stability and Growth Pact (SGP) Maastricht Treaty
EIOPA Statistics - Accompanying note
 EIOPA Statistics - Accompanying note Publication references: and Published statistics: [Balance sheet], [Premiums, claims and expenses], [Own funds and SCR] Disclaimer: Data is drawn from the published
Socioeconomic inequalities in mortality and longevity
 Socioeconomic inequalities in mortality and longevity Peter Goldblatt Taking action on the Social Determinants of Health 12 March 2013 Thanks to Ruth Bell www.instituteofhealthequity.org 1 Review of Social
Call for proposals. for civil society capacity building and monitoring of the implementation of national Roma integration strategies
 Call for proposals for civil society capacity building and monitoring of the implementation of national Roma integration strategies For Cyprus, Denmark, Estonia, Finland, Latvia, Lithuania, Luxembourg
For further information, please see online or contact
 For further information, please see http://ec.europa.eu/research/sme-techweb online or contact Lieve.VanWoensel@ec.europa.eu Sixth Progress Report on participation in the 7 th R&D Framework Programme Statistical
Quarterly Gross Domestic Product of Montenegro 3 rd quarter 2017
 MONTENEGRO STATISTICAL OFFICE R E L E A S E No: 224 Podgorica, 22 December 2017 When using the data, please name the source Quarterly Gross Domestic Product of Montenegro 3 rd quarter 2017 The release
How to complete a payment application form (NI)
") How to complete a payment application form (NI) This form should be used for making a payment from a Northern Ireland Ulster Bank account. 1. Applicant Details If you are a signal number indemnity holder,
How to complete a payment application form (NI) This form should be used for making a payment from a Northern Ireland Ulster Bank account. 1. Applicant Details If you are a signal number indemnity holder,
EU State aid: Guidelines on State aid for environmental protection and energy making of -
 EU State aid: Guidelines on State aid for environmental protection and energy 2014-2020 - making of - NHO Seminar Oslo, 5 November 2014 Guido Lobrano, Senior Legal Adviser Summary What is BUSINESSEUROPE?
Macroeconomic overview SEE and Macedonia
 Macroeconomic overview SEE and Macedonia Zoltan Arokszallasi Chief Analyst, Macro & FX/FI Research Erste Group Bank Erste Investors Breakfast, 29 September, Skopje 02. Oktober SEE shows mixed performance
THE 2015 EU JUSTICE SCOREBOARD
 THE 215 EU JUSTICE SCOREBOARD Communication from the Commission to the European Parliament, the Council, the European Central Bank, the European Economic and Social Committee and the Committee of the Regions
Long Term Reform Agenda International Perspective
 Long Term Reform Agenda International Perspective Asta Zviniene Sr. Social Protection Specialist Human Development Department Europe and Central Asia Region World Bank October 28 th, 2010 We will look
ACCIDENT INVESTIGATION AND PREVENTION (AIG) DIVISIONAL MEETING (2008)
 DIVISIONAL MEETING (2008)") International Civil Aviation Organization AIG/08-WP/36 5/9/08 WORKING PAPER ACCIDENT INVESTIGATION AND PREVENTION (AIG) DIVISIONAL MEETING (2008) Montréal, 13 to 18 October 2008 Agenda Item 6: Regional
International Civil Aviation Organization AIG/08-WP/36 5/9/08 WORKING PAPER ACCIDENT INVESTIGATION AND PREVENTION (AIG) DIVISIONAL MEETING (2008) Montréal, 13 to 18 October 2008 Agenda Item 6: Regional
Enterprise Europe Network SME growth outlook
 Enterprise Europe Network SME growth outlook 2018-19 een.ec.europa.eu 2 Enterprise Europe Network SME growth outlook 2018-19 Foreword The European Commission wants to ensure that small and medium-sized
A. INTRODUCTION AND FINANCING OF THE GENERAL BUDGET. EXPENDITURE Description Budget Budget Change (%)
") DRAFT AMENDING BUDGET NO. 2/2018 VOLUME 1 - TOTAL REVENUE A. INTRODUCTION AND FINANCING OF THE GENERAL BUDGET FINANCING OF THE GENERAL BUDGET Appropriations to be covered during the financial year 2018
DRAFT AMENDING BUDGET NO. 2/2018 VOLUME 1 - TOTAL REVENUE A. INTRODUCTION AND FINANCING OF THE GENERAL BUDGET FINANCING OF THE GENERAL BUDGET Appropriations to be covered during the financial year 2018
BTSF FOOD HYGIENE AND FLEXIBILITY. Notification To NCPs
 BTSF FOOD HYGIENE AND FLEXIBILITY Notification To NCPs Organisation and implementation of training activities on food hygiene and the flexibility provisions provided in the food hygiene package under the
Update on crowdfunding user s awareness
 Update on crowdfunding user s awareness Nikos Daskalakis 4 th ECSF Meeting 17 February 2016 Overview Final results of the Oxera study "Crowdfunding from the user s perspective" - FSUG Preliminary results
FSMA_2017_05-01 of 24/02/2017
 FSMA_2017_05-01 of 24/02/2017 This Communication is addressed to Belgian alternative investment fund managers who intend to market, to professional investors, units or shares of European Economic Area
Themes Income and wages in Europe Wages, productivity and the wage share Working poverty and minimum wage The gender pay gap
 5. W A G E D E V E L O P M E N T S At the ETUC Congress in Seville in 27, wage developments in Europe were among the most debated issues. One of the key problems highlighted in this respect was the need
DG TAXUD. STAT/11/100 1 July 2011
 DG TAXUD STAT/11/100 1 July 2011 Taxation trends in the European Union Recession drove EU27 overall tax revenue down to 38.4% of GDP in 2009 Half of the Member States hiked the standard rate of VAT since
Taylor & Francis Open Access Survey Open Access Mandates
 Taylor & Francis Open Access Survey Open Access Mandates Annex C European Union November 2014 November 2014 0 The results presented in this report are based on research carried out on behalf of Taylor
3 Labour Costs. Cost of Employing Labour Across Advanced EU Economies (EU15) Indicator 3.1a
 Indicator 3.1a") 3 Labour Costs Indicator 3.1a Indicator 3.1b Indicator 3.1c Indicator 3.2a Indicator 3.2b Indicator 3.3 Indicator 3.4 Cost of Employing Labour Across Advanced EU Economies (EU15) Cost of Employing Labour
3 Labour Costs Indicator 3.1a Indicator 3.1b Indicator 3.1c Indicator 3.2a Indicator 3.2b Indicator 3.3 Indicator 3.4 Cost of Employing Labour Across Advanced EU Economies (EU15) Cost of Employing Labour
Cross-border mergers and divisions
 Cross-border mergers and divisions Cross-border mergers and divisions Consultation by the European Commission, DG MARKT INTRODUCTION Preliminary Remark The purpose of this questionnaire is to collect information,
Effects of using International Financial Reporting Standards (IFRS) in the EU: public consultation
 in the EU: public consultation") Case Id: 8c9481a0-7e98-4a6f-9420-564020e43697 Effects of using International Financial Reporting Standards (IFRS) in the EU: public consultation Fields marked with are mandatory. Impact of International
Case Id: 8c9481a0-7e98-4a6f-9420-564020e43697 Effects of using International Financial Reporting Standards (IFRS) in the EU: public consultation Fields marked with are mandatory. Impact of International
Snapshot Survey Of Impact of Economic Crisis
 GENERAL ASSEMBLY 1/09 Snapshot Survey Of Impact of Economic Crisis ASSEMBLEE GENERALE 1/09 Methodology: - Secretariat Prepared Questions with Assistance from the EB - The ACE Internet Service Provider
Financial wealth of private households worldwide
 Economic Research Financial wealth of private households worldwide Munich, October 217 Recovery in turbulent times Assets and liabilities of private households worldwide in EUR trillion and annualrate
2017 Figures summary 1
 Annual Press Conference on January 18 th 2018 EIB Group Results 2017 2017 Figures summary 1 European Investment Bank (EIB) financing EUR 69.88 billion signed European Investment Fund (EIF) financing EUR
You may find it useful to view the UK social and labour law summary overview (PDF, 99kb, 24 pages).
.") Document library In this section Cross-border schemes Relevant for: Employers - Prof essionals - T rustees Summary: This guidance sets out the application process for authorisation and approval from the
Document library In this section Cross-border schemes Relevant for: Employers - Prof essionals - T rustees Summary: This guidance sets out the application process for authorisation and approval from the
Quarterly Gross Domestic Product of Montenegro 2st quarter 2016
 Government of Montenegro Statistical Office of Montenegro Quarterly Gross Domestic Product of Montenegro 2st quarter 2016 The release presents the preliminary data for quarterly gross domestic product
PRESS RELEASE. The relative importance of each of the main payment instruments continued to vary widely across EU countries in 2013 (see the Annex).
.") 9 September 2014 PRESS RELEASE PAYMENT STATISTICS FOR 2013 The European Central Bank (ECB) has today published the 2013 statistics on non-cash payments, which comprise indicators on access to and use of
9 September 2014 PRESS RELEASE PAYMENT STATISTICS FOR 2013 The European Central Bank (ECB) has today published the 2013 statistics on non-cash payments, which comprise indicators on access to and use of
Statistics Brief. Investment in Inland Transport Infrastructure at Record Low. Infrastructure Investment. July
 Statistics Brief Infrastructure Investment July 2015 Investment in Inland Transport Infrastructure at Record Low The latest update of annual transport infrastructure investment and maintenance data collected
Sustainability and Adequacy of Social Security in the Next Quarter Century:
 Sustainability and Adequacy of Social Security in the Next Quarter Century: Balancing future pensions adequacy and sustainability while facing demographic change Krzysztof Hagemejer (Author) John Woodall
Comparing pay trends in the public services and private sector. Labour Research Department 7 June 2018 Brussels
 Comparing pay trends in the public services and private sector Labour Research Department 7 June 2018 Brussels Issued to be covered The trends examined The varying patterns over 14 years and the impact
Financial situation by the end of Table 1. ECPGR Contributions for Phase IX received by 31 December 2016 (in Euro)...3
...3") European Cooperative Programme for Plant Genetic Resources (ECPGR) Phase IX (2014 2018) Financial Report CONTENTS Financial situation by the end of...2 Table 1. ECPGR Contributions for Phase IX received
European Cooperative Programme for Plant Genetic Resources (ECPGR) Phase IX (2014 2018) Financial Report CONTENTS Financial situation by the end of...2 Table 1. ECPGR Contributions for Phase IX received
Collaboration in Eco-Innovation Research in the European Union
 Collaboration in Eco-Innovation Research in the European Union Eco-innovation brief #14 15 December 2012 Lorena Rivera León, Technopolis Group Eco-innovation has become one of the most expanding sectors
COMMUNICATION FROM THE COMMISSION
 EUROPEAN COMMISSION Brussels, 20.2.2019 C(2019) 1396 final COMMUNICATION FROM THE COMMISSION Modification of the calculation method for lump sum payments and daily penalty payments proposed by the Commission
RULES FOR THE REIMBURSEMENT OF TRAVEL AND SUBSISTENCE EXPENSES FOR EXCHANGE OF OFFICIALS
 EUROPEAN COMMISSION CONSUMERS, HEALTH, AGRICULTURE AND FOOD EXECUTIVE AGENCY Consumers and Food Safety Unit RULES FOR THE REIMBURSEMENT OF TRAVEL AND SUBSISTENCE EXPENSES FOR EXCHANGE OF OFFICIALS CONSUMER
CANADA EUROPEAN UNION
 THE EUROPEAN UNION S PROFILE Economic Indicators Gross domestic product (GDP) at purchasing power parity (PPP): US$20.3 trillion (2016) GDP per capita at PPP: US$39,600 (2016) Population: 511.5 million
Global Consumer Confidence
 Global Consumer Confidence The Conference Board Global Consumer Confidence Survey is conducted in collaboration with Nielsen 4TH QUARTER 2017 RESULTS CONTENTS Global Highlights Asia-Pacific Africa and
Lowest implicit tax rates on labour in Malta, on consumption in Spain and on capital in Lithuania
 STAT/13/68 29 April 2013 Taxation trends in the European Union The overall tax-to-gdp ratio in the EU27 up to 38.8% of GDP in 2011 Labour taxes remain major source of tax revenue The overall tax-to-gdp
Long-term unemployment: Council Recommendation frequently asked questions
 EUROPEAN COMMISSION MEMO Brussels, 15 February 2016 Long-term unemployment: Council Recommendation frequently asked questions Why a focus on long-term unemployment? The number of long-term unemployed persons
January 2014 Euro area international trade in goods surplus 0.9 bn euro 13.0 bn euro deficit for EU28
 STAT/14/41 18 March 2014 January 2014 Euro area international trade in goods surplus 0.9 13.0 deficit for EU28 The first estimate for the euro area 1 (EA18) trade in goods balance with the rest of the
Remuneration Systems of Civil Servants: Member States of the European Union and Georgia. (Comparative analysis)
") Remuneration Systems of Civil Servants: Member States of the European Union and Georgia (Comparative analysis) April, 2013 Author: Nino Tsukhishvili IDFI Legal Expert/ Recipient of the Open Society Human
Remuneration Systems of Civil Servants: Member States of the European Union and Georgia (Comparative analysis) April, 2013 Author: Nino Tsukhishvili IDFI Legal Expert/ Recipient of the Open Society Human
Consumer credit market in Europe 2013 overview
 Consumer credit market in Europe 2013 overview Crédit Agricole Consumer Finance published its annual survey of the consumer credit market in 28 European Union countries for seven years running. 9 July
May 2012 Euro area international trade in goods surplus of 6.9 bn euro 3.8 bn euro deficit for EU27
 108/2012-16 July 2012 May 2012 Euro area international trade in goods surplus of 6.9 3.8 deficit for EU27 The first estimate for the euro area 1 (EA17) trade in goods balance with the rest of the world
Quarterly Financial Accounts Household net worth reaches new peak in Q Irish Household Net Worth
 Quarterly Financial Accounts Q4 2017 4 May 2018 Quarterly Financial Accounts Household net worth reaches new peak in Q4 2017 Household net worth rose by 2.1 per cent in Q4 2017. It now exceeds its pre-crisis
First estimate for 2011 Euro area external trade deficit 7.7 bn euro bn euro deficit for EU27
 27/2012-15 February 2012 First estimate for 2011 Euro area external trade deficit 7.7 152.8 deficit for EU27 The first estimate for the euro area 1 (EA17) trade in goods balance with the rest of the world
The Global Philanthropy Environment Index 2018
 The Global Philanthropy Environment Index 2018 European Edition LILLY FAMILY SCHOOL OF PHILANTHROPY INDIANA UNIVERSITY OCTOBER, 2018 EUROPE AT A GLANCE The European special edition of the 2018 Global Philanthropy
EJN Newsletter. Issue 2 - May Secretariat of the European Judicial Network. 44 th Plenary meeting in Riga, Latvia... 1.
 Secretariat of the European Judicial Network Dear EJN Contact Points, In less than one month the 44 th Plenary meeting in Riga is taking place. The EJN Secretariat in collaboration with the Latvian Presidency
June 2012 Euro area international trade in goods surplus of 14.9 bn euro 0.4 bn euro surplus for EU27
 121/2012-17 August 2012 June 2012 Euro area international trade in goods surplus of 14.9 0.4 surplus for EU27 The first estimate for the euro area 1 (EA17) trade in goods balance with the rest of the world
August 2012 Euro area international trade in goods surplus of 6.6 bn euro 12.6 bn euro deficit for EU27
 146/2012-16 October 2012 August 2012 Euro area international trade in goods surplus of 6.6 12.6 deficit for EU27 The first estimate for the euro area 1 (EA17) trade in goods balance with the rest of the
Financial situation by the end of Table 1. ECPGR Contributions for Phase IX received by 31 December 2017 (in Euro)...3
...3") European Cooperative Programme for Plant Genetic Resources (ECPGR) Phase IX (2014 2018) 2017 Financial Report CONTENTS Financial situation by the end of 2017...2 Table 1. ECPGR Contributions for Phase
European Cooperative Programme for Plant Genetic Resources (ECPGR) Phase IX (2014 2018) 2017 Financial Report CONTENTS Financial situation by the end of 2017...2 Table 1. ECPGR Contributions for Phase
Flash Eurobarometer N o 189a EU communication and the citizens. Analytical Report. Fieldwork: April 2008 Report: May 2008
 Gallup Flash Eurobarometer N o 189a EU communication and the citizens Flash Eurobarometer European Commission Expectations of European citizens regarding the social reality in 20 years time Analytical
Courthouse News Service
 14/2009-30 January 2009 Sector Accounts: Third quarter of 2008 Household saving rate at 14.4% in the euro area and 10.7% in the EU27 Business investment rate at 23.5% in the euro area and 23.6% in the
This document explains the methodology underlying Roche s EFPIA disclosure
 This document explains the methodology underlying Roche s EFPIA disclosure It is common in many innovation-led industries for companies to engage independent experts or specialist organizations. Collaborations
STAT/12/ October Household saving rate fell in the euro area and remained stable in the EU27. Household saving rate (seasonally adjusted)
") STAT/12/152 30 October 2012 Quarterly Sector Accounts: second quarter of 2012 Household saving rate down to 12.9% in the euro area and stable at 11. in the EU27 Household real income per capita fell by
STAT/12/152 30 October 2012 Quarterly Sector Accounts: second quarter of 2012 Household saving rate down to 12.9% in the euro area and stable at 11. in the EU27 Household real income per capita fell by
The current state of the electricity market in Bulgaria
 The current state of the electricity market in Bulgaria Towards market liberalization Current state of the market Generation 42 TWh Export - 18% Losses - 9% Regulated market 33% Domestic free market -
Benchmarking of Tax Administrations. Technical Note
 Benchmarking of Tax Administrations Report of the EUROSAI Study Group Technical Note March 8 EUROSAI Benchmarking of Tax Administrations Report of the EUROSAI Study Group on Benchmarking of Tax Administrations
Learn more about Thresholds
 Learn more about Thresholds VAT registration: Threshold VAT registration thresholds 1.1. Overview of local VAT threshold Local VAT registration thresholds were designed to reduce the administrative burden
3 Labour Costs. Cost of Employing Labour Across Advanced EU Economies (EU15) Indicator 3.1a
 Indicator 3.1a") 3 Labour Costs Indicator 3.1a Indicator 3.1b Indicator 3.1c Indicator 3.2a Indicator 3.2b Indicator 3.3 Indicator 3.4 Cost of Employing Labour Across Advanced EU Economies (EU15) Cost of Employing Labour
3 Labour Costs Indicator 3.1a Indicator 3.1b Indicator 3.1c Indicator 3.2a Indicator 3.2b Indicator 3.3 Indicator 3.4 Cost of Employing Labour Across Advanced EU Economies (EU15) Cost of Employing Labour
Quarterly Gross Domestic Product of Montenegro 4 th quarter 2018 (p)
") MONTENEGRO STATISTICAL OFFICE R E L E A S E No: 46 Podgorica, 22 March 2019 When using the data, please name the source Quarterly Gross Domestic Product of Montenegro 4 th quarter 2018 (p) The release
MONTENEGRO STATISTICAL OFFICE R E L E A S E No: 46 Podgorica, 22 March 2019 When using the data, please name the source Quarterly Gross Domestic Product of Montenegro 4 th quarter 2018 (p) The release
November 5, Very preliminary work in progress
 November 5, 2007 Very preliminary work in progress The forecasting horizon of inflationary expectations and perceptions in the EU Is it really 2 months? Lars Jonung and Staffan Lindén, DG ECFIN, Brussels.
Burden of Taxation: International Comparisons
 Burden of Taxation: International Comparisons Standard Note: SN/EP/3235 Last updated: 15 October 2008 Author: Bryn Morgan Economic Policy & Statistics Section This note presents data comparing the national
Second SHA2011-based pilot data collection 2014
 EUROPEAN COMMISSION EUROSTAT Directorate F: Social statistics Unit F-5: Education, health and social protection DOC 2013-PH-06 Annex 3 Second SHA2011-based pilot data collection 2014 Item 6.2.3 of the
UPSTREAM SECURITY IN EUROPE. A concise overview of the issues arising in connection with the granting and taking of Upstream Security in Europe
 UPSTREAM SECURITY IN EUROPE A concise overview of the issues arising in connection with the granting and taking of Upstream Security in Europe 1 Table of Contents Introduction 5 1. Increase in Cross-Border
Technical report on macroeconomic Member State results of the EUCO policy scenarios
 Technical report on macroeconomic Member State results of the EUCO policy scenarios By E3MLab, December 2016 Contents Introduction... 1 Modelling the macro-economic impacts of the policy scenarios with