GROWTH PROSPECTS OF EMERGING MARKET ECONOMIES IN EUROPE
|
|
|
- Drusilla Merilyn Crawford
- 6 years ago
- Views:
Transcription


1 EME-REPORT GROWTH PROSPECTS OF EMERGING MARKET ECONOMIES IN EUROPE HOW FAST WILL THEY CATCH UP WITH THE OLD WEST?
2 TABLE OF CONTENTS Executive summary 3 1. Introduction 6 2. The starting point 8 3. Growth projections up until Model of real GDP growth and convergence Modelling nominal convergence Overall uncertainty and sensitivity of results to variations in assumptions Special factors Rate of return on capital and the stock market 43 List of variables 47 Literature 48
3 3 EXECUTIVE SUMMARY Catching up with the EU15 For more than a decade the emerging market economies (EMEs) in Central and Eastern Europe have, for the most part, been growing faster than the wealthier EU15 countries. Thus they have been catching up in terms of GDP per capita. We analyse the growth performance of 21 emerging market economies 1 from the 199s onwards and make projections of their growth prospects up to 25. Currently, Slovenia is the wealthiest of the EMEs with a purchasing-power (PPP) adjusted GDP per capita equal to 77 per cent of the EU15 average. In market prices, Slovenia s GDP per capita is 53 per cent of the EU15 average. Georgia is the poorest of the EMEs with respective GDP per capita levels of 13 and 5 per cent of the EU15 average. The differences between the EMEs are thus very large. The framework for the growth projections We construct a neo-classical growth model to project trend volume growth of purchasingpower adjusted GDP in the EMEs and the EU15 into the future. Using historical data we estimate current capital stocks and future investment rates which will converge in time with those in the EU15. We also take into account nominal convergence in prices which will lead to a real appreciation of the EMEs currencies. Combining these two we get convergence in GDP per capita in market prices. Following the standard β-convergence feature of recent growth literature, the model is constructed so that the speed of convergence will slow down as the gap in GDP per capita between the EMEs and EU15 decreases. The investment rate plays a relatively limited role in the long run, while total factor productivity growth and population developments play a larger one. The projections presume continuing reforms and development that are supportive of a business-friendly environment as well as stable democratic institutions. We also demonstrate the uncertainty related to long-term growth projections, discuss the possible effects of human capital accumulation on the rate of convergence, examine the importance of energy commodities for some of the EMEs, and project the future development in the real rate of return on capital based on our growth model. As usual, there is great uncertainty related to such long-term growth projections. Convergence is not automatic as global economic history very clearly demonstrates. Total GDP projected to rise from 37 per cent to 81 per cent of EU15 total by 25 Despite an almost equal total population in the EMEs and the EU15, the total purchasingpower adjusted GDP in the 21 EMEs is currently 37 per cent of that in the EU15 and just 17 per cent when measured in market prices. We project the EU15 economy to grow at an average real rate of 1.9 per cent between 26 and 25, and the EMEs to grow at an average real rate of 3.7 per cent. In addition to this the EMEs average real exchange rate is projected to appreciate by a total of 84 per cent. Thus relative to the EU15 total, GDP in the EMEs is projected to grow to 81 per cent in PPP-terms and to 69 per cent in market prices by The countries analysed are Albania, Armenia, Azerbaijan, Bosnia-Herzegovina, Bulgaria, Croatia, the Czech Republic, Estonia, Georgia, Hungary, Kazakhstan, Latvia, Lithuania, Macedonia, Poland, Romania, Russia, Slovakia, Slovenia, Turkey and Ukraine. These are all transition countries apart form Turkey which is thus the only not formerly socialist country.
4 4 The change is very considerable: Adjusting for PPPs, the total real GDP of the 21 EMEs is projected to grow 4.9 fold by 25. Taking into account projected real exchange rate appreciation, GDP will grow 9-fold its current level. In per capita terms, we project faster convergence: adjusted for purchasing power from a current 36 per cent to 87 per cent of the EU15 average, and in market prices from a current 16 per cent to 73 per cent in 25. Thus the projection does not foresee full catching up with respect to the EU15 during this time period. Weaker projected population growth in the EMEs on average is one important factor causing this. For example, if the future population development of Estonia is as projected by the Eurostat, but we fix the labour-to-population ratio to current level, Estonia will reach the PPP-adjusted GDP per capita of the EU15 in 247 instead of reaching a projected level of 94 per cent and then actually starting a slow descent. Top incomes in 25 projected for the Baltic countries, Russia, Hungary and Slovenia We project the EMEs on average to reach the current PPP-adjusted GDP per capita of the EU15 countries in real terms in 228. At that time, they will still be at just 68 per cent of the then EU15 average, and convergence will continue. Lithuania, Estonia, Hungary, Slovenia, Russia and Latvia will exceed 9 per cent of the EU15 PPP-adjusted GDP per capita by 25. Estonia is projected to be the first one to do this in 233. On the other hand, Bosnia-Herzegovina, Albania and Armenia are projected to be at 79 per cent and Georgia at 71 per cent of the EU15 average per capita GDP in 25. Population trends very diverging in the EMEs According to the Eurostat and the US Census Bureau, average population growth is expected to be less favourable in the EMEs than in the EU15. However, expected population growth in the EMEs varies a lot depending on the country. By 25, total population is expected to have declined from its current level in all but Azerbaijan, Turkey and Albania. The steepest declines will be in Romania, Russia, Ukraine and Bulgaria. The differences are huge: Azerbaijan s population is expected to grow by 23 per cent, while that of Bulgaria will decrease by 34 per cent. Consequently, despite strong projected per capita income growth, Russia s share in the total GDP of the 21 EMEs is projected to decline from the current 37 per cent to 32 per cent by 25 and that of Turkey to rise from 15 to 23 per cent. Uncertainty in the projections If volatility in future GDP growth rates is the same as amongst the EU15 countries in the past, the projection for PPP-adjusted GDP per capita in the EMEs on average in 25 is 87 per cent of the EU15 average ± 13 percentage points with a probability of 95 per cent. If volatility in growth rates is twice as high in the EMEs as it is in the EU15 countries, the band increases to ± 21 percentage points. Initially higher rates of return on capital than in the EU15 We project the rate of return on capital in the whole economy as a function of the level of total factor productivity, and the capital-to-labour ratio. Without taking into account taxation, among other things, the average real rate of return on capital in the EU15 is stable at 1.5 per cent. In the EMEs, the rate of return is at first higher than this. As convergence proceeds it will decline towards the EU15 level. In the EMEs on average, the real rate of return on capital is at first above 14 per cent from where it is projected to decline to 12.5 per cent by 23 and 1.8 per cent by 25. Higher rates of return increase yields on investment opportunities. We project higher average investment rates in the EMEs than in the EU15.
5 5 Human capital has an effect on growth rate projections We discuss, but do not model explicitly, the effect of human capital accumulation (education) on growth and convergence. Growth in human capital is in fact incorporated into the overall TFP rise in the model. As countries catch up with high-productivity countries, they will need an ever more educated labour force to continue the catching-up process. Otherwise they may get stuck at a lower relative level of GDP per capita. Based on available statistics we argue that unless more focus is put on education, the speed of income convergence projected in this study may be to be too high for Albania, Macedonia and Turkey. However, the situation is also concerning in terms of secondary education in Georgia and possibly in Romania and in terms of tertiary education in Armenia, Croatia, the Czech Republic, Romania and Slovakia. In view of the projections, the EMEs still have ample time to invest in education. Specific upside and downside risks: Oil and politics Another factor that is not explicitly modelled is the energy commodity dependence of Russia, Kazakhstan and Azerbaijan. During the past several years world market price developments for energy commodities have been very favourable for producer countries. If prices remain high and rising, favourable economic development will continue. On the other hand, the longer this development continues the more likely it is to lead to too rapid real appreciation of these countries currencies and thus to a deterioration in the competitiveness of their manufacturing industries. According to available estimates, the reserves of crude oil in Russia and Azerbaijan may be exhausted during the time span of our projections. These three countries risk higher real exchange rate volatility than the other EMEs. This would also be reflected in GDP growth rates making them more volatile. However, estimates of the reserves are uncertain. We also have to recognise that there may be political and institutional risks. These can be expected to be higher in those EMEs that are not, and probably will not, become EU countries. Which countries will eventually join the EU that would provide them with a stable legal, institutional and democratic framework is of course unknown at this point. This negative long-run risk may concern Armenia, Azerbaijan, Georgia, Kazakhstan, Russia, Turkey and Ukraine. Continuing economic and institutional reforms would decrease these risks. * * * Although the EMEs are not projected to quite catch up with the EU15 by 25, the development means that economic weight in Europe will become more evenly distributed, foreign trade will grow and trading patterns will change. This is subject to business-friendly policies in the EMEs. This development will also help in slowing down the decline of the economic weight of Europe in the world economy. The EU15 countries, too, will benefit from successful economic policies in the EMEs, their increasing purchasing power and the political stability that wealth usually brings.
6 6 1 INTRODUCTION The economic transition of the formerly socialist Central and Eastern European countries towards becoming market economies started almost two decades ago. We refer to these countries as emerging market economies or EMEs in this study. During the early years of transition they first experienced a decline in production because their economies were not internationally competitive and because administratively set relative prices in the EMEs differed from those in the international markets and this had distorted their economic structures. After the initial decline which lasted between a couple of years and a decade depending on the country and local conditions, these countries economies have typically been growing faster than those of the more advanced EU15 countries. Faster growth in the EMEs has been a result of economic, political and social reforms, economic restructuring with old inefficient plants and factories largely shutting down, and inflows of foreign direct investment (FDI) from more advanced countries in West Europe, North America and East Asia resulting in a rebirth of manufacturing industry as well as many service industries. FDI has brought in modern production technology and modern business management techniques that have boosted productivity growth in the EMEs that would otherwise mostly not have had the domestic financial and human capital to make these investments. In a few countries also the considerable rise in the world market prices of raw materials, namely crude oil, after the late 199s has been instrumental in supporting growth. It is likely that the emerging market economies of Central and Eastern Europe will continue to grow faster than the EU15 countries and thus converge in terms of gross domestic product (GDP) per capita towards the future income levels in West Europe. In this study, we make a projection of GDP and GDP per capita growth in 21 countries of Central and Eastern Europe. These are all formerly socialist countries apart from Turkey. The countries analysed are Albania, Armenia, Azerbaijan, Bosnia-Herzegovina, Bulgaria, Croatia, the Czech Republic, Estonia, Georgia, Hungary, Kazakhstan, Latvia, Lithuania, Macedonia, Poland, Romania, Russia, Slovakia, Slovenia, Turkey and Ukraine. The time span of the projection is We analyse both real GDP convergence and nominal convergence of prices that will lead to a real appreciation of the EMEs currencies. The combination of real and nominal convergence gives us projections of future GDP in market prices. For real GDP growth we construct a growth model using the Cobb-Douglas production function. We also show the uncertainty related to convergence. Real GDP convergence comes largely from faster productivity growth in the EMEs than in the EU15 countries. We also discuss, but do not model explicitly, the level of human capital in the EMEs and how this may affect the speed of convergence. A study such as this one does not have the aim of taking into account business cycles. Rather, the projections show estimated trend growth paths. In Section 2 we will review the starting point of the EMEs in terms of GDP per capita in both purchasing-power adjusted (PPP) terms and market prices. There are considerable differences in these countries current income levels but they all have room to converge on the EU15. Section 3 shows the results we get from the growth framework that is constructed in Sections 4 (real convergence) and 5 (nominal convergence). Real GDP growth is calculated on the basis of a PPP-adjusted GDP volume series in 25 prices. Nominal convergence is calculated by taking GDP in market prices in 25 and adding the calculated volume change and real exchange rate appreciation.

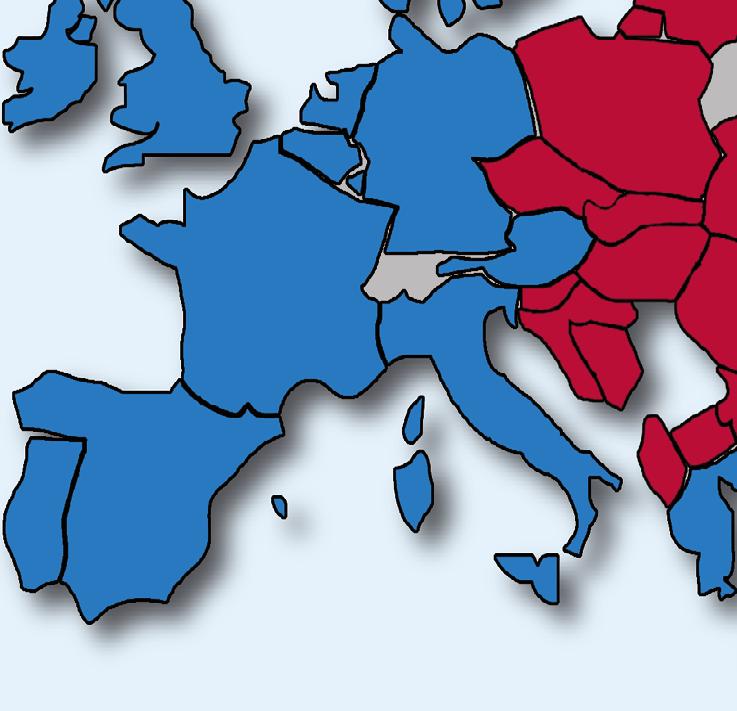
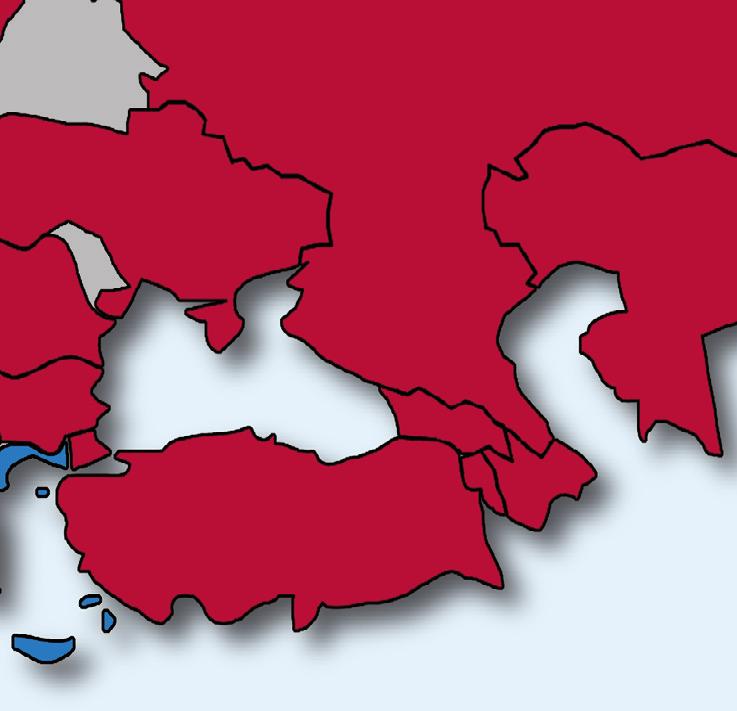
7 7 Figure 1.1 Map of the region: EU15 and the EMEs Section 6 discusses uncertainty in such growth projections first with examples of historical long-run growth experience of different countries, and then by showing an estimate of the average cumulative uncertainty related to our long-run growth projections. We also show how the results would change if we were to change some of the assumptions that we have made. Section 7 offers a discussion of some special factors that have not been possible to include in the numerical projections and an assessment of how these factors could affect the results in the long run. We discuss how relevant our measurement of labour is and what importance the level of human capital, i.e. education, could play in our results. After these we discuss the role of crude oil and natural gas for Russia, Azerbaijan and Kazakhstan, which rely heavily on these commodities in their exports but which, according to international estimates, may be running partly out of their reserves of crude oil before our projection period ends. In Section 8 we analyse the expected development in the pre-tax real rate of return on capital in the EMEs and also whether the growth projections can give any indication of the future value of market capitalisation in these countries. Our model is such that convergence will take place. It should be emphasised, however, that while we expect the EMEs on average to converge towards the EU15 in terms of GDP per capita, it is quite probable that some of them will never reach the EU15 levels and may even get stuck at considerably lower relative income levels. Convergence is not automatic as global economic history very clearly demonstrates. There is considerable uncertainty related to longterm GDP growth projections.
8 8 2 THE STARTING POINT In 25, the EMEs total purchasing-power (PPP) adjusted GDP in current prices was 36 per cent of the EU15 total. The EMEs total population is 5 per cent larger than the EU15 population. Thus relative GDP per capita was about 34 per cent of the EU15 average. Of the EMEs total GDP Russia s share is 37 per cent, followed by Turkey (15 per cent), Poland (12 per cent) and Ukraine (8 per cent). The EMEs total GDP in market prices was just 17 per cent of the EU15 total. All the emerging market economies (EMEs) analysed in this study currently have lower GDP per capita than the EU15 countries on average (see Figure 2.1). However, Slovenia and the Czech Republic have already surpassed the poorest EU15 country, Portugal, in PPPs, and Slovenia has also caught up with Greece. The next-wealthiest EMEs are Hungary, Estonia and Slovakia followed by other Central European countries that have already joined the EU. Romania and Bulgaria are the poorest of the new EU countries. Of the EMEs that are not (yet) EU members, Croatia has the highest level of GDP per capita. It is followed by Russia and Turkey, the latter of which has about the same income level as Romania and Bulgaria. In the Balkans and in the southern republics of the former Soviet Union, GDP per capita levels are much lower than in the more advanced Central European EMEs. In all cases, purchasing-power adjusted GDP figures are much higher than those measured in market prices. The poorer the country, the larger the relative difference is between these figures. As the countries catch up with the EU15 average, the difference between GDP in market prices and the PPP-adjusted GDP will gradually (more or less) disappear. This is because prices in the sheltered sector (services) in these countries will rise faster than prices in the open sector (manufacturing). This is a process of nominal convergence that we include in the analysis. If we look at the GDP per capita figures in market prices, we see that average income in Slovenia is half of that in the EU15. However, Slovenia has already caught up with Portugal. The other EMEs are considerably below Slovenia. The poorest new EU country, Bulgaria has a GDP per capita in market prices which is just over 1 per cent of the EU15 average. GDP per capita in Georgia is only 5 per cent of the EU15 average. GDP per capita in Slovenia, the wealthiest of the EMEs, is six-times higher than in Georgia in purchasing power parities, and eleven-times higher in market prices. Thus especially when measured in market prices, the EMEs remain quite poor today and are also at very different levels of income.
9 9 Figure 2.1 GDP per capita in the EMEs in 25, EU15 = 1 Georgia Azerbaijan Armenia Ukraine Bosnia-Herzegovina Albania Macedonia Bulgaria Kazakhstan Romania Turkey EME average Russia Latvia Lithuania Poland Croatia Slovakia Estonia Hungary Czech Republic Slovenia At current market prices At current PPPs Source: UNECE.
10 1 Figure 2.2 shows the past convergence of the EMEs towards the PPP-adjusted GDP per capita in the EU15 countries. As we see, the countries have been catching up with the EU15, but the development has varied. In some countries, such as the Czech Republic, Romania and Bulgaria there was a long period when they did not manage to catch up. Structural reforms and the EU membership process brought these countries back to faster growth. Figure 2.2 EMEs past convergence in purchasing-power adjusted GDP per capita in current PPPs, EU15 = Albania Armenia Azerbaijan Bosnia-Herzegovina Bulgaria Croatia Latvia Lithuania Macedonia Poland Romania Czech Republic Estonia Georgia Hungary Kazakhstan Russia Slovakia Slovenia Turkey Ukraine Source: UNECE.
11 11 More productive countries typically have higher incomes and higher prices. As the EMEs catch up with the EU15 we can expect also price levels to rise faster than in the EU15. For each country the relative price level is calculated as the ratio between the PPP conversion factor and the official exchange rate. The left-hand side graph in Figure 2.3 shows purchasingpower adjusted GDP per capita with respect to the United States and the relative price level for 155 countries in 22. The R 2 is.67 and the coefficient between GDP per capita and the price level is.83. The right-hand side graph in Figure 2.3 shows the same for the EU15 countries (less Luxembourg) and the EMEs in 25 with respect to the EU15 average price and GDP-per-capita levels. Now R 2 is.93 and the coefficient between GDP per capita and the price level is by and large the same as with the larger dataset. There is thus a very strong correlation between the price level and relative GDP per capita. Figure 2.3 GDP per capita and price level with respect to the United States for 155 countries in 22 (left) and with respect to the EU15 average for the EU15 countries and the EMEs in Price level, USA = y =.83x +.25 R 2 =.67 Price level, EU15 = y =.82x +.16 R 2 = GDP (PPP) per capita, USA = GDP (PPP) per capita, EU15 = 1 Sources: WDI (left) and UNECE (right).
12 12 Figure 2.4 shows how price levels in the EMEs have developed with respect to the average in the EU15 countries. In most cases price levels have been converging with the EU15 average although in some cases the development has been relatively flat. The development is influenced by, among other things, the liberalisation of administrated prices in these formerly socialist economies. Figure 2.4 Price levels in EMEs, EU15 = Albania Azerbaijan Bulgaria Armenia Bosnia and Herzegovina Croatia Czech Republic Estonia Georgia Hungary Kazakhstan Latvia Lithuania Macedonia Russia Slovakia Slovenia Poland Romania Turkey Ukraine Source: UNECE. 3 GROWTH PROJECTIONS UP UNTIL 25 Here we present the results from our projections. However, before reviewing the results in detail, we briefly summarise the growth framework, which is constructed in Sections 4 and 5. GDP is produced using labour and capital which are combined at some level of total factor productivity (TFP). Labour is given by the size of the working-aged population as projected
13 13 by the Eurostat for the EU countries and the US Census Bureau for the other countries. We estimate initial capital stocks using data on past GDP, investment and population. 2 The capital stocks are then projected into the future using an estimated relationship for the investment rate in the EMEs. The investment rate in the EMEs will converge towards that in the EU15 in the long term. The growth rate of TFP in the EU15 is set exogenously at 1.5 per cent, a figure we have estimated to correspond to the average historical long-run rate. Following the standard β convergence hypothesis, TFP growth in the EMEs is a function of the GDP per capita gap between each country and the EU15, and thus in the long run also the growth rate of TFP will converge with that in the EU15. In Section 7.1 we discuss separately the level of human capital in the EMEs and whether it may allow for full catching up with the EU15. We also consider nominal convergence allowing for a real appreciation of the EMEs currencies in order to get future GDP in market prices. Nominal convergence constructed in Section 5 is a function of the real GDP per capita gap between each EME and the EU15. Finally we consider overall uncertainty related to these projections, and the rates of return on capital. 3.1 Projections for total GDP With our assumptions and specifications, the EU15 countries GDP will grow at an average rate of 1.9 per cent in This includes an average TFP growth rate of 1.5 per cent and an average investment rate of 18.5 per cent. The capital stock will remain broadly constant relative to GDP by a factor of 3.2. By contrast, average PPP-adjusted GDP in the EMEs is projected to grow at a rate of 3.7 per cent in with an average TFP growth rate of 2.6 per cent and an average investment rate of 2.7 per cent. The capital stock will rise from an estimated current level of 2.3 times the GDP to a projected 3.1 times the GDP in 25. PPP-adjusted GDP will rise from 37 per cent of the EU15 GDP in 26 to 81 per cent in 25, while GDP in market prices will rise from 17 per cent to 69 per cent of the EU15 GDP. Total PPP-adjusted GDP in the EMEs is projected to increase by a factor of 4.9 and by a factor of 9. in market prices. The EMEs total population is currently 5 per cent larger than that in the EU15. Population projections by the Eurostat and US Census Bureau show that in 25 the EMEs total population is expected to be 6 per cent smaller than that of the EU15. This 11-percentage point decrease relative to the EU15 will of course have an effect on the relative size of the GDPs. See Figure 4.3 on how working-aged population aged years is projected to change in the EU15 and the EMEs. The changes are considerable and very different depending on the country. Figure 3.1 shows GDP in the EU15 and the EMEs as a whole both in purchasing-power adjusted terms and market prices in billions of 25 US dollars in on the basis of our projections. The EMEs as a group are expected to reach the current EU15 PPP-adjusted GDP in 227 and the GDP in market prices in 235. Figure 3.2 shows projected GDP in the six largest EMEs in purchasing-power adjusted terms in constant 25 US dollars. These countries account for 8 per cent of the total GDP of the 21 EMEs. Russia and Turkey leave the other four countries behind. Russia does not really grow faster but as a larger country GDP becomes larger in absolute terms, if not in relative terms. Turkey s GDP grows faster because of its strong population growth. Russia s 2 Investment or gross fixed capital formation refers to investment as determined in national accounts, that is, including investment into buildings, infrastructure, machinery, equipment etc. It does not matter whether the investment is done by a local or a foreign firm. Also public sector investments are included. Foreign direct investment is only included in the form of greenfield investments. Portfolio investments are not included.
14 14 average projected GDP growth rate in is 3.3 per cent while that of Turkey is 4.8 per cent. Figure 3.1 Projected GDP in the EU15 and the EMEs as a whole in purchasing-power adjusted terms and in market prices, bill. 25 USD EU15 in market prices EME average in market prices EU15 in purchasing power parities EMEs in purchasing power parities Figure 3.2 Projected GDP in the largest EMEs in purchasing-power adjusted terms and in market prices, bill. 25 USD Russia Turkey Poland Ukraine Romania Kazakhstan
15 15 Figure 3.3 shows the current and projected total GDP in the combined EU15 and EME region. We have shown separately the four largest EMEs. The share of the EU15 is projected to decline from 73 per cent to 56 per cent and the EMEs share to increase accordingly. The share of Russia is projected to increase from a current 1 per cent to 14 per cent, and that of Turkey from 4 per cent to 1 per cent. Also the shares of Poland and Ukraine will increase. Figure 3.3 Total PPP-adjusted GDP in the EU15 + EME region, bill. of USD and % of total Ukraine; 351; 2 % Poland; 554; 3 % Turkey; 657; 4 % Russia; 165; 1 % Other EMEs; 1272; 8 % 26 Ukraine; 1917; 4 % Poland; 252; 4 % Turkey; 574; 1 % Other EMEs; 5896; 12 % 25 EU15; 11974; 73 % Russia; 6915; 14 % EU15; 26853; 56 % Figure 3.4 shows purchasing-power adjusted GDP in each EME in 26 and 25 in billions of 25 US dollars and also the countries share in the total GDP of the EMEs. As relative population changes are rather large and because differences in income levels in 25 are projected to be smaller than they are currently, there will be changes in the EMEs order as well as in their shares of the EMEs total GDP. For example, Russia s GDP is projected to grow from 1,65 billion US dollars to 6,915 billion, but, largely due to demographic changes, its share in the EMEs total GDP is projected to decrease from 37 per cent to 32 per cent. On the other hand, Turkey, with strong population growth, is projected to increase its GDP from 657 billion US dollars to 5,74 or from 15 per cent to 23 per cent of the total. Towards the lower end, Macedonia, Armenia, Georgia and Albania are projected to surpass Estonia, because of both demographic factors and because these four countries currently have much lower GDP per capita than Estonia does which means that they also have much more room for income convergence and thus growth. Estonia has by far the smallest population of the EMEs. Figure 3.5 shows the population projections by the Eurostat and the US Census Bureau. The relative changes between the EMEs are large. Russia s population is projected to decline from 142 million to 19 million, while that of Turkey will rise from 7 million to 86 million. The population of Ukraine is projected to fall by 13 million to 34 million and that of Poland by 4 million also to 34 million. In relative terms, the largest declines are expected in Bulgaria (-34 per cent), Ukraine (-28 per cent), Russia (-23 per cent) and Romania (-21 per cent).
16 16 Figure 3.4 Purchasing-power adjusted GDP in the EMEs in 26 and 25 in billions of 25 US dollars and per cent of total GDP in the EMEs Slovenia; 48; 1 % Bosnia-Herzegovina; 37; 1 % Lithuania; 53; 1 % Azerbaijan; 56; 1 % Croatia; 63; 1 % Bulgaria; 76; 2 % Slovakia; 86; 2 % Kazakhstan; 131; 3 % Hungary; 178; 4 % Romania; 22; 5 % Latvia; 34; 1 % Estonia; 25; 1 % Albania; 19; % Georgia; 18; % Armenia; 17; % Macedonia; 16; % Russia; 165; 37 % Czech Republic; 222; 5 % Ukraine; 351; 8 % GDP (PPP) in 26: 4,484 bill. USD (PPP) Poland; 554; 12 % Turkey; 657; 15 % Bosnia-Herzegovina; 216; 1 % Lithuania; 189; 1 % Albania; 222; 1 % Croatia; 228; 1 % Georgia; 187; 1 % Armenia; 162; 1 % Slovenia; 122; 1 % Latvia; 118; 1 % Macedonia; 111; 1 % Estonia; 73; % Russia; 6915; 32 % Slovakia; 274; 1 % Bulgaria; 292; 1 % Czech Republic; 542; 2 % Hungary; 571; 3 % Azerbaijan; 597; 3 % Kazakhstan; 923; 4 % Romania; 968; 4 % Ukraine; 1917; 9 % GDP (PPP) in 25: 21,854 bill. USD (PPP) Poland; 252; 9 % Turkey; 574; 23 %
17 17 Figure 3.5 Population projections, mill Russia Turkey Ukraine Poland Romania Kazakhstan Czech Republic Hungary Azerbaijan Bulgaria Slovakia Georgia Bosnia-Herzegovina Croatia Albania Lithuania Armenia Latvia Macedonia Slovenia Estonia Sources: Eurostat and the US Census Bureau. 3.2 Projections for GDP per capita On average, real GDP per capita is projected to grow at a rate of 1.9 per cent in the EU15 countries and at a rate of 3.9 per cent in the EMEs in PPP-adjusted GDP per capita will rise from an average of 36 per cent of the EU15 level in 26 to 87 per cent in 25, while in market prices it will rise from 16 per cent to 73 per cent. In constant prices, the EMEs are projected to reach the current PPP-adjusted GDP of the EU15 countries in 227. Thus we do not expect the EMEs on average to have fully converged with the EU15 by 25. Some of the countries are likely to have, however, even though the model does not show this. Table 3.1 shows the projected level of PPP-adjusted GDP per capita in the EMEs relative to the EU15. The countries are sorted by their projected income level in 25. According to this projection, the top-6 countries will be the three Baltic countries, Hungary Slovenia and Russia which would exceed 9 per cent of the EU15 income level. Four countries: Bosnia- Herzegovina, Albania, Armenia and Georgia are projected not yet to have reached 8 per cent of the EU15 level. These four are currently among the poorest of the EMEs. The differences between the countries in 25 are much smaller than they are presently. This is a result
18 18 of the β convergence characteristic of the model, namely that poorer countries will tend to grow faster than wealthier ones. Table 3.1 Projected PPP-adjusted GDP per capita in the EMEs, EU15 = 1 Country Lithuania Estonia Hungary Slovenia Russia Latvia Czech Republic Kazakhstan Poland EME average Azerbaijan Croatia Turkey Slovakia Bulgaria Ukraine Romania Macedonia Bosnia-Herzegovina Albania Armenia Georgia This characteristic can also be seen in Figure 3.6 which shows how the projected GDP per capita growth rates relate to the initial PPP-adjusted levels in 26. We see that there is a clear connection between these, which is based on the β hypothesis and the common β. The relationship between the growth rate and the initial income level is very clear in the model. Can this be justified based on historical evidence?
19 19 Figure 3.6 Initial GDP per capita levels and its projected future growth rates in the EMEs, % 7. Real GDP per capita growth rate PPP-adjusted GDP per capita in 26, EU15 = 1 In the left-hand side graph of Figure 3.7 we show the relationship between PPP-adjusted GDP per capita in the EU15 countries (less Luxembourg) in 196 and the subsequent growth rate up until the present. As we see, there is clear evidence of unconditional convergence in the EU15 area. The R 2 value is high at.78 which would rise to.95 if we were to remove Ireland which is somewhat an outlier. In the right-hand side graph we find on the horizontal axis PPP-adjusted GDP per capita in the EU15 countries (less Luxembourg) in 199 and in the EMEs in their respective income troughs between 1991 and On the vertical axis we find the subsequent average annual growth rates up until the present. As growth in the EMEs resumed at different points in time after an initial decline in their output following the move towards becoming market economies, we have to choose the initial year differently for each country. Again the R 2 value is relatively high at.72. It would rise to.82 if we were to remove Macedonia and Turkey that have grown at an average rate of just 2 per cent annually despite a low initial income level, and further to.84 if we were to remove Ireland, too. Based on this historical evidence, we argue that at least in so far as the EMEs reform their economic structures and allow for working markets and economic integration with the rest of the world, convergence is likely to continue. Those EMEs that are or will become EU members are better sheltered against national policies that could interrupt this development.
20 2 Figure 3.7 PPP-adjusted GDP per capita in the EU15 countries in 196 and its average growth rate in (left-hand side graph) and PPP-adjusted GDP per capita in the EU15 countries in 199 and the EMEs in their troughs in the 199s and average annual growth rates up until 26 (right-hand side graph) EU15 in EU15 and EMEs since the 199s Average GDP per capita growth rate R 2 =.78 Average GDP per capita growth rate R 2 = Initial GDP per capita in Initial GDP per capita Note: Excluding Luxembourg. Source: Eurostat. Figure 3.8 shows all the 21 EMEs and their projected real and nominal convergence towards the EU15 GDP per capita level. The pace of catching up slows down towards the end of the period. This is because the force of the factors that produce the convergence in the model decreases as the income gap decreases. Some of the countries seem to run out of steam before full convergence is reached. In the model this can arise from a less favourable development of the labour force (see Sections 6.3 and 7.1 for more discussion of this). As Figure 4.3 shows, the projections for working-aged population start to deteriorate in the EMEs on average relative to the EU15 in the mid-23s. In the 24s, the size of the working-aged population is projected to decrease more than in the EU15 in all EMEs save Azerbaijan and Albania.
21 21 Figure 3.8 Real and nominal GDP per capita convergence, EU15 = Average EMEs Albania 1 8 Armenia 1 8 Azerbaijan Bosnia-Herzegovina 1 8 Bulgaria 1 8 Croatia Czech Republic 1 8 Estonia 1 8 Georgia Real convergence Real and nominal convergence
22 22 Figure 3.8 Real and nominal GDP per capita convergence, EU15 = 1 (Cont d) 1 8 Hungary 1 8 Kazakhstan 1 8 Latvia Lithuania 1 8 Macedonia 1 8 Poland Romania 1 8 Russia 1 8 Slovakia Slovenia 1 8 Turkey 1 8 Ukraine Real convergence Real and nominal convergence
23 23 4 MODEL OF REAL GDP GROWTH AND CONVERGENCE We now turn to construct the framework used in the growth projections. In order to make projections of the trend growth of real GDP several decades into the future we need a framework based on growth theory. We also have to make a number of assumptions. The countries that we analyse are compared with the average development in the EU15 countries. Thus we need to project future growth for both the EU15 and the EMEs. Some of the variables for the EMEs are functions of the projected development in the EU15 countries. We need to estimate the current capital stock, future investment rates, and the growth rate of total factor productivity. The other factor of production besides physical capital is labour that we take as given from international databases. We use historical data for to pinpoint the countries starting positions and then extrapolate from there using certain assumptions. Historical purchasing-power adjusted GDP and gross fixed capital formation are taken from the UNECE database. In a few cases we have taken the investment rate from the WDI database by the World Bank, because of gaps in our principal data source. 4.1 The production function In the tradition of neo-classical growth theory, production (GDP) is determined by a constant-returns-to-scale Cobb-Douglas production function given by Y = AK α L 1 α, (1) where Y is gross domestic product, A is total factor productivity (TFP), K is the capital stock, L is labour given by the year old population and α is the elasticity of output with respect to capital (and also, assuming perfect competition, the share of capital in total income). We set α uniformly at.33 for all the countries as is often done in empirical work Growth in total factor productivity The change in total factor productivity is that part of the change in real GDP that cannot be explained by changes in the capital stock and labour. For example if GDP increases by 1 per cent, but both the capital stock and labour are unchanged, then TFP has risen by 1 per cent. This means that the existing factors of production K and L have been used more efficiently than before. In fact, long-term (steady-state) income growth comes from increasing total factor productivity. For the EU15 countries the average future growth rate of TFP is set exogenously at 1.5 per cent annually. This is consistent with an average labour productivity growth of slightly above 2 per cent. 4 According to estimations that we have made using the framework constructed in this analysis, the average growth rate of TFP in the EU15 countries in the period 3 For example, Barro et al. (21) use.3, while Mankiw et al. (1992), Wilson and Purushothaman (23), Benhabib and Spiegel (25) and Poncet (26) use Labour productivity can be written on the basis of (1) as Y L ( ) accumulation can be written on the basis of the marginal productivity of capital as K L (( ) A) 1 ( α ρ δ α 1) 1 where ρ is the cost of capital. Inserting this into the first expression we get ( 1 α ) α ( α 1) Y L A (( ρ δ) α) = A K L α, and the optimal condition for capital = +, = +. As over time the cost of capital has remained roughly constant, we can assume that the growth rate of labour productivity is approximately equal to 1 ( 1 α ) times the growth rate of TFP. With α =.33 and TFP growth in the EU15 equal to.15 we get a labour productivity growth rate of 2.2 per cent.
24 24 was 1.6 per cent. Thus the assumed future TFP growth rate is very close to its historical average. Of course, in reality there are periods of higher and lower TFP growth over the course of time. These are related to, among other things, the stage of the business cycle and technological advances. A study such as this one does not aim to take into account business cycles. TFP growth in the EMEs can be expected to be higher than in the more advanced EU15 countries that are closer to the technological frontier. This is because the EMEs can imitate and adopt modern production technology and copy best practices from more advanced countries and thus grow faster. The EMEs have in many cases also benefited from flows of foreign direct investment from more advanced economies. Unlike the EMEs, the advanced countries need to be more innovative in expanding their output as they are on or close to the technological frontier. As a simple measurement of the speed of catching up we use the β convergence specification, a standard element in growth literature. Let a = log A. Then aˆt = a t a t 1 is the growth rate of TFP, which is given in the EMEs by y EME, t 1 aˆ ˆ EME, t = aeu15, t β log y, (2) EU15, t 1 where a ˆEU15 =.15 is the exogenously set TFP growth rate in the EU15, β is the speed of convergence, and y is per capita GDP. As the income gap decreases, the second term on the right-hand side goes to zero and the growth rate of TFP in the EMEs converges to that in the EU15 countries. Then also the levels of TFP will be broadly similar. Figure 4.1 shows projected TFP growth rates for selected EMEs and the EU15. Figure 4.1 Projected trend TFP growth rates in selected EMEs and the EU15, % EU15 EMEs Albania Estonia Hungary Poland Romania Russia The choice of β is quite critical for the speed of convergence (see Section 6.3 for the effect of a different choice of β). For example, Barro et al. (21) use.14 for β in their closed-
25 25 economy framework and.23 in their open-economy framework that allows for international borrowing and lending, while Wilson and Purushothaman (23) use.15. Kaitila (24) finds that the conditional convergence rate has varied between.16 and.34 for the EU15 countries depending on the model specification. Dobson et al. (26) review the estimation results from 38 studies on international convergence. Taking the simple average of the results quoted there gives us an estimated β of.16 with a standard deviation of.12 and a range between -.7 and.57. The estimation results thus vary a lot. The results are influenced by, among other things, sample design and methodology. If we pick just the studies made on more advanced countries we get a simple average of.19 with a standard deviation of.8. On the basis of these we set the convergence coefficient β at.25, which is a little on the high side but still within the range of empirical growth estimations. In line with the tradition of neo-classical growth theory, we have assumed that β is fixed. In reality, the speed of convergence is not the same for all countries. Poncet (26) links the growth rate of TFP to the level of human capital. Then it does not suffice for a country to be poor to grow faster, but also needs to have a reasonable level of human capital in order to catch up with the leading economies. We discuss the EMEs levels of education from this point of view in Section Investment and capital stocks In order to calculate GDP projections we need to know the countries capital stocks. Estimates for capital stocks are typically not available in international databases. Eurostat does publish net capital stock figures for the EU15 countries so we can calibrate our EU15 calculations against those and see how our setup on estimating the initial capital stocks works. Following Benhabib and Spiegel (25), we calculate the initial net capital stock using the following steady-state formulation: K Yi g δ n =, (3) + + where Y is real GDP in the initial year, i is the average annual investment rate (investmentto-gdp ratio) during the time period between the initial year and 26, g is the average GDP per capita growth rate during the same time period, δ is the depreciation rate and n is the average population growth rate. This formulation comes from steady-state growth equilibrium where the flow of investment is equal to the full depreciation rate ( g + δ + n) times the capital stock. The starting year in our estimations for the EMEs is This formulation may in principle overestimate the capital stock in the EMEs that are in the process of transition from socialist to market economies, but after 15 years of transition this bias is likely to be quite small. After having calculated initial capital stocks, we extrapolate them to the present by using the standard perpetual inventory method (PIM): Kt = Kt 1 ( 1 δ ) + It, (4) where I t is gross fixed capital formation in constant prices in time period t. The depreciation rate δ is set uniformly at.4. This is not only a standard assumption 5 in empirical growth literature but we have also derived it for the EU15 area by finding the de- 5 Barro et al. (21) and Poncet (26) use δ =.5, while Wilson and Purushothaman (23) use.4 and Benhabib and Spiegel (25) use.3. Mankiw et al. (1992) use.5 for the sum of the depreciation rate and the exogenous rate of TFP growth.
26 26 preciation rate that gives us the best fit for between the capital stock time series calculated by the Eurostat and our estimate calculated on the basis of (3) and (4). Using equations (3) and (4) we get an estimate of the net capital stock in 26 in constant 25 prices. For 26 onwards we use a model for the investment rate for each country in order to estimate future net capital stocks that are needed to calculate future GDP. Following Barro et al. (21) we use a steady-state investment rate for the EU15 countries derived from a model of optimal growth and given by i EU15, t t α δ + λ ˆ i + a 5 i= t =, (5) δ + ρ t where i is the investment rate, λi is the average growth rate of the working-aged population in the next five-year period, â is the average TFP growth rate (.15), and ρ is the 5 i= t steady-state real interest rate set at.51 to represent a long-term average of real rates of return in the stock market. 6 This will give us an average investment rate of 18.5 per cent in the period. This is below the 19.8 per cent average in the EU15 area in , but weaker future population developments are likely to lead to lower investment rates. Wilson and Purushothaman (23) assume a fixed investment rate for catching-up countries. This is not realistic, however. As the countries catch up with more advanced economies, the growth rate of total factor productivity will slow down, the rates of return on investment will converge with those in the more advanced economies, and thus also the investment rate should converge, that is, generally speaking decline. For example, if we were to assume that a country would continue to have an investment rate of 25 per cent even after having converged with the EU15 area that has an investment rate of 18.5 per cent, the former would likely be engaged in overinvestment with very low rates of return. This would not be sustainable in the long run. Consequently, we assume that the investment rate in the EMEs will converge to that in the EU15 countries. For this we have used the following equation: ( ) ( ) i = i + η i i + ϕ γ γ, (6) EME, t EU15, t EME, t 1 EU15, t 1 EME, t EU15, t where γ is real GDP growth rate. The first term on the right-hand-side is the investment rate in the EU15 region as calculated from (5). As GDP growth rates converge, the third term on the right-hand side goes to zero, and this will also bring the second term down to zero. We have estimated the two constants, η and ϕ, from large historical datasets using pooled least squares. The estimation results are presented in Table 4.1. On the basis of these results we have set η =.88 and ϕ =.2. A constant was not statistically significant and is therefore not included in the specifications. This setup means that in the long run there are no differences in savings rates between the EMEs and the EU15. It does allow for the currently diverging savings rates, however. Figure 4.2 shows historical and projected investment rates in selected EMEs and EU We have chosen ρ so as to keep the capital-stock-to-gdp ratio stable into the future as it has been during Barro et al. (21) use a ρ value of.6. They also include taxation and human capital in their model. We abstract from these. 7 As for other investment-rate approaches in recent studies, Poncet (26) uses a quadratic formulation, where the savings rate and thus the investment rate is a function of the previous period s savings rate, GDP per capita ratio between the country and the USA, the square of that ratio, and the GDP growth rate. Her projections have the
ETLA ELINKEINOELÄMÄN TUTKIMUSLAITOS
 ETLA ELINKEINOELÄMÄN TUTKIMUSLAITOS THE RESEARCH INSTITUTE OF THE FINNISH ECONOMY Lönnrotinkatu 4 B 12 Helsinki Finland Tel. 358-9-69 9 Telefax 358-9-61 753 World Wide Web: http://www.etla.fi/ Keskusteluaiheita
Growth prospects and challenges in EBRD countries of operation. Sergei Guriev Chief Economist
 Growth prospects and challenges in EBRD countries of operation Sergei Guriev Chief Economist Post-crisis slowdown in convergence became more protracted, affected emerging markets globally Is this slowdown
Comparing pay trends in the public services and private sector. Labour Research Department 7 June 2018 Brussels
 Comparing pay trends in the public services and private sector Labour Research Department 7 June 2018 Brussels Issued to be covered The trends examined The varying patterns over 14 years and the impact
CESEE DELEVERAGING AND CREDIT MONITOR 1
 CESEE DELEVERAGING AND CREDIT MONITOR 1 November 17, 215 Key developments in BIS Banks External Positions and Domestic Credit The reduction of external positions of BIS reporting banks vis-à-vis Central,
CESEE DELEVERAGING AND CREDIT MONITOR 1
 CESEE DELEVERAGING AND CREDIT MONITOR 1 December 6, 216 Key developments in BIS Banks External Positions and Domestic Credit and Key Messages from the CESEE Bank Lending Survey The external positions of
HOUSEHOLDS LENDING MARKET IN THE ENLARGED EUROPE. Debora Revoltella and Fabio Mucci copyright with the author New Europe Research
 HOUSEHOLDS LENDING MARKET IN THE ENLARGED EUROPE Debora Revoltella and Fabio Mucci copyright with the author New Europe Research ECFin Workshop on Housing and mortgage markets and the EU economy, Brussels,
Spain France. England Netherlands. Wales Ukraine. Republic of Ireland Czech Republic. Romania Albania. Serbia Israel. FYR Macedonia Latvia
 Germany Belgium Portugal Spain France Switzerland Italy England Netherlands Iceland Poland Croatia Slovakia Russia Austria Wales Ukraine Sweden Bosnia-Herzegovina Republic of Ireland Czech Republic Turkey
READING 20: DREAMING WITH BRICS: THE PATH TO
 READING 20: DREAMING WITH BRICS: THE PATH TO 2050 Dreaming with BRICs: The Path to 2050, by Dominic Wilson and Roopa Purushothaman, reprinted from Global Economics Paper Number 99. Copyright 2003. Reprinted
CESEE DELEVERAGING AND CREDIT MONITOR 1
 CESEE DELEVERAGING AND CREDIT MONITOR 1 May 27, 214 In 213:Q4, BIS reporting banks reduced their external positions to CESEE countries by.3 percent of GDP, roughly by the same amount as in Q3. The scale
CESEE DELEVERAGING AND CREDIT MONITOR 1
 CESEE DELEVERAGING AND CREDIT MONITOR 1 May 11, 217 Key developments in BIS Banks External Positions and Domestic Credit and Key Messages from the CESEE Bank Lending Survey The external positions of BIS
There is poverty convergence
 There is poverty convergence Abstract Martin Ravallion ("Why Don't We See Poverty Convergence?" American Economic Review, 102(1): 504-23; 2012) presents evidence against the existence of convergence in
THE EU S ECONOMIC RECOVERY PICKS UP MOMENTUM
 THE EU S ECONOMIC RECOVERY PICKS UP MOMENTUM ECONOMIC SITUATION The EU economy saw a pick-up in growth momentum at the beginning of this year, boosted by strong business and consumer confidence. Output
Financing Constraints and Employment Evidence from Transition Countries. Dorothea Schäfer (DIW Berlin), Susan Steiner (LUH)
, Susan Steiner (LUH)") Financing Constraints and Employment Evidence from Transition Countries Dorothea Schäfer (DIW Berlin), Susan Steiner (LUH) Research question Do firms financing constraints inhibit the generation of employment?
Financing Constraints and Employment Evidence from Transition Countries Dorothea Schäfer (DIW Berlin), Susan Steiner (LUH) Research question Do firms financing constraints inhibit the generation of employment?
CURRENT ECONOMIC PERFORMANCE AND CHALLENGES FOR LITHUANIAN ECONOMY ALGIRDAS MISKINIS VILNIUS UNIVERSITY
 CURRENT ECONOMIC PERFORMANCE AND CHALLENGES FOR LITHUANIAN ECONOMY ALGIRDAS MISKINIS VILNIUS UNIVERSITY Presentation prepared for the Conference: Competitiveness Strategies for the EU Small States Chambre
Growth and Real Exchange Rate Appreciation in the CEECs: Some reflections on the catching up process
 Growth and Real Exchange Rate Appreciation in the CEECs: Some reflections on the catching up process FIRST DRAFT Comments welcome Lars Nilsson a a Ministry for Foreign Affairs, Department for European
IZMIR UNIVERSITY of ECONOMICS
 IZMIR UNIVERSITY of ECONOMICS Department of International Relations and the European Union TURKEY EU RELATIONS ( EU308) FOREIGN DIRECT INVESTMENT IN THE EUROPEAN UNION AND TURKEY Prepared By: Büke OŞAFOĞLU
World Economic Outlook Central Europe and Baltic Countries
 World Economic Outlook Central Europe and Baltic Countries Presentation by Susan Schadler and Christoph Rosenberg September 5 World growth returns to trend. (World real GDP growth, annual percent change)
Period 3 MBA Program January February MACROECONOMICS IN THE GLOBAL ECONOMY Core Course. Professor Ilian Mihov
 Period 3 MBA Program January February 2008 MACROECONOMICS IN THE GLOBAL ECONOMY Core Course Professor SOLUTIONS Final Exam February 25, 2008 Time: 09:00 12:00 Note: These are only suggested solutions.
Central and Eastern Europe: Global spillovers and external vulnerabilities
 Central and Eastern Europe: Central and Eastern Europe: Global spillovers and external vulnerabilities ICEG Annual Conference Brussels, May 28 Christoph Rosenberg International Monetary Fund Overview The
Performance of Private Equity Funds in Central and Eastern Europe and the CIS Data to 31 December 2008
 Performance of Private Equity Funds in Central and Eastern Europe and the CIS Data to 31 December 2008 1 EBRD in Private Equity EBRD s portfolio of funds: over 15 years of investing in the asset class
Reimbursable Advisory Services in Europe and Central Asia (ECA)
") Reimbursable Advisory Services in Europe and Central Asia (ECA) Expanding Options for Our Clients: Global Knowledge, Strategy, and Local Solutions REIMBURSABLE ADVISORY SERVICES (RAS): What Are They? RAS
Reimbursable Advisory Services in Europe and Central Asia (ECA) Expanding Options for Our Clients: Global Knowledge, Strategy, and Local Solutions REIMBURSABLE ADVISORY SERVICES (RAS): What Are They? RAS
Performance of Private Equity Funds in Central and Eastern Europe and the CIS
 Performance of Private Equity Funds in Central and Eastern Europe and the CIS Data to 31 December 26 1 EBRD in Private Equity EBRD s portfolio of funds: 15 years of investing in the asset class Investment
Riding the global growth wave. Richard Grieveson. Press conference, 13 March New wiiw forecast for Central, East and Southeast Europe,
 Wiener Institut für Internationale Wirtschaftsvergleiche The Vienna Institute for International Economic Studies wiiw.ac.at Press conference, 13 March 2018 New wiiw forecast for Central, East and Southeast
Statistics Brief. Inland transport infrastructure investment on the rise. Infrastructure Investment. August
 Statistics Brief Infrastructure Investment August 2017 Inland transport infrastructure investment on the rise After nearly five years of a downward trend in inland transport infrastructure spending, 2015
Sustainable development and EU integration of the Western Balkans
 Sustainable development and EU integration of the Western Balkans Milica Uvalić University of Perugia Tripartite High-Level Regional Conference of Pan-European Trade Union Council: Taxation, Informal Economy
New wiiw forecast for Central, East and Southeast Europe, Riding the global growth wave
 Wiener Institut für Internationale Wirtschaftsvergleiche The Vienna Institute for International Economic Studies wiiw.ac.at wiiw Spring Seminar, 12 April 218 New wiiw forecast for Central, East and Southeast
Pensions and other age-related expenditures in Europe Is ageing too expensive?
 1 Pensions and other age-related expenditures in Europe Is ageing too expensive? Bo Magnusson bo.magnusson@his.se Bernd-Joachim Schuller bernd-joachim.schuller@his.se University of Skövde Box 408 S-541
TWO VIEWS ON EFFICIENCY OF HEALTH EXPENDITURE IN EUROPEAN COUNTRIES ASSESSED WITH DEA
 TWO VIEWS ON EFFICIENCY OF HEALTH EXPENDITURE IN EUROPEAN COUNTRIES ASSESSED WITH DEA MÁRIA GRAUSOVÁ, MIROSLAV HUŽVÁR Matej Bel University in Banská Bystrica, Faculty of Economics, Department of Quantitative
Real Convergence of Western Balkan Countries to European Union in view of Macroeconomic Policy Mix 1
 Real Convergence of Western Balkan Countries to European Union in view of Macroeconomic Policy Mix 187 UDK: 330.101.541(497) DOI: 10.2478/jcbtp-2018-0018 Journal of Central Banking Theory and Practice,
by Svetla Trifonova Marinova and Martin Alexandrov Marinov Aldershot, Ashgate Pp. 352
 Book Review For oreign Direct Investment in Central and Eastern Europe by Svetla Trifonova Marinova and Martin Alexandrov Marinov Aldershot, Ashgate 2003. Pp. 352 reviewed by Dimitrios Kyrkilis* Since
Performance of EBRD Private Equity Funds Portfolio Data to 31 st December EBRD 2011, all rights reserved
 Performance of EBRD Private Equity Funds Portfolio Data to 31 st December 2010 0 Portfolio Overview 1 EBRD in Private Equity EBRD s portfolio of funds: over 15 years of investing in the asset class 133
4.1. CONVERGENCE MONITOR: POSITIVE TRENDS BUT LONG-TERM CHALLENGES
 38 CES MONITORS 4. CES monitors 4.1. CONVERGENCE MONITOR: POTIVE TRENDS BUT LONG-TERM CHLENGES by Leon Podkaminer 4.1.1. The income gap separating CES from the highly developed countries has narrowed since
Bulgaria in the EU: Challenges and opportunities
 Bulgaria in the EU: Challenges and opportunities 60 days before EU: what to expect, what to do? Sofia, October 18, 2006 Maria Laura Lanzeni Head of Emerging Markets Global Risk Analysis Think tank of Deutsche
THE INVERTING PYRAMID: DEMOGRAPHIC CHALLENGES TO THE PENSION SYSTEMS IN EUROPE AND CENTRAL ASIA
 THE INVERTING PYRAMID: DEMOGRAPHIC CHALLENGES TO THE PENSION SYSTEMS IN EUROPE AND CENTRAL ASIA 1 Anita M. Schwarz Lead Economist Human Development Department Europe and Central Asia Region World Bank
Households capital available for renovation
 Households capital available for Methodical note Copenhagen Economics, 22 February 207 The task at hand has been twofold: firstly, we were to calculate an estimate of households average capital available
Macroeconomic scenarios for skill demand and supply projections, including dealing with the recession
 Alphametrics (AM) Alphametrics Ltd Macroeconomic scenarios for skill demand and supply projections, including dealing with the recession Paper presented at Skillsnet technical workshop on: Forecasting
THE ECONOMY AND THE BANKING SECTOR IN BULGARIA
 THE ECONOMY AND THE BANKING SECTOR IN BULGARIA THIRD QUARTER OF 2018 SOFIA HIGHLIGHTS The Bulgarian economy recorded growth of 3,2% on an annual basis in Q2 2018, driven by the private consumption and
Enterprise Europe Network SME growth forecast
 Enterprise Europe Network SME growth forecast 2017-18 een.ec.europa.eu Foreword Since we came into office three years ago, this European Commission has put the creation of more jobs and growth at the centre
Statistics Brief. Trends in Transport Infrastructure Investment Infrastructure Investment. July
 Statistics Brief Infrastructure Investment July 2011 Trends in Transport Infrastructure Investment 1995-2009 The latest update of annual transport infrastructure and maintenance data collected by the International
Working with the European Bank for Reconstruction and Development. Matti Hyyrynen 15 th March 2018
 Working with the European Bank for Reconstruction and Development Matti Hyyrynen 15 th March 2018 EBRD Introduction An international financial institution supporting the development of sustainable well-functioning
The World Bank. Asia (ECA) Economic Update. Annual Meetings Istanbul October 3, 2009
 Economic Update. Annual Meetings Istanbul October 3, 2009") The World Bank Europe and Central Asia (ECA) Economic Update Annual Meetings Istanbul October 3, 2009 More than $350 billion of ECA s foreign debt matures in 2010 Source: World Bank, DEC Prospects Group
The World Bank Europe and Central Asia (ECA) Economic Update Annual Meetings Istanbul October 3, 2009 More than $350 billion of ECA s foreign debt matures in 2010 Source: World Bank, DEC Prospects Group
Testing the Solow Growth Theory
 Testing the Solow Growth Theory Dilip Mookherjee Ec320 Lecture 4, Boston University Sept 11, 2014 DM (BU) 320 Lect 4 Sept 11, 2014 1 / 25 RECAP OF L3: SIMPLE SOLOW MODEL Solow theory: deviates from HD
Non-Performing Loans in CESEE
 Non-Performing Loans in CESEE Vienna, September 23, 2014 James Roaf Senior Resident Representative IMF Regional Office for Central and Eastern Europe, Warsaw High NPLs ratios need to be addressed Boom-bust
THE ECONOMY AND THE BANKING SECTOR IN BULGARIA
 THE ECONOMY AND THE BANKING SECTOR IN BULGARIA SECOND QUARTER OF 2017 Sofia HIGHLIGHTS The Bulgarian economy recorded growth of 3,9% on an annual basis in Q1 2017, driven by the domestic demand; The inflation
Linking Education for Eurostat- OECD Countries to Other ICP Regions
 International Comparison Program [05.01] Linking Education for Eurostat- OECD Countries to Other ICP Regions Francette Koechlin and Paulus Konijn 8 th Technical Advisory Group Meeting May 20-21, 2013 Washington
Non-financial corporations - statistics on profits and investment
 Non-financial corporations - statistics on profits and investment Statistics Explained Data extracted in May 2018. Planned article update: May 2019. This article focuses on investment and the distribution
Equity Funds Portfolio Update. Data as of June 2012
 Equity Funds Portfolio Update Data as of June 2012 Equity Funds at a Glance Equity Funds Portfolio: 142 investments made Russia/CIS EUR 1.17bln committed 46 funds 29 Active 17 Liquidated Average Age of
THE ECONOMY AND THE BANKING SECTOR IN BULGARIA
 THE ECONOMY AND THE BANKING SECTOR IN BULGARIA SECOND QUARTER OF 2018 SOFIA HIGHLIGHTS The Bulgarian economy recorded growth of 3,6% on an annual basis in Q1 2018, driven by the private consumption and
ECONOMIC CONVERGENCE AND THE GLOBAL CRISIS OF : THE CASE OF BALTIC COUNTRIES AND UKRAINE
 ISSN 1822-8011 (print) ISSN 1822-8038 (online) INTELEKTINĖ EKONOMIKA INTELLECTUAL ECONOMICS 2014, Vol. 8, No. 2(20), p. 135 146 ECONOMIC CONVERGENCE AND THE GLOBAL CRISIS OF 2008-2012: THE CASE OF BALTIC
Irish Economy and Growth Legal Framework for Growth and Jobs High Level Workshop, Sofia
 Irish Economy and Growth Legal Framework for Growth and Jobs High Level Workshop, Sofia Diarmaid Smyth, Central Bank of Ireland 18 June 2015 Agenda 1 Background to Irish economic performance 2 Economic
THE ROLE OF INVESTMENT IN A SUSTAINABLE DEVELOPMENT OF THE ECONOMY OF LATVIA ABSTRACT
 УПРАВЛЕНИЕ И УСТОЙЧИВО РАЗВИТИЕ 1-2/25(12) MANAGEMENT AND SUSTAINABLE DEVELOPMENT 1-2/25(12) THE ROLE OF INVESTMENT IN A SUSTAINABLE DEVELOPMENT OF THE ECONOMY OF LATVIA Maija Senfelde Technical University
EUROPA - Press Releases - Taxation trends in the European Union EU27 tax...of GDP in 2008 Steady decline in top corporate income tax rate since 2000
 DG TAXUD STAT/10/95 28 June 2010 Taxation trends in the European Union EU27 tax ratio fell to 39.3% of GDP in 2008 Steady decline in top corporate income tax rate since 2000 The overall tax-to-gdp ratio1
THE PROCESS OF ECONOMIC CONVERGENCE IN MALTA
 THE PROCESS OF ECONOMIC CONVERGENCE IN MALTA Article published in the Quarterly Review 2017:3, pp. 29-36 BOX 2: THE PROCESS OF ECONOMIC CONVERGENCE IN MALTA 1 Convergence, both economically and institutionally,
CESEE Deleveraging and Credit Monitor 1
 CESEE Deleveraging and Credit Monitor 1 June 5, 218 Key Developments in BIS Banks External Positions and Domestic Credit and Key Messages from the CESEE Bank Lending Survey Deleveraging of western banks
New data from Enterprise Surveys indicate that firms in Turkey operate at least as well as the average EU-
 Public Disclosure Authorized Public Disclosure Authorized Public Disclosure Authorized Public Disclosure Authorized WORLD BANK GROUP COUNTRY NOTE NO. 1 29 ENTERPRISE SURVEYS COUNTRY NOTE SERIES Running
The Architectural Profession in Europe 2012
 The Architectural Profession in Europe 2012 - A Sector Study Commissioned by the Architects Council of Europe Chapter 2: Architecture the Market December 2012 2 Architecture - the Market The Construction
DETERMINANT FACTORS OF FDI IN DEVELOPED AND DEVELOPING COUNTRIES IN THE E.U.
 Diana D. COCONOIU Bucharest University of Economic Studies, Dimitrie Cantemir Christian University, DETERMINANT FACTORS OF FDI IN DEVELOPED AND DEVELOPING COUNTRIES IN THE E.U. Statistical analysis Keywords
Recent developments. Note: The author of this section is Yoki Okawa. Research assistance was provided by Ishita Dugar. 1
 Growth in the Europe and Central Asia region is anticipated to ease to 3.2 percent in 2018, down from 4.0 percent in 2017, as one-off supporting factors wane in some of the region s largest economies.
FDI in Central, East and Southeast Europe: Recovery amid Stabilising Economic Growth
 Wiener Institut für Internationale Wirtschaftsvergleiche The Vienna Institute for International Economic Studies www.wiiw.ac.at wiiw FDI Report 217 FDI in Central, East and Southeast Europe: Recovery amid
BULGARIA COMPETITIVENESS REVIEW
 BULGARIA COMPETITIVENESS REVIEW May 11 1 The present report makes an assessment of Bulgaria s stance in terms of competitiveness based on the following OECD definition 1 : Competitiveness is the degree
Stocktaking of the Real Estate Market - Snapshot of the available data - Vice Governor Anita Angelovska-Bezoska
 Stocktaking of the Real Estate Market - Snapshot of the available data - Vice Governor Anita Angelovska-Bezoska October, 216 Contents Why is the real estate market important for central bankers? Some structural
Constraints on Exchange Rate Flexibility in Transition Economies: a Meta-Regression Analysis of Exchange Rate Pass-Through
 Constraints on Exchange Rate Flexibility in Transition Economies: a Meta-Regression Analysis of Exchange Rate Pass-Through Igor Velickovski & Geoffrey Pugh Applied Economics 43 (27), 2011 National Bank
Regional Benchmarking Report
 Financial Sector Benchmarking System Regional Benchmarking Report October 2011 About the Financial Sector Benchmarking System This Regional Benchmarking Report is part of a series of benchmarking reports
Borderline cases for salary, social contribution and tax
 Version Abstract 1 (5) 2015-04-21 Veronica Andersson Salary and labour cost statistics Borderline cases for salary, social contribution and tax (Workshop on Labour Cost Survey, Rome, Italy 5-6 May 2015)
Regional convergence in Spain:
 ECONOMIC BULLETIN 3/2017 ANALYTICAL ARTIES Regional convergence in Spain: 1980 2015 Sergio Puente 19 September 2017 This article aims to analyse the process of per capita income convergence between the
CERTIFICATION PROGRAMME: RISK MANAGEMENT IN BANKING
 CERTIFICATION PROGRAMME: RISK MANAGEMENT IN BANKING ORGANISATION SHEET Objectives Methodology Target group Examination Lecturers The certification programme: Risk Management in Banking provides participants
34 th Associates Meeting - Andorra, 25 May Item 5: Evolution of economic governance in the EU
 34 th Associates Meeting - Andorra, 25 May 2012 - Item 5: Evolution of economic governance in the EU Plan of the Presentation 1. Fiscal and economic coordination: how did it start? 2. Did it work? 3. Five
Long Term Reform Agenda International Perspective
 Long Term Reform Agenda International Perspective Asta Zviniene Sr. Social Protection Specialist Human Development Department Europe and Central Asia Region World Bank October 28 th, 2010 We will look
Economic and Social Council
 United Nations ECE/MP.PP/WG.1/2011/L.7 Economic and Social Council Distr.: Limited 25 November 2010 Original: English Economic Commission for Europe Meeting of the Parties to the Convention on Access to
Performance of EBRD Private Equity Funds Portfolio to 31 st December 2011
 Performance of EBRD Private Equity Funds Portfolio to 31 st December 211 Portfolio Overview EBRD in Private Equity EBRD s portfolio of funds: 2 years of investing in the asset class 137 funds 92 fund managers*
Occasional Paper series
 Occasional Paper series No 86 / Real convergence and the determinants of growth in EU candidate and potential candidate countries a panel data approach by Magdalena Morgese Borys, Éva Katalin Polgár and
BULGARIAN TRADE WITH EU IN THE PERIOD JANUARY - APRIL 2017 (PRELIMINARY DATA)
") BULGARIAN TRADE WITH EU IN THE PERIOD JANUARY - APRIL 2017 (PRELIMINARY DATA) In the period January - April 2017 Bulgarian exports to the EU increased by 8.6% 2016 and amounted to 10 418.6 Million BGN
BULGARIAN TRADE WITH EU IN THE PERIOD JANUARY - APRIL 2017 (PRELIMINARY DATA) In the period January - April 2017 Bulgarian exports to the EU increased by 8.6% 2016 and amounted to 10 418.6 Million BGN
BULGARIAN TRADE WITH EU IN THE PERIOD JANUARY - MAY 2017 (PRELIMINARY DATA)
") BULGARIAN TRADE WITH EU IN THE PERIOD JANUARY - MAY 2017 (PRELIMINARY DATA) In the period January - May 2017 Bulgarian exports to the EU increased by 10.8% 2016 and added up to 13 283.0 Million BGN (Annex,
BULGARIAN TRADE WITH EU IN THE PERIOD JANUARY - MAY 2017 (PRELIMINARY DATA) In the period January - May 2017 Bulgarian exports to the EU increased by 10.8% 2016 and added up to 13 283.0 Million BGN (Annex,
The solid performance of CEE. Central and Eastern Europe pulled along by banks
 The opening of the credit sector to outside investors has been a key part of the process of transforming and modernising the entire area and its economy. Western banks now play a leading role in many countries,
FDI in Central, East and Southeast Europe: Declines due to Disinvestment
 Wiener Institut für Internationale Wirtschaftsvergleiche The Vienna Institute for International Economic Studies www.wiiw.ac.at wiiw FDI Report 218 FDI in Central, East and Southeast Europe: Declines due
Enterprise Europe Network SME growth outlook
 Enterprise Europe Network SME growth outlook 2018-19 een.ec.europa.eu 2 Enterprise Europe Network SME growth outlook 2018-19 Foreword The European Commission wants to ensure that small and medium-sized
Best practice insolvency and creditor rights systems: key for financial stability
 Best practice insolvency and creditor rights systems: key for financial stability Prepared by F. Montes-Negret 1 When the World Bank in 2001 approved Insolvency and Creditors Rights (ICRs) Principles,
Consumer credit market in Europe 2013 overview
 Consumer credit market in Europe 2013 overview Crédit Agricole Consumer Finance published its annual survey of the consumer credit market in 28 European Union countries for seven years running. 9 July
ANNEX 3. The ins and outs of the Baltic unemployment rates
 ANNEX 3. The ins and outs of the Baltic unemployment rates Introduction 3 The unemployment rate in the Baltic States is volatile. During the last recession the trough-to-peak increase in the unemployment
Index. B Belarus health-care system, 107 Budget-based financing, 11 Bulgaria, corporatised hospitals,
 Index A Age structure of population, 31 Aggregate health spending, national product and, 27 29 Albania health-care system, 106 Ambulatory care, 10 Anecdotal evidence, 18 Armenia, corporatised hospitals
Austerity in the Aftermath of the Great Recession
 Austerity in the Aftermath of the Great Recession Christopher L. House University of Michigan and NBER. Christian Proebsting EPFL École Polytechnique Fédérale de Lausanne Linda Tesar University of Michigan
Live Long and Prosper? Demographic Change and Europe s Pensions Crisis. Dr. Jochen Pimpertz Brussels, 10 November 2015
 Live Long and Prosper? Demographic Change and Europe s Pensions Crisis Dr. Jochen Pimpertz Brussels, 10 November 2015 Old-age-dependency ratio, EU28 45,9 49,4 50,2 39,0 27,5 31,8 2013 2020 2030 2040 2050
CROATIA S EU CONVERGENCE REPORT: REACHING AND SUSTAINING HIGHER RATES OF ECONOMIC GROWTH, Document of the World Bank, June 2009, pp.
 CROATIA S EU CONVERGENCE REPORT: REACHING AND SUSTAINING HIGHER RATES OF ECONOMIC GROWTH, Document of the World Bank, June 2009, pp. 208 Review * The causes behind achieving different economic growth rates
Performance of EBRD Private Equity Funds Portfolio 2003 year end data
 Performance of EBRD Private Equity Funds Portfolio 23 year end data Table Of Contents EBRD classifications General information on equity markets Investors data Overview of EBRD s portfolio: EBRD commitments,irrs
Caucasus and Central Asia Regional Economic Outlook October 2011
 Regional Economic Outlook October 211 Oil and gas exporters Oil and gas importers Kazakhstan Georgia Uzbekistan Kyrgyz Republic Armenia Azerbaijan Turkmenistan Tajikistan Overview Global outlook (CCA)
Assessing Corporate Governance in Investee Companies
 Assessing Corporate Governance in Investee Companies Gian Piero Cigna Principal Counsel, Office of the General Counsel EBRD Third DFI Conference on Corporate Governance Tunis, 20 October 2008 Presentation
Conditional convergence: how long is the long-run? Paul Ormerod. Volterra Consulting. April Abstract
 Conditional convergence: how long is the long-run? Paul Ormerod Volterra Consulting April 2003 pormerod@volterra.co.uk Abstract Mainstream theories of economic growth predict that countries across the
2017 BAVARIA S ECONOMY FACTS AND FIGURES
 Bavarian Ministry of Economic Affairs and Media, Energy and Technology 2017 BAVARIA S ECONOMY FACTS AND FIGURES www.stmwi.bayern.de As of August 2017 Area km² 70,550 70,550 70,550 Population (31.12.) 1)
Turkey and the Emerging. the Global Crisis. Yelda Yücel 14 June 2009 Nicosia
 Turkey and the Emerging Market Economies during the Global Crisis Yelda Yücel 14 June 2009 Nicosia Green Shoots in The Global Economy? There are more signs of easing of the global recession in the second
Slovenia Country Profile
 Slovenia Country Profile EU Tax Centre July 2015 Key tax factors for efficient cross-border business and investment involving Slovenia EU Member State Double Tax Treaties With: Albania Armenia Austria
New data from the Enterprise Surveys indicate that senior managers in Georgian firms devote only 2 percent of
 Public Disclosure Authorized Public Disclosure Authorized Public Disclosure Authorized Public Disclosure Authorized WORLD BANK GROUP COUNTRY NOTE NO. 6 29 ENTERPRISE SURVEYS COUNTRY NOTE SERIES Running
Themes Income and wages in Europe Wages, productivity and the wage share Working poverty and minimum wage The gender pay gap
 5. W A G E D E V E L O P M E N T S At the ETUC Congress in Seville in 27, wage developments in Europe were among the most debated issues. One of the key problems highlighted in this respect was the need
Running a Business in Belarus
 Enterprise Surveys Country Note Series Belarus World Bank Group Country note no. 2 rev. 7/211 Running a Business in Belarus N ew data from Enterprise Surveys indicate that tax reforms undertaken by the
Emerging Markets Debt: Outlook for the Asset Class
 Emerging Markets Debt: Outlook for the Asset Class By Steffen Reichold Emerging Markets Economist May 2, 211 Emerging market debt has been one of the best performing asset classes in recent years due to
Austria s economy set to grow by close to 3% in 2018
 Austria s economy set to grow by close to 3% in 218 Gerhard Fenz, Friedrich Fritzer, Fabio Rumler, Martin Schneider 1 Economic growth in Austria peaked at the end of 217. The first half of 218 saw a gradual
2 Macroeconomic Scenario
 The macroeconomic scenario was conceived as realistic and conservative with an effort to balance out the positive and negative risks of economic development..1 The World Economy and Technical Assumptions
EMPLOYMENT RATE IN EU-COUNTRIES 2000 Employed/Working age population (15-64 years)
") EMPLOYMENT RATE IN EU-COUNTRIES 2 Employed/Working age population (15-64 years EU-15 Denmark Netherlands Great Britain Sweden Portugal Finland Austria Germany Ireland Luxembourg France Belgium Greece Spain
EMPLOYMENT RATE IN EU-COUNTRIES 2 Employed/Working age population (15-64 years EU-15 Denmark Netherlands Great Britain Sweden Portugal Finland Austria Germany Ireland Luxembourg France Belgium Greece Spain
SECTION 2. MACROECONOMIC CHANNELS
 SECTION 2. MACROECONOMIC CHANNELS 2.1. Food and Energy Price Inflation 9. Food price inflation varies substantially among ECA countries with poorer countries tending to experience higher inflation rates.
Bojan Markovic EBRD. Forces Shaping the Future of Europe and Much of the World. Financial and macroeconomic challenges
 Bojan Markovic EBRD Forces Shaping the Future of Europe and Much of the World Financial and macroeconomic challenges ICTF Annual Global Trade Symposium Ft Lauderdale, 14 November 2016 1 Outline Longer
THE NEED TO ADDRESS FINANCIAL MARKETS DEVELOPMENT IN THE REGION
 SOUTH CAUCASUS AND UKRAINE INITIATIVE THE NEED TO ADDRESS FINANCIAL MARKETS DEVELOPMENT IN THE REGION Working Group on Financial Markets Development and Impact of Central Banks 17 November 2009 Warsaw,