II. Labour Demand. 3. Effect of Minimum Wages on Employment. 1. Overview: Perfect Competition vs. Monopsony. 2. DID Estimates
|
|
|
- Harvey Russell
- 6 years ago
- Views:
Transcription
1 II. Labour Demand 3. Effect of Minimum Wages on Employment. Overview: Perfect Competition vs. Monopsony 2. DID Estimates 3. Time-Series/Cross-Jurisdictional Studies (not covered, to be discussed in the wage inequality section)
2 3.. Overview The textbook model, due to Stigler (946), of the impact of minimum wages applies to a market for homogeneous workers, which coincides with the entire labour market. Assume that this competitive labour market is initially at the equilibrium ( w *, E * ). * When the minimum wage is set at w w above the equilibrium wage, firms move up the demand curve and employment falls to E. * As a result of this wage floor, some workers ( E E ) are displaced from their current jobs and become unemployed. The assumption here is that in the short-run, it may be difficulty for firms to substitute away from the higher priced labour that receives the minimum wage. In the long run, the minimum wage increase should induce firms to substitute away from minimum wage workers into using more of other inputs including capital and even higher priced labour that does not receive the minimum wage increase.
3 Source: Borjas (996)
4 For example: self-service gasoline stations with credit card payment systems have substituted away from low-wage attendants who pump gas. Why then introduce a minimum wage in the first place if unemployment increase? It is possible that total worker earnings increase: w E w E. If proportional increase in wages is larger than (induced) proportional decline in employment, then the wage bill will increase, even if employment falls. In addition, the higher wage encourages additional persons to enter the labour market. * If ( E S E ) additional workers enter the labour market, but cannot find jobs at the minimum wage, this creates more unemployment ( E S E ) than is caused by the workers initial displacement. More generally, the unemployment rate is larger the more elastic the demand * * ( E E ) and supply ( E S E ) curves and the higher the minimum wage.
5 g Source: Factsheet on Minimum Wage, Statistics Canada, 25. Minimum wage Total employees Total Incidence % Both Sexes 5 and over 3, to 24 2, to to 24, and over, to 34 3, to 44 3, to 54 3, and over, Men 5 and over 6, to 24, to to and over 5, to 34, to 44, to 54, and over Women 5 and over 6, to 24, to to and over 5, to 34, to 44, to 54, and over Source: Labour Force Survey, 24
6 Source: Factsheet on Minimum Wage, Statistics Canada, 25. Where do they work? Minimum wage Total employees Total Incidence % Industry 3, Goods-producing 3, Agriculture Forestry, fishing, mining, oil and gas Utilities 32.8 F F Construction Manufacturing 2, Service-producing, Trade 2, Transportation and warehousing Finance, insurance, real estate and leasing Professional, scientific and technical Management, administrative and other support Education Health care and social assistance, Information, culture and recreation Accommodation and food Public administration Other services Source: Labour Force Survey, 24
7 Minimum Wages in Canada Figure 6c: Nominal Minimum Wage in the Four Largest Provinces Quebec Alberta Ontario British Columbia Appendix Figure a: Real Value of the Minimum Wage ($22), larger Provinces Quebec Alberta Ontario British Columbia Source: Lemieux (2), Fortin and Lemieux (24) For the other provinces and recent increases, see
8
9 Figure A: The Ratio of Minimum Wages to Average Wages, Canada and the United States, Canada United States Source: Lemieux (2)
10 Figure a. Density of U.S. Women s Wages and Minimum Wages (Vertical Lines) ln(2) ln(5) ln() ln(25) ln(2) ln(5) ln() ln(25) ln(2) ln(5) ln() ln(25) ln(2) ln(5) ln() ln(25) ln(2) ln(5) ln() ln(25) ln(2) ln(5) ln() ln(25) ln(2) ln(5) ln() ln(25) ln(2) ln(5) ln() ln(25) ln(2) ln(5) ln() ln(25) ln(2) ln(5) ln() ln(25) ln(2) ln(5) ln() ln(25) ln(2) ln(5) ln() ln(25) ln(2) ln(5) ln() ln(25) ln(2) ln(5) ln() ln(25) ln(2) ln(5) ln() ln(25) ln(2) ln(5) ln() ln(25) ln(2) ln(5) ln() ln(25) ln(2) ln(5) ln() ln(25) ln(2) ln(5) ln() ln(25) ln(2) ln(5) ln() ln(25) Source: DiNardo, Fortin and Lemieux (996)
11 Min. wage 988 Min. wage ln(2) ln(5) ln() ln(5) ln(25) Log Wage ($979) Figure 2b. Density of Women's Real Wages in 979 and 988 Source: DiNardo, Fortin and Lemieux (996)
12 There are many reasons to believe that the real world does not conform to the textbook model. o Incomplete coverage (including informal sector) o Monopsony o Offsetting factors in the employment of low wage workers Fringe benefits, working conditions and training Changes in hours of work, e.g. tighter management of offered hours Train or upgrade existing personnel, i.e. increase their productivity Replace existing personnel by more productive workers drawn into the labour market by the higher wages o Minimum wage increases are often an endogenous response to labour market conditions in low-wage sectors as shown by reluctance to raise minimum wages when low-wage employment is already under jeopardy. o Fairness and spill-over issues o Aggregate demand and multiplier effects
13 The impact of minimum wages also depends on the extent of the coverage of the minimum wage. If there is a sizeable informal employment sector (as in many Latin American countries, or with illegal immigrants in the United States), there might be many employers who do not comply with minimum wage laws and the adverse employment effects of minimum wages will be moderated by less-than-universal coverage. * Assume again that the equilibrium wage is w, once a minimum wage w is imposed in the covered sector, ( E C E ) workers are displaced from the covered sector. Some of these displaced workers might move to the uncovered sector, shifting the ' supply curve in the uncovered sector to S U. As a result the uncovered sector wage declines and the number of workers employed in the uncovered sector increases ' from E to E U. U Alternatively, some workers from the uncovered sector may decide to move to covered sector, perhaps as unemployed workers for a while. Migration between the sectors would continue as long as workers expected one of the sectors to offer a higher wage.
14 Source: Borjas (996)
15 Another important model that does not predict adverse employment effects of minimum wages is the case of a non-discriminating monopsonist. an employer whose employment decisions affect the wage rate paid. The non-discriminating monopsonist pays the same wage to all its workers, regardless of the worker s reservation wage. This contrasts with the case of the discriminating monopsonist who can pay each worker her/his reservation wage. the firm s own labor demand changes the market wage. The monopsonist maximize π(l) = pf(l) W(L)L where F L >, F LL <, W L > W(L) is the wage necessary to call forth L workers. So that the FOC condition is pf L (L) = W(L) W L (L)L VPM L (L) = MC L (L) The labour supply curve for a monopolist is upward sloping W L >, whereas in the competitive market W L =. To get one more worker, the monopolist must raise the wage by a small amount.
16 Assuming that all workers receive the same pay (i.e., the late-comers don t get paid more), then the marginal cost of the next worker is not simply her wage but the wage increase given to all of the other ( infra-marginal ) workers. Hence, the marginal labor cost curve MC L (L) for this firm is even more upward sloping. The additional cost for each worker is given by the higher wage of that worker and by the increase in wage given to the entire pool of workers Rearranging the FOC, Given that < W(L) = pf L (L) W L (L)L = pf L(L) W(L) W L L W = VPM L W(L) η WM = VPM L η +η + = η + η VPM L η <, the wage chosen by the monopsonist is lower than the competitive wage the more elastic labour supply is. Thus the number of workers L M he employs is determined by the intersection of his marginal cost curve MC L and his demand curve VPM L, but the wage he pays W M is determined by the supply curve.
17 Source: Borjas (996)
18 The non-discriminating monopsonist employs fewer workers than the competitive level (L M < L ) and pays them less (W M < W ). Thus the imposition of a minimum wage on a monopsonistic market can increase both wages and employment. Suppose that the non-discriminating monopsonist is in equilibrium at point A, hiring L M at a wage of W M and suppose that the government imposes a wage floor of W. Now the monopsonist can hire up to L workers at the minimum wage (these workers are actually willing to work for less than the minimum wage). But if the monopsonist want to hire more workers (and pay all workers the same wage), then the marginal cost reverts back to its old level. This suggests that increasing the minimum wage up to W would do even better at increasing employment. However, setting the minimum wage above point A will raise wages but reduce employment.
19 Source: Borjas (996)
20 However, setting the minimum wage above point A will raise wages but reduce employment. A well-designed minimum wage could therefore eliminate the market power of monopsonists and prevent the exploitation of workers. Where could we expect to find a monopsony? o Company towns o If skills are very specific, e.g. IBM mainframe repair technicians o Captive labour markets, O.R. nurses in towns with single hospital, illegal immigrants in some small labour markets. o Fast food restaurants located in nearby towns in NJ and PA? The case of fast-food establishments (Card and Krueger, 994) increasing their employment following the 992 increase in the minimum wage has been interpreted as evidence that the fast-food industry is a monopsony in terms of employing unskilled teenage workers. Although no direct evidence of supply constraints has been found.
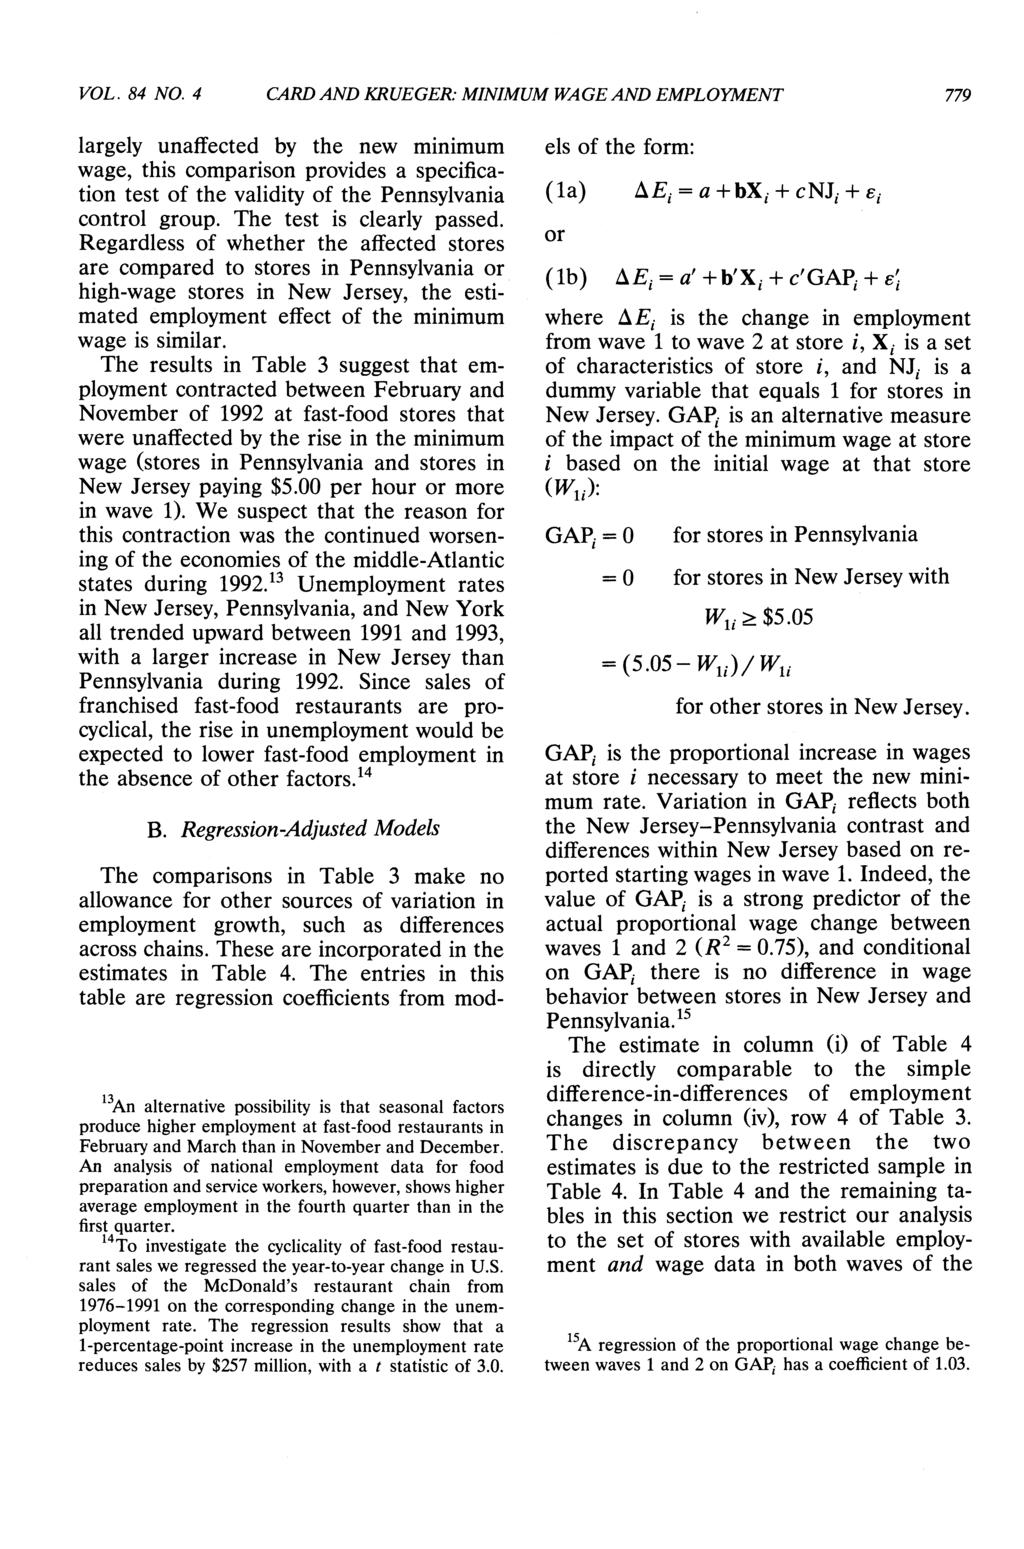
21 3.3. DID Estimates For the minimum wage to have any adverse employment effects, it needs to be above the equilibrium wage. So the level of the minimum wage with respect the average wage is crucial to predict any adverse impact. Since this is likely to be the case only for low skilled workers, empirical studies of the impact of the minimum wage have focused on teens and young workers, and more recently married women. Over the 95s, 6s and 7s, the consensus, based mainly on time series studies was that a % increase in the minimum wage led to a % - 3% reduction in employment of teens. The later studies in Table 5.3 also generally found mild negative disemployment effects of the minimum wage. But the landmark study of Card and Krueger (994) found positive employment effects of increases in the minimum wage, focusing on minimum wage workers. This paper is a widely cited study of the impact of the minimum wage on employment levels.

22 Source: Hammermesh (993)
23 This study created huge controversy among economists and arguably caused millions of workers to get a raise from the Clinton administration in 995. The quasi-experiment: o April, 992: in New Jersey the minimum wage rose from $4 to $5.5 per hour (this is a sizable increase) o Eastern Pennsylvania (bordering NJ) didn t raise the minimum wage. Maintained the Federal minimum wage of $4 per hour. Card and Krueger collected data on employment, starting wages, prices, and other store characteristics for 4 fast-food restaurants in New Jersey and Pennsylvania by phoning managers and assistant managers a few months before and after the change in the minimum wage. The timing of the experiment is actually the following: o Before: Feb-Mar 992 o After: Nov-Dec 992
24
25 4 THE AMERICAN ECONOMIC REVIEW DECEMBER 2 {_ Original 7 Countes Additional 7 Counties Nuriber of Restaurants in Original Survey Niles FIGURE. AREAS OF NEW JERSEY AND PENNSYLVANIA COVERED BY ORIGINAL SURVEY AND BLS DATA
26
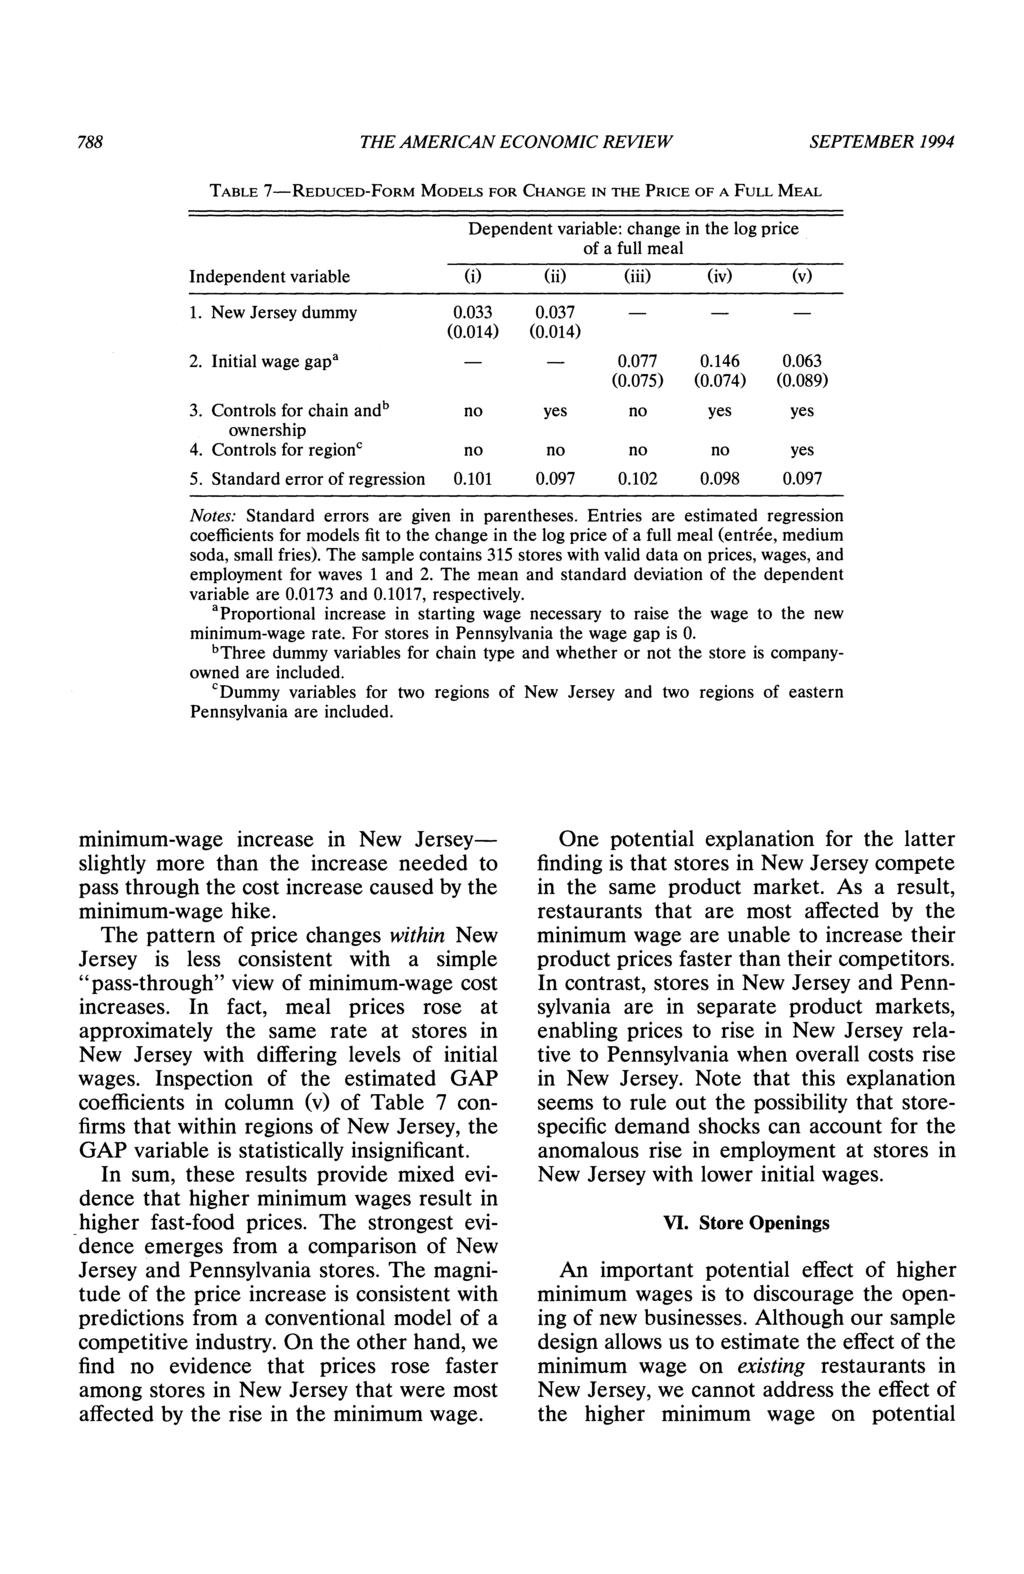
27 The setup: Before After Δ ) NJ Y n,b Y n,a ΔY n 2) PA Y p,b Y p,a ΔY p DD: T = ΔY n ΔY p Table 3 in the paper shows "Per store employment" Before After Δ ) NJ ΔY n = +9 2) PA ΔY p = 2.6 DD: T = ΔY n ΔY p = 9 ( 2.6) = 2.76 So, the basic result, with s.e.=.36 is statistically significant at the 5% level, corresponds to a whooping 3% increase in employment in NJ relative to PA. The paper contains many more tests and reduced form estimation of the DD. It also started one of the great data war in the labour literature.
28
29
30
31
32
33
34 Neumark and Wascher (2) argue that Card and Krueger s results are an artifact of the survey data they used. o They collect payroll data from fast-food restaurants in the same states for the same time-periods and found that the survey data exhibited much more employment variability than did the payroll data (causing them to question the accuracy of the survey data). o They find that the payroll data imply that a % increase in the minimum wage would reduce employment by -2% which is almost exactly equal to the earlier consensus estimates of - 3%, although their results are often statistically insignificant. Card and Krueger (2) reply by collecting another set of data which they think is more representative of the fast-food industry in the two states than the Neumark- Wascher-data. The new Card and Krueger (2) estimates moved away from their earlier ones of often finding statistically significant positive employment effects, closer to ones that find no employment effect, and this seems their preferred interpretation.
35 Beyond data issues, there are alternative interpretations of the Card-Krueger results. Monopsony 2. Motivational effects 3. Confounding variables (shocks to PA that are not accounted for in the test) 4. Wrong venue (why did they study fast food?) Overall, it is extremely difficult to summarize the empirical evidence on the employment effect of minimum wages. o The results vary by methodology, specification and group being examined o There is no longer a consensus on the impact o The earlier consensus range on the effect of a % increase in the minimum wage has likely widened to a more fragile consensus range of 3%. o A positive employment impact is unlikely in the aggregate, albeit possible for some establishments.
36 Basic readings: Card, David and A. B. Krueger, Minimum Wages and Employment: A Case Study of the Fast-Food Industry in New Jersey and Pennsylvania, American Economic Review, Vol. 84 (September 994)
II. Labour Demand. 2. Effect of Minimum Wages on Employment. 1. Overview: Perfect Competition vs. Monopsony. 2. DID Estimates
 II. Labour Demand 2. Effect of Minimum Wages on Employment. Overview: Perfect Competition vs. Monopsony 2. DID Estimates 3. Time-Series/Cross-Jurisdictional Studies 3.. Overview The textbook model, due
October 2016 Aboriginal Population Off-Reserve Package
 Labour Force Statistics Aboriginal Population Off-Reserve Package Package Includes: - Information for all Aboriginal people, First Nations and Métis - Working age population, labour force, employment,
August 2015 Aboriginal Population Off-Reserve Package
 Labour Force Statistics Aboriginal Population Off-Reserve Package Package Includes: - Information for all Aboriginal people, First Nations and Métis - Working age population, labour force, employment,
December 2017 Alberta Indigenous People Living Off-Reserve Package
 Labour Force Statistics Alberta Indigenous People Living Off-Reserve Package Package Includes: - Information for all Indigenous people, First Nations and Métis - Working age population, labour force, employment,
January 2018 Alberta Indigenous People Living Off-Reserve Package
 Labour Force Statistics Alberta Indigenous People Living Off-Reserve Package Package Includes: - Information for all Indigenous people, First Nations and Métis - Working age population, labour force, employment,
November 2017 Alberta Indigenous People Living Off-Reserve Package
 Labour Force Statistics Alberta Indigenous People Living Off-Reserve Package Package Includes: - Information for all Indigenous people, First Nations and Métis - Working age population, labour force, employment,
April 2017 Alberta Indigenous People Living Off-Reserve Package
 Labour Force Statistics Alberta Indigenous People Living Off-Reserve Package Package Includes: - Information for all Indigenous people, First Nations and Métis - Working age population, labour force, employment,
Does Minimum Wage Lower Employment for Teen Workers? Kevin Edwards. Abstract
 Does Minimum Wage Lower Employment for Teen Workers? Kevin Edwards Abstract This paper will look at the effect that the state and federal minimum wage increases between 2006 and 2010 had on the employment
2016 Alberta Labour Force Profiles Women
 2016 Alberta Labour Force Profiles Alberta s Highlights Population Statistics Labour Force Statistics lowest percentage of women in the working age population 1. 51.7% NS 2. 51.5% PEI 9. 49.6% SK 10. 49.3%
Background. I Established in US in 1938 THE MINIMUM WAGE
 Background Established in US in 1938 THE MNMUM WAGE THE MNMUM WAGE Background Established in US in 1938 t is illegal for rms in covered sectors to pay less than the minimum wage (historic graph) THE MNMUM
Highlights. For the purpose of this profile, the population is defined as women 15+ years.
 A L B E R T A L A B O U R F O R C E P R O F I L ES Women 2014 Highlights For the purpose of this profile, the population is defined as women 15+. Working Age Population of Women in Alberta The number of
Effect of Minimum Wage on Household and Education
 1 Effect of Minimum Wage on Household and Education 1. Research Question I am planning to investigate the potential effect of minimum wage policy on education, particularly through the perspective of household.
newstats 2016 NWT Annual Labour Force Activity NWT Bureau of Statistics Overview
 newstats NWT Bureau of Statistics Released: March 27, 2017 2016 NWT Annual Labour Force Activity Overview The Labour Force Survey is a source of monthly estimates of employment and unemployment. On a yearly
Quebec-Ontario: Demographics are shaping the labour market
 MAY 5, 2017 ECONOMIC NEWS -: Demographics are shaping the labour market HIGHLIGHTS recorded a loss of 3,800 jobs in April, after an increase of 2,400 in the previous month. The unemployment rate climbed
Labor Demand. Labor Demand. Output. The marginal product of labor. Production Function: q=f(e,k)
") Labor Demand A firm s decision about how much labor to use in production is driven by the firm s desire to maximize profits. Labor Demand Firm s thinking about whether to hire a worker ach worker produces
Labor Demand A firm s decision about how much labor to use in production is driven by the firm s desire to maximize profits. Labor Demand Firm s thinking about whether to hire a worker ach worker produces
(III) Debating the Minimum Wage. Bocconi University,
 Debating the Minimum Wage. Bocconi University,") (III) Debating the Minimum Wage Bocconi University, 2017-18 Outline Definition and cross-country comparisons Theory Competitive labor market Dual labor market Noncompetitive labor market Empirical evidence
(III) Debating the Minimum Wage Bocconi University, 2017-18 Outline Definition and cross-country comparisons Theory Competitive labor market Dual labor market Noncompetitive labor market Empirical evidence
Policy Brief. Canada s Labour Market Puts in a Strong Performance in The Canadian Chamber is committed to fostering.
 Canada s Labour Market Puts in a Strong Performance in 2012 Introduction Policy Brief Economic Policy Series February 2013 Canada s labour market ended 2012 on a high note with almost 100,000 net new jobs
Alberta Labour Force Profiles
 Alberta Labour Force Profiles 2011 Highlights For the purpose of this profile, youth are defined as persons aged 15 to 24 years. 1. Alberta Population Statistics Among the provinces, Alberta had the third
Class Notes. Intermediate Macroeconomics. Li Gan. Lecture 5: Unemployment Rate. Basic facts about unemployment:
 Class Notes Intermediate Macroeconomics Li Gan Lecture 5: Unemployment Rate Basic facts about unemployment: (1) Unemployment varies a lot over time. (2) More recently, (2) Current status: 1 08/09 06/10
The Effect of the Minimum Wage on the Employment Rate in Canada, by Eliana Shumakova ( ) Major Paper presented to the
 Major Paper presented to the") The Effect of the Minimum Wage on the Employment Rate in Canada, 1979 2016 by Eliana Shumakova (8494088) Major Paper presented to the Department of Economics of the University of Ottawa in partial fulfillment
The Effect of the Minimum Wage on the Employment Rate in Canada, 1979 2016 by Eliana Shumakova (8494088) Major Paper presented to the Department of Economics of the University of Ottawa in partial fulfillment
The Minimum Wage, Turnover, and the Shape of the Wage Distribution
 The Minimum Wage, Turnover, and the Shape of the Wage Distribution Pierre Brochu David A. Green Thomas Lemieux James Townsend January 6 2018 Introduction In recent years, the minimum policy has played
Minimum Wage as a Poverty Reducing Measure
 Illinois State University ISU ReD: Research and edata Master's Theses - Economics Economics 5-2007 Minimum Wage as a Poverty Reducing Measure Kevin Souza Illinois State University Follow this and additional
2017 Alberta Labour Force Profiles Youth
 2017 Alberta Labour Force Profiles Youth Highlights Population Statistics Labour Force Statistics 4 th highest proportion of youth in the working age population 1. 16.3% MB 2. 15.3% ON 2. 15.2% SK 4. 14.9%
Monthly Labour Force Survey Statistics December 2018
 800 Monthly Labour Force Survey Statistics CALGARY CMA Table 282-0135 Labour force survey estimates (LFS), by census metropolitan area based on 2011 census boundaries, 3-month moving average, seasonally
Monthly Labour Force Survey Statistics November 2018
 800 Monthly Labour Force Survey Statistics CALGARY CMA Table 282-0135 Labour force survey estimates (LFS), by census metropolitan area based on 2011 census boundaries, 3-month moving average, seasonally
 Estimated total job losses from 10% minimum wage increase across all provinces Upper Bound 321,300 Lower Bound 92,300 Source: CFIB calculations from Statistic Canada s 2009 Labour Force Survey data. iv
Research Team: - Small Business Consulting Services. Research Oversight: - Dr. Bahram Dadgostar - Dr. Camillo Lento
 Research Team: - Small Business Consulting Services Research Oversight: - Dr. Bahram Dadgostar - Dr. Camillo Lento Background..... 3 Executive Summary.... 7 Potential impact on employment levels..... 10
Quebec and Ontario: Employment Rises in March While the Unemployment Rate Treads Water
 APRIL 6, 218 ECONOMIC NEWS and : Employment Rises in March While the Unemployment Rate Treads Water HIGHLIGHTS ff Both and boosted their employment ranks in March, with respective gains of 16, and 1,6.
The Economics of Imperfect Labor Markets. Chapter 2. Minimum Wages
 1 / 27 The Economics of Imperfect Labor Markets Tito Boeri September 2010 Tito Boeri and Jan van Ours (2008) The Economics of Imperfect Labor Markets Princeton University Press Chapter 2. Minimum Wages
LABOUR FORCE STATISTICS REPORT APRIL 2018
 LABOUR FORCE STATISTICS REPORT APRIL 2018 MANITOBA BUREAU OF STATISTICS MAY 11, 2018 CHARTS 1. UNEMPLOYMENT RATES, CANADA AND PROVINCES 2. YOUTH UNEMPLOYMENT RATES, CANADA AND PROVINCES 3. TOTAL EMPLOYMENT,
Employment Effects of a Minimum Wage: A Density Discontinuity Design Revisited* Joseph J. Doyle Jr. MIT Sloan School of Management.
 Employment Effects of a Minimum Wage: A Density Discontinuity Design Revisited* Joseph J. Doyle Jr. MIT Sloan School of Management April 005 Abstract: In a classic paper, Meyer and Wise (983) estimated
Athabasca Grande Prairie. Banff - Jasper - Rocky Mountain House. Edmonton. Calgary
 Athabasca Grande Prairie Wood Buffalo - Cold Lake Banff - Jasper - Rocky Mountain House Edmonton Calgary Lethbridge - Medicine Hat Highlights I. Alberta: Overview Alberta had the lowest unemployment rate
Oren M. Levin-Waldman and George W. McCarthy
 Policy Note 1998/3 Small Business and the Minimum Wage Oren M. Levin-Waldman and George W. McCarthy Do small businesses change their hiring and employment practices in response to an increase in the minimum
2012 Annual Alberta Labour Market Review
 2012 Annual Alberta Labour Market Review Employment. Unemployment. Economic Regions. Migration Aboriginal People. Industries. Occupations. Education. Demographics Employment Alberta has the highest employment
Public Affairs 856 Trade, Competition, and Governance in a Global Economy Lecture 7-9 2/8-15/2016
 Public Affairs 856 Trade, Competition, and Governance in a Global Economy Lecture 7-9 2/8-15/2016 Instructor: Prof. Menzie Chinn UW Madison Spring 2017 Increasing Returns to Scale and Monopolistic Competition
Alberta Self-Employment Profile
 Alberta Self-Employment Profile 2016 Overview Self-employment represents the entrepreneurial spirit of Alberta. This spirit is at the heart of Alberta s vibrant economy. By creating employment, producing
Practice Problem Set 6 Solutions
 Economics 370 Professor H.J. Schuetze Practice Problem Set 6 Solutions Read each question in its entirety before beginning, then answer the question as clearly and concisely as possible. Make sure to answer
2017 Annual Alberta Labour Market Review
 2017 Annual Alberta Labour Market Review Employment. Unemployment. Economic Regions Migration. Indigenous People. Industries Occupations. Education. Demographics Employment Employment grew by 1. in Alberta
LABOUR FORCE STATISTICS REPORT MAY 2018
 LABOUR FORCE STATISTICS REPORT MAY 2018 MANITOBA BUREAU OF STATISTICS JUNE 8, 2018 CHARTS 1. UNEMPLOYMENT RATES, CANADA AND PROVINCES 2. YOUTH UNEMPLOYMENT RATES, CANADA AND PROVINCES 3. TOTAL EMPLOYMENT,
Final Term Papers. Fall 2009 (Session 03a) ECO401. (Group is not responsible for any solved content) Subscribe to VU SMS Alert Service
 ECO401. (Group is not responsible for any solved content) Subscribe to VU SMS Alert Service") Fall 2009 (Session 03a) ECO401 (Group is not responsible for any solved content) Subscribe to VU SMS Alert Service To Join Simply send following detail to bilal.zaheem@gmail.com Full Name Master Program
Fall 2009 (Session 03a) ECO401 (Group is not responsible for any solved content) Subscribe to VU SMS Alert Service To Join Simply send following detail to bilal.zaheem@gmail.com Full Name Master Program
Estimating the Effects of Minimum Wage
 Estimating the Effects of Minimum Wage on Employment and Inequality: Evidence from Taiwan Lu, Chyi-Horng Economics, NTU 2018.6.14 Lu, Chyi-Horng (Economics, NTU) Estimating the Effects of Minimum Wage
Provincial and National Employment, Alberta and Canada Employment Rates 1, % 62.7% 62.7% 63.0% 63.5%
 Employment ALBERTA S HOT ECONOMY CONTINUES TO PRODUCE HIGH EMPLOYMENT GROWTH IN 2007 The number of employed Albertans in 2007 increased by 88,775, higher than the 2006 growth of 86,240. The economy also
GOAL 0: GDP GROWTH. By 2028, New Brunswick will experience an upward trend that returns its GDP growth rate to 2008 levels. Status: NOT PROGRESSING
 1982 1983 1984 1985 1986 1987 1988 1989 1990 1991 1992 1993 1994 1995 1996 1997 1998 1999 2000 2001 2002 2003 2004 2005 2006 2007 2008 2009 2010 2011 2012 2013 2014 2015 2016 GOAL 0: GDP GROWTH By 2028,
Employment Stumbles in Quebec and Falls in Ontario in August
 SEPTEMBER 7, 218 ECONOMIC NEWS Employment Stumbles in and Falls in in August HIGHLIGHTS ff posted a loss of 8,1 jobs in August, following growth of 95,5 jobs during the two previous months. It was part-time
LABOUR FORCE STATISTICS REPORT OCTOBER 2018
 LABOUR FORCE STATISTICS REPORT OCTOBER 2018 MANITOBA BUREAU OF STATISTICS NOVEMBER 2, 2018 CHARTS 1. UNEMPLOYMENT RATES, CANADA AND PROVINCES 2. YOUTH UNEMPLOYMENT RATES, CANADA AND PROVINCES 3. TOTAL
Income Redistribution in Canada: Minimum Wages versus Other Policy Instruments
 Income Redistribution in Canada: Minimum Wages versus Other Policy Instruments by * ** Nicole M. Fortin and Thomas Lemieux April 1997, revised December 1998 * Département de sciences économiques and Centre
LABOUR FORCE STATISTICS REPORT AUGUST 2018
 LABOUR FORCE STATISTICS REPORT AUGUST 2018 MANITOBA BUREAU OF STATISTICS SEPTEMBER 7, 2018 CHARTS 1. UNEMPLOYMENT RATES, CANADA AND PROVINCES 2. YOUTH UNEMPLOYMENT RATES, CANADA AND PROVINCES 3. TOTAL
2017 Annual Alberta Regional Labour Market Review
 2017 Annual Alberta Regional Labour Market Review Wood Buffalo-Cold Lake. Lethbridge-Medicine Hat Banff-Jasper-Rocky Mountain House and Athabasca-Grande Prairie-Peace River Edmonton. Red Deer. Calgary.
Annual. Labour. Market. Alberta. Review
 2005 Annual Alberta Labour Market Review Employment Economic Regions Unemployment Migration Industries Occupations Wages Skill Shortages Education Hours Worked Demographics Aboriginal People EMPLOYMENT
The Minimum Wage Ain t What It Used to Be
 http://economix.blogs.nytimes.com/2013/12/09/the-minimum-wage-aint-what-it-used-to-be DECEMBER 9, 2013, 11:00 AM The Minimum Wage Ain t What It Used to Be By DAVID NEUMARK David Neumarkis professor of
The Effect of Subminimum Wage Introduction on Employment in Greece 1. Alexandros Karakitsios 2
 The Effect of Subminimum Wage Introduction on Employment in Greece 1 Alexandros Karakitsios 2 March 2016 Abstract In 2012, Greek government introduced a 22% cut in the minimum wage for all private sector
Chapter 6: Correcting Market Distortions: Shadow Prices Wages & Discount Rates
 Chapter 6: Correcting Market Distortions: Shadow Prices Wages & Discount Rates 1 - Observed market prices sometimes reflect true cost to society. In some circumstances they don t because there are distortions
Investing in Canada s Future. Prosperity: An Economic Opportunity. for Canadian Industries
 Investing in Canada s Future Prosperity: An Economic Opportunity for Canadian Industries PART II of Reconciliation: Growing Canada s Economy by $27.7 B Methods and Sources Paper Prepared for the National
Insolvency Statistics in Canada. September 2015
 Insolvency Statistics in Canada September 2015 List of Tables Table 1: Total Insolvencies... 1 Table 2: Insolvencies Filed by Consumers... 2 Table 3: Insolvencies Filed by Businesses... 3 Table 4: Insolvencies
Saskatchewan Labour Force Statistics
 Saskatchewan Labour Force Statistics April 2017 UNADJUSTED DATA According to the Statistics Canada Labour Force Survey during the week covering April 9 th to 15 th,, 2017, there were 560,100 persons employed
Models of Wage-setting.. January 15, 2010
 Models of Wage-setting.. Huw Dixon 200 Cardi January 5, 200 Models of Wage-setting. Importance of Unions in wage-bargaining: more important in EU than US. Several Models. In a unionised labour market,
Quebec and Ontario create jobs in May
 ECONOMIC NEWS and create jobs in May #1 BEST OVERALL FORECASTER - CANADA HIGHLIGHTS GRAPH ff created 14,9 new jobs in May. Job growth in and has been comparable for the past two years, despite the differences
FINAL EXAMINATION VERSION B
 William M. Boal Signature: Printed name: FINAL EXAMINATION VERSION B INSTRUCTIONS: This exam is closed-book, closed-notes. Simple calculators are permitted, but graphing calculators, calculators with alphabetical
Labour Market Bulletin
 Labour Market Bulletin Quebec October 2015 This Labour Market Bulletin provides an analysis of Labour Force Survey results for the province of Quebec and its regions. OVERVIEW In October 2015, employment
2008 ANNUAL ALBERTA LABOUR MARKET REVIEW
 ANNUAL ALBERTA LABOUR MARKET REVIEW employment unemployment economic regions migration aboriginal people industries occupations education demographics Employment and Immigration EMPLOYMENT Employment increased
Short- Term Employment Growth Forecast (as at February 19, 2015)
") Background According to Statistics Canada s Labour Force Survey records, employment conditions in Newfoundland and Labrador showed signs of weakening this past year. Having grown to a record level high
Background According to Statistics Canada s Labour Force Survey records, employment conditions in Newfoundland and Labrador showed signs of weakening this past year. Having grown to a record level high
Hector M. Vielma, Ph.D. Senior Economist Illinois Department of Revenue. Hans Zigmund, MA. Director of Economic Policy Illinois Governor s Office
 Hector M. Vielma, Ph.D. Senior Economist Illinois Department of Revenue Hans Zigmund, MA. Director of Economic Policy Illinois Governor s Office 2017 REMI Users Conference Charleston S.C. October 2017
Section I. Define or explain the following terms (3 points each) 1. t-statistic = 2. definition of the labor force participation rate =
 1. t-statistic = 2. definition of the labor force participation rate =") First Exam: Economics 463, Labor Economics Fall 2003 in R. Butler s section YOUR NAME: Section I (30 points) Questions 1-10 (3 points each) Section II (50 points) Questions 11-15 (10 points each) Section
First Exam: Economics 463, Labor Economics Fall 2003 in R. Butler s section YOUR NAME: Section I (30 points) Questions 1-10 (3 points each) Section II (50 points) Questions 11-15 (10 points each) Section
Effects of the Oregon Minimum Wage Increase
 Effects of the 1998-1999 Oregon Minimum Wage Increase David A. Macpherson Florida State University May 1998 PAGE 2 Executive Summary Based upon an analysis of Labor Department data, Dr. David Macpherson
Public Economics (ECON 131) Section #4: Labor Income Taxation
 Section #4: Labor Income Taxation") Public Economics (ECON 131) Section #4: Labor Income Taxation September 22 to 27, 2016 Contents 1 Implications of Tax Inefficiencies for Optimal Taxation 2 1.1 Key concepts..........................................
Public Economics (ECON 131) Section #4: Labor Income Taxation September 22 to 27, 2016 Contents 1 Implications of Tax Inefficiencies for Optimal Taxation 2 1.1 Key concepts..........................................
Census Research Paper Series
 2006 Census Research Paper Series #6 The Changing Industrial Structure of Northern Ontario by Chris Southcott, Ph.D. Lakehead University April, 2008 Prepared for the Local Boards of Northern Ontario Far
1. Unemployment rate
 1. Unemployment rate Important rates in an economy: interest rate, exchange rate, inflation rate, and unemployment rate. Employment = number of people having a job. Unemployment = number of people not
ECO361: LABOR ECONOMICS SECOND MIDTERM EXAMINATION. NOVEMBER 15, 2007 Prof. Bill Even DIRECTIONS.
 Name ECO361: LABOR ECONOMICS SECOND MIDTERM EXAMINATION NOVEMBER 15, 2007 Prof. Bill Even DIRECTIONS. The exam contains a mix of short answer and essay questions. Your answers to the 18 short answer portion
BUEC 280 LECTURE 6. Individual Labour Supply Continued
 BUEC 280 ECTURE 6 Individual abour Supply Continued ast day Defined budget constraint Defined optimal allocation of leisure and consumption Changes in non-labour income generate a pure income effect Change
The Federal Minimum Wage: The Effects of the Minimum Wage on the Youth Employment and School Enrollment
 University of Kentucky UKnowledge MPA/MPP Capstone Projects Martin School of Public Policy and Administration 2013 The Federal Minimum Wage: The Effects of the Minimum Wage on the Youth Employment and
U. S. Productivity Growth:
 Macro Lecture 12: Late 1990s, the 2000s, and Mortgages Productivity Growth: 1990-2004 Most economists expected the general decline in productivity growth 8 occurring during the 1950 s, 1960 s, 1970 s,
Wage discrimination and partial compliance with the minimum wage law. Abstract
 Wage discrimination and partial compliance with the minimum wage law Yang-Ming Chang Kansas State University Bhavneet Walia Kansas State University Abstract This paper presents a simple model to characterize
FINAL Exam: Economics 463, Labor Economics Fall 2003 in R. Butler s class YOUR NAME: Section I (60 points) Questions 1-20 (3 points each)
 Questions 1-20 (3 points each)") FINAL Exam: Economics 463, Labor Economics Fall 2003 in R. Butler s class YOUR NAME: Section I (60 points) Questions 1-20 (3 points each) Section II (20 points) Questions 21-24 (5 points each) Section
FINAL Exam: Economics 463, Labor Economics Fall 2003 in R. Butler s class YOUR NAME: Section I (60 points) Questions 1-20 (3 points each) Section II (20 points) Questions 21-24 (5 points each) Section
Economic Impact Analysis of Fort Steele National Heritage Town. Final Report. By:
 Economic Impact Analysis of Fort Steele National Heritage Town Final Report By: The Canadian Tourism Research Institute The Conference Board of Canada April 30, 2008 WHAT'S INSIDE This study reports on
Insolvency Statistics in Canada. April 2013
 Insolvency Statistics in Canada April 2013 List of Tables Table 1: Total Insolvencies... 1 Table 2: Insolvencies Filed by Consumers... 2 Table 3: Insolvencies Filed by Businesses... 3 Table 4: Insolvencies
Alberta Labour Market Outlook
 Labour Market Outlook Released March 2012 Factors Likely to Affect Alberta s Labour Market Global economic and financial uncertainty created by the Eurozone debt crisis Economic growth in emerging markets
4 managerial workers) face a risk well below the average. About half of all those below the minimum wage are either commerce insurance and finance wor
 face a risk well below the average. About half of all those below the minimum wage are either commerce insurance and finance wor") 4 managerial workers) face a risk well below the average. About half of all those below the minimum wage are either commerce insurance and finance workers, or service workers two categories holding less
4 managerial workers) face a risk well below the average. About half of all those below the minimum wage are either commerce insurance and finance workers, or service workers two categories holding less
MULTIPLE CHOICE. Choose the one alternative that best completes the statement or answers the question.
 Econ 105 Study Questions #2: The AD-AS model and Money and Banking From the Kennedy Text: Chapter 5 pp 95-96 Media Ex. #3, #5, #7 Chapter 6 pp 118 N1, N2, N3 Chapter 8 pp140-41 Media Ex. #2, #3, #7, #11,
Annual Alberta Labour Market Review
 06 Annual Alberta Labour Market Review Employment Unemployment EconomicRegions Migration Industries Wages Occupations Education HoursWorked UnionCoverage Demographics AboriginalPeople Employment ALBERTA
Changes in workers wealth (from taxes, government services, or supply shocks) affect the labor supply curve by the income effect.
 affect the labor supply curve by the income effect.") Macroeconomics Module 11: Practice Problems on unemployment The practice problems on labor discuss the variables affecting change the labor supply curve, the quantity of labor supplied, the real wage rate,
Macroeconomics Module 11: Practice Problems on unemployment The practice problems on labor discuss the variables affecting change the labor supply curve, the quantity of labor supplied, the real wage rate,
Labour Force Statistics for the 10 largest communities in Nunavut
 Nunavutt Bureau of Sttattiisttiics Labour Force Statistics for the largest communities in Nunavut Labour Force Statistics at a glance month moving average ending in July : Participation :.% Employment
See Barro, Macroeconomics, Chapter 13, Taxes, page 247, column 1 and top of column 2
 Macro module 18: Taxes: practice problems (The attached PDF file has better formatting.) This posting gives sample final exam problems. Other topics from the textbook are asked as well; these problems
ALBERTA PROFILE: YOUTH
 ALBERTA PROFILE: YOUTH IN THE LABOUR FORCE Prepared By:, Data Development and Evaluation Released: June 2003 Highlights Statistics Canada defines youth as those people between the ages of 15-24 years.
Labour Market Bulletin
 Labour Market Bulletin Quebec September 2017 This Labour Market Bulletin provides an analysis of Labour Force Survey results for the province of Quebec and its regions. OVERVIEW The latest estimates of
MINIMUM WAGE CHAPTER OBJECTIVES CHAPTER OUTLINE CHAPTER OBJECTIVES. When you come to the end of this
 MINIMUM WAGE CHAPTER OBJECTIVES When you come to the end of this chapter you will understand what a labor market is, what a minimum wage is, why it has come about, how it alters the outcome of a labor
The Current and Future Contribution of the Aboriginal Community to the Economy of Saskatchewan
 1 The Current and Future Contribution of the Aboriginal Community to the Economy of Saskatchewan Andrew Sharpe, Executive Director Centre for the Study of Living Standards Saskatchewan Association of Health
Economics 201 Fall 2010
 Economics 201 Fall 2010 Final Exam Solutions Part A. (About 30 minutes) Fill in the blank with the best word or phrase (or circle the appropriate bracketed choice). You may give a one- or two-sentence
MINIMUM WAGE INCREASE COULD HELP CLOSE TO HALF A MILLION LOW-WAGE WORKERS Adults, Full-Time Workers Comprise Majority of Those Affected
 MINIMUM WAGE INCREASE COULD HELP CLOSE TO HALF A MILLION LOW-WAGE WORKERS Adults, Full-Time Workers Comprise Majority of Those Affected March 20, 2006 A new analysis of Current Population Survey data by
Pace of hiring slows in Quebec and Ontario in February
 MARCH 10, 2017 ECONOMIC NEWS Pace of hiring slows in and in February HIGHLIGHTS According to the labour force survey, employment in declined in February (-11,100). This decline puts the brakes on seven
Labour Market Bulletin
 Labour Market Bulletin Newfoundland and Labrador 2016 This Labour Market Bulletin provides an analysis of Labour Force Survey results for the province of Newfoundland and Labrador, including the regions
Economic Outlook
 2018 2019 Economic Outlook Published by: Department of Finance Province of New Brunswick P.O. Box 6000 Fredericton, New Brunswick E3B 5H1 Canada Internet: www.gnb.ca/finance Tuesday, January 30, 2018 Cover:
Labour Market Bulletin
 Labour Market Bulletin Quebec June 2016 This Labour Market Bulletin provides an analysis of Labour Force Survey results for the province of Quebec and its regions. OVERVIEW According to the latest estimates
Senior Managers Construction, Transportation, Production and Utilities (NOC 0016)
") Occupational Snapshot 2016-2025 Senior Managers Construction, Transportation, Production and Utilities (NOC 0016) The Asia Pacific Gateway Corridor (APGC) Senior Managers Construction, Transportation,
Occupational Snapshot 2016-2025 Senior Managers Construction, Transportation, Production and Utilities (NOC 0016) The Asia Pacific Gateway Corridor (APGC) Senior Managers Construction, Transportation,
ALBERTA PROFILE: YOUTH IN THE LABOUR FORCE
 ALBERTA PROFILE: YOUTH IN THE LABOUR FORCE Highlights Statistics Canada defines youth as those people between the ages of 15-24 years. 1 1. Youth Labour Force Statistics Over one quarter of Canada s increase
Solutions to PSet 5. October 6, More on the AS/AD Model
 Solutions to PSet 5 October 6, 207 More on the AS/AD Model. If there is a zero interest rate lower bound, is fiscal policy more or less effective than otherwise? Explain using the AS/AD model. Is the United
Nova Scotia Labour Market Review
 2005 Nova Scotia Labour Market Review 2005 Nova Scotia Labour Market Review b This publication is available online at labourmarketinfo.ednet.ns.ca. This material may be freely copied for educational purposes.
Objectives THE ECONOMY AT FULL EMPLOYMENT: THE CLASSICAL MODEL
 THE ECONOMY AT 8 FULL EMPLOYMENT: CHAPTER THE CLASSICAL MODEL Objectives After studying this chapter, you will able to Describe the relationship between the quantity of labor employed and real GDP Explain
ALBERTA LABOUR FORCE PROFILES Aboriginal People in the Labour Force Alberta Labour Force Profiles
 ALBERTA LABOUR FORCE PROFILES Aboriginal People in the Labour Force 2009 Alberta Labour Force Profiles Aboriginal People 2011 Highlights 1. Population of More than 60.0% of the working age population (WAP)
Macroeconomics I, UPF Professor Antonio Ciccone SOLUTIONS PROBLEM SET 1
 Macroeconomics I, UPF Professor Antonio Ciccone SOLUTIONS PROBLEM SET 1 1.1 (from Romer Advanced Macroeconomics Chapter 1) Basic properties of growth rates which will be used over and over again. Use the
CHAPTER 4: GROWTH, UNEMPLOYMENT, AND INFLATION
 CHAPTER 4: GROWTH, UNEMPLOYMENT, AND INFLATION CIA4U Unit 2 Macroeconomics: Economic Indicators Statistics Canada keeps track of the labour force through a monthly survey of about 58,000 households who