Athabasca Grande Prairie. Banff - Jasper - Rocky Mountain House. Edmonton. Calgary
|
|
|
- Ralf Logan
- 5 years ago
- Views:
Transcription
1
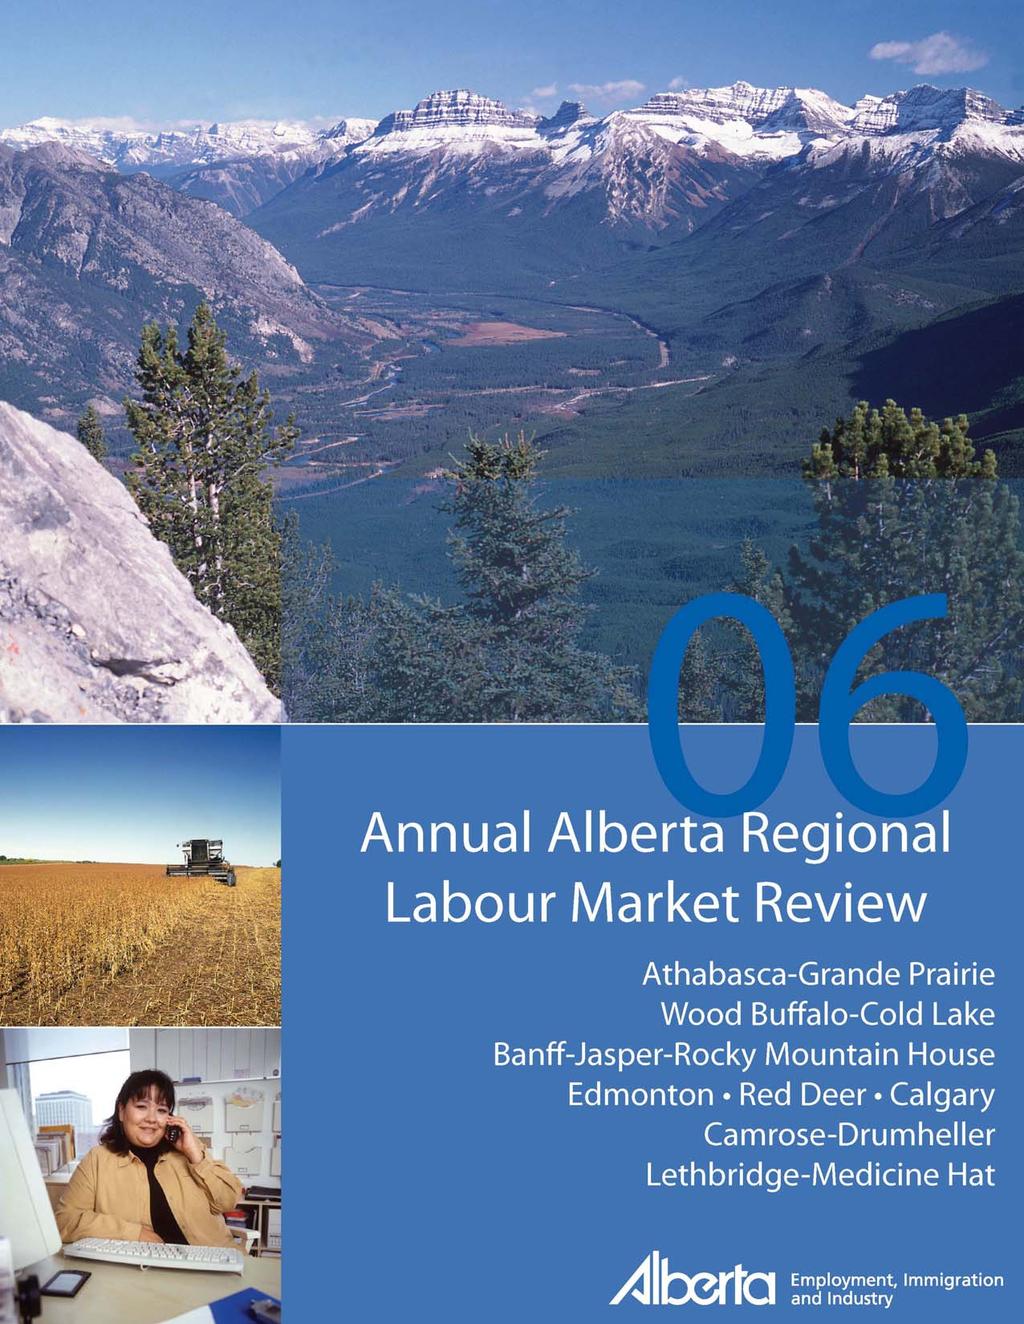
2 Athabasca Grande Prairie Wood Buffalo - Cold Lake Banff - Jasper - Rocky Mountain House Edmonton Calgary Lethbridge - Medicine Hat
3 Highlights I. Alberta: Overview Alberta had the lowest unemployment rate in Canada at 3.4%. Alberta experienced the highest participation rate, 73.4% among all provinces. Approximately 69% of Alberta s labour force lived in the Edmonton and Calgary regions. II. Wood Buffalo-Cold Lake Economic Region The employment rate increased by 0.5 percentage points, from 71.4% in 2005 to 71.9% in Ongoing oil sands projects aided employment growth in the Wood Buffalo-Cold Lake Region. The industry with the highest year-over-year increase in employment was Mining, Oil and Gas. III. Athabasca-Grande Prairie Economic Region In 2006, employment increased by 3.1%, an addition of 3,900 people. Increased drilling activities in the Athabasca-Grande Prairie Peace River Region resulted in employment growth. The industry with the highest year-over-year increase in employment was Professional, Scientific and Technical Services. IV. Edmonton Economic Region The unemployment rate decreased by 0.7 percentage points, from 4.5% in 2005 to 3.8% in The region as a major supply centre benefited from major projects in the Wood Buffalo-Cold Lake Region. The industry with the highest year-over-year increase in employment was Public Administration. V. Red Deer Economic Region The number of employed people in the Red Deer Region increased by 4.3%, from 93,600 in 2005 to 97,600 in Overall, employment in the Services-Producing industries increased by 3,100 compared to a year ago, while employment in the Goods-Producing industries increased by 900. The industry with the highest year-over-year increase in employment was Public Administration
4 Highlights VI. Banff-Jasper-Rocky Mountain House Economic Region The Banff-Jasper-Rocky Mountain House Region had the highest participation rate and employment rate in the province, at 77.1% and 75.2% respectively. Various construction projects, as well as growth in the tourism industry contributed to the region s economy. The industry with the highest year-over-year increase in employment was Professional, Scientific and Technical Services. VII. Calgary Economic Region In 2006, the region had the largest year-over-year increase in the number of employed people at 8.2%. A booming construction industry helped create employment, with strong demand in the housing and condo market. The industry with the highest year-over-year increase in employment was Forest, Fishing, Mining, Oil and Gas. VIII. Camrose-Drumheller Economic Region The Camrose-Drumheller Region had the lowest unemployment rate in the province at 2.8%. High construction activity and oil projects in the region contributed to increasing employment. The industries with the highest year-over-year increase in employment were Educational Services, and Health Care and Social Assistance. IX. Lethbridge-Medicine Hat Economic Region In 2006, the region had the second lowest unemployment rate in the province, after the Camrose-Drumheller Region at 3.0%. The re-opening of the United States border to Canadian cattle, as well as the booming Utilities and Construction industries, supplied employment for the region. The industry with the highest year-over-year increase in employment was Transportation and Warehousing
5 I. Alberta: Overview In 2006, Alberta had the highest participation rate (see glossary of definitions) in Canada at 73.4%, 6.2 percentage points higher than the national average. Alberta also had the highest employment rate at 70.8% and the lowest unemployment rate at 3.4%. Table 1 Labour Force Statistics, Canada and Provinces, 2006 Participation Rate (%) Employment Rate (%) Unemployment Rate (%) Canada Newfoundland and Labrador Prince Edward Island Nova Scotia New Brunswick Quebec Ontario Manitoba Saskatchewan Alberta British Columbia Alberta s labour force grew by 4.3% or 80,000 people between 2005 and The labour force in the Calgary Region had the largest growth rate in 2006, increasing by 7.4% or 50,200 people. In 2006, Lethbridge-Medicine Hat was the only region to experience a decline in the labour force, a drop of 0.9% or 1,300 people. During this period, 68.9% of Alberta s labour force lived in the Edmonton and Calgary regions. Chart 1a shows the change in labour force for Alberta s eight economic regions in 2005 and Chart 1a Labour Force for Alberta's Economic Regions, 2005 and Wood Buffalo-Cold Lake 61.7 Athabasca-Grande Prairie Edmonton Red Deer Banff-Jasper-Rocky Mountain House Calgary Camrose-Drumheller Lethbridge-Medicine Hat Labour Force (000s) - 4 -
6 In 2006, the number of people employed in Alberta was 1,870,700, an increase of 86,300 or 4.8% from the 2005 level. All of Alberta s economic regions experienced a growth in employment in 2006, with the exception of the Lethbridge-Medicine Hat Region. The Calgary Region had the largest employment growth rate in Alberta at 8.2%. Chart 1b displays the employment figures for Alberta s eight economic regions for 2005 and Chart 1b Employment for Alberta's Economic Regions, 2005 and 2006 Wood Buffalo-Cold Lake Athabasca-Grande Prairie Edmonton Red Deer Banff-Jasper-Rocky Mountain House Calgary Camrose-Drumheller Lethbridge-Medicine Hat Employment (000's) The number of unemployed people in Alberta declined by 8.6%, from 73,100 in 2005 to 66,800 in The 2006 unemployment statistics for the Banff-Jasper-Rocky Mountain House Region were not available, due to the Statistics Canada suppression rule.* In 2006, the Edmonton Region experienced the largest decrease in unemployed people, a reduction of 3,400 people to 23,300. Chart 1c displays the number of unemployed people for Alberta s eight economic regions for 2005 and Chart 1c Unemployment for Alberta's Economic Regions, 2005 and 2006 Wood Buffalo-Cold Lake Athabasca-Grande Prairie Edmonton Red Deer Banff-Jasper-Rocky Mountain House Calgary Camrose-Drumheller Lethbridge-Medicine Hat Unemployment (000s) * Note: Statistics Canada suppresses figures less than 1,
7 The provincial unemployment rate declined to 3.4% in 2006, down 0.5 percentage points from In 2006, the regional statistics for the Banff-Jasper-RMH Region were not available, due to the Statistics Canada suppression rule.* During this period, the Camrose-Drumheller Region had the lowest unemployment rate in the province at 2.8%, while the Wood Buffalo-Cold Lake Region had the highest unemployment rate at 4.4and experienced an increase in the unemployment rate of 0.8 percentage points. The Lethbridge-Medicine Hat Region experienced the greatest decline in its unemployment rate, decreasing 0.9 percentage points. The unemployment rates for Alberta s eight economic regions are displayed in Chart 1d. Chart 1d Unemployment Rates for Alberta's Economic Regions, and 2006 Wood Buffalo-Cold Lake Athabasca-Grande Prairie Praire Edmonton Red Deer Banff-Jasper-Rocky Mountain House 0.0% Banff-Jasper-Rocky Mountain House Calgary Camrose-Drumheller Lethbridge-Medicine Hat 4.4% 3.6% 3.4% 3.1% 3.8% 4.5% 3.8% 3.3% 3.2% 3.9% 2.8% 3.2% 3.0% 3.9% 0% 1% 1% 2% 2% 3% 3% 4% 4% 5% 5% Unemployment Rate (%) * Note: Statistics Canada suppresses figures less than 1,
8 II. Wood Buffalo-Cold Lake Economic Region: Employment and Unemployment Between 2005 and 2006, the Wood Buffalo-Cold Lake Region s labour force increased by 3,900 people. During this period, the participation rate for the region was 75.2%. The number of employed people in the region grew by 3,200, an increase of 5.4%. In 2006, oil sands projects offered continuing employment to the region. Construction to both highways 63 and 881 supplied hundreds of jobs, and provided safety for increased traffic into and out of the region. Table 2 22 Wood Buffalo-Cold Lake Economic Region Labour Force Statistics Change Working-Age Population (000 s) % Labour Force (000 s) % Employment (000 s) % Unemployment (000 s) % Unemployment Rate 3.6% 4.4% 0.8 Chart 2a displays the monthly unemployment rates for the region in 2005 and Overall, the annual unemployment rate increased 0.8 percentage points to 4.4% in The unemployment rate peaked in September at 5.3%, where it then continually declined to a low of 3.8% in November. Chart 2a 8.0% Wood Buffalo - Cold Lake Economic Region Unemployment Rate Unadjusted, 3-Month Moving Average 6.0% 4.0% 2.0% % Jan Feb Mar Apr May Jun Jul Aug Sep Oct Nov Dec % 3.1% 3.1% 3.1% 2.9% 3.0% 3.6% 4.7% 4.7% 3.8% 3.0% 3.6% % 4.4% 4.3% 5.0% 4.8% 4.1% 3.6% 4.9% 5.3% 5.1% 3.8% 3.9% - 7 -
9 II. Wood Buffalo-Cold Lake Economic Region: Industries* Chart 2b shows the change in industry employment between 2005 and Overall, employment in the Goods-Producing industries increased by 2,000, between 2005 and 2006, while employment in the Services-Producing industries increased by 1,100. The industries with the highest year-over-year increase in employment were: Forestry, Fishing, Mining, Oil and Gas, 1,900; Trade, 1,100; and Health Care and Social Assistance, 300. Those industries with the largest decrease in employment were: Transportation and Warehousing, 600; Agriculture, 300; and Public Administration, 200. Chart 2b Wood Buffalo - Cold Lake Economic Region Year-Over-Year Change in Industry Employment, ** Forestry, Fishing, Mining, Oil and Gas Trade Health Care and Social Assistance Other Services Accommodation and Food Services Manufacturing Educational Services Construction Information, Culture and Recreation Utilities Professional, Scientific and Technical Services Business, Building and Other Support Services Finance, Insurance, Real Estate and Leasing Public Administration Agriculture Transportation and Warehousing (100) (100) (100) (200) (300) (600) * Note: Industries Classified by North American Industrial Classification System (NAICS) ** Note: Statistics Canada suppresses figures less than 1,500. Industries with employment totals of 1,500 or less in either 2005 or 2006 were suppressed
10 III. Athabasca-Grande Prairie: Employment and Unemployment In 2006, the Athabasca-Grande Prairie Region s labour force increased 3.4% or 4,400 people. Employment increased by 3.1%, an addition of 3,900 people. During this period, the region s unemployment rate increased 0.3 percentage points to 3.4%. The number of unemployed people in the region increased by 500, from 4,000 to 4,500 people. Several construction projects provided employment in the area. In addition, this year posted record figures for the development of new projects throughout the region, resulting in an increase in employment in related industries. Table 3 Athabasca-Grande Prairie Economic Region Labour Force Statistics Change Working-Age Population (000 s) % Labour Force (000 s) % Employment (000 s) % Unemployment (000 s) % Unemployment Rate 3.1% 3.4% 0.3 Chart 3a shows the monthly unemployment rates for the Athabasca-Grande Prairie Region. In 2006, the unemployment rate peaked in August and September at 3.9%, where it then continually declined. Overall, the unemployment rate increased 0.3 percentage points, from 3.1% in 2005 to 3.4 % in Chart 3a 8.0% 8.0% 8.0% 8.0% 6.0% 6.0% 6.0% 4.0% 4.0% 4.0% 2.0% 2.0% 2.0% Athabasca Athabasca - Grande - Grande Prairie Economic Prairie Economic Region Unemployment Region Unemployment Rate Rate Unadjusted, 3-Month Moving Average % 0.0% Jan Feb Mar Apr Apr May May Jun Jun Jul Jul Aug Aug Sep Sep Oct Oct Nov Nov Dec Dec Jan Feb Mar Apr May Jun Jul Aug Sep Oct Nov Dec % 3.3% 3.2% 3.2% 3.1% 3.5% 3.3% 3.6% 3.4% 3.2% 2.5% 2.2% % 3.3% 3.2% 3.2% 3.1% 3.5% 3.3% 3.6% 3.4% 3.2% 2.5% 2.2% % 2.4% 2.5% 2.9% 3.1% 3.4% 3.5% 3.9% 3.9% 3.7% 3.3% 3.5% % 2.4% 2.5% 2.9% 3.1% 3.4% 3.5% 3.9% 3.9% 3.7% 3.3% 3.5% - 9 -
11 III. Athabasca-Grande Prairie: Industries* Chart 3b shows the change in industry employment between 2005 and Overall, the Athabasca-Grande Prairie Region s employment in the Goods-Producing industries decreased by 1,100, while employment in the Services-Producing industries increased by 5,000. The industries with the highest year-over-year increase in employment were: Professional, Scientific and Technical Services, 1,700; Finance, Insurance, Real Estate and Leasing, 1,400; and Construction, 1,200. The industries with the highest year-overyear decrease in employment were: Agriculture, 1,300; Forestry, Fishing, Mining, Oil and Gas, 1,300; and Business, Building and Other Support Services, 700. Chart 3b Athabasca - Grande Prairie - Peace River Economic Region Year-Over- Year Change in Industry Employment, ** Professional, Scientific and Technical Services Finance, Insurance, Real Estate and Leasing Construction Trade Information, Culture and Recreation Manufacturing Public Administration Health Care and Social Assistance Transportation and Warehousing Accommodation and Food Services Other Services Educational Services Utilities Business, Building and Other Support Services Forestry, Fishing, Mining, Oil and Gas Agriculture (1300) (1300) (700) * Note: Industries Classified by North American Industrial Classification System (NAICS) ** Note: Statistics Canada suppresses figures less than 1,500. Industries with employment totals of 1,500 or less in either 2005 or 2006 were suppressed
12 IV. Edmonton Economic Region: Employment and Unemployment The Edmonton Region s labour force increased by 2.0%, from 593,900 people in 2005 to 605,600 people in In 2006, the participation rate was 69.6%. During the same period, employment increased by 2.7% or 15,100. The number of unemployed people in 2006 was 23,300, a decrease of 12.7% from the previous year. The region as a major supply centre benefited from major projects in the Wood Buffalo- Cold Lake Region. Massive construction projects, including the extension of Anthony Henday, Light Rail Transit expansion and ongoing projects at the University of Alberta, contributed to employment in the region. Table 4 Edmonton Economic Region Labour Force Statistics Change Working-Age Population (000 s) % Labour Force (000 s) % Employment (000 s) % Unemployment (000 s) % Unemployment Rate 4.5% 3.8% -0.7 Chart 4a displays the unadjusted monthly unemployment rates for the Edmonton Region in 2005 and Overall, in 2006, the annual unemployment rate decreased 0.7 percentage points to 3.8%. In August 2006, the region s unemployment rate peaked at 4.4% and reached its low in November at 3.4%. Chart 4a Edmonton Economic Region Unemployment Rate Unadjusted, 3-Month Moving Average 8.0% 6.0% 4.0% 2.0% % Jan Feb Mar Apr May Jun Jul Aug Sep Oct Nov Dec % 4.9% 4.7% 4.7% 4.6% 4.7% 4.6% 4.7% 4.5% 4.2% 3.8% 4.0% % 4.1% 3.9% 3.9% 3.7% 3.7% 3.8% 4.4% 4.2% 3.9% 3.4% 3.5%
13 IV. Edmonton Economic Region: Industries* Chart 4b shows the change in industry employment between 2005 and Overall, employment in Goods-Producing industries increased by 2,300 in 2006, while employment in the Services-Producing industries increased by 12,800. The industries with the highest year-over-year increase in employment were: Public Administration, 9,400; Other Services, 5,400; and Construction, 4,900. Industries to experience the largest decrease in employment were: Trade, 2,900; Accommodation and Food Services, 2,900; and Manufacturing, 2,100. Chart 4b Edmonton Economic Region Year-Over-Year Change in Industry Employment, ** Public administration Other services Construction Health care and social assistance Transportation and w arehousing Agriculture Educational services Finance, insurance, real estate and leasing Forestry, fishing, mining, oil and gas Professional, scientific and technical services Utilities Business, building and other support services Information, culture and recreation Manufacturing Accommodation and food services Trade (100) (800) (900) (1100) (2100) (2100) (2900) (2900) * Note: Industries Classified by North American Industrial Classification System (NAICS) **Note: Statistics Canada suppresses figures less than 1,500. Industries with employment totals of 1,500 or less in either 2005 or 2006 were suppressed
14 V. Red Deer Economic Region: Employment and Unemployment The labour force in the Red Deer Region grew to 4,700, a 4.9% increase over the previous year. The number of employed people increased by 4.3%, from 93,600 in 2005 to 97,600 in The number of unemployed people increased by 700, raising Red Deer s unemployment rate to 3.8%. The Red Deer Region experienced the fourth largest percentage increase in employment rates in the province in There were extensive construction projects, which supplied employment for the region. Also, the reopening of the United States border to Canadian cattle provided an increase in exports to the region. Table 5 Red Deer Economic Region Labour Force Statistics Change Working-Age Population (000 s) % Labour Force (000 s) % Employment (000 s) % Unemployment (000 s) % Unemployment Rate 3.3% 3.8% 0.5 Chart 5a displays the region s monthly unemployment rates in 2005 and Overall, the unemployment rate increased to 3.8% in The monthly unemployment rates fluctuated throughout the year, with a high of 4.5% in May and low of 3.0% in December. Chart 5a Red Deer Economic Region Unemployment Rate Unadjusted, 3-Month Moving Average 8.0% 6.0% 4.0% 2.0% % Jan Feb Mar Apr May Jun Jul Aug Sep Oct Nov Dec % 2.9% 2.8% 3.1% 3.5% 3.4% 3.2% 3.8% 3.8% 3.7% 3.2% 3.3% % 4.0% 4.4% 4.4% 4.5% 4.3% 4.1% 4.0% 3.7% 3.1% 3.2% 3.0%
15 V. Red Deer Economic Region: Industries* Chart 5b shows the change in industry employment between 2005 and Overall, employment in the Services-Producing industries increased by 3,100 compared to a year ago, while employment in the Goods-Producing industries increased by 900. Industries with the highest year-over-year increase in employment were: Public Administration, 2,200; Accommodation and Food Services, 1,900; and Agriculture, 1,800. Those industries with the highest year-over-year decrease in employment were: Health Care and Social Assistance, 2,900; Forestry, Fishing, Mining, Oil and Gas, 2,000; and Professional Scientific and Technical Services, 700. Chart 5b Red Deer Economic Region Year-Over-Year Change in Industry Employment, ** Public Administration Accommodation and Food Services Agriculture Finance, Insurance, Real Estate and Leasing Trade Manufacturing Transportation and Warehousing Other Services Utilities Construction Educational Services Business, Building and Other Support Services Information, Culture and Recreation Professional, Scientific and Technical Services Forestry, Fishing, Mining, Oil and Gas Health Care and Social Assistance (2900) (2000) (200) (300) (300) (600) (700) * Note: Industries Classified by North American Industrial Classification System (NAICS) **Note: Statistics Canada suppresses figures less than 1,500. Industries with employment totals of 1,500 or less in either 2005 or 2006 were suppressed
16 VI. Banff-Jasper-Rocky Mountain House Economic Region: Employment and Unemployment The labour force in the Banff-Jasper-Rocky Mountain House Region (RMH) increased by 1.8%, from 50,000 in 2005 to 50,900 in The participation rate for 2006 was 77.1%. As a result, employment increased by 2.1% during this period, from 48,600 in 2005 to 49,600 in The 2006 unemployment statistics were not available for the Banff-Jasper-RMH Region because of the Statistics Canada suppression rule*. The Banff-Jasper-RMH Region experienced the highest participation and employment rates throughout the province in This was likely a result of increased tourism to the region. Construction also aided in employment as several projects in the region began. Table 6 Banff-Jasper-Rocky Mountain House Economic Region Labour Force Statistics Change Working-Age Population (000 s) % Labour Force (000 s) % Employment (000 s) % Unemployment (000 s) N/A* N/A N/A* Unemployment Rate N/A N/A N/A *Note: Statistics Canada suppresses figures less than 1,500. VI. Banff-Jasper-Rocky Mountain House: Industries* Chart 6b, on the following page, shows the change in industry employment between 2005 and Overall, employment in the Services-Producing industries increased by 1,000 compared to a year ago, while employment in the Goods-Producing industries decreased by 100. The industries with the highest year-over-year increase in employment were: Professional, Scientific and Technical Services, 1,900; Public Administration, 1,500; and Transportation and Warehousing, 1,200. The industries with the highest year-over-year decrease in employment were: Accommodation and Food Services, 1,000; Agriculture, 800; and Business, Building and Other Support Services,
17 Chart 6b Banff-Jasper-Rocky Mountain House Economic Region Year-Over- Year Change in Industry Employment, ** Professional, Scientific and Technical Services Public Administration Transportation and Warehousing Construction Health Care and Social Assistance Information, Culture and Recreation Educational Services Forestry, Fishing, Mining, Oil and Gas Manufacturing Utilities Other Services Finance, Insurance, Real Estate and Leasing Trade Business, Building and Other Support Services Agriculture Accommodation and Food Services (100) (100) (200) (700) (800) (1000) * Note: Industries Classified by North American Industrial Classification System (NAICS) **Note: Statistics Canada suppresses figures less than 1,500. Industries with employment totals of 1,500 or less in either 2005 or 2006 were suppressed
18 VII. Calgary Economic Region: Employment and Unemployment The Calgary Region s labour force increased by 50,200 people between , a growth of 7.4%. Employment within the region also grew by 8.2%, from 651,600 to 705,000. The number of unemployed people decreased from 26,700 in 2005 to 23,500 in 2006, a decline of 12.0%. Several real estate construction projects provided employment as well increased development of the region s core. Other major projects included Foothills Medical Centre re-development and expansions to the Calgary International Airport. In addition, the Calgary Region felt effects of massive oil sands development and an increase in tourism, due to strong growth in business and leisure travel. Table 7 Calgary Economic Region Labour Force Statistics Change Working-Age Population (000 s) % Labour Force (000 s) % Employment (000 s) % Unemployment (000 s) % Unemployment Rate 3.9% 3.2% -0.7 Chart 7a displays the monthly unemployment rates for the Calgary Economic Region between 2005 and In 2006, the unemployment rate for the region decreased 0.7 percentage points to a rate of 3.2%. The unemployment rate peaked in January at a rate of 4.4%, where it then declined and reached its low of 2.6% in December. Chart 7a 8.0% Calgary Economic Region Unemployment Rate Unadjusted, 3-Month Moving Average 6.0% 4.0% 2.0% % Jan Feb Mar Apr May Jun Jul Aug Sep Oct Nov Dec % 4.6% 4.4% 3.8% 3.4% 3.2% 3.0% 3.2% 3.6% 4.2% 4.5% 4.5% % 3.9% 3.5% 3.0% 3.2% 3.2% 3.5% 3.6% 3.7% 3.3% 2.7% 2.6%
19 VII. Calgary Economic Region: Industries* Chart 7b shows the change in industry employment between 2005 and Overall, employment in the Services-Producing industries increased by 26,900 compared to a year ago, and employment in the Goods-Producing industries increased by 26,500. The industries with the highest year-over-year increase in employment were: Forestry, Fishing, Mining, Oil and Gas, 11,900; Accommodation and Food Services, 7,800; and Professional, Scientific and Technical Services, 7,200. The industries with the highest year-over-year decrease in employment were: Transportation and Warehousing, 5,900; and Agriculture, 600. Chart 7b Calgary Economic Region Year-Over-Year Change in Industry Employment, ** Forestry, Fishing, Mining, Oil and Gas Accommodation and Food Services 7800 Professional, Scientific and Technical Services 7200 Educational Services 6600 Construction 6600 Manufacturing 4900 Utilities 3600 Health Care and Social Assistance 2900 Trade 2500 Business, Building and Other Support Services 2300 Public Administration 1200 Information, Culture and Recreation 1200 Finance, Insurance, Real Estate and Leasing 800 Other Services 200 Agriculture (600) Transportation and Warehousing (5900) * Note: Industries Classified by North American Industrial Classification System (NAICS) **Note: Statistics Canada suppresses figures less than 1,500. Industries with employment totals of 1,500 or less in either 2005 or 2006 were suppressed
20 VIII. Camrose-Drumheller Economic Region: Employment and Unemployment The labour force in the Camrose-Drumheller Region increased by 5.4% between During the same period, employment rose 5.7%, from 101,300 to 107,100. The unemployment rate declined 0.4 percentage points, as the number of unemployed people decreased from 3,300 to 3,100. A boom in the construction industry in the Camrose-Drumheller Region assisted in increasing employment in the region. Several projects such as the new multiplex, stores, and hotels all provided employment for the area. In addition, several oil projects contributed to employment for the region. Table 8 Camrose-Drumheller Economic Region Labour Force Statistics Change Working-Age Population (000 s) % Labour Force (000 s) % Employment (000 s) % Unemployment (000 s) % Unemployment Rate 3.2% 2.8% -0.4 Chart 8a graphs the monthly unemployment rates for the Camrose-Drumheller Economic Region. In 2006, the unemployment rate reached its low in January, February and March at 2.4% and peaked in October at 3.4%. Overall, the annual unemployment rate decreased 0.4 percentage points, from a rate of 3.2% in 2005 to a rate of 2.8% in Chart 8a 8.0% Camrose-Drumheller Economic Region Unemployment Rate Unadjusted, 3-Month Moving Average 6.0% 4.0% 2.0% % Jan Feb Mar Apr May Jun Jul Aug Sep Oct Nov Dec % 3.6% 3.1% 3.4% 3.7% 3.6% 2.9% 2.7% 3.2% 3.1% 2.8% 2.6% % 2.4% 2.4% 3.1% 3.1% 2.8% 2.3% 3.0% 3.1% 3.4% 2.8% 2.9%
21 VIII: Camrose-Drumheller Economic Region: Industries* Chart 8b shows the change in industry employment between 2005 and Overall, employment in the Services-Producing industries increased by 4,600 compared to a year ago, while employment in the Goods-Producing industries increased by 1,200 during this same period. Industries with the highest year-over-year increase in employment were: Health Care and Social Assistance, 2,100; Educational Services, 2,100; and Professional, Scientific and Technical Services, 1,400. Industries with the highest year-over-year decrease in employment were: Agriculture, 1,100; Transportation and Warehousing, 900; and Information, Culture and Recreation, 700. Chart 8b Camrose-Drumheller Economic Region Year-Over-Year Change in Industry Employment, ** Health Care and Social Assistance Educational Services Professional, Scientific and Technical Services Business, Building and Other Support Services Forestry, Fishing, Mining, Oil and Gas Construction Public Administration Manufacturing Other Services Trade Utilities Finance, Insurance, Real Estate and Leasing Accommodation and Food Services Information, Culture and Recreation Transportation and Warehousing Agriculture (100) (400) (700) (900) (1100) * Note: Industries Classified by North American Industrial Classification System (NAICS) **Note: Statistics Canada suppresses figures less than 1,500. Industries with employment totals of 1,500 or less in either 2005 or 2006 were suppressed
22 IX. Lethbridge-Medicine Hat Economic Region: Employment and Unemployment Between 2005 and 2006, the Lethbridge-Medicine Hat Region s labour force decreased by 0.9%, to 141,800 people. During the same period, employment remained the same at 137,500. In 2006, the employment rate for the region was 68.6%. The number of unemployed people in the region declined to 4,300, a decrease of 23.2%. The re-opening of the United States border to Canadian cattle contributed to the decreasing unemployment rate in the region. There were several major utilities projects that also provided employment. The University of Lethbridge began work on its $11 million Turcotte Hall Addition and $27 million Water and Environmental Science Building. Employment in the Trade industry will also grow as several new stores will open in the region. Table 9 Lethbridge-Medicine Hat Economic Region Labour Force Statistics Change Working-Age Population (000 s) % Labour Force (000 s) % Employment (000 s) % Unemployment (000 s) % Unemployment Rate 3.9% 3.0% -0.9 Chart 9a displays the monthly unemployment rates for the region in 2005 and In January, the unemployment rate reached its highest rate at 3.9%. After this peak, the unemployment rate decreased reaching a low of 2.6% in April. Chart 9a 8.0% Lethbridge-Medicine Hat Economic Region Unemployment Rate Unadjusted, 3-Month Moving Average 6.0% 4.0% 2.0% % Jan Feb Mar Apr May Jun Jul Aug Sep Oct Nov Dec % 4.1% 4.2% 4.1% 4.0% 3.9% 3.6% 3.7% 3.5% 3.4% 3.8% 3.9% % 3.2% 2.8% 2.6% 2.9% 2.9% 2.7% 3.0% 3.3% 3.1% 3.0% 3.2%
23 IX. Lethbridge-Medicine Hat Economic Region: Industries* Chart 9b shows the change in industry employment between 2005 and Overall, employment in the Services-Producing and Goods-Producing industries remained constant. Industries with the highest year-over-year increase in employment were: Transportation and Warehousing, 2,000; Professional, Scientific and Technical Services, 1,900; and Manufacturing, 1,700. Those industries with the highest year-over-year decrease in employment were: Forestry, Fishing, Mining, Oil and Gas, 2,400; Agriculture, 2,000; and Information, Culture and Recreation, 2,000. Chart 9b Lethbridge - Medicine Hat Economic Region Year-Over-Year Change in Industry Employment, ** Transportation and Warehousing Professional, Scientific and Technical Services Manufacturing Trade Educational Services Forestry, Fishing, Mining, Oil and Gas Accommodation and Food Services Utilities Public Administration Business, Building and Other Support Services Other Services Health Care and Social Assistance Construction Information, Culture and Recreation Agriculture Finance, Insurance, Real Estate and Leasing (2000) (2000) (2400) (300) (600) (700) (700) (1100) * Note: Industries Classified by North American Industrial Classification System (NAICS) **Note: Statistics Canada suppresses figures less than 1,500. Industries with employment totals of 1,500 or less in either 2005 or 2006 were suppressed
24 X. Glossary Employed People: People who, during the week (Sunday to Saturday): (a) did any work at all for pay or in self-employment or without pay in a family farm, business or professional practice; (b) were absent from their job or business, with or without pay, for the entire week because of vacation, an illness, a labour dispute at their place of work, or any other reasons. Employment Rate: Refers to the number of people employed in the week (Sunday to Saturday), expressed as a percentage of the total population 15 years of age and over. Goods-Producing Industries: The following industries are included within this category: Forestry, Fishing, Mining, Oil, and Gas; Manufacturing; Agriculture; Construction; and Utilities. Labour Force: Refers to people who were either employed or unemployed during the week (Sunday to Saturday). Participation Rate: Refers to the labour force in the week (Sunday to Saturday), expressed as a percentage of the population 15 years of age and over. Services-Producing Industries: The following industries are included within this category: Finance, Insurance, Real Estate, and Leasing; Transportation and Warehousing; Accommodation and Food Services; Other Services; Information, Culture, and Recreation; Business, Building, and Other Support Services; Public Administration; Health Care and Social Assistance; Professional, Scientific, and Technical Services; Trades (retail and wholesale); and Educational Services. Working-Age Population: People 15 years of age and over except people living on Indian reserves, inmates of institutions, and full-time members of the Canadian Armed Forces. Unemployed People: People who, during the week (Sunday to Saturday), were without paid work or without self-employment work and were available for work and either: (a) had actively looked for paid work in the past four weeks; or (b) were on temporary lay-off and expected to return to their job; or (c) had definite arrangements to start a new job in four weeks or less. Unemployment Rate- Refers to the unemployed expressed as a percentage of the labour force in the week (Sunday to Saturday)
2004 Annual Alberta Regional Labour Market Review
 2004 Annual Alberta Regional Labour Market Review Athabasca Grande Prairie Wood Buffalo - Cold Lake Banff - Jasper - Rocky Mountain House Edmonton Red Deer Camrose - Drumheller Calgary Lethbridge - Medicine
2017 Annual Alberta Regional Labour Market Review
 2017 Annual Alberta Regional Labour Market Review Wood Buffalo-Cold Lake. Lethbridge-Medicine Hat Banff-Jasper-Rocky Mountain House and Athabasca-Grande Prairie-Peace River Edmonton. Red Deer. Calgary.
Provincial and National Employment, Alberta and Canada Employment Rates 1, % 62.7% 62.7% 63.0% 63.5%
 Employment ALBERTA S HOT ECONOMY CONTINUES TO PRODUCE HIGH EMPLOYMENT GROWTH IN 2007 The number of employed Albertans in 2007 increased by 88,775, higher than the 2006 growth of 86,240. The economy also
2008 ANNUAL ALBERTA LABOUR MARKET REVIEW
 ANNUAL ALBERTA LABOUR MARKET REVIEW employment unemployment economic regions migration aboriginal people industries occupations education demographics Employment and Immigration EMPLOYMENT Employment increased
2012 Annual Alberta Labour Market Review
 2012 Annual Alberta Labour Market Review Employment. Unemployment. Economic Regions. Migration Aboriginal People. Industries. Occupations. Education. Demographics Employment Alberta has the highest employment
Annual Alberta Labour Market Review
 06 Annual Alberta Labour Market Review Employment Unemployment EconomicRegions Migration Industries Wages Occupations Education HoursWorked UnionCoverage Demographics AboriginalPeople Employment ALBERTA
2017 Annual Alberta Labour Market Review
 2017 Annual Alberta Labour Market Review Employment. Unemployment. Economic Regions Migration. Indigenous People. Industries Occupations. Education. Demographics Employment Employment grew by 1. in Alberta
Annual. Labour. Market. Alberta. Review
 2005 Annual Alberta Labour Market Review Employment Economic Regions Unemployment Migration Industries Occupations Wages Skill Shortages Education Hours Worked Demographics Aboriginal People EMPLOYMENT
ALBERTA LABOUR FORCE PROFILES Aboriginal People in the Labour Force Alberta Labour Force Profiles
 ALBERTA LABOUR FORCE PROFILES Aboriginal People in the Labour Force 2009 Alberta Labour Force Profiles Aboriginal People 2011 Highlights 1. Population of More than 60.0% of the working age population (WAP)
Economic Spotlight June 20, 2009
 Economic Spotlight June 2, 29 Summary: Consumer Bankruptcy Deteriorating economic conditions, combined with rising unemployment and declining asset values, have caused a significant increase in consumer
Alberta Labour Market Outlook
 Labour Market Outlook Released March 2012 Factors Likely to Affect Alberta s Labour Market Global economic and financial uncertainty created by the Eurozone debt crisis Economic growth in emerging markets
Monthly Labour Force Survey Statistics December 2018
 800 Monthly Labour Force Survey Statistics CALGARY CMA Table 282-0135 Labour force survey estimates (LFS), by census metropolitan area based on 2011 census boundaries, 3-month moving average, seasonally
Monthly Labour Force Survey Statistics November 2018
 800 Monthly Labour Force Survey Statistics CALGARY CMA Table 282-0135 Labour force survey estimates (LFS), by census metropolitan area based on 2011 census boundaries, 3-month moving average, seasonally
August 2015 Aboriginal Population Off-Reserve Package
 Labour Force Statistics Aboriginal Population Off-Reserve Package Package Includes: - Information for all Aboriginal people, First Nations and Métis - Working age population, labour force, employment,
October 2016 Aboriginal Population Off-Reserve Package
 Labour Force Statistics Aboriginal Population Off-Reserve Package Package Includes: - Information for all Aboriginal people, First Nations and Métis - Working age population, labour force, employment,
June Monthly Economic Review
 June 2013 Monthly Economic Review MONTHLY ECONOMIC REVIEW June 2013 TABLE OF CONTENTS Current Economic Indicators Page Labour Force Indicators... 2 Industry Labour Force... 3 Employment Insurance, Wages
December 2017 Alberta Indigenous People Living Off-Reserve Package
 Labour Force Statistics Alberta Indigenous People Living Off-Reserve Package Package Includes: - Information for all Indigenous people, First Nations and Métis - Working age population, labour force, employment,
January 2018 Alberta Indigenous People Living Off-Reserve Package
 Labour Force Statistics Alberta Indigenous People Living Off-Reserve Package Package Includes: - Information for all Indigenous people, First Nations and Métis - Working age population, labour force, employment,
November 2017 Alberta Indigenous People Living Off-Reserve Package
 Labour Force Statistics Alberta Indigenous People Living Off-Reserve Package Package Includes: - Information for all Indigenous people, First Nations and Métis - Working age population, labour force, employment,
April 2017 Alberta Indigenous People Living Off-Reserve Package
 Labour Force Statistics Alberta Indigenous People Living Off-Reserve Package Package Includes: - Information for all Indigenous people, First Nations and Métis - Working age population, labour force, employment,
Saskatchewan Labour Force Statistics
 Saskatchewan Labour Force Statistics April 2017 UNADJUSTED DATA According to the Statistics Canada Labour Force Survey during the week covering April 9 th to 15 th,, 2017, there were 560,100 persons employed
Alberta's Economic Outlook
 Alberta's Economic Outlook Catherine Rothrock Chief Economist & Executive Director Alberta Treasury Board and Finance December 6, 218 Solid growth in second year of recovery, differentials weigh on 219
Alberta Labour Force Profiles
 Alberta Labour Force Profiles 2011 Highlights For the purpose of this profile, youth are defined as persons aged 15 to 24 years. 1. Alberta Population Statistics Among the provinces, Alberta had the third
Insolvency Statistics in Canada. September 2015
 Insolvency Statistics in Canada September 2015 List of Tables Table 1: Total Insolvencies... 1 Table 2: Insolvencies Filed by Consumers... 2 Table 3: Insolvencies Filed by Businesses... 3 Table 4: Insolvencies
Highlights. For the purpose of this profile, the population is defined as women 15+ years.
 A L B E R T A L A B O U R F O R C E P R O F I L ES Women 2014 Highlights For the purpose of this profile, the population is defined as women 15+. Working Age Population of Women in Alberta The number of
2016 Alberta Labour Force Profiles Women
 2016 Alberta Labour Force Profiles Alberta s Highlights Population Statistics Labour Force Statistics lowest percentage of women in the working age population 1. 51.7% NS 2. 51.5% PEI 9. 49.6% SK 10. 49.3%
2017 Alberta Labour Force Profiles Youth
 2017 Alberta Labour Force Profiles Youth Highlights Population Statistics Labour Force Statistics 4 th highest proportion of youth in the working age population 1. 16.3% MB 2. 15.3% ON 2. 15.2% SK 4. 14.9%
Insolvency Statistics in Canada. April 2013
 Insolvency Statistics in Canada April 2013 List of Tables Table 1: Total Insolvencies... 1 Table 2: Insolvencies Filed by Consumers... 2 Table 3: Insolvencies Filed by Businesses... 3 Table 4: Insolvencies
Labour Force Statistics for the 10 largest communities in Nunavut
 Nunavutt Bureau of Sttattiisttiics Labour Force Statistics for the largest communities in Nunavut Labour Force Statistics at a glance month moving average ending in July : Participation :.% Employment
ALBERTA PROFILE: YOUTH
 ALBERTA PROFILE: YOUTH IN THE LABOUR FORCE Prepared By:, Data Development and Evaluation Released: June 2003 Highlights Statistics Canada defines youth as those people between the ages of 15-24 years.
STATISTICS CANADA RELEASES 2016 GDP DATA
 STATISTICS CANADA RELEASES 2016 GDP DATA On November 8, 2017 Statistics Canada released Provincial Gross Domestic Product (GDP) data for 2016 as well as revisions for 2011 to 2015. The PEI GDP at market
BC JOBS PLAN ECONOMY BACKGROUNDER. Current statistics show that the BC Jobs Plan is working: The economy is growing and creating jobs.
 We know that uncertainty continues to remain in the global economy and we expect to see some monthly fluctuations in jobs numbers. That is why we will continue to create an environment that is welcoming
Alberta Self-Employment Profile
 Alberta Self-Employment Profile 2016 Overview Self-employment represents the entrepreneurial spirit of Alberta. This spirit is at the heart of Alberta s vibrant economy. By creating employment, producing
Trends in Labour Productivity in Alberta
 Trends in Labour Productivity in Alberta July 2012 -2- Introduction Labour productivity is the single most important determinant in maintaining and enhancing sustained prosperity 1. Higher productivity
Alberta s Labour Productivity Declined in 2016
 ECONOMIC COMMENTARY Alberta s Labour Productivity Declined in 2016 Highlights: The 2015/2016 recession and the Fort Mc Murray forest fires caused Alberta s labour productivity to decline again in 2016
Quebec-Ontario: Demographics are shaping the labour market
 MAY 5, 2017 ECONOMIC NEWS -: Demographics are shaping the labour market HIGHLIGHTS recorded a loss of 3,800 jobs in April, after an increase of 2,400 in the previous month. The unemployment rate climbed
CCAA Statistics in Canada. Third Quarter of 2017
 2017 CCAA Statistics in Canada Third Quarter of 2017 Sections Highlights... 3 Table 1: Total CCAA Proceedings Domestic....6 Table 2: Total CCAA Proceedings Filed by Province.......7 Table 3: CCAA Proceedings
CANADA S OIL AND GAS WORKFORCE: DISTRIBUTION, WORK PATTERNS AND INCOME
 CANADA S OIL AND GAS WORKFORCE: DISTRIBUTION, WORK PATTERNS AND INCOME AUGUST 2018 Table of Contents Introduction... 3 Distribution... 4 Sectoral: Industry s sub-sectors diverge... 4 Occupational: Broad
ALBERTA PROFILE: YOUTH IN THE LABOUR FORCE
 ALBERTA PROFILE: YOUTH IN THE LABOUR FORCE Highlights Statistics Canada defines youth as those people between the ages of 15-24 years. 1 1. Youth Labour Force Statistics Over one quarter of Canada s increase
Alberta s Economic Prospects and Regional Impacts. Presentation to PREDA REDA January 28, 2011
 Alberta s Economic Prospects and Regional Impacts Presentation to PREDA REDA January 28, 2011 Is World Economy s Recovery Sustainable? Uneven global recovery, with widespread financial and fiscal turbulence
2014 MINIMUM WAGE RATE ANNUAL REPORT
 DEPARTMENT OF JUSTICE 2014 MINIMUM WAGE RATE ANNUAL REPORT PREPARED BY: POLICY & PLANNING DIVISION DEPARTMENT OF JUSTICE BACKGROUND INFORMATION The Nunavut Labour Standards Act (the Act ) regulates employment
Mid Year Economic Update
 Mid Year Economic Update 1 Key Economic Assumptions* -6 6-7 7-8 8-9 Fiscal Year Assumptions Actual Actual Actual Budget Update Prices Crude Oil Price WTI (US$/bbl) 9.97 6.89 8. 78. 119. Alberta Wellhead
Quebec and Ontario create jobs in May
 ECONOMIC NEWS and create jobs in May #1 BEST OVERALL FORECASTER - CANADA HIGHLIGHTS GRAPH ff created 14,9 new jobs in May. Job growth in and has been comparable for the past two years, despite the differences
Alberta Minimum Wage Profile April March 2017
 Alberta Minimum Wage Profile April 2016 - March 2017 Introduction The Alberta Minimum Wage Profile presents current information on persons whose average hourly earnings 1 are at or below minimum wage in
Housing Bulletin Monthly Report
 March 211 1 Housing Bulletin Monthly Report Alberta s preliminary housing starts increased month-over-month in February 211 Canada Housing Starts 25, 2, 15, 1, 5, FEB 9 MAR 9 Preliminary Housing Starts
Estimating Earning Capacity: Making Reasonable Efforts to Support a Job Search
 Estimating Earning Capacity: Making Reasonable Efforts to Support a Job Search Background Vocational rehabilitation planning consists of three steps: 1. Career Counselling 2. Vocational Plan Confirmed
 Estimated total job losses from 10% minimum wage increase across all provinces Upper Bound 321,300 Lower Bound 92,300 Source: CFIB calculations from Statistic Canada s 2009 Labour Force Survey data. iv
New products and studies 19
 Catalogue 11-001-X (ISSN 1205-9137) Thursday, June 28, 2012 Released at 8:30 a.m. Eastern time Releases Payroll employment, earnings and hours, April 2012 (preliminary data) 2 In April, average weekly
Alberta Minimum Wage Profile April March 2018
 Alberta Minimum Wage Profile April 2017 - March 2018 Introduction The Alberta Minimum Wage Profile presents current information on persons whose average hourly earnings 1 are at or below minimum in Alberta
Trends in Labour Productivity in Alberta
 Trends in Labour Productivity in Alberta June 2016 -2- Introduction Labour productivity is the single most important determinant in maintaining and enhancing sustained prosperity for Albertans. Higher
Investing in Canada s Future. Prosperity: An Economic Opportunity. for Canadian Industries
 Investing in Canada s Future Prosperity: An Economic Opportunity for Canadian Industries PART II of Reconciliation: Growing Canada s Economy by $27.7 B Methods and Sources Paper Prepared for the National
Consumer Price Index. Highlights. Manitoba second highest among provinces. Consumer Price Index (CPI), Manitoba and Canada, February 2019
, Manitoba and Canada, February 2019") MBS Reports C o n s u m e r P r i c e I n d e x, F e b r u a r y 2 0 1 9 1 Consumer Price Index F e b r u a r y 2 0 1 9 Highlights The Manitoba all-items Consumer Price Index (CPI) increased % on a year-overyear
MBS Reports C o n s u m e r P r i c e I n d e x, F e b r u a r y 2 0 1 9 1 Consumer Price Index F e b r u a r y 2 0 1 9 Highlights The Manitoba all-items Consumer Price Index (CPI) increased % on a year-overyear
Consumer Price Index. Highlights. Manitoba second highest among provinces. MBS Reports C o n s u m e r P r i c e I n d e x, M a r c h
 MBS Reports C o n s u m e r P r i c e I n d e x, M a r c h 2 0 1 9 1 Consumer Price Index M a r c h 2 0 1 9 Highlights The Manitoba all-items Consumer Price Index (CPI) increased 2.3% on a year-overyear
SUMMARY OF SELECTED ECONOMIC INDICATORS
 SUMMARY OF SELECTED ECONOMIC INDICATORS RECENT DATA GRAPHS HISTORICAL DATA GRAPHS P.E.I. CONSUMER PRICE INDEX P.E.I. LABOUR FORCE STATISTICS CANADA/P.E.I. GROSS DOMESTIC PRODUCT, INCOME-BASED CANADA /
Source(s): Statistics Canada, Cansim Table , Seasonally Adjusted
: Statistics Canada, Cansim Table , Seasonally Adjusted") Monthly Headlines Low Loonie Not Increasing Canadian Manufacturing Employment... Yet. From June to July, total employment fell by 600 (-0.3%) to 236,500 on a seasonally adjusted basis. i While full-time
Monthly Headlines Low Loonie Not Increasing Canadian Manufacturing Employment... Yet. From June to July, total employment fell by 600 (-0.3%) to 236,500 on a seasonally adjusted basis. i While full-time
Employment Stumbles in Quebec and Falls in Ontario in August
 SEPTEMBER 7, 218 ECONOMIC NEWS Employment Stumbles in and Falls in in August HIGHLIGHTS ff posted a loss of 8,1 jobs in August, following growth of 95,5 jobs during the two previous months. It was part-time
Net interest income on average assets and liabilities Table 66
 Supplemental information Net interest income on average assets and liabilities Table 66 Average balances Interest (1) Average rate (C$ millions, except percentage amounts) 2009 2008 2007 2009 2008 2007
Consumer Price Index. Highlights. Manitoba third highest among provinces. Consumer Price Index (CPI), Manitoba and Canada, December 2018
, Manitoba and Canada, December 2018") MBS Reports C o n s u m e r P r i c e I n d e x, D e c e m b e r 2 0 1 8 1 Consumer Price Index D e c e m b e r 2 0 1 8 Highlights The Manitoba all-items Consumer Price Index (CPI) increased 2.1% on a
MBS Reports C o n s u m e r P r i c e I n d e x, D e c e m b e r 2 0 1 8 1 Consumer Price Index D e c e m b e r 2 0 1 8 Highlights The Manitoba all-items Consumer Price Index (CPI) increased 2.1% on a
Pace of hiring slows in Quebec and Ontario in February
 MARCH 10, 2017 ECONOMIC NEWS Pace of hiring slows in and in February HIGHLIGHTS According to the labour force survey, employment in declined in February (-11,100). This decline puts the brakes on seven
Net interest income on average assets and liabilities Table 75
 Supplementary information Net interest income on average assets and liabilities Table 75 balances Interest rate (Millions of dollars, except for percentage amounts) 2014 2013 2012 (1) 2014 2013 2012 (1)
Quebec and Ontario: Employment Rises in March While the Unemployment Rate Treads Water
 APRIL 6, 218 ECONOMIC NEWS and : Employment Rises in March While the Unemployment Rate Treads Water HIGHLIGHTS ff Both and boosted their employment ranks in March, with respective gains of 16, and 1,6.
The Aboriginal Economic Benchmarking Report. Core Indicator 1: Employment. The National Aboriginal Economic Development Board June, 2013
 The Economic Benchmarking Report Core Indicator 1: Employment The National Economic Development Board June, 2013 The National Economic Development Board 10 Wellington St., 9th floor Gatineau, (Quebec)
Quebec Ontario: Strong Job Creation in November, With Unemployment at About 5.5%
 ECONOMIC NEWS : Strong Job Creation in November, With Unemployment at About % HIGHLIGHTS ff recorded a second consecutive monthly increase in employment, with 25,800 new jobs created in November. ff performed
Employment Figures for September Down in Quebec, Up in Ontario
 ECONOMIC NEWS Employment Figures for September Down in, Up in HIGHLIGHTS ff saw the highest job creation in in September, with new jobs. Part-time employment recorded the most gains. ff The unemployment
How the Current Slowdown is Affecting Alberta s Municipalities September Update
 ECONOMIC COMMENTARY How the Current Slowdown is Affecting Alberta s Municipalities September Update Highlights: The current economic recession has resulted in rapidly rising unemployment and a surge in
Consumer Price Index. Highlights. Manitoba fourth highest among provinces. Consumer Price Index (CPI), Manitoba and Canada, November 2018
, Manitoba and Canada, November 2018") MBS Reports C o n s u m e r P r i c e I n d e x, N o v e m b e r 2 0 1 8 1 Consumer Price Index N o v e m b e r 2 0 1 8 Highlights The Manitoba all-items Consumer Price Index (CPI) increased 1.7% on a
MBS Reports C o n s u m e r P r i c e I n d e x, N o v e m b e r 2 0 1 8 1 Consumer Price Index N o v e m b e r 2 0 1 8 Highlights The Manitoba all-items Consumer Price Index (CPI) increased 1.7% on a
CONSUMER PRICE INDEX REPORT OCTOBER 2017
 CONSUMER PRICE INDEX REPORT OCTOBER 2017 M A N I T O B A B U R E A U O F S T A T I S T I C S RIGHT ANSWERS RIGHT NOW November 17, 2017 CONTENTS SUMMARY CHART 1 - ANNUAL INFLATION RATE: MANITOBA AND CANADA
Consumer Price Index. Highlights. Manitoba third highest among provinces. Consumer Price Index (CPI), Manitoba and Canada, September 2018
, Manitoba and Canada, September 2018") MBS Reports C o n s u m e r P r i c e I n d e x, S e p t e m b e r 2 0 1 8 1 Consumer Price Index S e p t e m b e r 2 0 1 8 Highlights The Manitoba all-items Consumer Price Index (CPI) increased 2.4% on
MBS Reports C o n s u m e r P r i c e I n d e x, S e p t e m b e r 2 0 1 8 1 Consumer Price Index S e p t e m b e r 2 0 1 8 Highlights The Manitoba all-items Consumer Price Index (CPI) increased 2.4% on
Consumer Price Index report
 MBS Reports C o n s u m e r P r i c e I n d e x R e p o r t, J u l y 2 0 1 8 1 Consumer Price Index report J u l y 2 0 1 8 Highlights The Manitoba all-items Consumer Price Index (CPI) increased 3.3% on
Labour Market: Quebec Loses Ground, Ontario Makes Gains
 ECONOMIC NEWS Labour Market: Loses Ground, Makes Gains HIGHLIGHTS ff As in August, s labour market dipped slightly in September (-7,6). ff The unemployment rate ticked down from % to % due to the 12,4
Look to both coasts for the fastest growth in 2019
 Look to both coasts for the fastest growth in 2019 PROVINCIAL OUTLOOK March 2019 Canada s economy ended 2018 on a weak note, posting the slowest quarterly growth rate since mid-2016 and providing a soft
CCAA Statistics in Canada. Second Quarter of 2017
 2017 CCAA Statistics in Canada Second Quarter of 2017 Sections Highlights... 3 Table 1: Total CCAA Proceedings Domestic....6 Table 2: Total CCAA Proceedings Filed by Province.......7 Table 3: CCAA Proceedings
MLS Sales vs. Listings (seasonaly adjusted)
") QUARTER 4: Canada Guaranty Housing Market Review OCTOBER - DECEMBER 21 The Canadian economy posted positive indicators of growth in early 21; however, the optimistic sentiment deteriorated in the latter
QUARTER 4: Canada Guaranty Housing Market Review OCTOBER - DECEMBER 21 The Canadian economy posted positive indicators of growth in early 21; however, the optimistic sentiment deteriorated in the latter
Yukon Bureau of Statistics
 Yukon Bureau of Statistics 9 # $ > 0 - + 6 & ± 8 < 3 π 7 5 9 ^ Yukon GDP by Industry 008 Total Yukon GDP by Industry, 008... $,44,600,000 Growth Rate from 007 to 008...4.3% The Gross Domestic Product of
Region of Waterloo Planning, Development and Legislative Services Community Planning
 Region of Waterloo Planning, Development and Legislative Services Community Planning To: Chair Tom Galloway and Members of the Planning and Works Committee Date: April 4, 217 File Code: D7-4(A) Subject:
April An Analysis of Prince Edward Island s Productivity, : Falling Multifactor Productivity Dampens Labour Productivity Growth
 April 2011 111 Sparks Street, Suite 500 Ottawa, Ontario K1P 5B5 613-233-8891, Fax 613-233-8250 csls@csls.ca CENTRE FOR THE STUDY OF LIVING STANDARDS An Analysis of Prince Edward Island s Productivity,
Labour Market Information Monthly
 Canada's population estimates: Subprovincial areas, July 1, 2014 On July 1, 2014, almost 7 in 10 Canadians, or 24,858,600 people, were living in a census metropolitan area (CMA). In turn, more than one
Industry Trends Watch
 Costing Trends - Alberta Asphalt Cement (Edmonton Rack $C/t) According to local industry sources, the Edmonton rack price for asphalt cement remained unchanged mo/mo in February at $565 per tonne. Expect
STATISTICS CANADA RELEASES 2015 NET FARM INCOME AND FARM CASH RECEIPTS DATA
 STATISTICS CANADA RELEASES 2015 NET FARM INCOME AND FARM CASH RECEIPTS DATA 2015 NET FARM INCOME On May 25, 2016 Statistics Canada released estimates of Net Farm Income for Canada and the provinces for
Consumer Price Index report
 MBS Reports C o n s u m e r P r i c e I n d e x R e p o r t, J u n e 2 0 1 8 1 Consumer Price Index report J u n e 2 0 1 8 Highlights The Manitoba all-items Consumer Price Index (CPI) rose 2.7% on a year-over-year
Post-Secondary Education, Training and Labour Prepared November New Brunswick Minimum Wage Report
 Post-Secondary Education, Training and Labour Prepared November 2018 2018 New Brunswick Minimum Wage Report Contents Section 1 Minimum Wage Rates in New Brunswick... 2 1.1 Recent History of Minimum Wage
April An Analysis of Nova Scotia s Productivity Performance, : Strong Growth, Low Levels CENTRE FOR LIVING STANDARDS
 April 2011 111 Sparks Street, Suite 500 Ottawa, Ontario K1P 5B5 613-233-8891, Fax 613-233-8250 csls@csls.ca CENTRE FOR THE STUDY OF LIVING STANDARDS An Analysis of Nova Scotia s Productivity Performance,
Policy Brief. Canada s Labour Market Puts in a Strong Performance in The Canadian Chamber is committed to fostering.
 Canada s Labour Market Puts in a Strong Performance in 2012 Introduction Policy Brief Economic Policy Series February 2013 Canada s labour market ended 2012 on a high note with almost 100,000 net new jobs
CANADIAN MANUFACTURERS & EXPORTERS BUSINESS CONDITIONS SURVEY
 CANADIAN MANUFACTURERS & EXPORTERS BUSINESS CONDITIONS SURVEY August 2009 CME Business Conditions Survey August 2009 CME, in partnership with member associations of the Canadian Manufacturing Coalition,
Upstream Oil and Gas Industry Outlook
 Upstream Oil and Gas Industry Outlook Ben Brunnen November 3, 2015 Presentation to the Petroleum Services Association of Canada (PSAC) 2 Overview About Canada s Oil & gas industry Economic Context Competitiveness
Individual Taxation Tax Planning Guide
 Taxable Income TABLE I1 ONTARIO (2014) TAX TABLE Tax Effective Marginal Rate Federal Ontario Total Rate Federal Ontario Total $ $ $ $ 10,000-17 17 0.2 0.0 5.0 5.0 11,000-67 67 0.6 12.9 5.1 18.0 12,000
LABOUR FORCE STATISTICS REPORT AUGUST 2018
 LABOUR FORCE STATISTICS REPORT AUGUST 2018 MANITOBA BUREAU OF STATISTICS SEPTEMBER 7, 2018 CHARTS 1. UNEMPLOYMENT RATES, CANADA AND PROVINCES 2. YOUTH UNEMPLOYMENT RATES, CANADA AND PROVINCES 3. TOTAL
LABOUR FORCE STATISTICS REPORT OCTOBER 2018
 LABOUR FORCE STATISTICS REPORT OCTOBER 2018 MANITOBA BUREAU OF STATISTICS NOVEMBER 2, 2018 CHARTS 1. UNEMPLOYMENT RATES, CANADA AND PROVINCES 2. YOUTH UNEMPLOYMENT RATES, CANADA AND PROVINCES 3. TOTAL
LABOUR FORCE STATISTICS REPORT APRIL 2018
 LABOUR FORCE STATISTICS REPORT APRIL 2018 MANITOBA BUREAU OF STATISTICS MAY 11, 2018 CHARTS 1. UNEMPLOYMENT RATES, CANADA AND PROVINCES 2. YOUTH UNEMPLOYMENT RATES, CANADA AND PROVINCES 3. TOTAL EMPLOYMENT,
Gross Domestic Product
 Gross Domestic Product Following growth of 2.6 per cent in 2010, the Conference Board of Canada forecasts GDP growth of 1.5 per cent for 2011 and 1.4 per cent for 2012 for Prince Edward Island. Sources:
Industry Trends Watch
 Costing Trends - Alberta Asphalt Cement (Edmonton Rack $C/t) The Edmonton rack price for asphalt cement averaged $730 per tonne in May, compared with $655 in April. In May of last year, the rack price
Post-Secondary Education, Training and Labour Prepared May New Brunswick Minimum Wage Report
 Post-Secondary Education, Training and Labour Prepared May 2018 2018 New Brunswick Minimum Wage Report Contents Section 1 Minimum Wage Rates in New Brunswick... 2 1.1 Recent History of Minimum Wage in
Real Estate Rental and Leasing and Property Management
 Catalogue no. 63-249-X. Service bulletin Real Estate Rental and Leasing and Property Management 2011. Highlights In 2011, real estate rental and leasing and property management industries generated $82.6
The labour market heated up in Quebec and stabilized in Ontario in January
 QUEBEC ONTARIO The labour market heated up in Quebec and stabilized in Ontario in January February 6, 15 highlights According to the labour force survey, 16, jobs were created in Quebec in January. At
Federal and Provincial/Territorial Tax Rates for Income Earned
 by a CCPC Effective January 1, 2015 and 2016 by a CCPC Effective January 1, 2015 1 Federal rates General corporate rate 38.0% 38.0% 38.0% Federal abatement (10.0) (10.0) (10.0) 28.0 28.0 28.0 business
Post-Secondary Education, Training and Labour August New Brunswick Minimum Wage Factsheet 2017
 Post-Secondary Education, Training and Labour August 2017 New Brunswick Minimum Wage Factsheet 2017 Contents PART 1 - Minimum Wage Rates in New Brunswick... 3 1.1 Recent History of Minimum Wage in New
CONSUMER PRICE INDEX REPORT NOVEMBER 2017
 CONSUMER PRICE INDEX REPORT NOVEMBER 2017 M A N I T O B A B U R E A U O F S T A T I S T I C S RIGHT ANSWERS RIGHT NOW December 21, 2017 CONTENTS SUMMARY CHART 1 - ANNUAL INFLATION RATE: MANITOBA AND CANADA
Labour Market Bulletin
 Labour Market Bulletin Newfoundland and Labrador 2016 This Labour Market Bulletin provides an analysis of Labour Force Survey results for the province of Newfoundland and Labrador, including the regions
TAX FACTS What s Inside. Quick Estimates. RRSP, RPP and DPSP Limits. Top Personal Rates for CPP, EI and QPIP Rates
 1 Tax Q&A: Tax Planning Strategies for Cottage Owners BDO CURRENT TO OCTOBER 1, 2018 www.bdo.ca TAX FACTS 2018 Tax Facts 2018 provides you with a summary of 2018 personal income tax rates and amounts,
Minimum Wage. This will make the minimum wage in the NWT one of the highest in Canada.
 Backgrounder Minimum Wage The Minister of Education, Culture and Employment will increase the minimum wage in the NWT to $12.50 per hour on June 1 st, 2015. This will make the minimum wage in the NWT one