The potential $2 trillion prize from longer working lives
|
|
|
- Justin Harrison
- 6 years ago
- Views:
Transcription
1
2


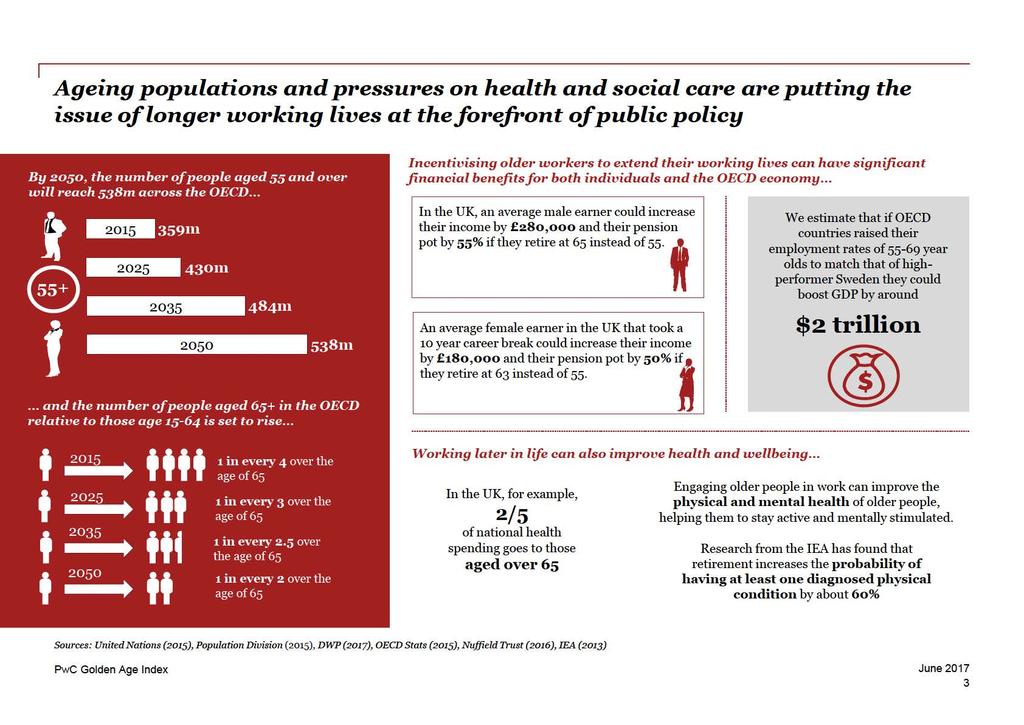
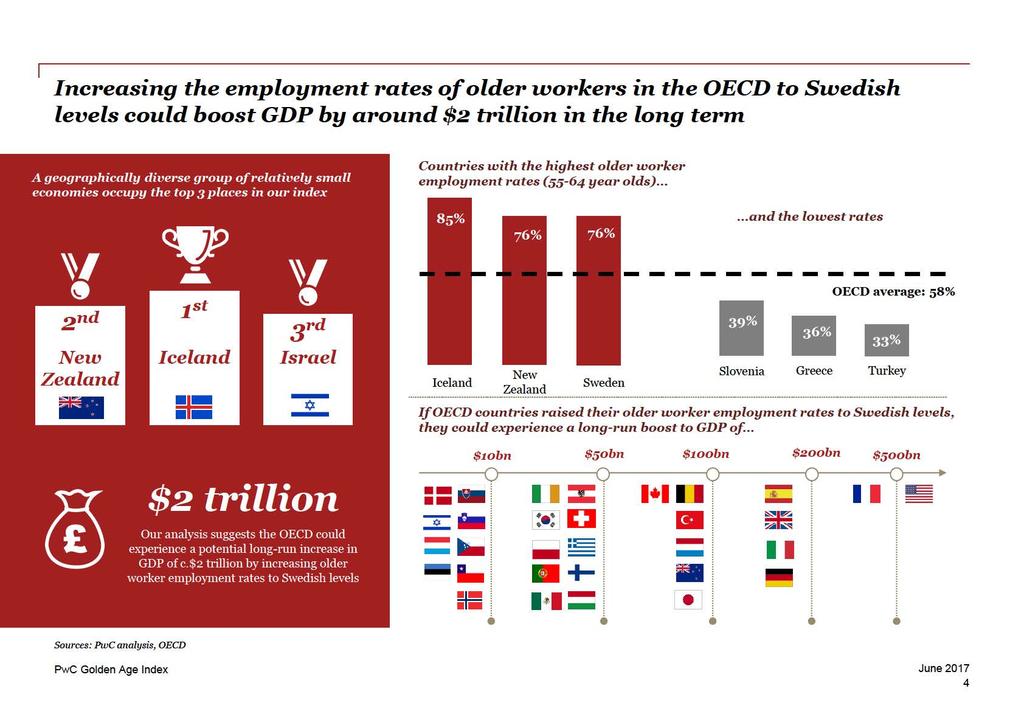
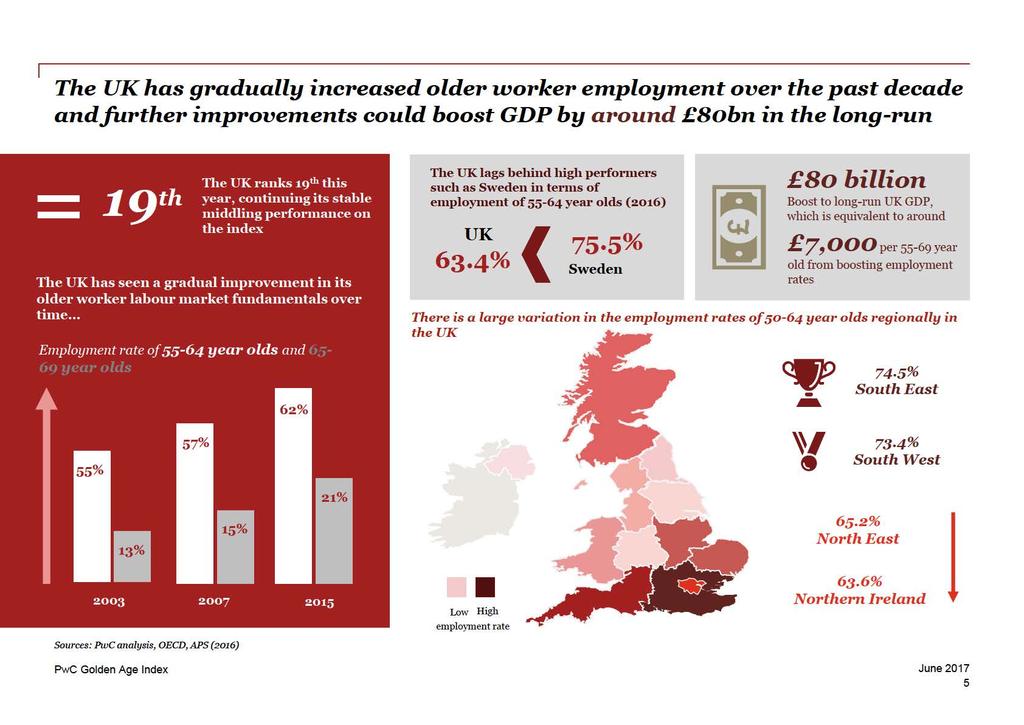
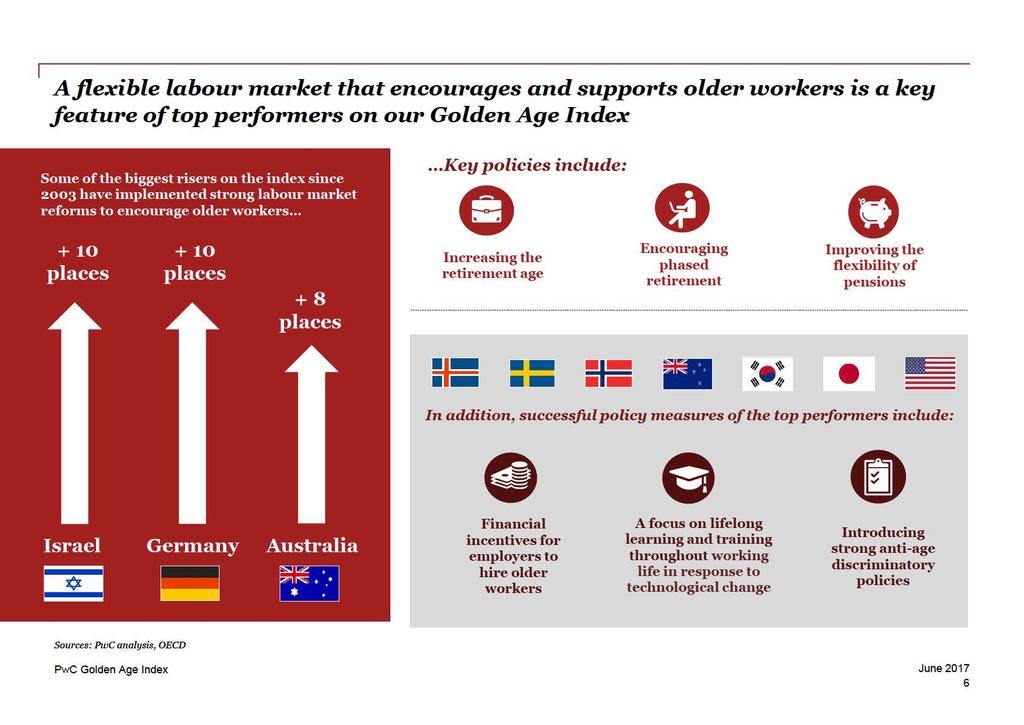
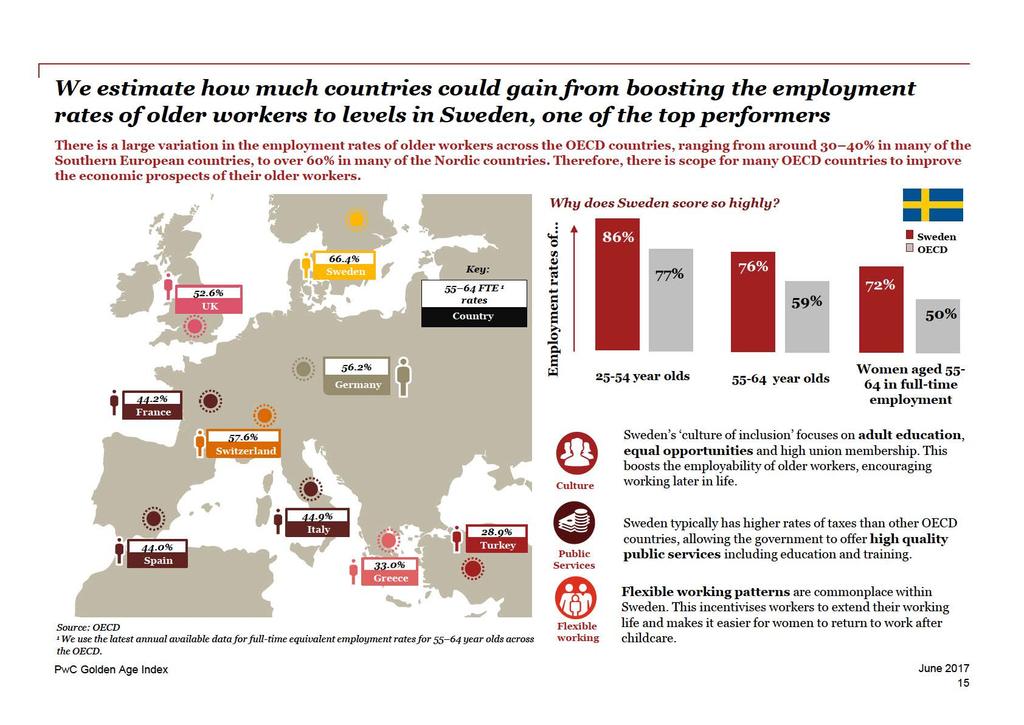
3 The potential $2 trillion prize from longer working lives Between 2015 and 2050, the number of people aged 55 and above in OECD countries will grow by almost 50% to around 538 million. It is good news that we are living longer, but rapid population ageing is already putting significant financial pressure on health, social care and pension systems and this will only increase over time. To offset these higher costs, we think older workers should be encouraged and supported to remain in the workforce for longer. This would increase GDP, consumer spending power and tax revenues. It could also help to improve the health and wellbeing of older people by keeping them mentally and physically active. We have developed our Golden Age index to quantify how far different economies are harnessing the power of their older workers. The index captures a broad range of indicators relating to the participation of older people in employment and training. We find that Iceland, New Zealand, Israel and Sweden lead the OECD on this index, with large potential economic gains if employment rates for those over 55s could be raised to those of the top performers. Specifically, across the OECD as a whole, we estimate that the potential long-term GDP gain from raising employment rates for the over 55s to Swedish levels could be around $2 trillion. Potential gains could rise as high as 16% of GDP for Greece and 13% for Belgium. For the US, they could be around 3% of GDP, or around 2% of GDP for Japan. We also consider trends in the UK in more detail in this year s report. While progress has been made over time in boosting working lives, we estimate there could be a potential 80bn boost to UK GDP in the long run if it could match Swedish performance. For governments across the OECD, the priorities include reforming pension systems and providing other financial incentives to encourage later retirement. Measures to support lifetime learning and training in the face of rapid technological progress, including automation, are also important. Our analysis suggests that policies to support older workers should not crowd out younger workers as this will boost demand as well as supply. For employers, flexible working and partial retirement options can pay dividends, as can redesign of factories, offices and roles to meet the changing needs and preferences of older workers. Reverse mentoring schemes on digital skills and extending apprenticeships to older workers also feature in the strategies of leading companies we have reviewed. I hope you find our analysis useful as a contribution to this important area of debate. Please do come back to us if you would like a more in-depth discussion of how we can help you to harness the power of older workers in your own organisation. John Hawksworth Chief Economist, PwC UK PwC Golden Age Index June

4
5
6
7
8

9
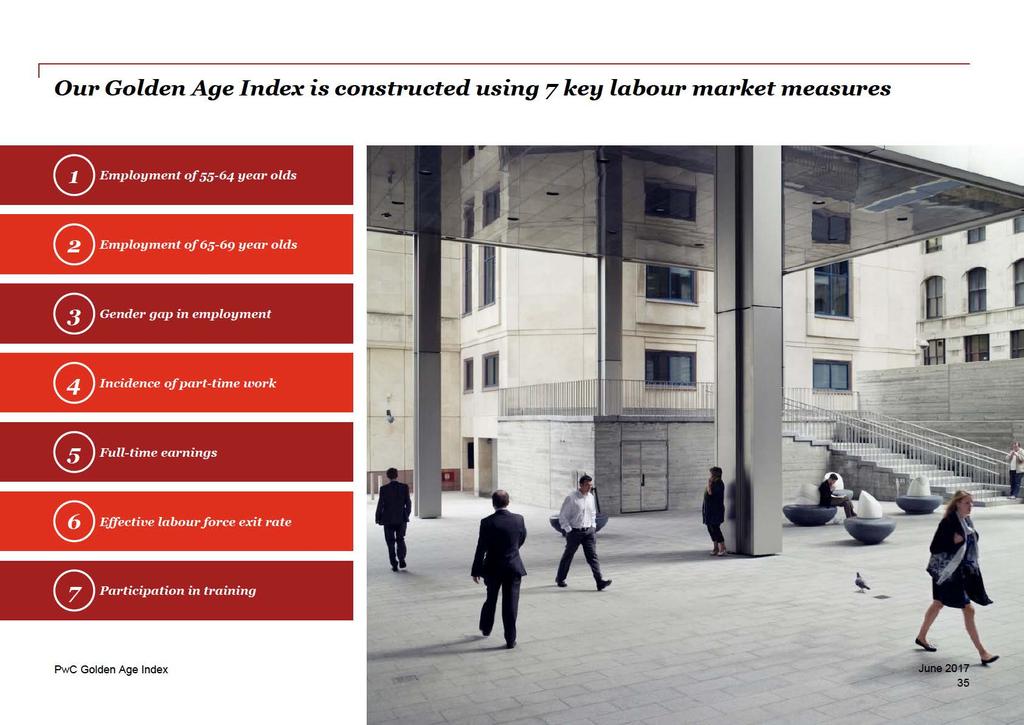
10 Our Golden Age Index takes a holistic view of the labour market for older workers across the OECD, combining indicators into one comparable metric Labour market indicators Process Labour market indicators The PwC Golden Age Index combines a broad range of labour market indicators as listed below with relative weights shown in brackets. Employment rates have the highest weights but other variables are included to present a more holistic picture: Employment rate (40%) Employment rate (20%) Gender gap in employment, 55 64: ratio women/men (10%) Incidence of part-time work (10%) Full time earnings relative to (10%) Average effective exit age from the labour force (5%) Participation in training: ratio to (5%) These indicators are normalised, weighted and aggregated to generate index scores for each country. The index scores are on a scale from 0 to 100, with the average OECD value in the base year of 2003 set to 50. However, the average index values for 2007, 2014 and 2015 can be higher or lower than this 2003 baseline. We can therefore compare how each country s performance has evolved over time in absolute terms, as well as the relative performance of countries in a particular year. See Annex for more details of the methodology. All data are taken from the OECD. We focus mostly on the age group for data reasons. We do, however, include total employment rates for year olds in the index and look at all workers over 55 in calculating potential boosts to GDP from higher employment rates for older workers. The latest data available across the broad range of countries covered are for 2015, so this is the final year covered by the index. PwC Golden Age Index June
11
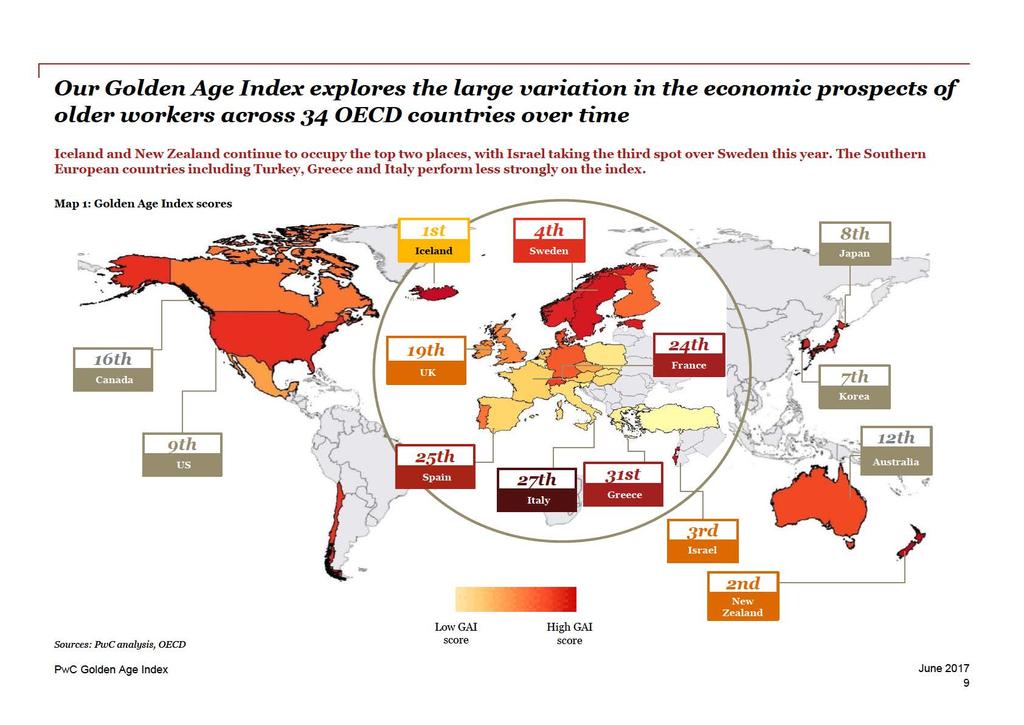
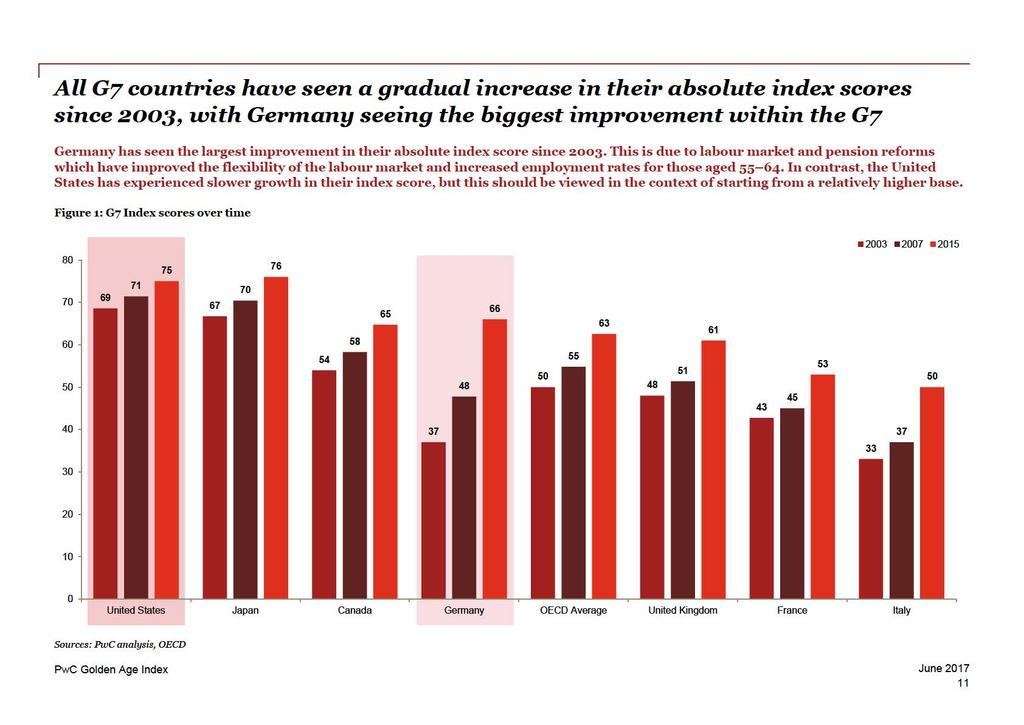
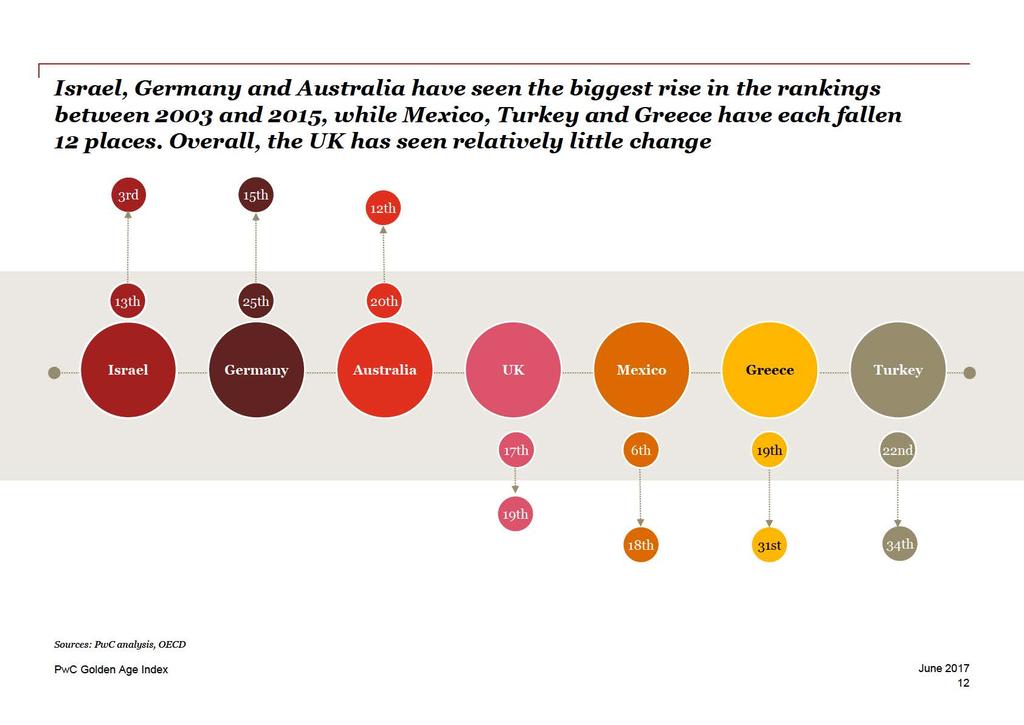
12 PwC Golden Age Index: Key results Iceland, New Zealand, Israel and Sweden take the top four places Israel continues to rise up the rankings, having gained 10 places since The United States is now only the second highest G7 country in the list as Japan has seen a relatively strong increase in its score since The UK s relative ranking has fallen slightly since 2003, despite a steady improvement in its absolute index score over time. Turkey maintains its position at the bottom of the index, having fallen 12 places since Sources: PwC analysis, OECD 1 The PwC Golden Age Index 2017 edition uses 2015 data as the latest available data. PwC Golden Age Index Ranking Country Raw index score Iceland New Zealand Israel Sweden Estonia Norway Korea Japan United States Chile Switzerland Australia Denmark Finland Germany Canada Portugal Mexico United Kingdom Ireland Czech Republic Netherlands Austria France Spain Hungary Italy Slovak Republic Poland Belgium Greece Slovenia Luxembourg Turkey OECD Average The Nordic countries continue to do very well as Iceland, Sweden and Norway all occupy a place in the top 10. The East Asian countries in our index perform strongly, with both Korea and Japan making strong improvements in their absolute index scores. Mexico has seen the biggest fall in the rankings this year, while Germany, Portugal and Ireland rise up the list. June
13
14
15
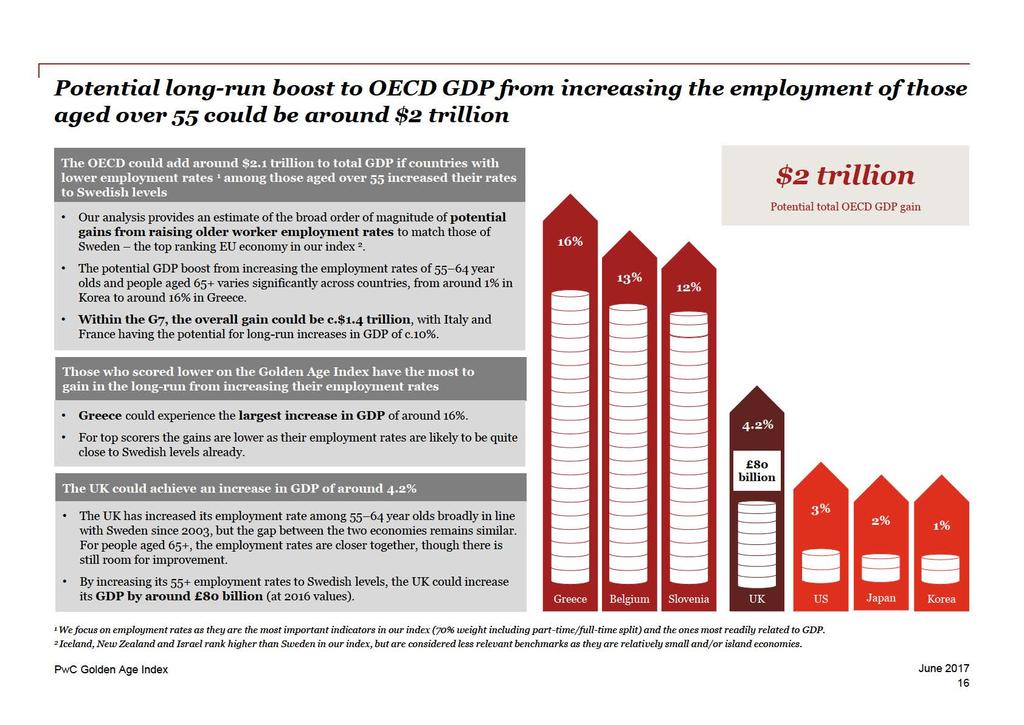
16
17
18
19 Countries scoring lower on our Golden Age Index have the most to gain from boosting employment rates for those aged over 55 to Swedish levels Figure 2: Potential long-run GDP boost Key High GDP impact (>10%) Medium GDP impact ( %) Low GDP impact (< 4.5%) Change in GDP (%) Greece Belgium Slovenia Luxembourg Turkey Italy Spain Hungary France Poland Austria Slovak Republic Netherlands Portugal Ireland Germany Finland Switzerland Czech Republic Australia Mexico United Kingdom Canada United States Denmark Chile Japan Israel Estonia Korea Norway Sources: PwC analysis, OECD Note: Iceland and New Zealand are excluded from the analysis as they have higher employment rate of 55 + year olds than Sweden. PwC Golden Age Index June

20
21
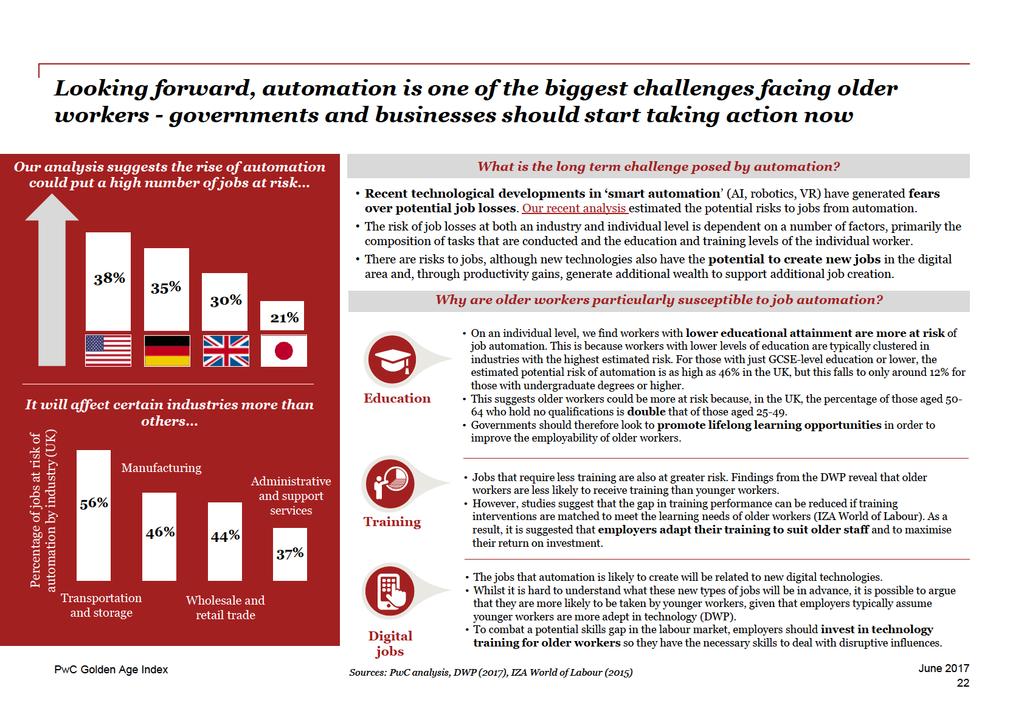
22
23
24
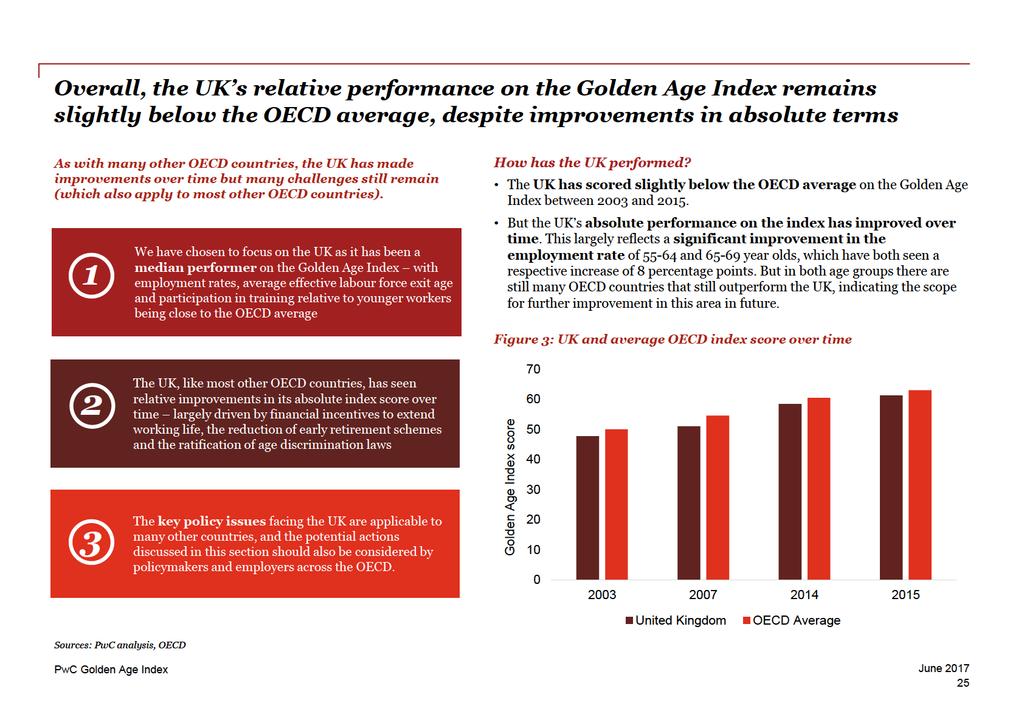
25

26
27
28
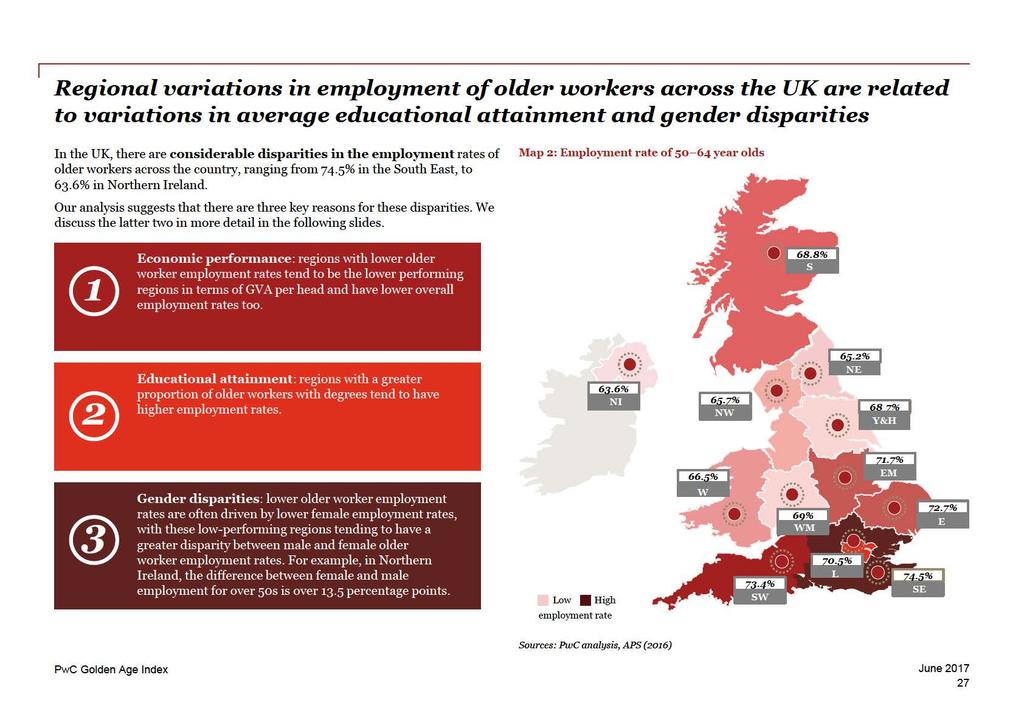
29
30
31
32 Boosting training and lifelong learning is crucial to enabling older workers to continue to have relevant and effective skills for today s workplace Analysis of the UK Labour Force Survey suggests that older workers are less likely to receive training than younger employees, with only 45% of those aged 65 and over having received one day of training in the past 12 months. This might in part be due to negative stereotyping from employers, who are not prepared to invest in the training of older workers as they anticipate they will exit the workforce sooner than younger workers. But in fact, studies have shown that the risk of an employee leaving a company after receiving training is the same across all age groups. Further, survey evidence reveals that training satisfaction was higher for those aged 60+ compared to employees aged (WERS). The difference is particularly pronounced for men, who are typically more concentrated in industries that receive less formalised training than women. Differences in the prevalence of training for older and younger workers might reflect variations in job and workplace characteristics, as younger employees with higher qualifications are more likely to work in industries that require more frequent training, such as banking and finance. Figure 7: Incidence of training of UK employees by age Percentage of UK employees surveyed receiving at least one day of training in 12 months Employee age Sources: DWP (2017), LFS (2011), WERS (2011) PwC Golden Age Index June
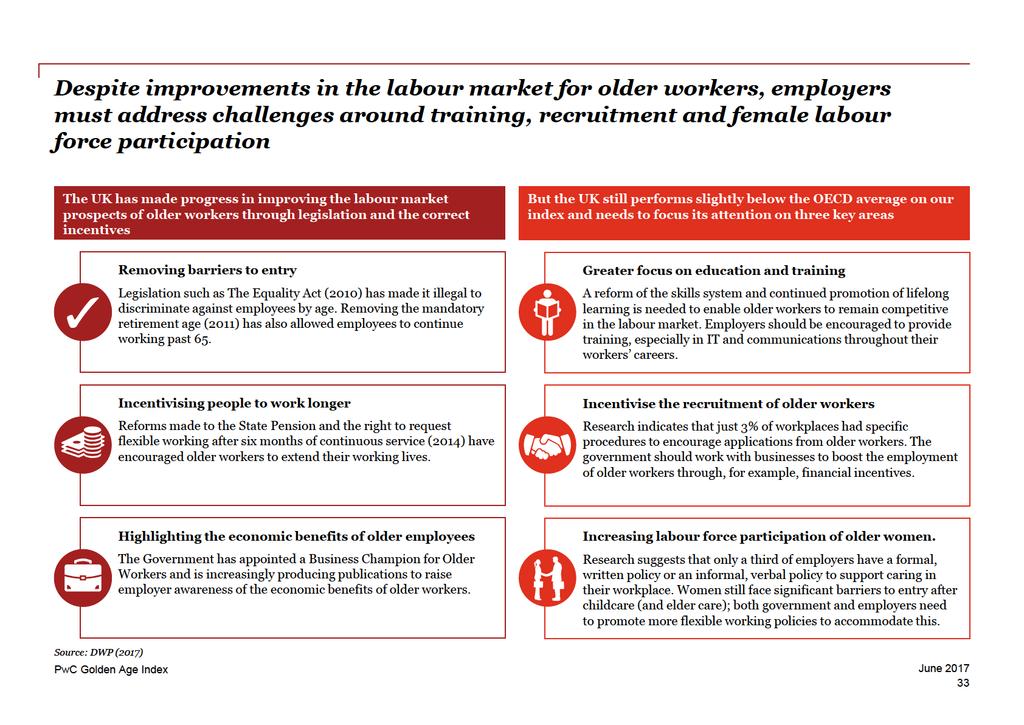
33
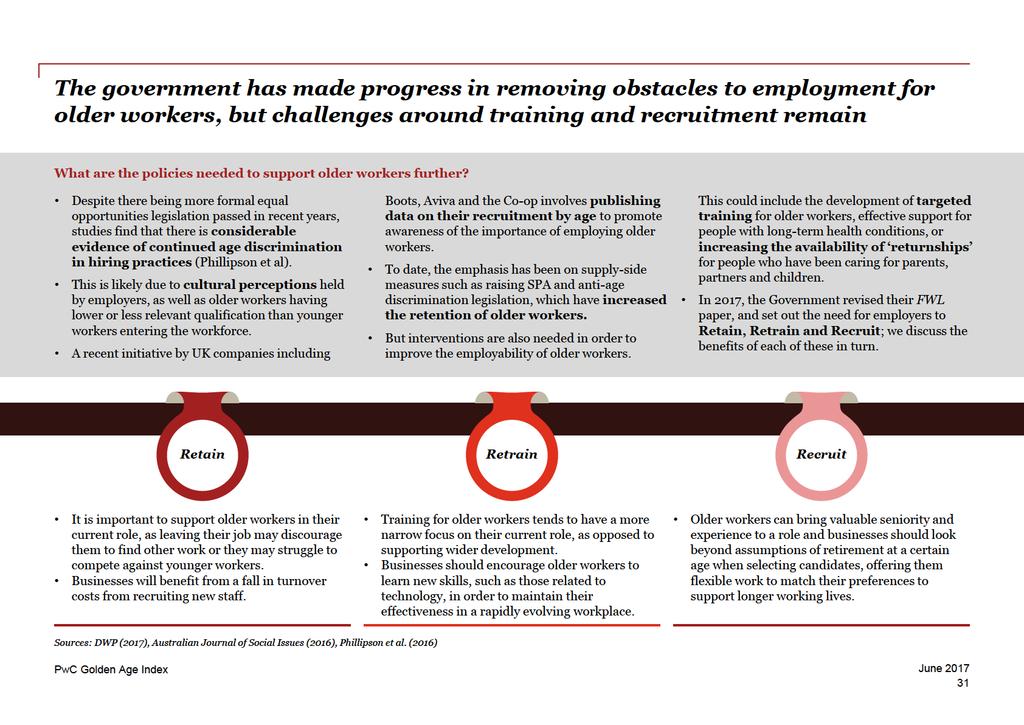
34 UK businesses are increasingly adopting policies in line with the government s strategy to Retain, Retrain and Recruit Below are three examples of employers across a range of industries that have taken measures in line with government policy to benefit from the experience of their older workers. Such policies encourage more flexible working, the promotion of older age apprenticeships and lifelong learning. The examples covered here are just illustrative many other UK companies will also be pursuing such initiatives. UK Policy Business Policy in action Retain Jaguar Land Rover JLR launched a Retirement Transition Initiative (RTI) to equip people aged over 50 with the information, networks, resilience, and opportunities to enter later life with confidence and purpose. The main programme is delivered via a two-day residential workshop to approximately 30 participants. A direct result of RTI participation was 63% began to plan their finances and 36% reconsidered when they would retire. Retrain Barclays Barclays has launched a number of initiatives to support the retraining of older workers. Their Bolder Apprenticeships scheme was introduced in 2015 with the intention of creating new employment routes for older people as well as reskilling those who have been out of work. Barclay s 12 week Welcome Back programme also helps to encourage senior-level women who ve taken a multi-year career break return to work. Barclays have also recently pledged to hire 12% more older workers by Recruit The Cooperative The Co-operative runs an apprenticeship scheme open to all ages (the oldest apprentice is currently 67) To date, the Co-op has taken on almost 400 apprentices aged 50-59, and over 60 apprentices aged over 60. The Co-op spend around 500,000 a year on top-up funding for its apprenticeship programme, as many older applicants are not eligible for government support. Source: Business in the Community (2016) PwC Golden Age Index June
35
36
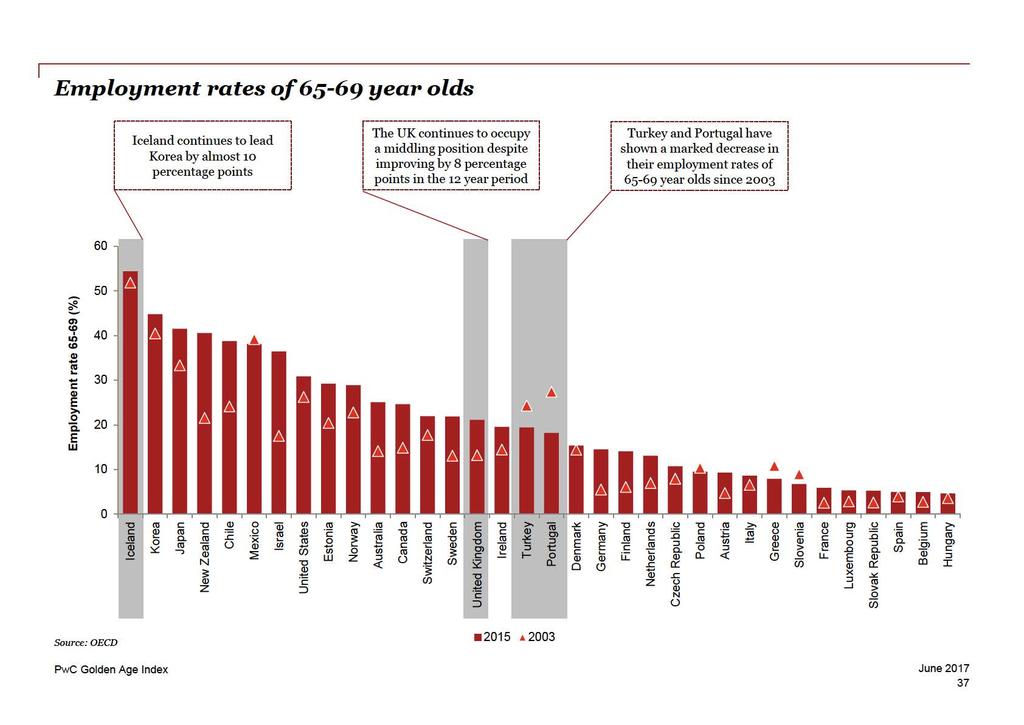
37
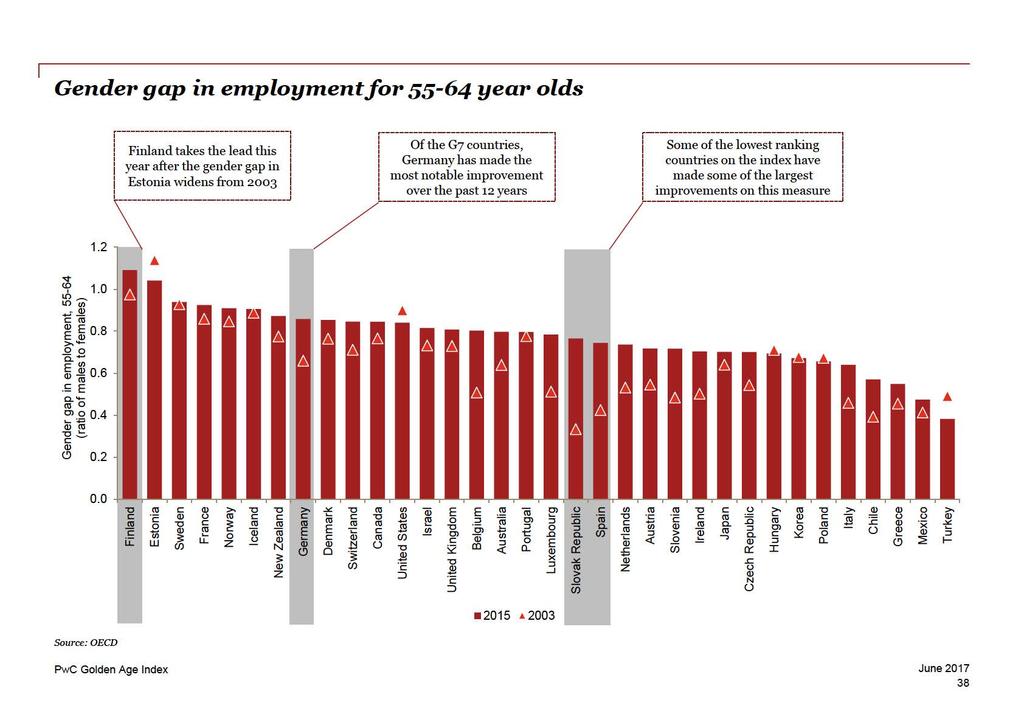
38
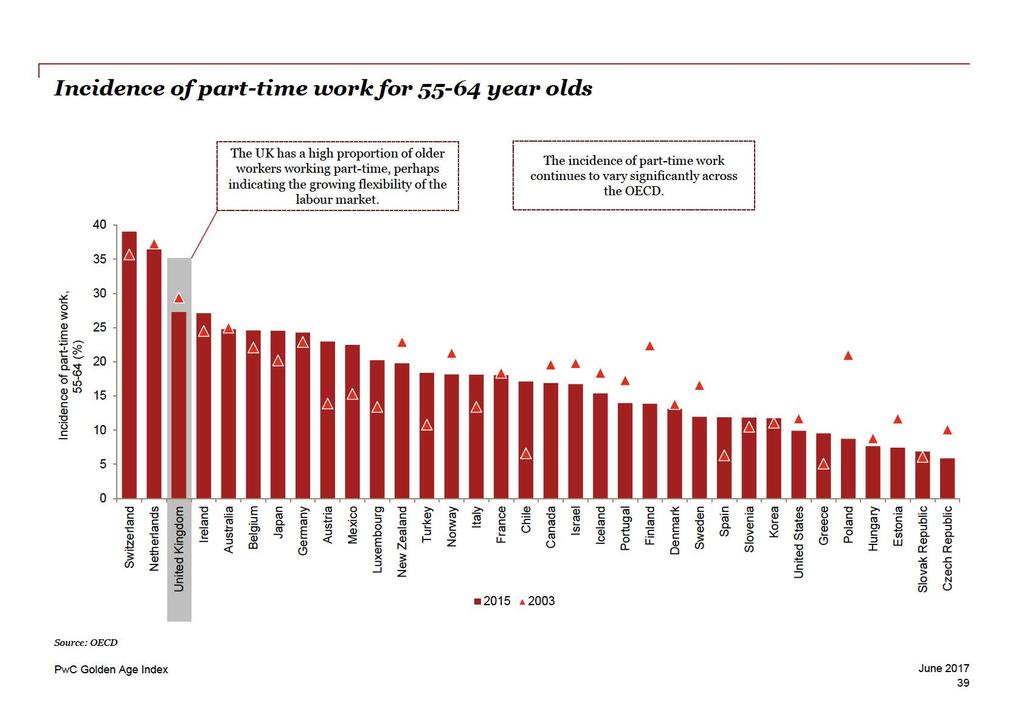
39
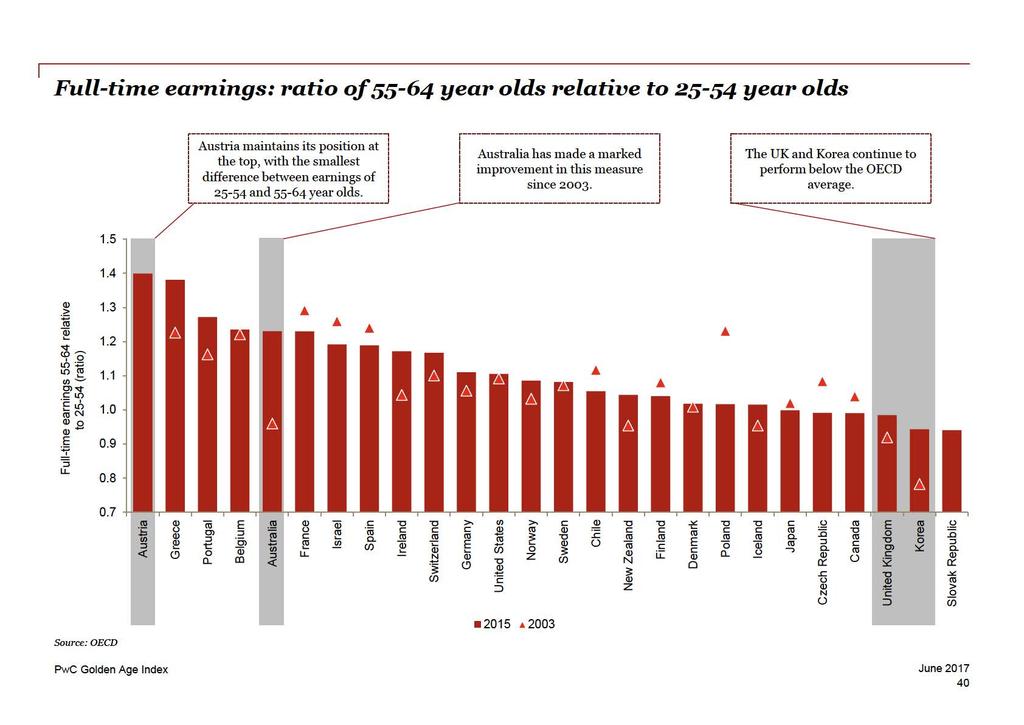
40
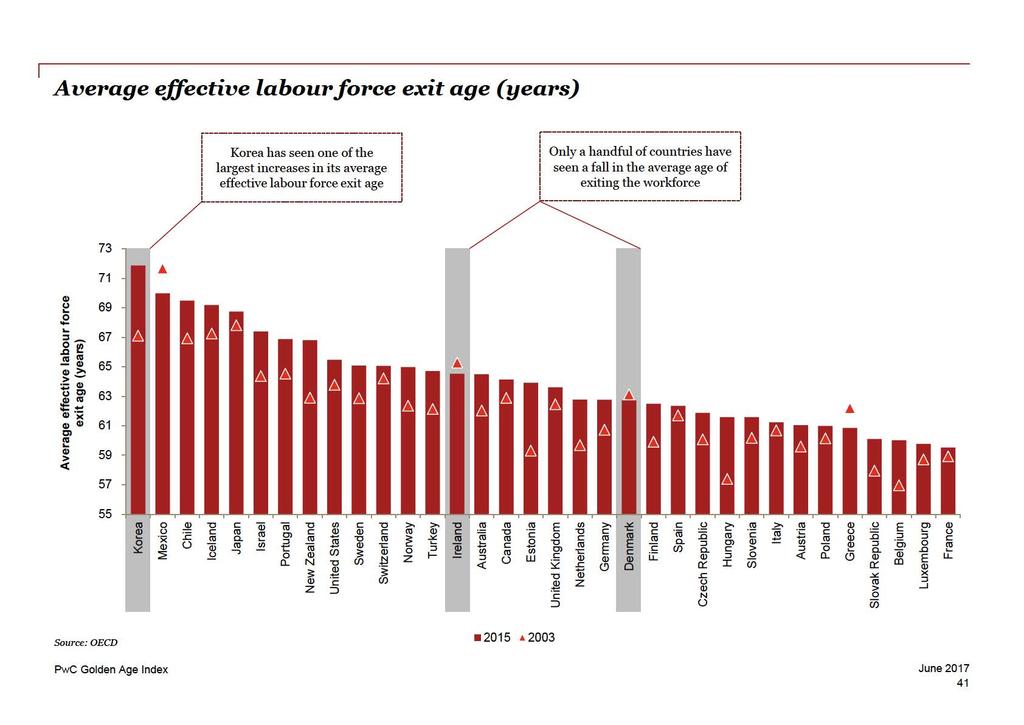
41
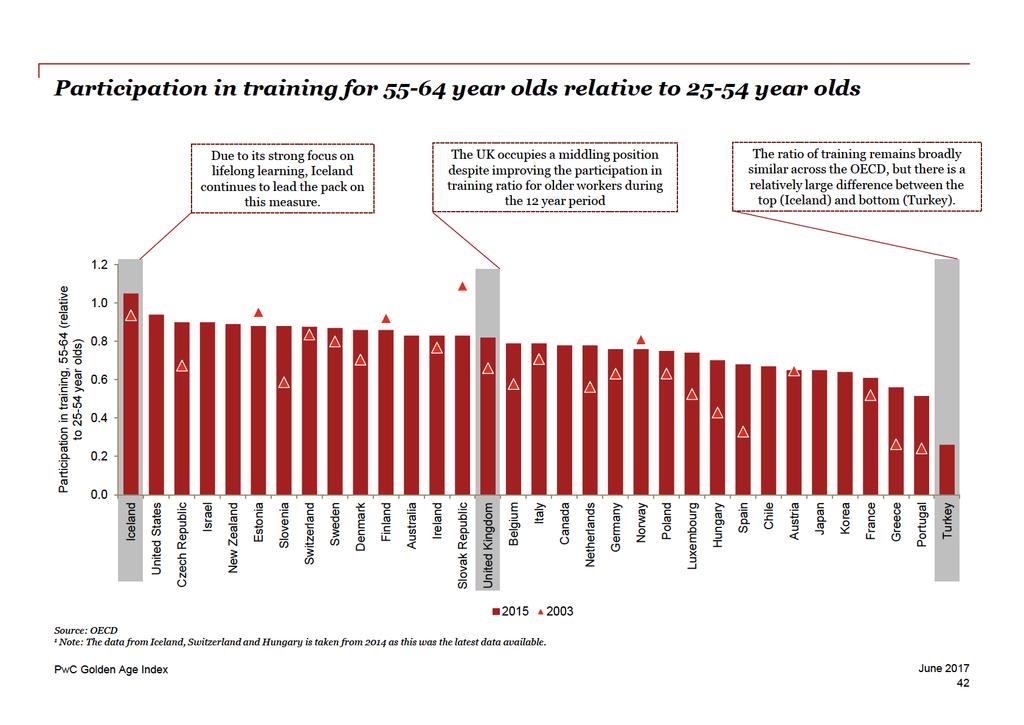
42
43
44

45
46
47
48 The clear positive correlation between our Young Workers Index and the Golden Age Index suggests that the employment of older workers does not crowd out younger workers at the economy-wide level 70 Switzerland 65 Austria Germany PwC Young Workers Index (2016) Luxembourg Poland Belgium Slovenia Netherlands Canada Australia Czech Republic Finland Hungary United Kingdom France Denmark Norway United States Israel Japan Estonia Sweden Korea Chile New Zealand Iceland 35 Turkey Slovak Republic Ireland Mexico PwC Golden Age Index (2017) Sources: PwC analysis, OECD PwC Golden Age Index June
49
50

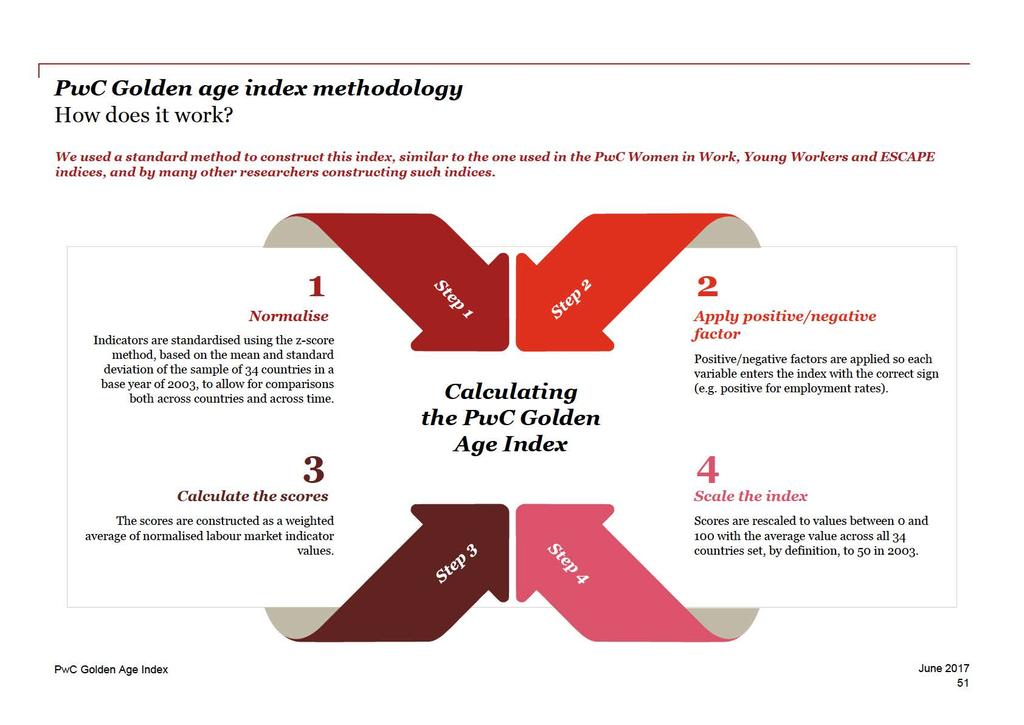
51
52 PwC Golden age index methodology Variables included in the index Indicator Weight Factor Rationale Employment rate, (% of the age group) Employment rate, (% of the age group) Gender gap in employment, (ratio women/men) Incidence of part-time work, (% of total employment) Full-time earnings, relative to (ratio) Average effective labour force exit age (years) Participation in training of age group (ratio, relative to employed persons aged 25-54) 1 40% 1 The proportion of year old workers in employment is the most important measure in our index and so has the highest weight of 40%. 20% 1 The proportion of year old workers has half the weighting of that of year old workers assuming the age group is roughly half as large in terms of population. 10% 1 Gender equality in employment is included here as lower employment rates among older women tend to be a particular feature of many OECD countries. 10% - 1 Part-time employment may adversely affect earnings, pensions and job security, but this is given a lower weight in the index since some older workers may prefer part-time work. 10% 1 Earnings equality would represent equal pay across age groups and could also be an indicator of the relative labour productivity of older workers. But it has a lower weight in the index as higher relative earnings could also price some older workers out of jobs in certain cases. 5% 1 This measures the length of time a worker stays in the labour force before they become economically inactive. However, there is some overlap with other variables such as employment rates so we do not give it too high a weight in the index. 5% 1 This is an indication of how far older workers keep learning beyond age 55, which will be important in keeping them employable and renewing their skills. But data are lacking for several countries, so we do not give this too high a weight in the index. Note: The index scores reported in this 2017 release reflect the latest OECD data. Index scores for 2003, 2007 and 2014 may have changed relative to the results in our release last year (June 2016). 1 This indicator was defined as the absolute number of year olds in training in our previous June 2015 release, but we have had to change to this for data availability reasons. However, this does not have a major impact on the overall rankings relative to two years ago. PwC Golden Age Index June
53
54 PwC Golden Age index methodology How did we calculate the potential long-term GDP increase? We break down GDP in the following way: GDP = FT * GDP per FT worker PT * GDP FT * GDP PT * GDP 65+ FT * GDP per PT worker per FT worker per PT worker per FT worker 65+ PT * GDP per PT worker Key assumptions Total employment in the economy is equal to the employment of 15 year olds and above. A full-time (FT) worker is twice as productive on average as a part-time (PT) worker, due to working twice as many hours on average. We took Sweden as a benchmark country as it is the best performing in the EU (and one of the best in the OECD) and calculated the impact on GDP if countries raised their and 65+ employment rates to Swedish levels. Sweden is a high performer in the year old employment rates category and also performs relatively well in the 65+ employment category. However, if a country has a higher full-time equivalent employment rate than Sweden in either age category, as is the case, for example, in the US and Norway for the 65+ category, we did not assume any change to the employment rate currently experienced in that country. Data Employment data by age and FT/PT split is sourced from the OECD. Due to data constraints for some countries with the employment data based on a common definition, we used FT/PT data employment based on national definitions. FT/PT employment data based on a national definition is only available for the 65+ age range, as opposed to which is used within our index. For Korea, the OECD did not provide data based on a national definition, so we used the employment data based on an OECD common definition instead (which was an option in the case of Korea). There was also no data on the FT/PT breakdown of the 65+ age group so we estimated this by applying the average change in the distribution of FT/PT workers across the OECD economies as you move from the age group to the 65+ age group to the overall employment estimate for 65+ years olds in Korea. PwC Golden Age Index June
55 Bibliography Annual Population Survey (January December 2016). Annual Survey of Hours and Earnings (2016). Business in the Community (2016), Age in the Workplace: Retain, Retrain, Recruit. Department for Work and Pensions (2017), Employer experiences of recruiting, retaining and retraining older workers: qualitative research. Department for Work and Pensions (2017), Older workers and the workplace: evidence from the Workplace Employment Relations Survey. Department for Work and Pensions (2017), Fuller Working Lives: A Partnership Approach. Department for Work and Pensions (2017), Fuller Working Lives: Evidence Base 2017). Eurofound (2012), Employment trends and policies for older workers in the recession. Eurofound (2013), Role of governments and social partners in keeping older workers in the labour market. Eurofound (2015), Germany: New Retirement Package. Harvard Business Review (2013), The Globe: How BMW Is Defusing the Demographic Time Bomb. IEA (2013), Work Longer, Live Healthier: The relationship between economic activity, health and government policy. Institute for Public Policy Research (2013), The Sandwich Generation: Older Women Balancing Work and Care. Journal for Labour Market Research (2016), The hiring and employment of older workers in Germany: A Comparative Perspective. Labour Force Survey (2011). Ministry of Business, Innovation & Employment (2017), National Survey of Employers 2014/15. OECD (2016) Statistics. OECD Older Workers Scoreboard ( - accessed May 2017). OECD (2012) Country Policy Monitoring. Office National Statistics (2015), Participation rates in the UK Older People. Resolution Foundation (2012), Unfinished Business: Barriers and opportunities for older workers. Phillipson, Vickerstaff & Lain (2016) Achieving fuller working lives: labour market and policy issues in the United Kingdom, Australian Journal of Social Issues. Picchio, Matteo (2015) Is training effective for older workers?, IZA World of Labour PwC (2017) Will robots steal our jobs? The potential impact of automation on the UK and other major economies, UK Economic Outlook The Centre for Ageing Better (2016), Age in the Workplace: Retain, Retrain, Recruit. The Guardian (2016) Ageing Britain: two-fifths of NHS budget is spent on over 65s. Workplace Employment Relations Study (2011). United Nations (2015), World Population Prospects PwC Golden Age Index June

56
57 This publication has been prepared for general guidance on matters of interest only, and does not constitute professional advice. You should not act upon the information contained in this publication without obtaining specific professional advice. No representation or warranty (express or implied) is given as to the accuracy or completeness of the information contained in this publication, and, to the extent permitted by law, PricewaterhouseCoopers LLP, its members, employees and agents do not accept or assume any liability, responsibility or duty of care for any consequences of you or anyone else acting, or refraining to act, in reliance on the information contained in this publication or for any decision based on it PricewaterhouseCoopers LLP. All rights reserved. In this document, PwC refers to the UK member firm, and may sometimes refer to the PwC network. Each member firm is a separate legal entity. Please see for further details.
Switzerland and Germany top the PwC Young Workers Index in developing younger people
 Press release Date 9 November 2015 Contact Mihnea Anastasiu Pages 5 Media Relations Manager Tel: +40 21 225 3546 Email: mihnea.anastasiu@ro.pwc.com Switzerland and Germany top the PwC Young Workers Index
PwC Golden Age Index Unlocking a potential $3.5 trillion prize from longer working lives
 www.pwc.com Unlocking a potential $3.5 trillion prize from longer working lives Contents Executive summary Key results from the Golden Age Index Potential boost to GDP from longer working lives Page 4
PRODUCTIVE AGEING ROBERT BUTLER MEMORIAL LECTURE ILC GLOBAL ALLIANCE
 PRODUCTIVE AGEING ROBERT BUTLER MEMORIAL LECTURE ILC GLOBAL ALLIANCE Dr. Ros Altmann, CBE Business Champion for Older Workers 29 October 2014 Dr Ros Altmann Twitter: @rosaltmann Website: www.rosaltmann.com
PENSIONS IN OECD COUNTRIES: INDICATORS AND DEVELOPMENTS
 PENSIONS IN OECD COUNTRIES: INDICATORS AND DEVELOPMENTS Marius Lüske Directorate for Employment, Labour and Social Affairs, OECD Lisbon, 28.09.2018 Marius.LUSKE@oecd.org www.oecd.org/els OUTLINE Talk based
Statistical annex. Sources and definitions
 Statistical annex Sources and definitions Most of the statistics shown in these tables can be found as well in several other (paper or electronic) publications or references, as follows: the annual edition
Statistical Annex ANNEX
 ISBN 92-64-02384-4 OECD Employment Outlook Boosting Jobs and Incomes OECD 2006 ANNEX Statistical Annex Sources and definitions Most of the statistics shown in these tables can be found as well in three
Statistical Annex. Sources and definitions
 Statistical Annex Sources and definitions Most of the statistics shown in these tables can also be found in two other (paper or electronic) publication and data repository, as follows: The annual edition
Corrigendum. OECD Pensions Outlook 2012 DOI: ISBN (print) ISBN (PDF) OECD 2012
 ISBN (PDF) OECD 2012") OECD Pensions Outlook 2012 DOI: http://dx.doi.org/9789264169401-en ISBN 978-92-64-16939-5 (print) ISBN 978-92-64-16940-1 (PDF) OECD 2012 Corrigendum Page 21: Figure 1.1. Average annual real net investment
OECD Pensions Outlook 2012 DOI: http://dx.doi.org/9789264169401-en ISBN 978-92-64-16939-5 (print) ISBN 978-92-64-16940-1 (PDF) OECD 2012 Corrigendum Page 21: Figure 1.1. Average annual real net investment
PwC Golden Age index Unlocking a potential $3.5 trillion prize from longer working lives
 www.pwc.com PwC Golden Age index Unlocking a potential $3.5 trillion prize from longer working lives Contents Executive summary Key results from the Golden Age Index Potential boost to GDP from longer
Ageing and employment policies: Ireland
 Ageing and employment policies: Ireland John Martin 1 Director for Employment, Labour and Social Affairs, OECD FÁS Annual Labour Market Conference, Dublin, 5 December 2005 OECD has carried out a major
OECD Report Shows Tax Burdens Falling in Many OECD Countries
 OECD Centres Germany Berlin (49-30) 288 8353 Japan Tokyo (81-3) 5532-0021 Mexico Mexico (52-55) 5281 3810 United States Washington (1-202) 785 6323 AUSTRALIA AUSTRIA BELGIUM CANADA CZECH REPUBLIC DENMARK
Sources of Government Revenue in the OECD, 2016
 FISCAL FACT No. 517 July, 2016 Sources of Government Revenue in the OECD, 2016 By Kyle Pomerleau Director of Federal Projects Kevin Adams Research Assistant Key Findings OECD countries rely heavily on
Approach to Employment Injury (EI) compensation benefits in the EU and OECD
 compensation benefits in the EU and OECD") Approach to (EI) compensation benefits in the EU and OECD The benefits of protection can be divided in three main groups. The cash benefits include disability pensions, survivor's pensions and other short-
Approach to (EI) compensation benefits in the EU and OECD The benefits of protection can be divided in three main groups. The cash benefits include disability pensions, survivor's pensions and other short-
WHAT ARE THE FINANCIAL INCENTIVES TO INVEST IN EDUCATION?
 INDICATOR WHAT ARE THE FINANCIAL INCENTIVES TO INVEST IN EDUCATION? Not only does education pay off for individuals ly, but the public sector also from having a large proportion of tertiary-educated individuals
Ways to increase employment
 Ways to increase employment Iceland Luxembourg Spain Canada Italy Norway Denmark Germany Portugal Ireland Japan Belgium Switzerland Austria Slovenia United States New Zealand Finland France Netherlands
EMPLOYABILITY AND LABOUR MARKET
 EMPLOYABILITY AND LABOUR MARKET POLICIES Guillermo MONTT Division for Employment, Analysis and Policy Directorate for Employment, Labour and Social Affairs guillermo.montt@oecd.org July 3, 2014 Skill levels
Investing for our Future Welfare. Peter Whiteford, ANU
 Investing for our Future Welfare Peter Whiteford, ANU Investing for our future welfare Presentation to Jobs Australia National Conference, Canberra, 20 October 2016 Peter Whiteford, Crawford School of
Sources of Government Revenue in the OECD, 2017
 FISCAL FACT No. 558 Aug. 2017 Sources of Government Revenue in the OECD, 2017 Amir El-Sibaie Analyst Key Findings: OECD countries rely heavily on consumption taxes, such as the value-added tax, and social
Burden of Taxation: International Comparisons
 Burden of Taxation: International Comparisons Standard Note: SN/EP/3235 Last updated: 15 October 2008 Author: Bryn Morgan Economic Policy & Statistics Section This note presents data comparing the national
InterTrade Ireland Economic Forum 25 November 2011 The jobs crisis: stylised facts and policy challenges
 InterTrade Ireland Economic Forum 25 November 2011 The jobs crisis: stylised facts and policy challenges John P. Martin Director for Employment, Labour and Social Affairs, OECD The jobs crisis An unprecedented
OECD THEMATIC FOLLOW-UP REVIEW OF POLICIES TO IMPROVE LABOUR MARKET PROSPECTS FOR OLDER WORKERS. NORWAY (situation mid-2012)
") OECD THEMATIC FOLLOW-UP REVIEW OF POLICIES TO IMPROVE LABOUR MARKET PROSPECTS FOR OLDER WORKERS NORWAY (situation mid-2012) In 2011, the employment rate for the population aged 50-64 in Norway was 1.2
OECD THEMATIC FOLLOW-UP REVIEW OF POLICIES TO IMPROVE LABOUR MARKET PROSPECTS FOR OLDER WORKERS NORWAY (situation mid-2012) In 2011, the employment rate for the population aged 50-64 in Norway was 1.2
Sources of Government Revenue in the OECD, 2018
 FISCAL FACT No. 581 Mar. 2018 Sources of Government Revenue in the OECD, 2018 Amir El-Sibaie Analyst Key Findings In 2015, OECD countries relied heavily on consumption taxes, such as the value-added tax,
Low employment among the 50+ population in Hungary
 Low employment among the + population in Hungary The role of incentives, health and cognitive capacities Janos Divenyi (Central European University) and Gabor Kezdi (Central European University and IE-CRSHAS)
TAX POLICY CENTER BRIEFING BOOK. Background. Q. What are the sources of revenue for the federal government?
 What are the sources of revenue for the federal government? FEDERAL BUDGET 1/4 Q. What are the sources of revenue for the federal government? A. About 48 percent of federal revenue comes from individual
10% 10% 15% 15% Caseload: WE. 15% Caseload: SS 10% 10% 15%
 Percentchangeincaseload 15% 10% 5% 0% 5% 10% 15% Caseload: AO 0 1 2 3 4 5 Percentchangein caseload 15% 10% 5% 0% 5% 10% 15% Caseload: NC 0 1 2 3 4 5 Years Years Percentchangein caseload 15% 10% 5% 0% 5%
LONG-TERM PROJECTIONS OF PUBLIC PENSION EXPENDITURE
 7. FINANCES OF RETIREMENT-INCOME SYSTEMS LONG-TERM PROJECTIONS OF PUBLIC PENSION EXPENDITURE Key results Public spending on pensions has been on the rise in most OECD countries for the past decades, as
Recommendation of the Council on Tax Avoidance and Evasion
 Recommendation of the Council on Tax Avoidance and Evasion OECD Legal Instruments This document is published under the responsibility of the Secretary-General of the OECD. It reproduces an OECD Legal Instrument
OECD HEALTH SYSTEM CHARACTERISTICS SURVEY 2012
 OECD HEALTH SYSTEM CHARACTERISTICS SURVEY 2012 Emily Hewlett OECD Health Data National Correspondents and Health Accounts Experts Meeting, 17 th October 2013 Health System Characteristics Survey 2012 HSC
Sources of Government Revenue in the OECD, 2014
 FISCAL FACT Nov. 2014 No. 443 Sources of Government Revenue in the OECD, 2014 By Kyle Pomerleau Economist Key Findings OECD countries rely heavily on consumption taxes, such as the value added tax, and
Indicator B3 How much public and private investment in education is there?
 Education at a Glance 2014 OECD indicators 2014 Education at a Glance 2014: OECD Indicators For more information on Education at a Glance 2014 and to access the full set of Indicators, visit www.oecd.org/edu/eag.htm.
Fiscal Policy in Japan
 Fiscal Policy in Japan - Issues and Future Directions- June 10th, 2015 Ministry of Finance General Government Gross Debt and Financial Balances (International Comparison) (%) 240 210 General Government
Assessing Developments and Prospects in the Australian Welfare State
 Assessing Developments and Prospects in the Australian Welfare State Presentation to OECD,16 November, 2016 Peter Whiteford, Crawford School of Public Policy https://socialpolicy.crawford.anu.edu.au/ peter.whiteford@anu.edu.au
Political Developments & The 2017 Tax Cut and Jobs Act
 Political Developments & The 2017 Tax Cut and Jobs Act Moderator Elizabeth Creager, AT&T Assistant Vice President for Tax Panelists Rohit Kumar, PwC Principal & Tax Policy Services Leader Jon Lieber, PwC
Private pensions. A growing role. Who has a private pension?
 Private pensions A growing role Private pensions play an important and growing role in providing for old age in OECD countries. In 11 of them Australia, Denmark, Hungary, Iceland, Mexico, Norway, Poland,
The Case for Fundamental Tax Reform: Overview of the Current Tax System
 The Case for Fundamental Tax Reform: Overview of the Current Tax System Sources of Federal Receipts Projected for 2016 Excise Taxes 2.9% Estate & Gift Taxes 0.6% Corporate Income Taxes 9.8% Other Taxes
BETTER POLICIES FOR A SUCCESSFUL TRANSITION TO A LOW-CARBON ECONOMY
 BETTER POLICIES FOR A SUCCESSFUL TRANSITION TO A LOW-CARBON ECONOMY Rintaro Tamaki Deputy Secretary-General, OECD International Forum for Sustainable Asia and the Pacific (ISAP)1 Yokohama, July 1 Four
Sources of Government Revenue across the OECD, 2015
 FISCAL FACT Apr. 2015 No. 465 Sources of Government Revenue across the OECD, 2015 By Kyle Pomerleau Economist Key Findings OECD countries rely heavily on consumption taxes, such as the value added tax,
8-Jun-06 Personal Income Top Marginal Tax Rate,
 8-Jun-06 Personal Income Top Marginal Tax Rate, 1975-2005 2005 2000 1999 1998 1997 1996 1995 1994 1993 1992 1991 1990 1989 1988 Australia 47% 47% 47% 47% 47% 47% 47% 47% 47% 47% 47% 48% 49% 49% Austria
FINANCING SMES AND ENTREPRENEURS 2016: AN OECD SCOREBOARD HIGHLIGHTS
 Hi ghl i ght s FINANCING SMES AND ENTREPRENEURS 2016: AN OECD SCOREBOARD HIGHLIGHTS I. Introduction As governments around the world continue to grapple with uncertain economic prospects and important social
Guidance on Transfer Pricing Documentation and Country-by-Country Reporting
 OECD/G20 Base Erosion and Profit Shifting Project Guidance on Transfer Pricing Documentation and Country-by-Country Reporting ACTION 13: 2014 Deliverable ANNEX II TO CHAPTER V. TRANSFER PRICING DOCUMENTATION
OECD THEMATIC FOLLOW-UP REVIEW OF POLICIES TO IMPROVE LABOUR MARKET PROSPECTS FOR OLDER WORKERS. ITALY (situation early 2012)
") OECD THEMATIC FOLLOW-UP REVIEW OF POLICIES TO IMPROVE LABOUR MARKET PROSPECTS FOR OLDER WORKERS ITALY (situation early 2012) In 2011, the employment rate for the population aged 50-64 in Italy was 5.9
OECD THEMATIC FOLLOW-UP REVIEW OF POLICIES TO IMPROVE LABOUR MARKET PROSPECTS FOR OLDER WORKERS ITALY (situation early 2012) In 2011, the employment rate for the population aged 50-64 in Italy was 5.9
EXECUTIVE SUMMARY PRIVATE PENSIONS OUTLOOK 2008 ISBN
 EXECUTIVE SUMMARY PRIVATE PENSIONS OUTLOOK 2008 ISBN 978-92-64-04438-8 In 1998, the OECD published Maintaining Prosperity in an Ageing Society in which it warned governments that the main demographic changes
Performance Budgeting (PB) in OECD Countries
 in OECD Countries") Performance Budgeting (PB) in OECD Countries Teresa Curristine, Budgeting and Public Expenditures Division, Public Governance Directorate, OECD 6 th Annual Meeting of Latin American Senior Budget Officials
Performance Budgeting (PB) in OECD Countries Teresa Curristine, Budgeting and Public Expenditures Division, Public Governance Directorate, OECD 6 th Annual Meeting of Latin American Senior Budget Officials
HEALTH LABOUR MARKET TRENDS IN OECD COUNTRIES
 HEALTH LABOUR MARKET TRENDS IN OECD COUNTRIES Michael Schoenstein, OECD Health Division 3 rd Global Health Workforce Alliance Forum Recife, 11 November 2013 Main health labour market issues in OECD countries
Workforce participation of mature aged women
 Workforce participation of mature aged women Geoff Gilfillan Senior Research Economist Productivity Commission Productivity Commission Topics Trends in labour force participation Potential labour supply
Work Capacity of Older Workers: Canada and the United States
 Work Capacity of Older Workers: Canada and the United States Kevin Milligan Vancouver School of Economics University of British Columbia Presented at NBER-CCER Conference on China and the World Economy
Programme for Government Joe Reynolds Director Programme for Government and Delivering Social Change
 Programme for Government 2016-21 Joe Reynolds Director Programme for Government and Delivering Social Change Context the rationale for change Current PfG is a list of 82 Commitments Executive record on
Introduction to Public Finance
 Introduction to Public Finance Lecture 2: Functions and size of the welfare state. Retirement, unemployment protection, health care, etc. Welfare expenditures, aging problem. 1 Outline of the lecture Basic
A Comparison of the Tax Burden on Labor in the OECD, 2017
 FISCAL FACT No. 557 Aug. 2017 A Comparison of the Tax Burden on Labor in the OECD, 2017 Jose Trejos Research Assistant Kyle Pomerleau Economist, Director of Federal Projects Key Findings: Average wage
Youth Integration into the labour market Barcelona, July 2011 Jan Hendeliowitz Director, Employment Region Copenhagen & Zealand Ministry of
 Youth Integration into the labour market Barcelona, July 2011 Jan Hendeliowitz Director, Employment Region Copenhagen & Zealand Ministry of Employment, Denmark Chair of the OECD-LEED Directing Committee
OECD Health Policy Unit. 10 June, 2001
 The State of Implementation of the OECD Manual: A System of Health Accounts (SHA) in OECD Member Countries, 2001 OECD Health Policy Unit 10 June, 2001 TABLE OF CONTENTS Summary...3 Introduction...4 Background
Empowering a new generation
 PwC Young Workers Index October 2016 Empowering a new generation How governments and businesses can unlock a $1 trillion prize Share of youth not in employment, education or training Youth unemployment
Restoring Public Finances: Fiscal and Institutional Reform Strategies
 Restoring Public Finances: Fiscal and Institutional Reform Strategies Ronnie Downes Deputy Head Budgeting & Public Expenditures Rio de Janeiro 19-20 October 2015 Studies by OECD Senior Budget Officials
Developments in the youth labour market since the GFC
 RESEARCH PAPER SERIES, 216 17 31 AUGUST 216 Developments in the youth labour market since the GFC Geoff Gilfillan Statistics and Mapping Section Executive summary Young people bore the brunt of softening
Live Long and Prosper? Demographic Change and Europe s Pensions Crisis. Dr. Jochen Pimpertz Brussels, 10 November 2015
 Live Long and Prosper? Demographic Change and Europe s Pensions Crisis Dr. Jochen Pimpertz Brussels, 10 November 2015 Old-age-dependency ratio, EU28 45,9 49,4 50,2 39,0 27,5 31,8 2013 2020 2030 2040 2050
HIGHLIGHTS 2016 OECD PERFORMANCE BUDGETING SURVEY: Integrating performance and results in budgeting
 HIGHLIGHTS 2016 OECD PERFORMANCE BUDGETING SURVEY: Integrating performance and results in budgeting This booklet presents highlights from the 2016 OECD performance budgeting survey. The data is preliminary
The OECD s Society at a Glance Simon Chapple OECD ELS/SPD Villa Vigoni, Italy, 9-11 th March 2011
 The OECD s Society at a Glance 2 Simon Chapple OECD ELS/SPD Villa Vigoni, Italy, 9- th March 2 Reconceptualisation for 2: Internal reasons OECD growth from 3 to 34 countries Other major economies (e.g.
Enterprise Europe Network SME growth outlook
 Enterprise Europe Network SME growth outlook 2018-19 een.ec.europa.eu 2 Enterprise Europe Network SME growth outlook 2018-19 Foreword The European Commission wants to ensure that small and medium-sized
The Global Financial Crisis and the Return of the Nordic Model?
 The Global Financial Crisis and the Return of the Nordic Model? Lars Calmfors Embassy of Denmark and the Swedish Institute of International Affairs 18 November Topics 1. The global economic crisis 2. Globalisation
WHAT WOULD THE NEIGHBOURS SAY?
 WHAT WOULD THE NEIGHBOURS SAY? HOW INEQUALITY MEANS THE UK IS POORER THAN WE THINK High Pay Centre About the High Pay Centre The High Pay Centre is an independent non-party think tank established to monitor
Budget repair and the size of Australia s government. Melbourne Economic Forum John Daley, Grattan Institute December 2015
 Budget repair and the size of Australia s government Melbourne Economic Forum John Daley, Grattan Institute December 2015 Budget repair and the size of Australia s government Attitudes to the best approach
Developments for age management by companies in the EU
 Developments for age management by companies in the EU Erika Mezger, Deputy Director EUROFOUND, Dublin Workshop on Active Ageing and coping with demographic change Prague, 6 September 2012 12/09/2012 1
Collective Bargaining in OECD and accession countries
 Collective Bargaining in OECD and accession countries www.oecd.org/employment/collective-bargaining.htm The, ultra-activity and retro-activity of collective agreements The detailed description of the building
Household Financial Wealth By Selected Country
 Household Financial Wealth By Selected Country US$ Trillions 60 50-37% Indicates Projected Shortfall 40 30 20 Extrapolation of Historical Growth 2003-24 Projection (Based on Demographic Trends) -47% -34%
Statistics Brief. Investment in Inland Transport Infrastructure at Record Low. Infrastructure Investment. July
 Statistics Brief Infrastructure Investment July 2015 Investment in Inland Transport Infrastructure at Record Low The latest update of annual transport infrastructure investment and maintenance data collected
V. MAKING WORK PAY. The economic situation of persons with low skills
 V. MAKING WORK PAY There has recently been increased interest in policies that subsidise work at low pay in order to make work pay. 1 Such policies operate either by reducing employers cost of employing
Turkey s Saving Deficit Issue From an Institutional Perspective
 Turkey s Saving Deficit Issue From an Institutional Perspective Engin KURUN, Ph.D CEO, Ziraat Asset Management Oct. 25th, 2011 - Istanbul 1 PRESENTATION Household and Institutional Savings Institutional
Financial wealth of private households worldwide
 Economic Research Financial wealth of private households worldwide Munich, October 217 Recovery in turbulent times Assets and liabilities of private households worldwide in EUR trillion and annualrate
Revenue Statistics Tax revenue trends in the OECD
 Revenue Statistics 2017 Tax revenue trends in the OECD OECD 2017 The OECD freely authorises the use of this material for non-commercial purposes, provided that suitable acknowledgment of the source and
DG TAXUD. STAT/11/100 1 July 2011
 DG TAXUD STAT/11/100 1 July 2011 Taxation trends in the European Union Recession drove EU27 overall tax revenue down to 38.4% of GDP in 2009 Half of the Member States hiked the standard rate of VAT since
Growth in OECD Unit Labour Costs slows to 0.4% in the third quarter of 2016
 Growth in OECD Unit Labour Costs slows to.4% in the third quarter of 26 Growth in unit labour costs (ULCs) in the OECD area slowed to.4% in the third quarter of 26 (compared with.6% in the previous quarter)
C W S S u m m i t. Dambisa Moyo 16 May 2012 London
 2 0 1 2 C W S S u m m i t Dambisa Moyo 16 May 2012 London Table of Contents I Global Labour Market Picture II Six Labour Market Drivers III The Challenges Ahead 2 Global unemployment (millions) Unemployment
Major Trends in Pension Reforms. Ambrogio Rinaldi Director, COVIP, Italy Chair, OECD Working Party on Private Pensions
 Major Trends in Pension Reforms Ambrogio Rinaldi Director, COVIP, Italy Chair, OECD Working Party on Private Pensions 6th Global Pension & Savings Conference the World Bank - Washington, DC April 2-3,
OECD HEALTH DATA 2012 DISSEMINATION AND RESULTS. Marie-Clémence Canaud OECD Health Data National Correspondents Meeting October 12, 2012
 OECD HEALTH DATA 2012 DISSEMINATION AND RESULTS Marie-Clémence Canaud OECD Health Data National Correspondents Meeting October 12, 2012 Release of OECD Health Data 2012 Released as planned, June 28 Dissemination
Economic Stimulus Packages and Steel: A Summary
 Economic Stimulus Packages and Steel: A Summary Steel Committee Meeting 8-9 June 2009 Sources of information on stimulus packages Questionnaire to Steel Committee members, full participants and observers
Public Financial Management (PFMx) Module
 Module") Public Financial Management (PFMx) Module 4 The Annual Budget Preparation and Approval This training material is the property of the International Monetary Fund (IMF) and is intended for use in IMF Fiscal
Public Financial Management (PFMx) Module 4 The Annual Budget Preparation and Approval This training material is the property of the International Monetary Fund (IMF) and is intended for use in IMF Fiscal
Trade and Development Board Sixty-first session. Geneva, September 2014
 UNITED NATIONS CONFERENCE ON TRADE AND DEVELOPMENT Trade and Development Board Sixty-first session Geneva, 15 26 September 2014 Item 3: High-level segment Tackling inequality through trade and development:
THE SEARCH FOR FISCAL SPACE AND THE NEW CHALLENGES TO BUDGETING. 34 th annual meeting of Senior Budget Officials Paris, 3-4 June, 2013
 THE SEARCH FOR FISCAL SPACE AND THE NEW CHALLENGES TO BUDGETING 34 th annual meeting of Senior Budget Officials Paris, 3-4 June, 2013 The overwhelming pressure of fiscal consolidation RPF 2012: 25 out
Aging with Growth: Implications for Productivity and the Labor Force Emily Sinnott
 Aging with Growth: Implications for Productivity and the Labor Force Emily Sinnott Emily Sinnott, Senior Economist, The World Bank Tallinn, June 18, 2015 Presentation structure 1. Growth, productivity
COVERAGE OF PRIVATE PENSION SYSTEMS AND MAIN TRENDS IN THE PENSIONS INDUSTRY IN THE OECD
 COVERAGE OF PRIVATE PENSION SYSTEMS AND MAIN TRENDS IN THE PENSIONS INDUSTRY IN THE OECD Fafo Pension Forum Oslo, 16 November 2012 Stéphanie Payet OECD Financial Affairs Division Structure of the Presentation
Securing sustainable and adequate social protection in the EU
 Securing sustainable and adequate social protection in the EU Session on Social Protection & Security IFA 12th Global Conference on Ageing 11 June 2014, HICC Hyderabad India Dr Lieve Fransen European Commission
Reporting practices for domestic and total debt securities
 Last updated: 27 November 2017 Reporting practices for domestic and total debt securities While the BIS debt securities statistics are in principle harmonised with the recommendations in the Handbook on
COMPARISON OF RIA SYSTEMS IN OECD COUNTRIES
 COMPARISON OF RIA SYSTEMS IN OECD COUNTRIES Nick Malyshev, OECD Conference on the Further Development of Impact Assessment in the European Union Brussels, RIA SYSTEMS IN OECD COUNTRIES Regulatory Impact
Gender pension gap economic perspective
 Gender pension gap economic perspective Agnieszka Chłoń-Domińczak Institute of Statistics and Demography SGH Part of this research was supported by European Commission 7th Framework Programme project "Employment
1 People in Paid Work
 1 People in Paid Work Indicator 1.1a Indicator 1.1b Indicator 1.2a Indicator 1.2b Indicator 1.3 Indicator 1.4 Indicator 1.5a Indicator 1.5b Indicator 1.6 Employment and Unemployment Trends (Republic of
MICRO-LEVEL CONSEQUENCES OF FLEXIBILITY-ENHANCING REFORMS: WORK IN PROGRESS. 22 June 2015
 MICRO-LEVEL CONSEQUENCES OF FLEXIBILITY-ENHANCING REFORMS: WORK IN PROGRESS 22 June 2015 Looking beneath the positive net effects of flexibility-enhancing reforms OECD and other empirical work has documented
3 Labour Costs. Cost of Employing Labour Across Advanced EU Economies (EU15) Indicator 3.1a
 Indicator 3.1a") 3 Labour Costs Indicator 3.1a Indicator 3.1b Indicator 3.1c Indicator 3.2a Indicator 3.2b Indicator 3.3 Indicator 3.4 Cost of Employing Labour Across Advanced EU Economies (EU15) Cost of Employing Labour
3 Labour Costs Indicator 3.1a Indicator 3.1b Indicator 3.1c Indicator 3.2a Indicator 3.2b Indicator 3.3 Indicator 3.4 Cost of Employing Labour Across Advanced EU Economies (EU15) Cost of Employing Labour
International comparison of poverty amongst the elderly
 International comparison of poverty amongst the elderly RPRC PensionBriefing 2009-1 ------------------------------------------------------------------------------------------------------- This PensionBriefing
Statistics Brief. OECD Countries Spend 1% of GDP on Road and Rail Infrastructure on Average. Infrastructure Investment. June
 Statistics Brief Infrastructure Investment June 212 OECD Countries Spend 1% of GDP on Road and Rail Infrastructure on Average The latest update of annual transport infrastructure investment and maintenance
Income support for older persons in the Republic of Korea : a perspective of older persons
 ESCAP Regional Consultation Incheon, Republic of Korea Income support for older persons in the Republic of Korea : a perspective of older persons Soo-Wan Kim (Kangnam University) 1 I. Introduction This
axia Axia Economics Civil-service pension schemes Edward Whitehouse Civil-Service World Bank core course Washington DC, April 2016
 Public Disclosure Authorized Civil-Service Civil-service pension schemes Public Disclosure Authorized Edward Whitehouse Public Disclosure Authorized World Bank core course Washington DC, April 2016 axia
Trends in Retirement and in Working at Older Ages
 Pensions at a Glance 211 Retirement-income Systems in OECD and G2 Countries OECD 211 I PART I Chapter 2 Trends in Retirement and in Working at Older Ages This chapter examines labour-market behaviour of
Trust and Fertility Dynamics. Arnstein Aassve, Università Bocconi Francesco C. Billari, University of Oxford Léa Pessin, Universitat Pompeu Fabra
 Trust and Fertility Dynamics Arnstein Aassve, Università Bocconi Francesco C. Billari, University of Oxford Léa Pessin, Universitat Pompeu Fabra 1 Background Fertility rates across OECD countries differ
Raising the retirement age is the labour market ready for active ageing: evidence from EB and Eurofound research
 Raising the retirement age is the labour market ready for active ageing: evidence from EB and Eurofound research Robert Anderson, EUROFOUND, Dublin Reforming pension systems in Europe and Central Asia
the taxation of families
 CARE RESEARCH PAPER the taxation of families international comparisons 2017 By Leonard Beighton, Don Draper and Alistair Pearson Fiscal Policy Consultants Contents Preface Acknowledgements Executive Summary
Outlook Overview: OECD Countries UN LINK Conference, Bangkok October, 2009
 Outlook Overview: OECD Countries UN LINK Conference, Bangkok 26 28 October, 2009 Dave Turner OECD, Economics Department OECD Outlook: Outline 1. Recovery underway but will probably be slow 2. Risks and
17 January 2019 Japan Laurence Boone OECD Chief Economist
 Fiscal challenges and inclusive growth in ageing societies 17 January 219 Japan Laurence Boone OECD Chief Economist G2 populations are ageing rapidly Expected life expectancy at age 65 198 215 26 Japan
The Economics of Public Health Care Reform in Advanced and Emerging Economies
 The Economics of Public Health Care Reform in Advanced and Emerging Economies Benedict Clements Fiscal Affairs Department, IMF November 2012 This presentation represents the views of the author and should
united kingdom Statistical Profile introduction to united kingdom united kingdom statistical profile no.18 january 2010
 united kingdom united kingdom united kingdom Statistical Profile Matt Flynn introduction to united kingdom Ireland Since 1992, the has had a relatively long period of economic growth and stability. However,
FCCC/SBI/2010/10/Add.1
 United Nations Framework Convention on Climate Change Distr.: General 25 August 2010 Original: English Subsidiary Body for Implementation Contents Report of the Subsidiary Body for Implementation on its