The Supply Side of the Economy
|
|
|
- Hugo Atkinson
- 6 years ago
- Views:
Transcription
1 TOPIC 2 The Supply Side of the Economy
2 Goals of Lecture 2 Introduce the supply side of the macro economy. Discuss how countries grow and why some countries grow faster than others. Discuss labor productivity o What does it mean? o How does it respond coming out of recessions? Determine how wages are set in an economy. Determine why people work. Understand where unemployment comes from. 2
3 The Production Function GDP (Y) is produced with capital (K, price-weighted) and labor (N, hours): Y = A F(K,N) Sometimes, I will modify the production function such that: Y = A F(K,N, other inputs) where other inputs include energy/oil! Realistic Example is a Cobb Douglas function for F(.): Y = A K 1-α N α A is Total Factor Productivity (TFP), an index of efficiency (technology) MUST READ: NOTES 3 (my text posted on the teaching page) on the aggregate production function 3
4 Measurement Y is GDP (measured in dollars). As noted above, we want to measure Y in real dollars.<<you should know what this means from Notes 1 of the text>>. For our Cobb Douglas production function (previous slide), N and K are both measured in dollars. N often is measured in total wage bill K often is measured as the replacement cost of capital However, in practice, N can be measured in different ways (hours worked, number of workers). Wage bill is the preferred method (takes into account skill differentials). However, we will often talk about standard of living which is income per capita (Y/N ; where Y is income and N is some population measure). 4
5 Features of the Aggregate Production Function Define MPN = Marginal Product of Labor = dy/dn Define MPK = Marginal Product of Capital = dy/dk Math Note: You should be comfortable taking these simple partial derivatives if you are not, practice this for the quizzes and exams. Diminishing Marginal Products From Cobb-Douglas: MPN = α A (K/N) 1-α = α (Y/N) Fixing A and K, MPN falls when N increases MPK = (1-α) A (N/K) α = (1-α) (Y/K) Fixing A and N, MPK falls when K increases Complementarity Across Inputs Increasing A or K, increases MPN Increasing A or N, increases MPK 5
6 Labor Share With Cobb-Douglas Labor Share of Income = Income earned by workers divided by GDP = [(W/P)*N/]Y In equilibrium, real wages of workers will equal MPN (more on this below) Substituting (W/P) = MPN into above yields: Labor Share of Income = (α) * (Y/N) * (N/Y) (MPN) = α Cobb-Douglas predicts a constant labor share of α. Historically, α was stable at a level of about 0.7 (in notes, I often just set α = 0.7). 6


7 US Labor Share: 1947Q1 2016Q2 Sharp Decline After 2000 Roughly Stable through
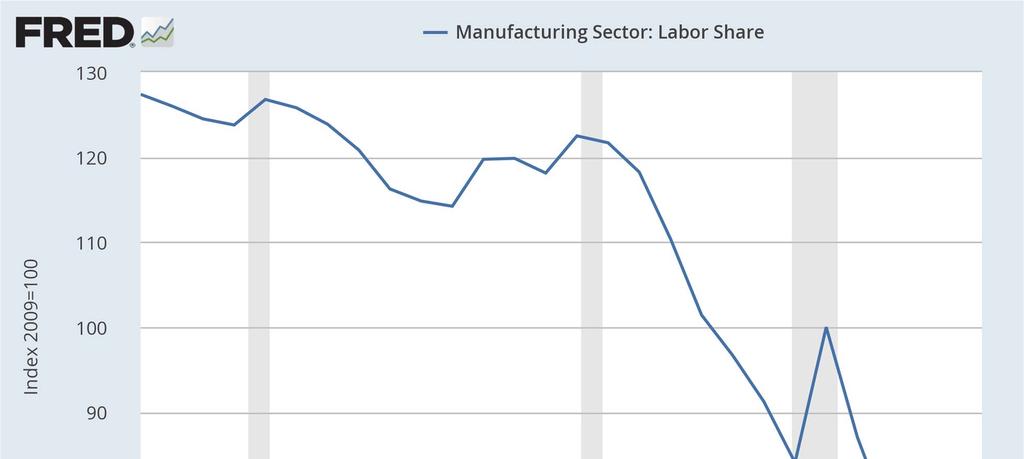
8 Manufacturing Labor Share : 1988Q1 2014Q2 8
9 Sub-Section A Economic Growth
10 Two Measures of Productivity Labor Productivity = Y/N = A (K/N) 1-α Driven by A and K/N (usually reported in press) Total Factor Productivity (TFP) = A = Y/F(K,N) Basically TFP is a catch-all for anything that affects output other than K and N. Work week of labor and capital Quality of labor and capital Regulation Infrastructure Competition Specialization Innovation (including innovation in management practices) Changes in discrimination or culture Some components of TFP tend to be pro-cyclical (Definition of Pro-cyclical: Variable increases when Y is high, decreases when Y is low) 10
11 Growth Accounting Y = A K 1-α N α (our production function) %ΔY = %ΔA + (1-α)%ΔK + α%δn Output, in a country grows from: Growth in TFP (see entrepreneurial ability, education, roads, technology, etc.) Growth in Capital (machines, equipment, plants) Growth in Hours (workforce, population, labor participation, etc). Perhaps, we care about growth in Y/pop or Y/N (per capita output). %Δ(Y/pop) = %ΔA + (1-α)%Δ(K/pop) + α%δ(n/pop) or %Δ(Y/N) = %ΔA + (1-α)%Δ(K/N) 11
12 How is TFP Measured The way TFP (A) is usually measured is via a statistical decomposition (referred to as the Solow Residual ). Remember our assumed production function: Y = AK 1-α N α Math Note: We are going to transform the production function to make it a little easier to work with (you should get comfortable with this) by taking the logs: ln(y) = ln(a) + α 0 ln(k) + α 1 ln(n) (where α 0 = 1 α 1 0.3) (1) Given that we measure Y, K and N in the data, we can estimate (1) using standard regression techniques. ln(a) is the constant from the regression. This is our standard TFP measure. 12

13 US TFP Growth: 1970Q1 2014Q1 13
14 Measuring TFP Because A (TFP) is a catch-all term for anything that affects production, the assumed production function does not impose any structure on how to measure the components of TFP. Economists are very good at measuring the extent to which TFP changes over time within a country. It is much harder to measure why TFP has changed over time. Economists try to measure this by using detailed firm-level and household-level data to measure production and wages. 14
15 How is Labor Productivity Measured Labor Productivity is easier to measure: Y/N Y is usually real GPD N is usually total hours worked 15
16 Nonfarm Business Labor Productivity Growth: 1988Q1 2017Q1 Puzzle? 16
17 Manufacturing Labor Productivity Growth: 1988Q1 2016Q2 Puzzle? 17
18 U.S. Labor Productivity Growth Over Time : 2.4% per year : 1.4% per year : 2.6% per year. ( Internet boom ) : 1.1% per year : ~0% per year Data from Robert Gordon (Professor at Northwestern) 18
19 Sub-Section A1 The Causes of Economic Growth
20 The Role of Investment and Growth Does a one time increase in investment today increase Y/N today? YES! Does a one time increase in investment today cause a sustained increase in Y/N into the future? No! Back of our mind equations: S = I + NX (From the first lecture). K(t+1) = (1-δ) K(t) + I(t) or ΔK(t, t+1) = I(t) - δ K(t) Notice the link between saving and investment. Definition of Capital Stock Evolution All else equal (i.e. holding N constant), increasing I causes K tomorrow to increase causing K/N tomorrow to increase (i.e. Y/N tomorrow increases). 20
21 Time Path of Capital Stock: One Time Increase in I K No investment No investment t+1 time Suppose there is a one time increase in investment at time t (perhaps due to an investment tax credit). Suppose no investment either prior to or after the tax credit. 21
22 Can Higher Investment Lead to Infinite Growth? Does a sustained increase in investment increase Y/N today? YES! Does a sustained increase in investment cause a sustained increase in Y/N? No! Suppose I is fixed at a high level and that K initially is sufficiently small. K grows if I > δ K: But, notice that δk is also growing each period. (Summary: To start, higher I will lead to higher K and Y/N will increase). Eventually, however, I will converge towards δk. More and more of the investment is going to replace outdated capital and the capital stock will grow by smaller and smaller rates. The increase in Y/N will converge back to zero. Summary: High levels of investment will increase the capital stock and output, but both K and Y will eventually converge to a fixed level. 22
23 Time Path of K: Permanent Increase in I K The new level of investment has successively less effect due to growing depreciation of the capital stock. No investment t+1 time Suppose there is a permanent increase in investment at time t. Suppose no investment prior to t. In all periods after t, the level of investment remains fixed at the level in t. 23
24 Can Higher Investment Growth Cause Infinite Growth? If a one time increase in I gives an increase in Y, why not continuously raise I to higher and higher amounts??? Answer: Diminishing MPK!!! MPK =.3 A (N/K).7 ; As K increases, MPK falls. As K goes to infinity, MPK goes to zero (Y stops increasing). Suppose, we keep rising I (each year), K will increase by the amount of I (after controlling for depreciation), but Y will increase by continuously smaller and smaller amounts. Remember Y = C + I + G + NX. I/Y (investment rate) is bounded by 1 (if you invest all your output). This caps the increase in I. I cannot grow forever! Continuously increasing I will NOT lead to sustained economic growth. NOTE: Investment decisions are NOT made in the dark (i.e. something must drive firm investment!) 24
25 What Causes Sustained Growth? Sustained Increases in the growth of A are the only thing that can cause a sustained growth in Y/N. Empirically, when a country exhibits faster Y/N growth.. 33% typically comes from growth in K/N 67% typically comes from growth in A (where N = employment (not hours) - limited data). 25


26 Nonfarm Business Labor Productivity Growth: 1988Q1 2017Q1 Puzzle? 26


27 Manufacturing Labor Productivity Growth: 1988Q1 2016Q2 Puzzle? 27
28 Why is US Labor Productivity/TFP Growth Lower Demographics? Slower growth in schooling? Innovations with less spill-overs on productivity (but huge spill-overs on leisure) What productivity growth we have seen replaces lower skilled workers. Contributing to inequality within the economy. Have we moved from big innovations in market productivity (electricity, assembly lines, transportation, manufacturing techniques, etc.) to big innovations in leisure technology (facebook, internet, games, etc.)? Less competition/more regulation? 28
29 New Paper of Mine The Allocation of Talent and Economic Growth Question 1: How much of the observed TFP growth in the U.S. since 1960 is due to better labor market outcomes (including human capital formation) for blacks and women? o o A better allocation of resources leads to higher economic growth. There have been large changes in the allocation of women and minorities to occupations in the labor market since Question 2: How much of the convergence of the U.S. south to the U.S. north is due to a decline in discrimination of the south? 29
30 Occupational Sorting Over Time: An Overview Fraction of group (white men, white women, black men, black women) aged working in the following occupations: Executives, Mgmt, Architects, Engineers, Math/Computer Science, Natural Scientists, Doctors, and Lawyers White Men 21.2% 23.5% White Women 3.0 (7.3) 17.4 (21.0) Black Men Black Women 1.0 (2.1) 13.0 (15.2) Data: U.S. Census and American Community Survey
31 Occupational Sorting Over Time: An Overview Where were the other groups working in 1960? 53% of working white women worked in Nursing, Teaching, Sales, Secretarial and Office Assistances, and Food Prep/Service. o The comparable number for white men was 14% (mostly sales) 55% of working black men worked as Freight/Stock Handlers, Motor Vehicle Operators, Machine Operators, Janitorial Services, and Personal Services. o The comparable number for white men was 19% 47% of working black women worked in Household Services, Personal Services, and Food Prep/Services. o The comparable number for white men was 2%
32 Wage Gaps Over Time: An Overview Log difference in annual earnings of full time workers, conditional on experience, hours and occupation controls (relative to White Men) White Women Black Men Black Women
33 Findings Macro Implications: o 25% 30% of per capita earnings in the U.S. between 1960 and 2010 was due to declining frictions for white women, black women, and black men. (Shines some light into the black box of TFP growth) o Other interesting results: - Wage growth in the 1970s and the 2000s would have been negative absent the labor market improvements for blacks and women. - About 40% of the convergence of the south to the northeast between 1960 and 1980 is due to declining labor market frictions. - Not much remaining room for growth from this mechanism. Can explain some of the slow down in productivity since 2000.
34 Another (Potentially Crazy) Idea I have on Productivity Slowdown
35 Did Early 2000 Finance Boom Cause a Fall in STEM Employment?
36 Is 3 or 4 percent growth possible? Some politicians promise growth rates of 3 or 4 percent per year? o o They do not specify but, lets suppose they mean real growth. They do not specify growth in Y or Y/N the former is possible by increasing N. Is 3 or 4 percent growth per year possible? o o o Possible maybe for short periods of time. However, given U.S. history, I do not think it is likely. Also, given current economic conditions, I do not think it is likely at all. Can Presidents and Congress affect short run growth rates? o o No! (unless we are in a recession) At best, policy makers can affect growth rates in the long run by affecting TPF. 36
37 Summary There is a productivity slowdown likely a combination of many factors. Do not believe politicians who tell you they can magically raise growth in Y/N to 3 or 4 percent per year. That is crazy talk. I would be ecstatic if we could increase growth to about 2% per year (i.e., return to our long run average). Growth in immigration (N) can increase Y but not necessarily Y/N unless it affects A. Note: Demand side factors do not affect growth conditional on A, K and N. Conditional on A, K and N, demand side factors will only affect prices. (We will prove that later in the course). 37
38 Sub-Section A2 Cross-Country Growth
39 Growth Across Countries Most developed economies grow at the same rate that the technological frontier grows. Some helpful definitions: Convergence countries inside of the technological frontier move towards the technological frontier. Divergence countries inside of the technological frontier grow at a rate less than the technological frontier. 39
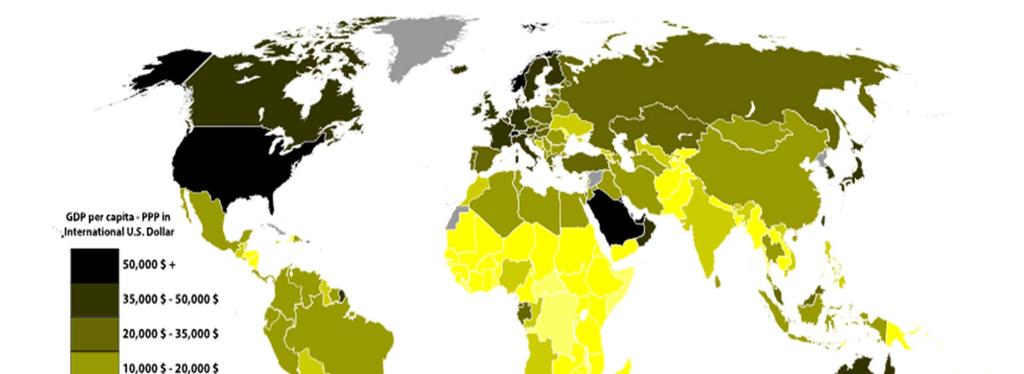

40 Distribution of World GDP in 2015 (IMF, $) 40
41 World GDP Per Capita in 2016 (IMF, $) Top 10 Other Notable Bottom 10 Qatar 127,660 Lithuania 29,972 Madagascar 1,505 Luxembourg 104,003 Portugal 28,933 Eritrea 1,410 Singapore 90,151 Russia 26,490 Guinea 1,265 Brunei 76,884 Argentina 20,047 Mozambique 1,215 Kuwait 71,887 Iraq 17,944 Malawi 1,134 Norway 69,249 China 15,399 Niger 1,107 Ireland 69,231 Brazil 15,242 Liberia 855 U.A.E 67,871 South Africa 13,225 Burundi 814 Switzerland 59,561 Ukraine 8,305 Congo, Dem. Rep. 773 USA 57,436 India 6,616 Cent Africa Rep. 652 Note: Purchasing price parity adjusted 41


42 Some Data: Distribution of World GDP in 2000 From Barro, 2003 includes 147 countries. Horizontal axis is a log scale. All data are in 1995 U.S. dollars. 42


43 Some Data: Distribution of World GDP in 1960 From Barro, 2003 includes 113 countries. Horizontal axis is a log scale. All data are in 1995 U.S. dollars. 43

44 Growth Rate of GDP Per Capita: From Barro, 2003 includes 111 countries. 44
45 GDP per Capita in the United States, the United Kingdom, and Japan, (Weil 2015) Sources: Maddison (1995), Heston, Summers, And Aten (2011).
46 The Distribution of Growth Rates, (Weil 2015)
47 Convergence of Income Across U.S. States: Historical Trends in Convergence Unadjusted Growth in Per Capita Income MS ARAL ND SD KY OK NC GA NM KS NE TN SC LA TX UT CO ID IA MO WV VA AZMNWI IN FL WY VT NH ME MT OR WA OH PA MI MD IL RI MA CA NJ NYNV CT DE Per Capita Income 1940 Fitted values gr_ipc_40_60 47
48 Convergence of Income Across U.S. States: Recent Trends in Convergence Unadjusted Growth in Per Capita Income MS AR NC GA SCND SD VT TN ME AL KY WV NM UTID LA MT NE MO IN IA AZ OK RI NH MN VA PA TX FL MI KS OH WI OR MA CO NY WAIL DE MD NJ CA NV WY CT Per Capita Income 1980 Fitted values gr_ipc_80_00 48

49 Source of GDP Growth Latin America Brazil, Chile, Columbia, Mexico, Peru, Uruguay, Bolivia, Ecuador, Paraguay, Venezuela Emerging Asia Indonesia, Malaysia, Philippines, Thailand, and China Advanced Exporters Australia, Canada, New Zealand, and Norway. From Sosa et al. (2013), IMF Report 49

50 Per Capita GDP vs. Life Expectancy (Acemoglu 2005) 50
51 Sub-Section B The Labor Market
52 Labor Market: Firm Profit Decisions In a competitive market, a firm can sell as much Y as it wants at the going price p, and can hire as much N as it wants at the going wage w. Facing w and p, a profit maximizing firm will hire N to the point were MPN = w/p (the benefit from an additional worker (in terms of additional output) must equal the cost which they are paid). <<This is straight from micro>> With Cobb-Douglas: MPN =.7 Y/N =.7 A (K/N).3 If firms maximize profits: w/p =.7 Y/N =.7 A (K/N).3 If MPN > w/p then the firm can increase profits by increasing N. If MPN < w/p then the firm can increase profits by decreasing N. Reading: Notes 4 from the supplemental notes 52
53 The Labor Demand Curve w/p * real wage N* MPN = N d N 53
54 Notes on the Labor Demand Curve N d slopes downward (N d = MPN =.7 A * (K/N).3 ) N d rises with A and K (assumed complementarity across inputs) Assumption: Y is not Fixed! Firms optimally choose N, K, Y and (to some extent) A to maximize profits. Caveat: Who says that there is a demand for more Y? Need to look at the demand side of economy (introduced last -discussed in depth throughout the course). 54
55 The Other 1/2 of the Labor Market: Labor Supply Labor Supply (N s ) Results from Individual Optimization Decisions Households compare benefits of working (additional lifetime resources) with cost of working (forgone leisure) Factors Affecting Labor Supply The Real Wage (w/p) The Household s Present Value of Lifetime Resources (PVLR) The Marginal Tax Rate on Labor Income (t n ) The Marginal Tax Rate on Consumption (t c ) Value of Leisure (reservation wage) - non- work status (VL) The Working Age Population (pop) 55
56 The Labor Supply Curve N s (PVLR, t c, t n, pop, VL) w/p N 56
57 Labor Supply Notes (Most Derived From Scratch in Lecture) In terms of wages and earnings, there is both an income and substitution effect - we will look at them separately BUT in the real world, they often occur jointly!!!! The Real Wage - HOLDING PVLR fixed: A higher w/p encourages individuals to substitute away from leisure and toward work (leisure becomes more expensive). This is a substitution effect. <<This is why the labor supply curve slopes upwards!!>> Estimating this substitution effect is difficult since PVLR is not easily held constant. Estimates range from 0-2% (For a 1% increase in after-tax w/p holding PVLR fixed, labor supply either increases by 0% or 2%). Very Wide Range little consensus. PVLR = initial wealth + present discounted value of earnings A higher PVLR induces individuals to work less (lower N s ) for a given after-tax wage, allowing them to enjoy more leisure (If leisure is preferred to work as I get richer, I can afford to work less). PVLR is net of taxes and non-work governmental transfers and inclusive of all other transfers. 57
58 Labor Supply Notes Marginal tax rate on labor income - Should have same substitution effect as the before tax real wage. Studies of the 1986 U.S. Tax Reform found that only high-earning married women worked more in response to lower marginal income tax rates. Marginal tax rate on consumption - see above Value of Leisure - If leisure/no-work becomes more/less attractive, households will work less/more (reservation wage). (Welfare programs, child care, etc.). Working Age Population: Usually defined as (Includes changes in Labor Force Participation Rates) 58
59 Recap on Labor Supply Substitution Effect: For a given PVLR, a higher after tax wage increases N S. Income Effect (This is why Labor Supply Curve Slopes Upward) For a given after-tax wage, higher PVLR decreases N s. Evidence: Weak Consensus is that, with equal (%) increase in PVLR and the after-tax wage, N s falls (income effect dominates). 59
60 Temporary Increase in A N s (PVLR, t c, t n, pop, VL) w/p w/p * N* N d (A,K) N 60
61 Permanent Increase in A N s (PVLR, t c, t n, pop, VL) w/p w/p * N* N d (A,K) N 61
62 Can Technological Progress Destroy jobs? Facts: A, N, w/p are trending up over time. N/pop is trending down (except in U.S. since 1980). Higher A countries have higher w/p and lower N/pop. Implications: Adjusting for pop, higher A goes with lower N. Higher A reduces N d and destroys jobs? - NO! Labor Demand Increases. Higher A increases PVLR and reduces N s - The Effect on Labor Supply is to fall. 62
63 Permanent Increase in Population N s (PVLR, t c, t n, pop, VL) w/p w/p * N* N d (A,K) N 63
64 Population and Jobs More People = More Jobs Employment (000s) Working-Age Population (000s) 64
65 Temporary Increase in Taxes (t c or t n ) N s (PVLR, t c, t n, pop, VL) w/p w/p * N* N d (A,K) N 65
66 Permanent Increase in Taxes (t c or t n ) N s (PVLR, t c, t n, pop, VL) w/p w/p * N* N d (A,K) N 66
67 Labor Market Equilibrium (in long run!) We define Long Run Equilibrium in macroeconomics as occurring when the labor market clears. By definition, long run macro equilibrium exists when N = N*. At N*, labor demand = labor supply. So, by definition, all workers who want a job (the suppliers) are able to find a firm looking for a worker (the demanders). Implies that cyclical unemployment = zero at N*. Long run equilibrium is characterized by zero cyclical unemployment! It is an equilibrium in that there is no incentive for real wages to change at N* Real wages (w/p) has two components: nominal wages (w) and the price level (p). Note: Y* (by definition) = A K.3 (N*).7 Y* is the long run equilibrium level of output (output where labor market is in equilibrium) 67
68 Our First Aggregate Supply Curve. Suppose prices (p) increase. What happens in the labor market? In terms of equilibrium, nothing happens! Increasing prices have no effect on labor demand (A and K do not change). Increasing prices have no effect on labor supply (taxes, population, etc. do not change). You may ask Doesn t PVLR change when prices increase??? No! As long as nominal wages adjust, real wages will be unchanged when p increases. The % change in prices will be match exactly by the % change in nominal wages real wages will not change (so PVLR will not change). No effect on labor supply. Key: Because real wages will not change, changes in prices will have NO effect on the labor market (i.e., it will have no effect on N*). Conclusion: Changing prices will have NO effect on Y* (since N* is constant). 68
69 Our First Aggregate Supply Curve p LRAS Long Run Aggregate Supply Curve Y* Y If labor market clears, changes in prices will lead to equal changes in nominal wages. As a result, there will be no change in N* and hence, no change in Y*. Leads to a vertical LRAS curve. Prices do not affect production in the long run! 69
70 What Shifts Y*? (the LRAS) Anything that affects the labor market will affect Y*! If N* increases, Y* will shift to the right. If N* decreases, Y* will shift to the left. Summary: Y* will shift right if: A increases K increases population increases labor income taxes fall (and income effect is small relative to substitution effect) labor income taxes rise (and income effect is large relative to substitution effect) Note: The long run aggregate supply curve (LRAS) is NOT the labor supply curve. We have lots of different markets in this class. There will be lots of different supply and demand curves. You need to keep track of them! 70
71 Things to Remember! The demand side of the economy is NOT important for determining Y*! All we need to know is A, K and N and we know Y*! The demand side of the economy is not important for economic growth! Key: If I ever ask you about what determines Y* (i.e., output/income/expenditure in the long run), you should think about A, K and the labor market. As a rule, K will be fixed unless I tell you otherwise (for simplicity, you will see why soon). Why do we care about the demand side of the economy? In the long run, prices will be determined by demand. Also, LRAS is dependent on labor market being in equilibrium. In the short run, labor market need not be in equilibrium. Demand will determine output in the SHORT RUN! 71
72 Summary. In the long run when labor markets clear. Supply side of economy (labor market, K, A, other inputs like oil) determines output. Demand side of economy (C+I+G+NX) will determine prices. In the short run when labor markets do not clear: Demand and Supply jointly determine prices and output (think of the simple examples I gave graphically in the lecture for topic 1). Three outstanding issues (we will get to them soon): When is the labor market NOT in equilibrium? What does the supply curve look like when labor market doesn t clear? What determines demand? 72
73 When are Labor Markets in Disequilibrium? Labor market is in disequilibrium when labor demand is not equal to labor supply. Any time labor demand = labor supply, there is no cyclical unemployment (by definition)! Nominal wages do not adjust to clear the labor market We refer to this as sticky wages. Because of wage contracts (and uncertainty), nominal wages do not always adjust immediately. Need a model for short-run disequilibrium --- we will do that in Topic 6. 73
74 Distribution of 12 month Wage Change, Stayers Hourly Salaried Percent Wage Change (%, 12-month) Percent Wage Change (%, 12-month) Note: Large mass at zero 35% of hourly and 33% of salaried unchanged Note: Hardly any wage cuts 1.5% of hourly and 3% of salaried
75 Distribution of 12 month Wage Change, Excluding Zeros 2009 Post-2010 Percent Wage Change (%, 12-month) Percent Wage Change (%, 12-month) Wage cuts more likely to occur during the Great Recession 5.5% overall, 9.1% for salaried in 2009 vs 2.1% and 3.0% in
76 Cyclical Unemployment in Labor Markets When do we get cyclical unemployment in our models? Cyclical unemployment occurs when there are no jobs available (labor demand) for those with the skills and the desire to work (labor supply) at current wages. Cyclical unemployment occurs only in disequilibrium! (when desired labor demand < desired labor supply - at given wages) N s w /p b a Unemployment N d N(1) N(0) 76
Principles of Macroeconomics Lecture Notes L3-L4 (Production and the labor market.) Veronica Guerrieri
 Veronica Guerrieri") Principles of Macroeconomics Lecture Notes L3-L4 (Production and the labor market.) Veronica Guerrieri Page 1 of 51 TOPIC 2 The Supply Side of the Economy Page 2 of 51 Goals of Topic 2 Introduce the Supply
Principles of Macroeconomics Lecture Notes L3-L4 (Production and the labor market.) Veronica Guerrieri Page 1 of 51 TOPIC 2 The Supply Side of the Economy Page 2 of 51 Goals of Topic 2 Introduce the Supply
Goals of Topic 2. Introduce the Supply Side of the Macro Economy: 1. Production Function. 2. Labor Market: Labor Demand.
 TOPIC 2 The Supply Side of the Economy Goals of Topic 2 Introduce the Supply Side of the Macro Economy: 1. Production Function 2. Labor Market: Labor Demand Labor Supply Equilibrium Wages and Employment
Goals. Introduce the supply side of the economy. Discuss how countries grow and why some grow faster than others
 The Supply Side TOPIC 2 Goals Introduce the supply side of the economy Discuss how countries grow and why some grow faster than others Discuss total factor productivity and labor productivity Discuss how
The Supply Side of the Economy
 The Supply Side of the Economy Topic 2 1 Macroeconomics 309 - Lecture 2 Goals of Lecture 2 PART 1 Introduce the Supply Side of the Macro Economy. Discuss how countries grow and why some countries grow
2016 Workers compensation premium index rates
 2016 Workers compensation premium index rates NH WA OR NV CA AK ID AZ UT MT WY CO NM MI VT ND MN SD WI NY NE IA PA IL IN OH WV VA KS MO KY NC TN OK AR SC MS AL GA TX LA FL ME MA RI CT NJ DE MD DC = Under
PRODUCER ANNUITY SUITABILITY TRAINING REQUIREMENTS BY STATE As of September 11, 2017
 PRODUCER ANNUITY SUITABILITY TRAINING REQUIREMENTS BY STATE As of September 11, 2017 This document provides a summary of the annuity training requirements that agents are required to complete for each
Texas Mid-Year Economic Outlook: Strong Growth Continues
 Texas Mid-Year Economic Outlook: Strong Growth Continues Keith Phillips Assistant Vice President and Senior Economist 9/27/18 The views expressed in this presentation are strictly those of the presenter
Comparative Revenues and Revenue Forecasts Prepared By: Bureau of Legislative Research Fiscal Services Division State of Arkansas
 Comparative Revenues and Revenue Forecasts 2010-2014 Prepared By: Bureau of Legislative Research Fiscal Services Division State of Arkansas Comparative Revenues and Revenue Forecasts This data shows tax
Older consumers and student loan debt by state
 August 2017 Older consumers and student loan debt by state New data on the burden of student loan debt on older consumers In January, the Bureau published a snapshot of older consumers and student loan
Oregon: Where Taxes Are Low, Fees Are High and Revenue Is Slightly Below Average
 Issue Brief March 6, 2012 Oregon: Where Taxes Are Low, Fees Are High and Revenue Is Slightly Below Average The money we pay in fees and taxes helps create jobs, build a strong economy, and preserve Oregon
Texas Economic Outlook: Cruising in Third Gear
 Texas Economic Outlook: Cruising in Third Gear Keith Phillips Assistant Vice President and Senior Economist 1/19/17 The views expressed in this presentation are strictly those of the presenter and do not
TCJA and the States Responding to SALT Limits
 TCJA and the States Responding to SALT Limits Kim S. Rueben Tuesday, January 29, 2019 1 What does this mean for Individuals under TCJA About two-thirds of taxpayers will receive a tax cut with the largest
Zions Bank Economic Overview
 Zions Bank Economic Overview Jackson Hole Mountain Resort March 20, 2018 National Economic Conditions When Good News is Bad News Is Good News?? Dow Tops 26,000 Up 44% Since 2016 Election Source: Wall Street
The Acquisition of Regions Insurance Group. April 6, 2018
 The Acquisition of Regions Insurance Group April 6, 2018 Forward-Looking Statements This presentation contains "forward-looking statements" within the meaning of the Private Securities Litigation Reform
Local Anesthesia Administration by Dental Hygienists State Chart
 Education or AK 1981 General Both Specific Yes WREB 16 hrs didactic; 6 hrs ; 8 hrs lab AZ 1976 General Both Accredited Yes WREB 36 hrs; 9 types of AR 1995 Direct Both Accredited/ Board Approved No 16 hrs
Massachusetts Budget and Policy Center
 Progressive Massachusetts 2013 Policy Conference March 24, 2013 Lasell College Newton, MA Presentation by Massachusetts Budget and Policy Center Our State Budget: Building a Better Future Together Massachusetts
Yolanda K. Kodrzycki New England Public Policy Center Federal Reserve Bank of Boston
 The Growing Instability of Revenues over the Business Cycle: Putting the New England States in Perspective Yolanda K. Kodrzycki New England Public Policy Center Federal Reserve Bank of Boston Lincoln Institute
Property Tax Relief in New England
 Property Tax Relief in New England January 23, 2015 Adam H. Langley Senior Research Analyst Lincoln Institute of Land Policy www.lincolninst.edu Property Tax as a % of Personal Income OK AL IN UT SD MS
Eye on the South Carolina Housing Market presented at 2008 HBA of South Carolina State Convention August 1, 2008
 Eye on the South Carolina Housing Market presented at 28 HBA of South Carolina State Convention August 1, 28 Robert Denk Assistant Staff Vice President, Forecasting & Analysis 2, US Single Family Housing
ehealth, Inc Fall Cost Report for Individual and Family Policyholders
 ehealth, Inc. 2010 Fall Cost Report for and Family Policyholders Table of Contents Page Methodology.................................................................. 2 ehealth, Inc. 2010 Fall Cost Report
The Global Macroeconomy:
 The Global Macroeconomy: Some Things We ve Been Working on in Chicago 1 Brent Neiman University of Chicago May 2018 1 and at the institutions of my outstanding co-authors on the work discussed here, including
SIGNIFICANT PROVISIONS OF STATE UNEMPLOYMENT INSURANCE LAWS JANUARY 2008
 U.S. DEPARTMENT OF LABOR EMPLOYMENT AND TRAINING ADMINISTRATION Office Workforce Security SIGNIFICANT PROVISIONS OF STATE UNEMPLOYMENT INSURANCE LAWS JANUARY 2008 AL AK AZ AR CA CO CT DE DC FL GA HI /
Who s Above the Social Security Payroll Tax Cap? BY NICOLE WOO, JANELLE JONES, AND JOHN SCHMITT*
 Issue Brief September 2011 Center for Economic and Policy Research 1611 Connecticut Ave, NW Suite 400 Washington, DC 20009 tel: 202-293-5380 fax: 202-588-1356 www.cepr.net Who s Above the Social Security
2018 National Electric Rate Study
 2018 National Electric Rate Study Ranking of Typical Residential, Commercial and Industrial Electric Bills LES Administrative Board June 15, 2018 Emily N. Koenig Director of Finance & Rates 1 Why is the
The Lincoln National Life Insurance Company Term Portfolio
 The Lincoln National Life Insurance Company Term Portfolio State Availability as of 7/16/2018 PRODUCTS AL AK AZ AR CA CO CT DE DC FL GA GU HI ID IL IN IA KS KY LA ME MP MD MA MI MN MS MO MT NE NV NH NJ
State Trust Fund Solvency
 Unemployment Insurance State Trust Fund Solvency National Employment Law Project Conference - Washington DC December 7, 2009 Robert Pavosevich pavosevich.robert@dol.gov Unemployment Insurance Program
State Treatment of Social Security Treatment of Pension Income Other Income Tax Breaks Property Tax Breaks
 State-By-State Tax Breaks for Seniors, 2016 State Treatment of Social Security Treatment of Pension Income Other Income Tax Breaks Property Tax Breaks AL Payments from defined benefit private plans are
Old Dominion University 2013 National Economic Outlook
 Old Dominion University 2013 National Economic Outlook January 30, 2013 Professor Vinod Agarwal Professor Mohammad Najand Professor Gary A. Wagner www.odu.edu/forecasting 1 Presentation Outline 2012 Scorecard
Nevada Labor Market Briefing: January Summary of Labor Market Economic Indicators
 Nevada Labor Market Briefing: January 2019 Summary of Labor Market Economic Indicators Department of Employment, Training, & Rehabilitation Dr. Tiffany Tyler-Garner, Director Dennis Perea, Deputy Director
Tax Breaks for Elderly Taxpayers in the States in 2016
 AL Payments from defined benefit private plans are exempt; most public systems are exempt; military and US Civil service are exempt Special Homestead ion for 65+ +25.2% +2.4% AK No PIT Homestead ion for
Texas Economic Outlook: Strong Growth Continues
 Texas Economic Outlook: Strong Growth Continues Keith Phillips Assistant Vice President and Senior Economist 1/23/18 The views expressed in this presentation are strictly those of the presenter and do
Zions Bank Economic Overview
 Zions Bank Economic Overview Utah League of Cities and Towns June 18, 2018 Utah Economic Conditions CA 0.6% OR 1.4% WA 1.7% NV 2.0% Utah Population 3 rd Fastest Growing in U.S. ID 2.2% UT 1.9% AZ 1.6%
Cost and Coverage Implications of the ACA Medicaid Expansion: National and State by State Analysis
 Cost and Coverage Implications of the ACA Medicaid Expansion: National and State by State Analysis Report Authors: John Holahan, Matthew Buettgens, Caitlin Carroll, and Stan Dorn Urban Institute November
2016 GEHA. dental. FEDVIP Plans. let life happen. gehadental.com
 2016 GEHA dental FEDVIP Plans let life happen gehadental.com Smile, you re covered, with great benefits and a large national network. High maximum benefits $25,000 for High Option Growing network of dentists
Unemployment Insurance Benefit Adequacy: How many? How much? How Long?
 Unemployment Insurance Benefit Adequacy: How many? How much? How Long? Joel Sacks, Deputy Commissioner Washington State Employment Security Department March 1, 2012 1 Outline How many get unemployment
Florida 1/1/2016 Workers Compensation Rate Filing
 Florida 1/1/2016 Workers Compensation Rate Filing Kirt Dooley, FCAS, MAAA October 21, 2015 1 $ Billions 4.0 3.5 3.0 2.5 2.0 1.5 1.0 0.5 0.0 Florida s Workers Compensation Premium Volume 2.368 0.765 0.034
Report to Congressional Defense Committees
 Report to Congressional Defense Committees The Department of Defense Comprehensive Autism Care Demonstration December 2016 Quarterly Report to Congress In Response to: Senate Report 114-255, page 205,
Percent of Employees Waiving Coverage 27.0% 30.6% 29.1% 23.4% 24.9%
 Number of Health Plans Reported 18,186 3,561 681 2,803 3,088 Offer HRA or HSA 34.0% 42.7% 47.0% 39.7% 35.0% Annual Employer Contribution $1,353 $1,415 $1,037 $1,272 $1,403 Percent of Employees Waiving
Q2. Relative to other nations, how do you believe U.S.fourth graders rank in terms of their reading and math ability?
 Top Line Results Just Facts 2018 U.S. Nationwide Survey - Unweighted Results Conducted: 10/02/2018 through 10/13/2018 Survey Type: Live Interview Telephone N = 1,000N Margin of Error at 95% Confidence
SCHIP: Let the Discussions Begin
 Figure 0 SCHIP: Let the Discussions Begin Diane Rowland, Sc.D. Executive Vice President, Henry J. Kaiser Family Foundation and Executive Director, Kaiser Commission on for Alliance for Health Reform February
Patient Protection and. Affordable Care Act: The Impact on Employers
 Patient Protection and Affordable Care Act: The Impact on Employers April 2013 Agenda Introductions Individual Mandate Healthcare Exchange Overview Impact on Employers Essential Health Benefits Fees &
Mississippi s Business Monitoring The State s Economy
 Mississippi s Business January 2012 Monitoring The State s Economy ECONOMY AT A GLANCE Volume 70 - Number 1 A Publication of the University Research Center, Mississippi Institutions of Higher Learning
State of the Automotive Finance Market
 State of the Automotive Finance Market A look at loans and leases in Q4 2017 Presented by: Melinda Zabritski Sr. Director, Financial Solutions www.experian.com/automotive 2018 Experian Information Solutions,
Fiduciary Tax Returns
 Functions and Procedures Index Books On Line Main Directory Overview... 2 How does it work?... 3 What Information is transmitted to the Tax Service?... 4 How do I initiate this service?... 8 Do I have
A Perspective from the Federal Reserve Institute of Internal Auditors San Antonio Chapter August 19, 2015 Blake Hastings Senior Vice President
 A Perspective from the Federal Reserve Institute of Internal Auditors San Antonio Chapter August 19, 215 Blake Hastings Senior Vice President The views expressed in this presentation are strictly those
DOWNLOAD OR READ : DEVELOPMENT OF THE INCOME SMOOTHING LITERATURE VOL 4 A FOCUS ON THE UNITED STATES PDF EBOOK EPUB MOBI
 DOWNLOAD OR READ : DEVELOPMENT OF THE INCOME SMOOTHING LITERATURE 1893 1998 VOL 4 A FOCUS ON THE UNITED STATES PDF EBOOK EPUB MOBI Page 1 Page 2 development of the income smoothing literature 1893 1998
MEMORANDUM. SUBJECT: Benchmarks for the Second Half of 2008 & 12 Months Ending 12/31/08
 MEMORANDUM TO: FROM: HR Investment Center Members Matt Cinque, Managing Director DATE: March 12, 2009 SUBJECT: Benchmarks for the Second Half of 2008 & 12 Months Ending 12/31/08 Please find enclosed the
Award-Winning Mobility Solutions
 Award-Winning Mobility Solutions Simone Van der Schalk, Manager, Expatriate Management, ConocoPhillips (US) L. Dianne Robinson, Sr. Stock Administrator, Google (US) Scott Schapiro, KPMG Principal - Employment
The State Tax Implications of Federal Tax Reform Legislation
 The State Tax Implications of Federal Tax Reform Legislation Executive Committee Task Force on State and Local Taxation Phoenix, Arizona January 14, 2017 Joe Crosby, Multistate Associates Karl Frieden,
Questions about. storytelling and the craft of news data visualization
 Population with a BA degree or higher Percentage of obese people DC 45% 40% States with a larger percentage of people with higher education than with obesity States with a larger percentage of obese people
The welfare state in the US and Europe: why so different?
 The welfare state in the US and Europe: why so different? Rodolfo Debenedetti Lecture November 20th, 2002 Alberto Alesina Harvard University and IGIER Bocconi Question: Why there is less redistribution
Plunging Crude Prices: Impact on U.S. and State Economies
 Plunging Crude Prices: Impact on U.S. and State Economies Mine Yücel Senior Vice President and Director of Research August 7, 215 Oil and gas prices plunge Nominal price, $, weekly 16 14 12 Oil Price 1
States and Medicaid Provider Taxes or Fees
 March 2016 Fact Sheet States and Medicaid Provider Taxes or Fees Medicaid is jointly financed by states and the federal government. Provider taxes are an integral source of Medicaid financing governed
Taxing Food for Home Consumption
 Taxing Food for Home Consumption Taxing the Poor: Road Map Regional differences in income poverty & poverty related outcomes Historical patterns of property tax Emergence of supermajority rules Growth
The Entry, Performance, and Viability of De Novo Banks
 The Entry, Performance, and Viability of De Novo Banks Yan Lee and Chiwon Yom* FEDERAL DEPOSIT INSURANCE CORPORATION *The views expressed here are solely of the authors and do not necessarily reflect the
Obamacare in Pictures. Visualizing the Effects of the Patient Protection and Affordable Care Act
 Visualizing the Effects of the Patient Protection and Affordable Care Act Fall 2012 expands dependence on government health care dumps millions into Medicaid and creates new federal subsidies for government-approved
Regional Economic Update
 Regional Economic Update Roberto Coronado Assistant Vice President in Charge and Sr. Economist July 23, 2015 The views expressed in this presentation are strictly those of the authors and do not necessarily
Medicare Alert: Temporary Member Access
 Medicare Alert: Temporary Member Access Plan Sponsor: Coventry/Aetna Medicare Part D Effective Date: Jan. 12, 2015 Geographic Area: National If your pharmacy is a Non Participating provider in the Aetna/Coventry
AN IN-DEPTH LOOK AT NAFTA. August
 IMPLICATIONS OF U.S. TRADE POLICIES: AN IN-DEPTH LOOK AT NAFTA August 2018 1 1990 1991 1992 1993 1994 1995 1996 1997 1998 1999 2000 2001 2002 2003 2004 2005 2006 2007 2008 2009 2010 2011 2012 2013 2014
Road Map to this Lecture
 Economic Growth 1 Road Map to this Lecture 1. Steady State dynamics: 1. Output per capita 2. Capital accumulation 3. Depreciation 4. Steady State 2. The Golden Rule: maximizing welfare 3. Total Factor
2018 ADDENDUM INSTRUCTIONS
 2018 ADDENDUM INSTRUCTIONS FEBRUARY 22, 2019 UPDATE: 2018 MUNICIPAL REFERENCE BOOK 1. DELAWARE funds are listed on page 15. You may note on page 15 to see the addendum for additional Delaware funds. The
Indexed Universal Life Caps
 Indexed Universal Life Caps Effective March 15, 2013, the caps on FG Life-Elite II will be changing as follows: Cap Illustrative Rate 100% Participation Annual Point-to-Point 14.75% 8.32% 140% Participation
Notes 6: Examples in Action - The 1990 Recession, the 1974 Recession and the Expansion of the Late 1990s
 Notes 6: Examples in Action - The 1990 Recession, the 1974 Recession and the Expansion of the Late 1990s Example 1: The 1990 Recession As we saw in class consumer confidence is a good predictor of household
Age of Insured Discount
 A discount may apply based on the age of the insured. The age of each insured shall be calculated as the policyholder s age as of the last day of the calendar year. The age of the named insured in the
Online Appendix for: Consumption Reponses to In-Kind Transfers: Evidence from the Introduction of the Food Stamp Program
 Online Appendix for: Consumption Reponses to In-Kind Transfers: Evidence from the Introduction of the Food Stamp Program Hilary W. Hoynes University of California, Davis and NBER hwhoynes@ucdavis.edu and
PROSEGUR. FY 2018 Results Presentation
 1 PROSEGUR FY 2018 Results Presentation 2 Highlights of the Period Sustained Growth Total revenues 3,939 million Growth in local currency terms: 8% Inorganic growth in all three business lines Cash Strong
Real Gross Domestic Product
 Real Gross Domestic Product 6 5 4 3 2 1 0-1 -2-3 -4-5 -6-7 -8-9 Percent change from previous quarter at annual rate Q3 4.1% 6 5 4 3 2 1 0-1 -2-3 -4-5 -6-7 -8-9 -10 2005 2006 2007 2008 2009 2010 2011 2012
Taxing Investment Income in the States New Hampshire Fiscal Policy Institute 2 nd Annual Budget and Policy Conference Concord, NH January 23, 2015
 Taxing Investment Income in the States New Hampshire Fiscal Policy Institute 2 nd Annual Budget and Policy Conference Concord, NH January 23, 2015 Norton Francis State and Local Finance Initiative Urban-Brookings
Alternative Paths to Medicaid Expansion
 Alternative Paths to Medicaid Expansion Robin Rudowitz Kaiser Commission on Medicaid and the Uninsured Kaiser Family Foundation National Health Policy Forum March 28, 2014 Figure 1 The goal of the ACA
Domestic violence funding reduced from $1,253,000 to $1,000,000. $53,000 to fund elder law hotline eliminated.
 Court Fees and Fines and State Appropriations by State* 2009-10 Amounts, Major Changes from 2009 Legislative Sessions Noted Revised 3/8/10 (**See note below related to court fees and fines) State Court
Charles Gullickson (Penn Treaty/ANIC Task Force Chair), Richard Klipstein (NOLHGA)
, Richard Klipstein (NOLHGA)") MEMO DATE: TO: Charles Gullickson (Penn Treaty/ANIC Task Force Chair), Richard Klipstein (NOLHGA) FROM: Vincent L. Bodnar, ASA, MAAA RE: Penn Treaty Network American Insurance Company and American Network
MEMO DATE: TO: Charles Gullickson (Penn Treaty/ANIC Task Force Chair), Richard Klipstein (NOLHGA) FROM: Vincent L. Bodnar, ASA, MAAA RE: Penn Treaty Network American Insurance Company and American Network
TOPIC 4 Economi G c rowth
 TOPIC 4 Economic Growth Growth Accounting Growth Accounting Equation Y = A F(K,N) (production function). GDP Growth Rate =!Y/Y Growth accounting equation:!y/y =!A/A +! K!K/K +! N!N/N Output, in a country
The Economics of Homelessness
 15 The Economics of Homelessness Despite frequent characterization as a psychosocial problem, the problem of homelessness is largely economic. People who become homeless have insufficient financial resources
Administrative handbook Aetna Funding Advantage SM
 Quality health plans & benefits Healthier living Financial well-being Intelligent solutions Administrative handbook Aetna Funding Advantage SM For self-insured groups with less than 100 eligible employees
PLAN TODAY AND HELP SECURE YOUR FUTURE.
 PLAN TODAY AND HELP SECURE YOUR FUTURE. GROUP LONG TERM CARE INSURANCE Underwritten by Genworth Life Insurance Company 38682CV 01/28/07 38682CV_SCPMG 03/01/14 This brochure contains educational information
Benefits-At-A-Glance Plan Year
 Benefits-At-A-Glance 2015 Plan Year This report shows 2015 TriNet Passport benefit year plan options available in: AK, AL, AR, AZ, CA, CO, CT, DC, DE, FL, GA, HI, IA, ID, IL, IN, KS, KY, LA, MA, MD, ME,
Federal Tax Reform NCSL Executive Committee Task Force on State and Local Taxation Jackson, Wyoming June 16, 2017
 Federal Tax Reform NCSL Executive Committee Task Force on State and Local Taxation Jackson, Wyoming June 16, 2017 Rachelle Bernstein, National Retail Federation Joe Crosby, Multistate Associates, Karl
International Macroeconomics
 Slides for Chapter 3: Theory of Current Account Determination International Macroeconomics Schmitt-Grohé Uribe Woodford Columbia University May 1, 2016 1 Motivation Build a model of an open economy to
Jane Carter, Labor Economist III American Federation of State, County and Municipal Employees (AFSCME)
") Jane Carter, Labor Economist III American Federation of State, County and Municipal Employees (AFSCME) Why Are They Outsourcing? Desperate government is our best customer. There will be a lot of desperate
Jane Carter, Labor Economist III American Federation of State, County and Municipal Employees (AFSCME) Why Are They Outsourcing? Desperate government is our best customer. There will be a lot of desperate
Utah Land Title Association Economic Overview February 1, 2016
 Utah Land Title Association Economic Overview February 1, 2016 Utah is One of the Fastest Growing CA 0.9% States in the Country Percent Change in Population for States: 2012 to 2013 WA 1.1% OR 0.8% NV
Federal Tax Reform Impact on 2019 Legislative Sessions: GILTI
 Federal Tax Reform Impact on 2019 Legislative Sessions: GILTI Executive Committee Task Force on State and Local Taxation Scottsdale, Arizona November 17, 2018 Karl Frieden, COST Deborah Bierbaum, AT&T
Black Knight Mortgage Monitor
 Black Knight Mortgage Monitor Mortgage Market Performance Observations Data as of May, 2014 Month-end Black Knight First Look May 2014 Total U.S. loan delinquency rate (loans 30 or more days past due,
Just The Facts: On The Ground SIF Utilization
 Just The Facts: On The Ground SIF Utilization The Access 4 Learning Community (A4L), previously the SIF Association, has changed its brand name due to the fact that the majority of its 3,000 members represent
Insured Deposit Program. Updated 03/31/2017
 Insured Deposit Program Welcome to the FDIC Insured Deposit Program. Under this program, available cash balances (from security transactions, dividend and interest payments and other activities) in your
A. FORM W-9 REQUEST FOR TAXPAYER IDENTIFICATION NUMBER (TIN) AND CERTIFICATION (Please type or print) Legal Name of Entity (must match TIN)
 AND CERTIFICATION (Please type or print) Legal Name of Entity (must match TIN)") VENDOR STATEMENT OF BUSINESS AND LEGAL RELATIONSHIPS The Railroad is required by IRS guidelines to obtain a Form W-9 from all payees. This substitute form is designed to fulfill the Form W-9 information
VENDOR STATEMENT OF BUSINESS AND LEGAL RELATIONSHIPS The Railroad is required by IRS guidelines to obtain a Form W-9 from all payees. This substitute form is designed to fulfill the Form W-9 information
ECON MACROECONOMIC PRINCIPLES Instructor: Dr. Juergen Jung Towson University. J.Jung Chapter 8 - Economic Growth Towson University 1 / 64
 ECON 202 - MACROECONOMIC PRINCIPLES Instructor: Dr. Juergen Jung Towson University J.Jung Chapter 8 - Economic Growth Towson University 1 / 64 Disclaimer These lecture notes are customized for the Macroeconomics
Comments and Thoughts on Senate Tax Legislation Senate Hearing March 4, 2015
 Comments and Thoughts on Senate Tax Legislation Senate Hearing March 4, 2015 Dale Craymer Texas Taxpayers and Research Association 400 West 15 th Street Austin, Texas 78701 www.ttara.org Page 2 TTARA For:
Streamlined Sales Tax Governing Board and Business Advisory Council Update
 Streamlined Sales Tax Governing Board and Business Advisory Council Update Charles Collins, ADP Fred Nicely, Council On State Taxation Craig Johnson, Streamlined Sales Tax Governing Board NCSL SALT Taskforce
The Great Recession of 2008
 State Revenue Collection through the Great Recession Michael F. Thompson, Ph.D.: Assistant Professor of Sociology, University of North Texas The Great Recession of 2008 caused a major blow to the economic
2018 Texas Economic Outlook: Firing on All Cylinders
 218 Texas Economic Outlook: Firing on All Cylinders Keith Phillips Assistant Vice President and Senior Economist 4/5/218 The views expressed in this presentation are strictly those of the presenter and
RLI TRANSPORTATION A Division of RLI Insurance Company 2970 Clairmont Road, Suite 1000 Atlanta, GA Phone: Fax:
 RLI TRANSPORTATION A Division of RLI Insurance Company 2970 Clairmont Road, Suite 1000 Atlanta, GA 30329 Phone: 404-315-9515 Fax: 404-315-6558 AGENCY/BROKER PROFILE Please type your answers. Use a separate
Corporate Income Tax and Policy Considerations
 Corporate Income Tax and Policy Considerations Presentation by Richard Anklam, Executive Director, New Mexico Tax Research Institute To The Interim Revenue Stabilization and Tax Policy Committee September
Tax Freedom Day 2018 is April 19th
 Apr. 2018 Tax Freedom Day 2018 is April 19th Erica York Analyst Key Findings Tax Freedom Day is a significant date for taxpayers and lawmakers because it represents how long Americans as a whole have to
ACA and Medicaid: Current Landscape and Future Outlook
 ACA and Medicaid: Current Landscape and Future Outlook RPCC Health Policy Forum Washington, DC December 5, 2017 Robin Rudowitz Associate Director, Program on Medicaid and the Uninsured Kaiser Family Foundation
Insured Deposit Program Updated 10/17/2016
 Insured Deposit Program Welcome to the FDIC Insured Deposit Program. Under this program, available cash balances (from security transactions, dividend and interest payments and other activities) in your
The Impact of the Tax Cut and Jobs Act on the Spatial Distribution of High Productivity Households and Economic Welfare
 The Impact of the Tax Cut and Jobs Act on the Spatial Distribution of High Productivity Households and Economic Welfare Daniele Coen-Pirani University of Pittsburgh Holger Sieg University of Pennsylvania
James G. Anderson, Ph.D. Purdue University
 Health Care Reform: Its Impact and Future Directions James G. Anderson, Ph.D. Purdue University Andersonj@purdue.edu Health Care System Models Models Other Countries United States Bismark Beveridge National
Please print using blue or black ink. Please keep a copy for your records and send completed form to the following address.
 20 Disbursement for Beneficiary/QDRO Account IBEW Local Union No. 716 Retirement Plan Instructions About You Please print using blue or black ink. Please keep a copy for your records and send completed
Tax Freedom Day 2019 is April 16th
 Apr. 2019 Tax Freedom Day 2019 is April 16th Erica York Economist Madison Mauro Research Assistant Emma Wei Research Assistant Key Findings This year, Tax Freedom Day falls on April 16, or 105 days into
Uniform Consent to Service of Process
 Applicant Company Name: NAIC No. FEIN: Uniform Consent to Service of Process Original Designation Amended Designation (must be submitted directly to states) Applicant Company Name: Previous Name (if applicable):