Profile of Visitors to Tompkins County
|
|
|
- Sara Gilbert
- 6 years ago
- Views:
Transcription
1 Profile of Visitors to Tompkins County May 4, 2010
2 Outline Background Demographics Trip Purpose Trip Characteristics Trip Activities Satisfaction Questions 2
3 BACKGROUND 3
4 Background Project Began Fall 2008 Strategic Tourism Planning Board Stakeholders & Focus Group Meetings Surveys Intercept Survey 12 Months Household Survey January/February 2009 Student Survey April/May 2009 Innkeeper Survey Spring 2009 Visitors Bureau Survey Apr to Nov 2009 Other Data Sources 4
5 Background Who is a Tompkins County visitor? A traveler to Tompkins County who does not live, work, or attend school in the county. 5
6 DEMOGRAPHICS 6
7 Demographics Q: How many annual visitors to Tompkins County? A: 843,000 Day Trippers 37% Staying with Family and Friends 19% Other 11% Staying in Hotels, etc. 33% 7
8 Demographics 8
9 Demographics Figure A.17: Household Overnight Visits by Month - Household Survey 16% 14% 12% 10% 8% 6% 4% 2% 0% Jan Feb Mar Apr May Jun Jul Aug Sep Oct Nov Dec n=287 9
10 Demographics Figure A.24: Student Overnight Visits by Month - Student Survey 18% 16% 14% 12% 10% 8% 6% 4% 2% 0% Jan Feb Mar Apr May Jun Jul Aug Sep Oct Nov Dec n=160 10
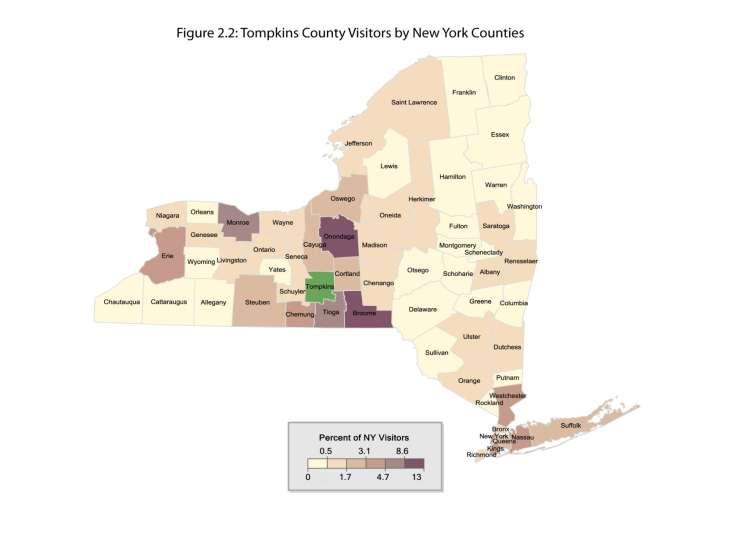
11 Demographics Tompkins County Visitor Origins All Visitors New York State 53% US Northeast (Excluding NY) 22% US South 9% US Midwest 5% US West 4% Canada 3% Other Foreign Countries 3% 11
12 Demographics Tompkins County Visitor Origins All Visitors Traditional Overnight Tourist New York State 53% 41% US Northeast (Excluding NY) 22% 28% US South 9% 11% US Midwest 5% 6% US West 4% 4% Canada 3% 8% Other Foreign Countries 3% 2% 12
13 Demographics 13
14 Demographics 14
15 Demographics 15
16 Demographics Age Traditional Overnight Tourist Campus Tourist Overall Visitor % 2% 9% % 10% 15% % 9% 15% % 43% 33% % 28% 21% % 9% 7% 16
17 Demographics 17
18 Demographics 18
19 Demographics Table 2.6: Household Income of Tompkins County Visitors Stay with Stay in Other Day Income Bracket Family/Friends Hotels, etc Lodging Trippers Average Less than $20,000 16% 3% 9% 6% 7% $20,000-49,999 26% 7% 14% 18% 15% $50,000-79,999 22% 14% 27% 27% 22% $80,000-99,999 11% 14% 19% 15% 14% $100, ,999 13% 26% 16% 21% 21% $150, % 36% 16% 15% 21% Total 100% 100% 100% 100% 100% Note: Numbers may not sum to 100% due to rounding. Source: Chmura Economics & Analytics 19
20 TRIP PURPOSE 20

21 Trip Purpose 21

22 Trip Purpose 22

23 Trip Purpose 23
24 Trip Purpose 24
25 Trip Purpose Table 2.7: Purpose of the Trip Stay with Stay in Other Day Family/Friends Hotels, etc Lodging Trippers Average Business 5% 27% 14% 11% 15% Leisure 87% 60% 77% 82% 75% Both 8% 13% 9% 7% 9% University/College Related 44% 69% 45% 30% 47% Note: Numbers may not sum to 100% due to rounding. Source: Chmura Economics & Analytics 25
26 Trip Purpose Table 2.8: Motivation for Visit - Percentage Ranking "Important" Stay with Stay in Other Day Family/Friends Hotels, etc Lodging Trippers Average Gorges & State Parks 38% 36% 67% 47% 44% Downtown Ithaca and the Commons 36% 36% 28% 36% 35% Dining & Restaurants 31% 33% 29% 38% 34% Cayuga Lake 23% 25% 32% 26% 26% Arts, Music, and Theatre 22% 17% 15% 20% 19% Wineries 17% 20% 31% 14% 18% Discovery Trail & Museums 8% 10% 11% 17% 13% B&Bs, Inns, & Resorts 2% 24% 12% 2% 9% Source: Chmura Economics & Analytics 26
27 Trip Purpose Motivation for Visit - Percentage Ranking "Important" Traditional Overnight Tourist Campus Tourist Overall Visitor Gorges & State Parks 51% 29% 44% Downtown Ithaca, including the Commons 44% 31% 35% Dining & Restaurants 35% 32% 34% Cayuga Lake 35% 18% 26% Arts, Music, and Theatre 17% 16% 19% Wineries 36% 14% 18% Discovery Trail & Museums 13% 9% 13% B&Bs, Inns, & Resorts 27% 24% 9% Source: Chmura Economics & Analytics 27
28 Trip Purpose Visitors Bureau Surveys Primary Motivation Cornell/Ithaca College Natural Beauty/Scenery Waterfalls/Gorges Cayuga Lake/Fingerlakes Family Outdoor Activities Wineries Visitors Bureau Surveys Secondary Motivation Proximity/Location Cornell/Ithaca College Natural Beauty/Scenery Waterfalls/Gorges Dining/Food Wineries Recommendations 28
29 Trip Purpose Table 2.9: Purpose for University- or College-Related Visitors Stay with Stay in Other Day Family/Friends Hotels, etc Lodging Trippers Average Visiting family/friends who work/attend university/colleges 69% 24% 33% 36% 38% Touring with prospective student 7% 21% 17% 12% 14% Attending college event 11% 21% 15% 8% 14% Dropping off/picking up students 5% 12% 12% 6% 9% Attending conference/camp 3% 6% 5% 0% 3% Other 5% 16% 17% 38% 22% Note: Numbers may not sum to 100% due to rounding. Source: Chmura Economics & Analytics 29
30 Trip Purpose 35% 30% Figure A.19: Travel Motivation of Overnight Household Guests - Household Survey 32% 30% 25% 20% 20% 15% 10% 5% 9% 6% 5% 3% 3% 3% 2% 0% n=111 30
31 Trip Purpose Figure A.26: Travel Motivation of Student's Overnight Guests - Student Survey 80% 70% 74% 60% 50% 40% 40% 30% 20% 10% 0% 15% 3% 3% 3% 3% 3% 3% n=62 31
32 TRIP CHARACTERISTICS 32
33 Trip Characteristics Table 2.10: Travel Planning Stay in Stay with Hotels, Other Day Family/Friends etc Lodging Trippers Average Internet 38% 67% 70% 47% 54% None/Previous Experience 28% 21% 16% 34% 27% Acquaintances 38% 14% 19% 14% 19% Printed Materials 3% 7% 11% 11% 8% AAA 0% 4% 7% 1% 2% Other 2% 5% 3% 4% 4% Source: Chmura Economics & Analytics 33
34 Trip Characteristics 34
35 Trip Characteristics Figure 2.6: Advance Time for Decision to Take the Ithaca Trip 18% 16% 14% 12% 10% 8% 6% 4% 2% 0% 1 day 1 month 1 year 35
36 Trip Characteristics Table 2.12: Modes of Transportation to Tompkins County Stay with Stay in Hotels, Other Family/Friends etc Lodging Day Trippers Average Automobile 82% 86% 93% 99% 91% Air 18% 18% 7% 1% 10% Bus 5% 2% 1% <1% 2% Other 0% <1% 2% 1% 1% Source: Chmura Economics & Analytics 36
37 Trip Characteristics Percentage on a Trip with More Than One Destination Traditional Overnight Tourist Campus Tourist Overall Visitor 27% 19% 22% Source: Chmura Economics & Analytics 37

38 Trip Characteristics 38
39 Trip Characteristics Table 2.13: Travel Party Size and Length of Stay Stay with Family/Friends Stay in Hotels, etc Other Lodging Day Trippers Average Travel Party Size Adults Children (under 18) Total Length of Stay Nights Days Note: Figures may not sum due to rounding. Source: Chmura Economics & Analytics 39
40 Trip Characteristics 40
41 Trip Characteristics Table 2.14: Reasons Day Trippers Overnight in Lodging Establishments Outside of Tompkins County (Excluding Those Staying with Family or Friends) Lodging Closer to Other Trip Destinations 60% Free Lodging Available Elsewhere 5% Everything in Tompkins County Booked 5% High Cost in Tompkins County 3% Other 28% Note: Numbers may not sum to 100% due to rounding. Source: Chmura Economics & Analytics 41
42 Trip Characteristics Figure A.13: Households with Overnight Visitors in Household Survey No 46% Yes 54% n=223 42
43 Trip Characteristics Traditional Overnight Tourist First-Time Visitors Visit Frequency Campus Tourist Day Trippers Overall Visitor 45% 30% 20% 31% Visits in the Last Five Years (including Current Trip) 1 58% 39% 27% 38% 2 14% 12% 9% 10% 3-4 9% 15% 8% 11% 5-9 5% 17% 12% 12% % 17% 45% 28% Source: Chmura Economics & Analytics 43
44 TRIP ACTIVITIES 44
45 Trip Activities Figure 2.9: Activities in Tompkins County Cornell Downtown Ithaca/Commons 42% 42% Parks/waterfalls/gorges 39% Wineries 17% Ithaca College Cayuga Lake 12% 12% Farmers Market 9% Johnson Art Museum Moosewood Restaurant Plantations 4% 4% 5% 0% 5% 10% 15% 20% 25% 30% 35% 40% 45% 45
46 Trip Activities Table 2.15: Top Ten Visitor Activities Stay with Stay in Hotels, Other Day Family/Friends etc Lodging Trippers Average Cornell 44% 59% 43% 25% 42% Downtown Ithaca and the Commons 49% 44% 43% 36% 42% Parks, waterfalls, and gorges 48% 33% 54% 37% 39% Wineries 20% 19% 26% 12% 17% Ithaca College 9% 17% 12% 9% 12% Cayuga Lake 16% 12% 16% 8% 12% Farmers Market 17% 7% 9% 6% 9% Johnson Art Museum 7% 5% 7% 4% 5% Moosewood Restaurant 7% 4% 4% 4% 4% Plantations 6% 3% 9% 2% 4% Source: Chmura Economics & Analytics 46
47 Trip Activities Locations/Attractions Visited Traditional Overnight Tourist Campus Tourist Overall Visitor Cornell 26% 70% 42% Downtown Ithaca and the Commons 49% 48% 42% Parks, Waterfalls, and Gorges 54% 33% 39% Wineries 39% 14% 17% Ithaca College 4% 28% 12% Cayuga Lake 14% 13% 12% Farmers Market 9% 10% 9% Johnson Art Museum 2% 7% 5% Moosewood 7% 2% 4% Plantations 3% 3% 4% Source: Chmura Economics & Analytics 47
48 Trip Activities Table 2.16: Average Spending Per Visitor Per Trip in Tompkins County Stay with Family Friends Stay in Hotels Other Lodging Day Trippers Average All Visitors Average Overnight Visitors Food & Drink $86 $99 $81 $19 $65 $92 Lodging $0 $136 $71 $0 $52 $83 Shopping $59 $71 $43 $21 $47 $63 Local Transportation $15 $20 $17 $3 $12 $18 Entertainment & Attractions $8 $5 $5 $3 $5 $6 Other $3 $3 $0 $5 $4 $3 Total $172 $335 $216 $51 $185 $265 Note: Numbers may not sum due to rounding. Source: Chmura Economics & Analytics 48

49 Trip Activities Q: What is the total annual spending of visitors to Tompkins County? A: $156 Million 49
50 SATISFACTION 50
51 Satisfaction 51
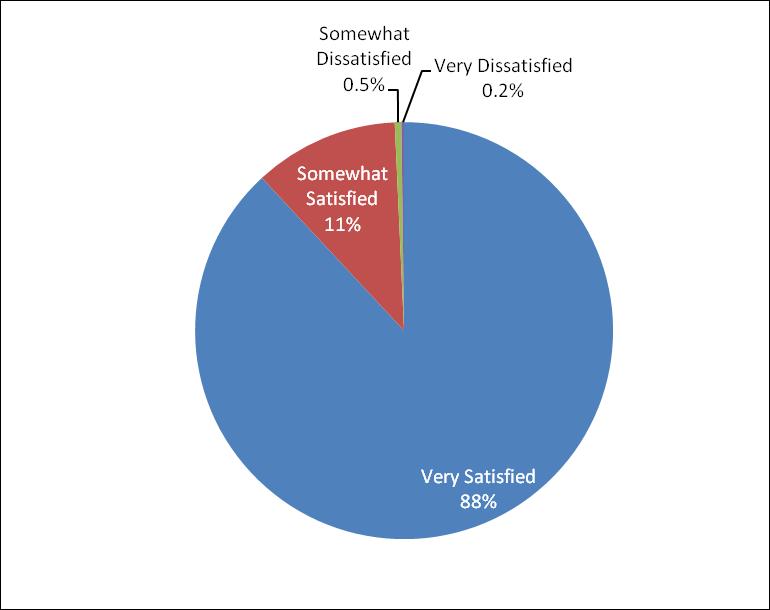
52 Satisfaction Satisfaction Traditional Overnight Tourist Campus Tourist Overall Visitor Overall Satisfaction Very Satisfied 87% 87% 88% Somewhat Satisfied 13% 12% 11% Somewhat Dissatisfied 0.0% 0.8% 0.5% Very Dissatisfied 0.0% 0.4% 0.2% Source: Chmura Economics & Analytics 52
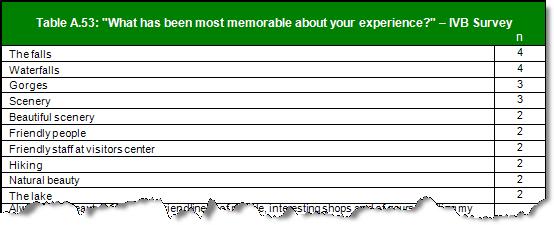
53 Satisfaction What aspects did you most enjoy? Natural Scenery State Parks, Waterfalls, and Gorges Cornell Downtown Dining, Restaurants, and Food Friendly People What aspects did you not enjoy? Roads and Traffic Weather Accommodations Parking Downtown and the Commons Construction 53
54 Satisfaction 54
55 Satisfaction Table 2.19: Possible Return in the Next Five Years for a Leisure Trip Stay with Family Other Day Friends Stay in Hotels Lodging Trippers Average Definitely 76% 48% 59% 76% 65% Probably 13% 21% 17% 12% 16% Might/Might Not 7% 18% 13% 10% 12% Probably Not 2% 11% 7% 2% 5% Definitely Not 1% 2% 4% 0% 2% Note: Numbers may not sum to 100% due to rounding. Source: Chmura Economics & Analytics 55
56 Satisfaction Table 2.20: Possible Return in the Next Five Years Business Leisure Both College/University Related Definitely 32% 73% 68% 53% Probably 23% 14% 12% 19% Might/Might Not 29% 8% 15% 18% Probably Not 13% 4% 3% 8% Definitely Not 3% 1% 2% 2% Source: Chmura Economics & Analytics 56
57 QUESTIONS 57
Guam Visitors Bureau. Japan Visitor Tracker Exit Profile & Market Segmentation Report FY2018 JANUARY 2018
 Guam Visitors Bureau Japan Visitor Tracker Exit Profile & Market Segmentation Report FY20 JANUARY 20 Prepared by: Anthology Research Information contained herein is the property of the Guam Visitors Bureau.
Produced by: Destination Research Sergi Jarques, Director
 Produced by: Destination Research Sergi Jarques, Director Economic Impact of Tourism North Norfolk - 2017 Contents Page Summary Results 2 Contextual analysis 4 Volume of Tourism 7 Staying Visitors - Accommodation
Produced by: Destination Research Sergi Jarques, Director
 Produced by: Destination Research Sergi Jarques, Director Economic Impact of Tourism Norwich - 2017 Contents Page Summary Results 2 Contextual analysis 4 Volume of Tourism 7 Staying Visitors - Accommodation
Lake Tahoe Visitors Authority. Visitor Profile Study Top Line Results Preliminary Summer + Fall 2015
 Lake Tahoe Visitors Authority Visitor Profile Study Top Line Results Preliminary Summer + Fall 2015 Notes The following is summary top line report of data collected over the summer and fall quarters. The
Guam Visitors Bureau. Japan Visitor Tracker Exit Profile & Market Segmentation Report FY2017 APRIL 2017
 Guam Visitors Bureau Japan Visitor Tracker Exit Profile & Market Segmentation Report FY2017 APRIL 2017 Prepared by: Anthology Research Information contained herein is the property of the Guam Visitors
LGA PROFILE - Glen Innes Severn
 Dec-08 Mar-09 Jun-09 Sep-09 Dec-09 Mar-10 Jun-10 Sep-10 Dec-10 Mar-11 Jun-11 Sep-11 Dec-11 Mar-12 Jun-12 Sep-12 Dec-12 Mar-13 Jun-13 Sep-13 Dec-13 Mar-14 Jun-14 Sep-14 Visitors (000's) OVERVIEW LGA PROFILE
Guam Visitors Bureau. Korean Visitor Tracker Exit Profile & Market Segmentation Report FY2017 JULY 2017
 Guam Visitors Bureau Korean Visitor Tracker Exit Profile & Market Segmentation Report FY20 JULY 20 Prepared by: Anthology Research Information contained herein is the property of the Guam Visitors Bureau.
Guam Visitors Bureau. Japan Visitor Tracker Exit Profile & Market Segmentation Report FY2017 JULY 2017
 Guam Visitors Bureau Japan Visitor Tracker Exit Profile & Market Segmentation Report FY2017 JULY 2017 Prepared by: Anthology Research Information contained herein is the property of the Guam Visitors Bureau.
OVERVIEW Four year annual average to the year ending September 2014
 Dec-08 Mar-09 Jun-09 Sep-09 Dec-09 Mar-10 Jun-10 Sep-10 Dec-10 Mar-11 Jun-11 Sep-11 Dec-11 Mar-12 Jun-12 Sep-12 Dec-12 Mar-13 Jun-13 Sep-13 Dec-13 Mar-14 Jun-14 Sep-14 Visitors (000's) LGA PROFILE - Tumbarumba
2018 Major League Baseball Florida Spring Training Economic Impact Study. Joseph St. Germain, Ph.D. Phillip Downs, Ph.D.
 2018 Major League Baseball Florida Spring Training Economic Impact Study Joseph St. Germain, Ph.D. Phillip Downs, Ph.D. Rachael Anglin Introduction 2 Goals Determine overall economic impact, jobs supported,
VDTM3436 Economic Impact Study Brochure
 10/25/10 1 The Travel and Tourism Industry in Vermont A Benchmark Study of the Economic Impact of Visitor Expenditures on the Vermont Economy 2009 INTRODUCTION Despite the significant impact of the Great
Atlantic City Tourism Performance Indicators (AC-TPI)
") Atlantic City Tourism Performance Indicators (AC-TPI) 2 nd Quarter 2013 Snapshot Prepared by Brian J. Tyrrell, Ph.D. Associate Professor of Hospitality and Tourism Management Senior Research Fellow for
Atlantic City Tourism Performance Indicators (AC-TPI) 2 nd Quarter 2013 Snapshot Prepared by Brian J. Tyrrell, Ph.D. Associate Professor of Hospitality and Tourism Management Senior Research Fellow for
Truckee Donner Chamber of Commerce Visitor Profile Study. Four Season Visitor Profile Study 2013/14
 Truckee Donner Chamber of Commerce Visitor Profile Study Four Season Visitor Profile Study 2013/14 Thanks You! Thanks to the Town of Truckee for funding this Visitor Profile Study through the marketing
Business & Financial Services December 2017
 Business & Financial Services December 217 Completed Procurement Transactions by Month 2 4 175 15 125 1 75 5 2 1 Business Days to Complete 25 Jan Feb Mar Apr May Jun Jul Aug Sep Oct Nov Dec 217 Procurement
Scottsdale Tourism Study - Visitor Statistics
 Scottsdale Tourism Study - Visitor Statistics January 2018 Tourism and Events Department Scottsdale Visitor Statistics January 2018 Scottsdale City Council W.J. Jim Lane Mayor Linda Milhaven Kathy Littlefield
Understanding the Visitor to Kansas City. August 2013
 Understanding the Visitor to Kansas City August 2013 Introduction Longwoods International began tracking American travelers in 1985. It is currently the largest ongoing study of American travelers, providing
Scottsdale Tourism Study - Visitor Statistics
 Scottsdale Tourism Study - Visitor Statistics September 2018 Tourism and Events Department Scottsdale Visitor Statistics September 2018 Scottsdale City Council W.J. Jim Lane Mayor Linda Milhaven Kathy
Source: Statistics New Zealand International Travel and Migration March 2015 MBIE: International Visitor Survey December 2014
 Source: Statistics New Zealand International Travel and Migration March 2015 MBIE: International Visitor Survey December 2014 Source: Statistics New Zealand International Travel and Migration March 2015
MINNEAPOLIS ST. PAUL VISITOR COUNTS AND PROFILE. Kevin Hanstad April 28, 2016
 MINNEAPOLIS ST. PAUL VISITOR COUNTS AND PROFILE Kevin Hanstad April 28, 2016 SUMMARY 32 Million People Visited Minneapolis-St. Paul in 2015 and Spent $7.5 Billion Average Age: 46 Average Income: $95,000
Economic Outlook: Grand Strand Economy
 Economic Outlook: Grand Strand Economy 20 th Annual Economic Growth and Real Estate Summit Pine Lakes Country Club, September 29, 2017 Robert F. Salvino, Ph.D. E. Craig Wall Sr. College of Business Coastal
Current Employment Statistics
 Current Employment Statistics October 2017 If you have any questions or seek additional information, please contact: Vermont Department of Labor Economic and Labor Market Information Division 802-828-4202
Current Employment Statistics
 Current Employment Statistics December 2017 If you have any questions or seek additional information, please contact: Vermont Department of Labor Economic and Labor Market Information Division 802-828-4202
TABLE OF CONTENTS. Economic & Fiscal Impact Analysis of the Proposed Hamilton Fields Sports Park. Prepared for the City of Novato: April 11, 2016
 TABLE OF CONTENTS Economic & Fiscal Impact Analysis of the Proposed Hamilton Fields Sports Park Prepared for the City of Novato: April 11, 2016 TABLE OF CONTENTS I. Project Background 3 II. Methodology
A look at the economic benefit of a conference center to the City of Ithaca. The Power of Travel
 A look at the economic benefit of a conference center to the City of Ithaca The Power of Travel Travel is a major employer across America 8.6 Million jobs directly supported by travelers in the U.S. Travel
Lake Havasu City Travel Impacts, p
 Lake Havasu City Travel Impacts, 2005-2010p photo courtesy of Lake Havasu Convention & Visitors Bureau JUNE 2011 PREPARED FOR Lake Havasu Convention & Visitors Bureau Lake Havasu City, Arizona LAKE HAVASU
CONSUMER PULSE ONLINE SURVEY FLORIDA February 2010 Vacation Travel
 Q2 FY10 Consumer Pulse - FL Page 1 of 6 Q1. In the past 12 months, did you personally take at least one leisure trip of 50 miles or more away from home requiring overnight accommodations? Yes 78% No 22%
ECONOMIC IMPACT OF TRAVEL ON GEORGIA 2004 PROFILE
 ECONOMIC IMPACT OF TRAVEL ON GEORGIA 2004 PROFILE A Study Prepared for the Georgia Department of Economic Development (DEcD) By the Travel Industry Association of America Washington, D.C. June 2005 Preface
Discussion, Consideration and Possible Action to Accept the Annual Report of the Sonoma Tourism Improvement District
 Department City of Sonoma Agenda Item Summary Meeting: City Council - Aug 21 2017 Administration Agenda Item Title Staff Contact Cathy Capriola, City Manager Discussion, Consideration and Possible Action
XML Publisher Balance Sheet Vision Operations (USA) Feb-02
 Feb-02") Page:1 Apr-01 May-01 Jun-01 Jul-01 ASSETS Current Assets Cash and Short Term Investments 15,862,304 51,998,607 9,198,226 Accounts Receivable - Net of Allowance 2,560,786
Page:1 Apr-01 May-01 Jun-01 Jul-01 ASSETS Current Assets Cash and Short Term Investments 15,862,304 51,998,607 9,198,226 Accounts Receivable - Net of Allowance 2,560,786
E S T E S P A R K V I S I T O R S S T U D Y H I G H L I G H T S
 E S T E S P A R K 2 0 1 0-2 0 1 1 V I S I T O R S S T U D Y H I G H L I G H T S R E S E A R C H B A C K G R O U N D A N D O B J E C T I V E S In 2010, the Estes Park LMD initiated a year-long Visitors
ECHO tourism STAT istics. Performance Report on Québec City Tourist Industry
 Performance Report on Québec City Tourist Industry DECEMBER 2012 YEAR 2012 Designed and produced by: Marc Giguère and Michel Goupil Development, Strategy and Planning Division For information or comments,
Welcome To Rockville Intercept Survey Report. April 26 th -27 th, 2014
 Welcome To Rockville Intercept Survey Report April 26 th -27 th, 2014 Prepared for: Laurie Kopstad Visit Jacksonville Prepared by: Michael M. Binder, Ph.D Andrew C. Hopkins, MPA May 14, 2014 METHODOLOGY
Cost Estimation of a Manufacturing Company
 Cost Estimation of a Manufacturing Company Name: Business: Date: Economics of One Unit: Manufacturing Company (Only complete if you are making a product, such as a bracelet or beauty product) Economics
Downtown Boulder User Survey October 2014
 Downtown Boulder User Survey 2014 October 2014 Presentation Overview o Methodology o Key Findings and Highlights o Visitor Profile o Marketing & Media o Spending Patters o Transportation & Parking o Impact
2016 Q4 CUSTOMER SATISFACTION SURVEY
 2016 Q4 CUSTOMER SATISFACTION SURVEY Quarterly Report PREPARED IN PARTNERSHIP WITH: TABLE OF CONTENTS Methodology 3 Executive Summary 4 Summary of Findings 6 Key Drivers by Mode 27 Individual Measures
Employment Data (establishment)
") Table 1: Major Indicators of Labor Market Activity for New Jersey Seasonally Adjusted (thousands) Benchmark Labor Force Data (resident) Current Month Previous Month One Year Ago Net Change Net Change May
Table 1: Major Indicators of Labor Market Activity for New Jersey Seasonally Adjusted (thousands) Benchmark Labor Force Data (resident) Current Month Previous Month One Year Ago Net Change Net Change May
Executive Summary. July 17, 2015
 Executive Summary July 17, 2015 The Revenue Estimating Conference adopted interest rates for use in the state budgeting process. The adopted interest rates take into consideration current benchmark rates
The Economic Impact of Travel on Massachusetts Counties 2009
 The Economic Impact of Travel on Massachusetts Counties 2009 A Study Prepared for the Massachusetts Office of Travel and Tourism by the Research Department of the U.S. Travel Association Washington, D.C.
THE ECONOMIC IMPACT OF TOURISM IN VERMONT: SPRING & SUMMER 2001
 THE ECONOMIC IMPACT OF TOURISM IN VERMONT: SPRING & SUMMER 2001 Prepared for The Vermont Department of Tourism and Marketing By Department of Community Development & Applied Economics The University of
Guam Visitors Bureau. Taiwan Visitor Tracker Exit Profile FY2018 DATA AGGREGATION
 Guam Visitors Bureau Taiwan Visitor Tracker Exit Profile FY2018 DATA AGGREGATION Prepared by: Anthology Research Information contained herein is the property of the Guam Visitors Bureau. The use of this
Mitchell Electric Charitable Fund PO Box 409 Camilla, GA (229) or FAX:
 or FAX:") Mitchell Electric Charitable Fund PO Box 409 Camilla, GA 31730 (229) 336-5221 or 1-800-479-6034 FAX: 229-336-7088 For Office use only: Agency / Organization Application All attached sheets, including financial
Mitchell Electric Charitable Fund PO Box 409 Camilla, GA 31730 (229) 336-5221 or 1-800-479-6034 FAX: 229-336-7088 For Office use only: Agency / Organization Application All attached sheets, including financial
South Carolina Early School Start Dates and the South Carolina Travel and Tourism Industries
 South Carolina Early School Start Dates and the South Carolina Travel and Tourism Industries An Analysis of Economic & Tax Revenue Impacts Report for: Uniform School Start Date Task Force South Carolina
Spheria Australian Smaller Companies Fund
 29-Jun-18 $ 2.7686 $ 2.7603 $ 2.7520 28-Jun-18 $ 2.7764 $ 2.7681 $ 2.7598 27-Jun-18 $ 2.7804 $ 2.7721 $ 2.7638 26-Jun-18 $ 2.7857 $ 2.7774 $ 2.7690 25-Jun-18 $ 2.7931 $ 2.7848 $ 2.7764 22-Jun-18 $ 2.7771
The Economic Impact Of Travel on Massachusetts Counties 2015
 The Economic Impact Of Travel on Massachusetts Counties 2015 A Study Prepared for the Massachusetts Office of Travel and Tourism By the Research Department of the U.S. Travel Association Washington, D.C.
MONTHLY ECONOMIC INDICATORS
 MONTHLY ECONOMIC INDICATORS SEPTEMBER 0 Table of Contents 1. INFLATION... 2 2. MONEY, CREDIT AND INTEREST RATES... 6 3. REAL SECTOR INDICATORS... 9 4. BALANCE OF PAYMENTS AND EXTERNAL SECTOR INDICATORS...
Employment & Unemployment
 Employment & Unemployment Estimates for August 2010 Unemployment Rates: Nevada Statewide 14.4% (Seasonally Adjusted) Las Vegas-Paradise MSA 14.7% Reno-Sparks MSA 13.3% Carson City MSA 13.1% Elko Micropolitan
Employment & Unemployment
 Employment & Unemployment Estimates for September 2010 Unemployment Rates: Nevada Statewide 14.4% (Seasonally Adjusted) Las Vegas-Paradise MSA 15.0% Reno-Sparks MSA 13.6% Carson City MSA 13.4% Elko Micropolitan
Employment & Unemployment
 Employment & Unemployment Estimates for December 2009 Unemployment Rates: Nevada Statewide 13.0% (Seasonally Adjusted) Las Vegas-Paradise MSA 13.1% Reno-Sparks MSA 12.7% Carson City MSA 12.7% Elko Micropolitan
Table 1: Major Indicators of Labor Market Activity for New Jersey Seasonally Adjusted 2016 Benchmark Labor Force Data (resident)
") Table 1: Major Indicators of Labor Market Activity for New Jersey Seasonally Adjusted Benchmark Labor Force Data (resident) Current Month Previous Month One Year Ago Net Change Net Change Dec. 17 (P) Nov.
Table 1: Major Indicators of Labor Market Activity for New Jersey Seasonally Adjusted Benchmark Labor Force Data (resident) Current Month Previous Month One Year Ago Net Change Net Change Dec. 17 (P) Nov.
Statistical release P6410
 Statistical release P6410 Tourist accommodation (Preliminary) July 2013 Embargoed until: 25 September 2013 10:00 Enquiries: Forthcoming issue: Expected release date: User Information Services August 2013
Current Economic Review April 16, 2014
 Current Economic Review April 16, 2014 Brian Bonnenfant Project Manager Center for Regional Studies University of Nevada, Reno 784-1771 bonnen@unr.edu 230,000 225,000 **Peak = 228,100 Emp **Start of Great
WESTWOOD LUTHERAN CHURCH Summary Financial Statement YEAR TO DATE - February 28, Over(Under) Budget WECC Fund Actual Budget
 Budget WECC Fund Actual Budget") WESTWOOD LUTHERAN CHURCH Summary Financial Statement YEAR TO DATE - February 28, 2018 General Fund Actual A B C D E F WECC Fund Actual Revenue Revenue - Faith Giving 1 $ 213 $ 234 $ (22) - Tuition $ 226
WESTWOOD LUTHERAN CHURCH Summary Financial Statement YEAR TO DATE - February 28, 2018 General Fund Actual A B C D E F WECC Fund Actual Revenue Revenue - Faith Giving 1 $ 213 $ 234 $ (22) - Tuition $ 226
Haines Economic Development Plan: Economic Baseline Report
 Haines Economic Development Plan: Economic Baseline Report Prepared for: Prepared by: Presentation Project overview Economic baseline data Population and demographics Income and employment Transportation
Business Cycle Index July 2010
 Business Cycle Index July 2010 Bureau of Trade and Economic Indices, Ministry of Commerce, Tel. 0 2507 5805, Fax. 0 2507 5806, www.price.moc.go.th Thailand economic still expansion. Medium-run Leading
Texas Highways Reader Profile Study
 The findings cited in this report are based on a survey sponsored by the Texas Department of Transportation (TxDOT) on behalf of their publication, Texas Highways. PURPOSE Through the use of a mixed-mode
Isle Of Wight half year business confidence report
 half year business confidence report half year report contents new company registrations closed companies (dissolved) net company growth uk company share director age director gender naming trends sic
Are Affordability Perceptions Reducing Household Mobility and Exacerbating the Housing Shortage?
 Are Affordability Perceptions Reducing Household Mobility and Exacerbating the Housing Shortage? National Housing Survey Topic Analysis Q4 2017 Published on June 27, 2018 2018 Fannie Mae. Trademarks of
THE ECONOMIC IMPACT OF NATIONAL HERITAGE AREAS: A CASE STUDY APPROACH
 THE ECONOMIC IMPACT OF NATIONAL HERITAGE AREAS: A CASE STUDY APPROACH WHEELING NATIONAL HERITAGE AREA JUNE 2017 TABLE OF CONTENTS Introduction...2 Project Overview.4 Wheeling NHA Economic Impact...6 Conclusion.14
HOME Survey. Housing Opportunities and Market Experience. March National Association of REALTORS Research Department
 HOME Survey Housing Opportunities and Market Experience March 2017 National Association of REALTORS Research Department Introduction The Housing Opportunities and Market Experience (HOME) report was created
LOAN MARKET DATA AND ANALYTICS BY THOMSON REUTERS LPC
 LOAN MARKET DATA AND ANALYTICS BY THOMSON REUTERS LPC GLOBAL LOAN MARKET DATA AND ANALYTICS BY THOMSON REUTERS LPC Secondary Market Bid Levels: Europe Slide 2 European CLO New Issue Volume Monthly Slide
The Economic Impact of Travel on Massachusetts Counties 2016
 The Economic Impact of Travel on Massachusetts Counties 2016 A Study Prepared for the Massachusetts Office of Travel and Tourism By the Research Department of the U.S. Travel Association Washington, D.C.
Snohomish County Strategic Tourism Plan Snohomish County Office of Economic Development
 Snohomish County Strategic Tourism Plan Snohomish County Office of Economic Development T O U R I S M I N D U S T R Y S N A P S H O T Snohomish County has the 3 rd largest tourism market in Washington
11 May Report.xls Office of Budget & Fiscal Planning
 Education and General Fund Actual Revenues and s by Month MTD YTD Change Revenue Jul Aug Sep Oct Nov Dec Jan Feb Mar Apr May Jun Per 14 Total over FY06 Enrollment Fees $ 8,211 $ 219 $ 41,952 ($ 818) $
Unemployment Rate Edges Lower to 5.0 Percent Employment Down in December
 Media Contact 609-984-2841 EMAIL: MediaCalls@dol.state.nj.us Unemployment Rate Edges Lower to 5.0 Percent Employment Down in December TRENTON, January 18, 2018 Preliminary monthly estimates released by
Review of Registered Charites Compliance Rates with Annual Reporting Requirements 2016
 Review of Registered Charites Compliance Rates with Annual Reporting Requirements 2016 October 2017 The Charities Regulator, in accordance with the provisions of section 14 of the Charities Act 2009, carried
The Economic Impact of Tourism in New York
 The Economic Impact of Tourism in New York 2010 Calendar Year Finger Lakes Focus Key themes in 2010 The New York State visitor economy rebounded in 2010, recovering 94% of the losses experienced during
Lowcountry and Resort Islands Institute at USCB Kelli Brunson Catherine Moorman Dr. John Salazar. May 2, 2015 USCB 2015.
 Lowcountry and Resort Islands Institute at USCB Kelli Brunson Catherine Moorman Dr. John Salazar May 2, 2015 Powered by 228 Total Responses Date Created: Friday, May 01, 2015 Complete Responses: 228 Demographics
Town of Brant Erie County, New York
 Town of Brant Erie County, New York CORN MAZE, PUMPKIN PATCH AND AGRI-TAINMENT PROJECT MODEL BUSINESS PLAN May 2004 100 Fourth Street Honesdale, PA 18431 570-251-9550 FAX 251-9551 www.shepstone.net Corn
Alliant Energy Center Campus Master Plan + Destination District Vision & Strategy Joint Public Event Joint Public Event: October 15, 2018
 Alliant Energy Center Campus Master Plan + Destination District Vision & Strategy Joint Public Event Joint Public Event: October, 08 Result By Question ) Where do you live? % 6 ) Neighborhoods adjoining
ONTARIO-MICHIGAN BORDER TRANSPORTATION PARTNERSHIP Planning/Need and Feasibility Study. 1. Work Accomplished This Period (4 Weeks)
") ONTARIO-MICHIGAN BORDER TRANSPORTATION PARTNERSHIP Planning/Need and Feasibility Study MONTHLY PROGRESS REPORT #19 Period Ending September 30, 2003 1. Work Accomplished This Period (4 Weeks) Strategic
ONTARIO-MICHIGAN BORDER TRANSPORTATION PARTNERSHIP Planning/Need and Feasibility Study MONTHLY PROGRESS REPORT #19 Period Ending September 30, 2003 1. Work Accomplished This Period (4 Weeks) Strategic
Reasons to Go
 Reasons to Go 217 1 Reasons to go 217 Background and purpose This study aims to identify, map out and analyse visitors travel habits and experiences of the tourism business in Blekinge. Target population
Westshore Circulator Study. Westshore Alliance Transportation Committee Meeting
 Westshore Circulator Study Westshore Alliance Transportation Committee Meeting November 14, 2012 Agenda Study Purpose Existing Conditions Analysis Needs Assessment Implementation Plan Study Purpose Explore
PHOENIX ENERGY MARKETING CONSULTANTS INC. HISTORICAL NATURAL GAS & CRUDE OIL PRICES UPDATED TO July, 2018
 Jan-01 $12.9112 $10.4754 $9.7870 $1.5032 $29.2595 $275.39 $43.78 $159.32 $25.33 Feb-01 $10.4670 $7.8378 $6.9397 $1.5218 $29.6447 $279.78 $44.48 $165.68 $26.34 Mar-01 $7.6303 $7.3271 $5.0903 $1.5585 $27.2714
QUESTION 2. QUESTION 3 Which one of the following is most indicative of a flexible short-term financial policy?
 QUESTION 1 Compute the cash cycle based on the following information: Average Collection Period = 47 Accounts Payable Period = 40 Average Age of Inventory = 55 QUESTION 2 Jan 41,700 July 39,182 Feb 18,921
ECHO tourism STAT istics. Performance Report on Québec City Tourist Industry
 Performance Report on Québec City Tourist Industry DECEMBER 2016 YEAR 2016 ÉCHO tourism STAT istics Table of contents Responsibles for design and production 2 Highlights 3 Performance indicators Total
SECTION 2: Participant Medical and Emergency Information
 The Gap Year Experience www.gapyearcourse.co.za Course Registration Form SECTION 1: Participant Information Full Name: ID Number: Cell Number: Home Number: Email Address: Residential Address: CODE: Postal
2015 A Record Year for Indiana Tourism. Methodology, Metrics and Evaluation
 2015 A Record Year for Indiana Tourism Methodology, Metrics and Evaluation Table of Contents 2015 Indiana Tourism Highlights Background & Methodology 2014 2015 Indiana Tourism Performance 2015 Tourism
SUMMARY. 1 Tourism statistics, February 2017 Rovaniemi. Registered overnight stays up 6 per cent in Rovaniemi
 1 SUMMARY Registered overnight stays up 6 per cent in In February 2017, 68 900 overnight stays were registered in, of which Finns accounted for 12 500 and foreigners 56 400 nights. In total, overnight
The Economic Impact of Tourism in New York
 The Economic Impact of Tourism in New York 2015 Calendar Year Finger Lakes Focus 2 State Summary Key trends in 2015 3 New York State s tourism economy expanded in 2015 with 1.0% growth in traveler spending.
OTHER DEPOSITS FINANCIAL INSTITUTIONS DEPOSIT BARKAT SAVING ACCOUNT
 WEIGHTAGES JAN FEB MAR APR MAY JUN JUL AUG SEPT OCT NOV DEC ANNOUNCEMENT DATE 19.Dez.14 27.Jän.15 24.Feb.15 26.Mär.15 27.Apr.15 26.Mai.15 25.Jun.15 28.Jul.15 26.Aug.15 23.Sep.15 27.Okt.15 25.Nov.15 MUDARIB
England Domestic Overnight Trips Summary - All Trip Purposes
 England Domestic Overnight Trips Summary - All Trip Purposes - 2013 How to read these tables The below tables summarise trip characteristics and demographics of travellers for domestic overnight trips
Jacksonville Jazz Festival Intercept Survey Report. May 22 nd -25 th, 2014
 Jacksonville Jazz Festival Intercept Survey Report May 22 nd -25 th, 2014 Prepared for: Laurie Kopstad Visit Jacksonville Prepared by: Michael M. Binder, Ph.D Andrew C. Hopkins, MPA June 4, 2014 METHODOLOGY
Asheville Metro Economic Report 2014 First Quarter
 Asheville Metro Economic Report Johnson Price Sprinkle PA HIGHLIGHTS: ASHEVILLE METRO Employment gains slowed in the first quarter of 2014 dropping behind five other N.C. Metros and lagging behind both
Committed to Excellence in Educational Travel for You and Your Students
 Nova Middle School Mr. Baugh 3602 College Ave Davie, FL 33314 Delivered via E-mail: paul.baugh@browardschools.com Dear Mr. Baugh, Enclosed please find our proposal pertaining to your planned 3-day, 2-night
Financial & Business Highlights For the Year Ended June 30, 2017
 Financial & Business Highlights For the Year Ended June, 17 17 16 15 14 13 12 Profit and Loss Account Operating Revenue 858 590 648 415 172 174 Investment gains net 5 162 909 825 322 516 Other 262 146
LABOR SITUATION Office of Research
 Sharon Palmer Commissioner LABOR SITUATION Office of Research FOR IMMEDIATE RELEASE May 2013 Data CT Unemployment Rate = 8.0% US Unemployment Rate = 7.6% Nonfarm jobs rise 1,000 in May but the unemployment
RESEARCH BRIEF. No. 3 April The Economic Contributions of Tourism in Utah A Regional Comparison
 RESEARCH BRIEF No. 3 April 2015 The Economic Contributions of Tourism in Utah A Regional Comparison Jennifer Leaver, Research Analyst B E B R David Eccles School of Business University of Utah 1655 E.
The Economic Impact of Tourism in New York
 The Economic Impact of Tourism in New York 2013 Calendar Year Finger Lakes Focus 2 State Summary Key trends in 2013 New York State s tourism economy expanded in 2013 with 3.5% growth in traveler spending.
Economic accounts office
 Economic accounts office 1 Compilation of : National Accounts Regional Accounts Quarterly Accounts Input-output Tables Satellite Account of: Health Accounts Cooperatives and Mutual Societies Accounts ICT
Interviews with 1,019 adult Americans, conducted by telephone by Opinion Research Corporation on March 12-15, The margin of sampling error for
 Interviews with 1,019 adult Americans, conducted by telephone by Opinion Research Corporation on March 12-15,. The margin of sampling error for results based on the total sample is plus or minus 3 percentage
2017 Quality of Life and Citizen Satisfaction Survey
 2017 Quality of Life and Citizen Satisfaction Survey Presentation Presented by: Jamie Duncan Vice President, Canada Ipsos Public Affairs Krista Ring Manager, Customer Experience & Research Customer Service
HOME Survey. Housing Opportunities and Market Experience. September National Association of REALTORS Research Department
 HOME Survey Housing Opportunities and Market Experience September 2016 National Association of REALTORS Research Department Introduction The Housing Opportunities and Market Experience (HOME) report was
Big Walnut Local School District
 Big Walnut Local School District Monthly Financial Report for the month ended September 30, 2013 Prepared By: Felicia Drummey Treasurer BIG WALNUT LOCAL SCHOOL DISTRICT SUMMARY OF YEAR TO DATE FINANCIAL
Tourism as an international traded service
 Tourism as an international traded service Content Tourism: definition International tourism Scope of tourism expenditure Tourism expenditure/consumption and international trade in services Categories
26 Febuary Macro Overview. Landsbankinn Economic Research
 Febuary 8 Inflation Jan 8 Dec 7 Jan 7 CPI YoY..9.9 Contribution of individual components : Imp. goods excl. alcohol, tobacco and petrol -. -. -. Petrol... Housing..7.8 Domestic goods excl. agricultural
Department of Public Welfare (DPW)
") Department of Public Welfare (DPW) Office of Income Maintenance Electronic Benefits Transfer Card Risk Management Report Out-of-State Residency Review FISCAL YEAR 2014-2015 September 2014 (June, July and
Department of Public Welfare (DPW) Office of Income Maintenance Electronic Benefits Transfer Card Risk Management Report Out-of-State Residency Review FISCAL YEAR 2014-2015 September 2014 (June, July and
7.6% The YOY percent increase in Nevada taxable sales in August--up $259 million from August 2011.
 Jan-03 Jun-03 Nov-03 Apr-04 Sep-04 Feb-05 Jul-05 Dec-05 May-06 Oct-06 Mar-07 Aug-07 Jan-08 Jun-08 Nov-08 Apr-09 Sep-09 Feb-10 Dec-10 May-11 Oct-11 Aug-12 Index Municipal Investment Management In This Issue
The Economic Impact of Tourism in New York Calendar Year Long Island Focus
 The Economic Impact of Tourism in New York 2010 Calendar Year Long Island Focus Key themes in 2010 The New York State visitor economy rebounded in 2010, recovering 94% of the losses experienced during
ECHO tourism STAT istics. Performance Report on Québec City Tourist Industry
 Performance Report on Québec City Tourist Industry MARCH 2013 Designed and produced by: Marc Giguère and Michel Goupil Development, Strategy and Planning Division For information or comments, please contact:
Tourist Development Tax Funded Programs
 Tourist Development Tax Funded Programs FY18 Recommended Operating Budget and Capital Programs June 6 th, 2017 1 Tourism Development Tax (TDT) Overview & Uses 2 Legislative Background of Tourist Development