Summary 5 Year Cash Flow Projections
|
|
|
- Helena Logan
- 5 years ago
- Views:
Transcription
1
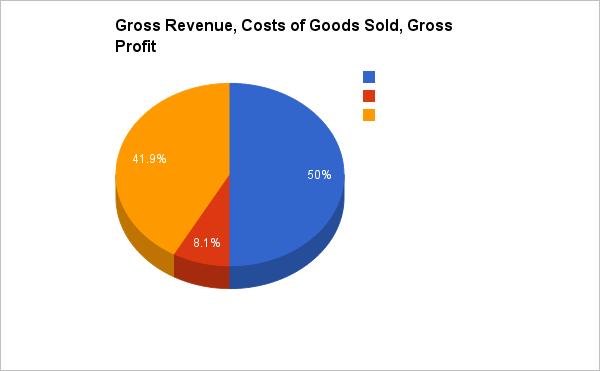
2 Summary 5 Year Cash Flow Projections Yr 1 Yr 2 Yr 3 Yr4 Yr5 Totals Revenues and Costs Gross Revenue Cost of Goods Sold Gross Profit - 6,120,375 13,808,906 31,748,975 74,022, ,700,382-1,530,094 3,452,227 7,937,244 7,402,213 20,321,777-4,590,281 10,356,680 23,811,731 66,619, ,378,605 Expenses Total Compensation Costs 94, , , , ,800 2,393,600 Devlopment Costs - 210, ,250 1,868,738 3,386,053 6,184,041 Audit & Legal 2,400 9,600 9,600 9,600 9,600 40,800 General and Administrative Costs - Misc. 2,500 6,000 6,000 6,000 6,000 26,500 Utilities and Telephone 750 1,800 1,800 1,800 1,800 7,950 Corporate Travel 2,300 25,000 25,000 25,000 25, ,300 Servers & Domain Costs 1,000 2,400 2,400 2,400 2,400 10,600 Advertising 13,000 48, , ,005 1,778,222 2,567,045 Rent 5,000 12,000 24,000 42,000 50, ,400 Dividends to Equity Holders - 83,333 83,333 83,333 83, ,334 Depreciation 4,960 11,905 11,905 11,905 11,905 52,579 Total Expenses 126, ,533 1,600,811 3,208,981 5,971,513 11,852,149 Earnings from Operations (126,310) 3,645,748 8,755,869 20,602,750 60,648,400 93,526,457 Add Back Depreciation 4,960 11,905 11,905 11,905 11,905 52,579 Cash Flow from Operations Beginning Cash Balance Before Distributions Capital provided by Investor Less Start-up Costs Less Principal Paid Ending Cash Balance Before Distributions (121,350) 3,657,653 8,767,773 20,614,655 60,660,305 93,579,036-2,368,650 5,996,303 14,764,076 35,378,731 58,507,760 2,530, ,530,000 (40,000) (40,000) (30,000) (30,000) 2,368,650 5,996,303 14,764,076 35,378,731 96,039, ,546,796
3
4
5
6 Assumptions to projections 1 Hard currency will be used for expenses not authorized using Bitcoins 2 All salaries and dividend payments will be in the form of Bitcoins unless otherwise stipulated 3 income tax is not figured into projections as most if not all employees will be contracted 4 The funding launch is targeted for October 2014 and will include three separate offerings in October, November and December 5 Payments to initial equity provided to be started January 1st, 2015 at $10,000 per month until paid in full 6 No interest will be paid on equity providied by founder as per initial agreement 7 Equity holders from the IPO sale with receive a proposed 10% on investment dependent on the profitibility of the company 8 Dividends are not guarenteed and are at the sole discretion of BitNation 9 Dividends paid at 10% each year anticipating starting from year 2 10 Cash flow from operations anticipated beginning of Projected revenues are based on a 5 year plan but will not be realized until year 2. This is reflected in the total revenue sources along with the summary cash flo
7 Projected 5 Year Cash Flow Year One Projected 5 Year Cash Flow Year 2 Projected 5 Year Cash Flow Year Three Projected 5 Year Cash Flow Year Four Projected 5 Year Cash Flow Year Five Date Mar-14 Apr-14 May-14 Jun-14 Jul-14 Aug-14 Sep-14 Oct-14 Nov-14 Dec-14 Yr 1-5 Months Date Jan-15 Feb-15 Mar-15 Apr-15 May-15 Jun-15 Jul-15 Aug-15 Sep-15 Oct-15 Nov-15 Dec-15 Yr 2 Date Jan-16 Feb-16 Mar-16 Apr-16 May-16 Jun-16 Jul-16 Aug-16 Sep-16 Oct-16 Nov-16 Dec-16 Yr 3 Date Jan-17 Feb-17 Mar-17 Apr-17 May-17 Jun-17 Jul-17 Aug-17 Sep-17 Oct-17 Nov-17 Dec-17 Yr 4 Date Jan-18 Feb-18 Mar-18 Apr-18 May-18 Jun-18 Jul-18 Aug-18 Sep-18 Oct-18 Nov-18 Dec-18 Yr 5 Month Number Month Number Month Number Month Number Month Number Revenues and Costs Revenues and Costs Revenues and Costs Revenues and Costs Revenues and Costs Gross Revenue (see revenue tab) Gross Revenue (see revenue tab) 510, , , , , , , , , , , ,031 6,120,375 Gross Revenue (see Contract tab) 1,150,742 1,150,742 1,150,742 1,150,742 1,150,742 1,150,742 1,150,742 1,150,742 1,150,742 1,150,742 1,150,742 1,150,742 13,808,906 Gross Revenue (see Contract tab) 2,645,748 2,645,748 2,645,748 2,645,748 2,645,748 2,645,748 2,645,748 2,645,748 2,645,748 2,645,748 2,645,748 2,645,748 31,748,975 Gross Revenue (see Contract tab) 6,168,511 6,168,511 6,168,511 6,168,511 6,168,511 6,168,511 6,168,511 6,168,511 6,168,511 6,168,511 6,168,511 6,168,511 74,022,126 Cost of Goods Sold (see revenue tab) Cost of Goods Sold (see revenue tab) 127, , , , , , , , , , , ,508 1,530,094 Cost of Goods Sold (see Contract tab) 287, , , , , , , , , , , ,686 3,452,227 Cost of Goods Sold (see Contract tab) 661, , , , , , , , , , , ,437 7,937,244 Cost of Goods Sold (see Contract tab) 616, , , , , , , , , , , ,851 7,402,213 Gross Profit Gross Profit 382, , , , , , , , , , , ,523 4,590,281 Gross Profit 863, , , , , , , , , , , ,057 10,356,680 Gross Profit 1,984,311 1,984,311 1,984,311 1,984,311 1,984,311 1,984,311 1,984,311 1,984,311 1,984,311 1,984,311 1,984,311 1,984,311 23,811,731 Gross Profit 5,551,659 5,551,659 5,551,659 5,551,659 5,551,659 5,551,659 5,551,659 5,551,659 5,551,659 5,551,659 5,551,659 5,551,659 66,619,914 Gross Profit % [1] Gross Profit % 75% 75% 75% 75% 75% 75% 75% 75% 75% 75% 75% 75% 75% Gross Profit % 75% 75% 75% 75% 75% 75% 75% 75% 75% 75% 75% 75% 75% Gross Profit % 75% 75% 75% 75% 75% 75% 75% 75% 75% 75% 75% 75% 75% Gross Profit % 90% 90% 90% 90% 90% 90% 90% 90% 90% 90% 90% 90% 90% Expenses Expenses Expenses Expenses Expenses Administrative Payroll # Administrative Payroll # Administrative Payroll # Administrative Payroll # Administrative Payroll # x CEO ,000 5,000 5,000 5,000 5,000 5,000 30,000 CEO 5,000 5,000 5,000 5,000 5,000 5,000 5,000 5,000 5,000 5,000 5,000 5,000 60,000 CEO 5,250 5,250 5,250 5,250 5,250 5,250 5,250 5,250 5,250 5,250 5,250 5,250 63,000 CEO 6,000 6,000 6,000 6,000 6,000 6,000 6,000 6,000 6,000 6,000 6,000 6,000 72,000 CEO 6,000 6,000 6,000 6,000 6,000 6,000 6,000 6,000 6,000 6,000 6,000 6,000 72,000 x CTO ,000 8,000 16,000 CTO 10,000 10,000 10,000 10,000 10,000 10,000 10,000 10,000 10,000 10,000 10,000 10, ,000 CTO 10,300 10,300 10,300 10,300 10,300 10,300 10,300 10,300 10,300 10,300 10,300 10, ,600 CTO 11,000 11,000 11,000 11,000 11,000 11,000 11,000 11,000 11,000 11,000 11,000 11, ,000 CTO 11,500 11,500 11,500 11,500 11,500 11,500 11,500 11,500 11,500 11,500 11,500 11, ,000 x CFO ,200 1,200 1,200 4,900 CFO 2,000 2,000 2,000 2,000 2,000 2,000 2,000 2,000 2,000 2,000 2,000 2,000 24,000 CFO 2,250 2,250 2,250 2,250 2,250 2,250 2,250 2,250 2,250 2,250 2,250 2,250 27,000 CFO 2,500 2,500 2,500 2,500 2,500 2,500 2,500 2,500 2,500 2,500 2,500 2,500 30,000 CFO 2,750 2,750 2,750 2,750 2,750 2,750 2,750 2,750 2,750 2,750 2,750 2,750 33,000 x CCO COO 5,000 5,000 5,000 5,000 5,000 5,000 5,000 5,000 5,000 5,000 5,000 5,000 60,000 COO 5,250 5,250 5,250 5,250 5,250 5,250 5,250 5,250 5,250 5,250 5,250 5,250 63,000 COO 5,500 5,500 5,500 5,500 5,500 5,500 5,500 5,500 5,500 5,500 5,500 5,500 66,000 COO 5,750 5,750 5,750 5,750 5,750 5,750 5,750 5,750 5,750 5,750 5,750 5,750 69,000 x Communications Contractor - - 1,000 2,000 2,000 5,000 Communications Contractor 2,000 2,000 2,000 2,000 2,000 2,000 2,000 2,000 2,000 2,000 2,000 2,000 24,000 Communications Contractor 2,100 2,100 2,100 2,100 2,100 2,100 2,100 2,100 2,100 2,100 2,100 2,100 25,200 Communications Contractor 2,200 2,200 2,200 2,200 2,200 2,200 2,200 2,200 2,200 2,200 2,200 2,200 26,400 Communications Contractor 2,300 2,300 2,300 2,300 2,300 2,300 2,300 2,300 2,300 2,300 2,300 2,300 27,600 x Creative Director 2,500 5,000 5,000 5,000 5,000 22,500 Creative Director 5,000 5,000 5,000 5,000 5,000 5,000 5,000 5,000 5,000 5,000 5,000 5,000 60,000 Creative Director - Richard 5,250 5,250 5,250 5,250 5,250 5,250 5,250 5,250 5,250 5,250 5,250 5,250 63,000 Creative Director - Richard 5,500 5,500 5,500 5,500 5,500 5,500 5,500 5,500 5,500 5,500 5,500 5,500 66,000 Creative Director - Richard 5,750 5,750 5,750 5,750 5,750 5,750 5,750 5,750 5,750 5,750 5,750 5,750 69,000 x Administration & Finance - - 1,000 1,000 1,000 3,000 Administration & Finance 4,000 4,000 4,000 4,000 4,000 4,000 4,000 4,000 4,000 4,000 4,000 4,000 48,000 Administration & Finance 4,250 4,250 4,250 4,250 4,250 4,250 4,250 4,250 4,250 4,250 4,250 4,250 51,000 Administration & Finance 4,500 4,500 4,500 4,500 4,500 4,500 4,500 4,500 4,500 4,500 4,500 4,500 54,000 Administration & Finance 4,750 4,750 4,750 4,750 4,750 4,750 4,750 4,750 4,750 4,750 4,750 4,750 57,000 x Other Development Contractors 2,000 2,000 4,000 4,000 12,000 Other Development Contractors 2,000 2,000 2,000 2,000 2,000 2,000 2,000 2,000 2,000 2,000 2,000 2,000 24,000 Other Development Contractors 2,000 2,000 2,000 2,000 2,000 2,000 2,000 2,000 2,000 2,000 2,000 2,000 24,000 Other Development Contractors 2,250 2,250 2,250 2,250 2,250 2,250 2,250 2,250 2,250 2,250 2,250 2,250 27,000 Other Development Contractors 2,500 2,500 2,500 2,500 2,500 2,500 2,500 2,500 2,500 2,500 2,500 2,500 30,000 x Technical Director Technical Director 8,000 8,000 8,000 8,000 8,000 8,000 8,000 8,000 8,000 8,000 8,000 8,000 96,000 Technical Director 8,200 8,200 8,200 8,200 8,200 8,200 8,200 8,200 8,200 8,200 8,200 8,200 98,400 Technical Director 8,400 8,400 8,400 8,400 8,400 8,400 8,400 8,400 8,400 8,400 8,400 8, ,800 Technical Director 8,600 8,600 8,600 8,600 8,600 8,600 8,600 8,600 8,600 8,600 8,600 8, ,200 x Advisors (3 independent contracts@ $500 each / mth.) , ,000 Advisors (3 independent contracts@ $500 each / mth.) 1,500 1,500 1,500 1,500 1,500 1,500 1,500 1,500 1,500 1,500 1,500 1,500 18,000 Advisors (3 independent contracts@ $500 each / mth.) 1,500 1,500 1,500 1,500 1,500 1,500 1,500 1,500 1,500 1,500 1,500 1,500 18,000 Advisors (3 independent contracts@ $500 each / mth.) 1,500 1,500 1,500 1,500 1,500 1,500 1,500 1,500 1,500 1,500 1,500 1,500 18,000 Advisors (3 independent contracts@ $500 each / mth.) 1,500 1,500 1,500 1,500 1,500 1,500 1,500 1,500 1,500 1,500 1,500 1,500 18,000 Total Compensation Costs ,000 8,000 12,800 15,200 26,200 26,200 94,400 Total Compensation Costs 44,500 44,500 44,500 44,500 44,500 44,500 44,500 44,500 44,500 44,500 44,500 44, ,000 Total Compensation Costs 46,350 46,350 46,350 46,350 46,350 46,350 46,350 46,350 46,350 46,350 46,350 46, ,200 Total Compensation Costs 49,350 49,350 49,350 49,350 49,350 49,350 49,350 49,350 49,350 49,350 49,350 49, ,200 Total Compensation Costs 51,400 51,400 51,400 51,400 51,400 51,400 51,400 51,400 51,400 51,400 51,400 51, ,800 x Added Dev Hires Added Dev Hires Added Dev Hires Added Dev Hires Added Dev Hires x Addtional Dev Salaries - Additional Dev Salaries 5,000 5,000 10,000 10,000 15,000 15,000 20,000 20,000 25,000 25,000 30,000 30, ,000 Addtional Dev Salaries 31,500 31,500 36,750 42,000 47,250 52,500 57,750 63,000 73,500 84,000 94, , ,250 Addtional Dev Salaries 126, , , , , , , , , , , ,863 1,868,738 Addtional Dev Salaries 185, , , , , , , , , , , ,864 3,386,053 x Audit & Legal ,400 Audit & Legal ,600 Audit & Legal ,600 Audit & Legal ,600 Audit & Legal ,600 x General and Administrative Costs - Misc ,500 General and Administrative Costs - Misc ,000 General and Administrative Costs - Misc ,000 General and Administrative Costs - Misc ,000 General and Administrative Costs - Misc ,000 x Utilities and Telephone Utilities and Telephone ,800 Utilities and Telephone ,800 Utilities and Telephone ,800 Utilities and Telephone ,800 x Corporate Travel , ,300 Corporate Travel 5,000 1,750 1,750 1,750 1,750 1,750 1,750 1,750 1,750 2,500 1,750 1,750 25,000 Corporate Travel 5,000 1,750 1,750 1,750 1,750 1,750 1,750 1,750 1,750 2,500 1,750 1,750 25,000 Corporate Travel 5,000 1,750 1,750 1,750 1,750 1,750 1,750 1,750 1,750 2,500 1,750 1,750 25,000 Corporate Travel 5,000 1,750 1,750 1,750 1,750 1,750 1,750 1,750 1,750 2,500 1,750 1,750 25,000 x Servers & Domain Costs ,000 Servers & Domain Costs ,400 Servers & Domain Costs ,400 Servers & Domain Costs ,400 Servers & Domain Costs ,400 x Ambassador Bounty 0 4,000 4,000 8,000 Ambasssador Bounty 50,000 75, , ,000 Ambassador Bounty Ambassador Bounty Ambassador Bounty x DAP Bounty Program 0 4,000 4,000 8,000 DAPBounty P 50,000 75, , ,000 DAP Bounty Program DAP Bounty Program DAP Bounty Program x Advertising - - 1,000 2,000 10,000 13,000 Advertising 25,000 1,043 1,043 1,133 1,341 1,579 1,871 2,212 2,612 3,096 3,511 4,054 48,495 Advertising 6,208 7,225 8,059 9,332 10,461 11,986 13,238 15,082 16,712 18,910 20,745 23, ,323 Advertising 25,698 28,815 31,480 35,173 38,517 42,912 46,783 51,994 56,810 63,034 68,693 76, ,005 Advertising 83,109 92, , , , , , , , , , ,729 1,778,222 x Rent ,000 1,000 1,000 1,000 1,000 5,000 Rent 1,000 1,000 1,000 1,000 1,000 1,000 1,000 1,000 1,000 1,000 1,000 1,000 12,000 Rent 2,000 2,000 2,000 2,000 2,000 2,000 2,000 2,000 2,000 2,000 2,000 2,000 24,000 Rent 3,500 3,500 3,500 3,500 3,500 3,500 3,500 3,500 3,500 3,500 3,500 3,500 42,000 Rent 4,200 4,200 4,200 4,200 4,200 4,200 4,200 4,200 4,200 4,200 4,200 4,200 50,400 x Dividends to Equity Holders Dividends to Equity Holders ,333 83,333 Dividends to Equity Holders ,333 83,333 Dividends to Equity Holders ,333 83,333 Dividends to Equity Holders ,333 83,333 x Depreciation ,960 Depreciation ,905 Depreciation ,905 Depreciation ,905 Depreciation ,905 Total Expenses ,000 10,842 15,642 21,342 39,842 48, ,310 Total Expenses 183,143 55,936 60, ,027 66,236 66, ,767 72,108 77,509 78,743 83, ,285 1,394,533 Total Expenses 93,706 91,473 97, , , , , , , , , ,460 1,600,811 Total Expenses 213, , , , , , , , , , , ,563 3,208,981 Total Expenses 331, , , , , , , , , , , ,980 5,971,513 Earnings From Operations (6,000) (10,842) (15,642) (21,342) (39,842) (48,642) (142,310) Earnings From Operations 199, , , , , , , , , , , ,238 3,195,748 Earnings From Operations 769, , , , , , , , , , , ,596 8,755,869 Earnings From Operations 1,771,310 1,754,903 1,735,697 1,732,004 1,728,660 1,724,265 1,720,394 1,715,183 1,710,367 1,703,393 1,698,484 1,607,747 20,602,750 Earnings From Operations 5,220,056 5,197,039 5,171,322 5,143,299 5,115,582 5,085,318 5,055,480 5,016,743 4,978,087 4,935,181 4,917,024 4,812,679 60,648,400 Add Back Depreciation ,960 Add Back Depreciation ,905 Add Back Depreciation ,905 Add Back Depreciation ,905 Add Back Depreciation ,905 Cash Flow from Operations (6,000) (9,850) (14,650) (20,350) (38,850) (47,650) (137,350) Cash Flow from Operations 200, , , , , , , , , , , ,230 3,207,653 Cash Flow from Operations 770, , , , , , , , , , , ,588 8,767,773 Cash Flow from Operations 1,772,302 1,755,895 1,736,689 1,732,996 1,729,652 1,725,257 1,721,386 1,716,175 1,711,359 1,704,385 1,699,476 1,608,740 20,614,655 Cash Flow from Operations 5,221,048 5,198,031 5,172,314 5,144,291 5,116,574 5,086,310 5,056,472 5,017,735 4,979,079 4,936,173 4,918,016 4,813,671 60,660,305 Costs Costs Costs 129,996 Costs Costs Start-up Cost (See Tab) 50, Start-up Cost (See Tab) Start-up Cost (See Tab) Start-up Cost (See Tab) Start-up Cost (See Tab) Capital Capital Capital Capital Capital Total Equity provided by Investor & IPO (Oct-14) 30,000 30,000 30,000 30,000 30,000 30,000 30, , , ,334 Total Equity provided by Investor 863, , , , , , , , , , , ,334 Total Equity provided by Investor 833, , , , , , , , , , , ,334 Total Equity provided by Investor 833, , , , , , , , , , , ,334 Total Equity provided by Investor 833, , , , , , , , , , , ,334 Less Principal Paid - - Less Principal Paid 10,000 10,000 10,000 - Less Principal Paid - - Less Principal Paid - Less Principal Paid - - Ending Investor Liability 30,000 30,000 30,000 30,000 30,000 30,000 30, , , ,334 Ending Investor Liability 853, , , , , , , , , , , ,334 - Ending Investor Liability 833, , , , , , , , , , , ,334 Ending Investor Liability 833, , , , , , , , , , , ,334 Ending Investor Liability 833, , , , , , , , , , , ,334 Interest Interest Interest Interest Interest On equity On equity - ` On equity On equity On equity less Paid less Paid - ` less Paid less Paid less Paid Cash Flow Cash Flow Cash Flow Cash Flow Cash Flow Beginning Cash Balance Before Distributions - (20,000) (20,000) (20,000) (20,000) (26,000) (35,850) (50,500) 792,483 1,616,966 - Beginning Cash Balance Before Distributions 2,432,650 2,623,022 2,940,602 3,253,180 3,425,669 3,742,948 4,059,990 4,171,738 4,483,146 4,789,152 5,093,924 5,394,031 2,432,650 Beginning Cash Balance Before Distributions 5,610,261 6,380,603 7,153,179 7,919,670 8,679,636 9,433,223 10,180,034 10,920,341 11,653,554 12,374,635 13,082,265 13,778,309 5,610,261 Beginning Cash Balance Before Distributions 14,377,897 16,150,199 17,906,094 19,642,783 21,375,779 23,105,431 24,830,688 26,552,074 28,268,248 29,979,607 31,683,992 33,383,468 14,377,897 Beginning Cash Balance Before Distributions 34,992,208 40,213,256 45,411,288 50,583,602 55,727,894 60,844,468 65,930,779 70,987,251 76,004,986 80,984,066 85,920,239 90,838,256 34,992,208 Current month cash flow (20,000) (6,000) (9,850) (14,650) 842, , ,684 2,432,650 Current month cash flow 190, , , , , , , , , , , ,230 3,177,611 Current month cash flow 770, , , , , , , , , , , ,588 8,767,636 Current month cash flow 1,772,302 1,755,895 1,736,689 1,732,996 1,729,652 1,725,257 1,721,386 1,716,175 1,711,359 1,704,385 1,699,476 1,608,740 20,614,311 Current month cash flow 5,221,048 5,198,031 5,172,314 5,144,291 5,116,574 5,086,310 5,056,472 5,017,735 4,979,079 4,936,173 4,918,016 4,813,671 60,659,719 Ending Cash Balance Before Distributions (20,000) (20,000) (20,000) (20,000) (26,000) (35,850) (50,500) 792,483 1,616,966 2,432,650 2,432,650 Ending Cash Balance Before Distributions 2,623,022 2,940,602 3,253,180 3,425,669 3,742,948 4,059,990 4,171,738 4,483,146 4,789,152 5,093,924 5,394,031 5,610,261 5,610,261 Ending Cash Balance Before Distributions 6,380,603 7,153,179 7,919,670 8,679,636 9,433,223 10,180,034 10,920,341 11,653,554 12,374,635 13,082,265 13,778,309 14,377,897 14,377,897 Ending Cash Balance Before Distributions 16,150,199 17,906,094 19,642,783 21,375,779 23,105,431 24,830,688 26,552,074 28,268,248 29,979,607 31,683,992 33,383,468 34,992,208 34,992,208 Ending Cash Balance Before Distributions 40,213,256 45,411,288 50,583,602 55,727,894 60,844,468 65,930,779 70,987,251 76,004,986 80,984,066 85,920,239 90,838,256 95,651,927 95,651,927 bitcoins 5,000 1 milshares value $ 500 2,500,000 per month 833, over 3 months 3,195,748
8 Projected Material Cost Useful Life Depreciation Nov Laptops and software 3 yrs 25, ,000 Office Furniture and Equipment 7 yrs 15, ,000 Miscellaneous FF&E 7 yrs 10, , Total 50, ,000
9 Projected Revenues and Related Direct Costs Date Mar-14 Apr-14 May-14 Jun-14 Jul-14 Aug-14 Sep-14 Oct-14 Nov-14 Dec-14 Date Jan-15 Feb-15 Mar-15 Apr-15 May-15 Jun-15 Jul-15 Aug-15 Sep-15 Oct-15 Nov-15 Dec-15 Date Jan-16 Feb-16 Mar-16 Apr-15 May-16 Jun-16 Jul-16 Aug-16 Sep-16 Oct-16 Nov-16 Dec-16 Date Jan-17 Feb-17 Mar-17 Apr-17 May-17 Jun-17 Jul-17 Aug-17 Sep-17 Oct-17 Nov-17 Dec-17 Date Jan-18 Feb-18 Mar-18 Apr-18 May-18 Jun-18 Jul-18 Aug-18 Sep-18 Oct-18 Nov-18 Dec-18 Month Yr 1-5 Months Month Yr 2 Month Yr 3 Month Year 4 Month Yr 5 3 Contract Revenue Monthly Revenue Yr 1, 5 months Yr 2 Yr 3 Yr 4 Yr 5 Monthly Revenue Monthly Revenue Monthly Revenue Monthly Revenue Monthly Revenue Includes 3 yr multiplier for 3 services per tier Sales - 6,120,375 13,808,906 31,748,975 74,022,126 Sales Sales 510, , , , , , , , , , , ,031 6,120,375 Sales 1,150,742 1,150,742 1,150,742 1,150,742 1,150,742 1,150,742 1,150,742 1,150,742 1,150,742 1,150,742 1,150,742 1,150,742 13,808,906 Sales 2,645,748 2,645,748 2,645,748 2,645,748 2,645,748 2,645,748 2,645,748 2,645,748 2,645,748 2,645,748 2,645,748 2,645,748 31,748,975 Sales 6,168,511 6,168,511 6,168,511 6,168,511 6,168,511 6,168,511 6,168,511 6,168,511 6,168,511 6,168,511 6,168,511 6,168,511 74,022,126 25% cost of sales added for additional expenses not already on 5 Cost of sales - 1,530,094 3,452,227 7,937,244 18,505,532 Cost of sales Cost of sales 127, , , , , , , , , , , ,508 1,530,094 Cost of sales 287, , , , , , , , , , , ,686 3,452,227 Cost of sales 661, , , , , , , , , , , ,437 7,937,244 Cost of sales 616, , , , , , , , , , , ,851 7,402,213 Year one revenue multiplied by.42 to account for 5 months Gross Profit - 4,590,281 10,356,680 23,811,731 55,516,595 Gross Profit Gross Profit 382, , , , , , , , , , , ,523 4,590,281 Gross Profit 863, , , , , , , , , , , ,057 10,356,680 Gross Profit 1,984,311 1,984,311 1,984,311 1,984,311 1,984,311 1,984,311 1,984,311 1,984,311 1,984,311 1,984,311 1,984,311 1,984,311 23,811,731 Gross Profit 5,551,659 5,551,659 5,551,659 5,551,659 5,551,659 5,551,659 5,551,659 5,551,659 5,551,659 5,551,659 5,551,659 5,551,659 66,619,914
10
11
12 Projected Revenues and Related Direct Costs Y1 Y2 Y3 Y4 Y5 apps sold each year by BN apps downloaded / yr 5,000,000 7,500,000 11,250,000 16,875,000 25,312,500 apps downloaded for fee/yr 1,500, ,250, ,375, ,062, ,593, revenue from fee apps/yr $ 7,500, $ 11,250, $ 16,875, $ 25,312, $ 37,968, revenue paid to BN / yr $ 150, $ 225, $ 337, $ 506, $ 759, ,978,125 total 5 year revenue to BN per contract multiplier 1,978, total including multilpier for 1 typical services 0.25 % increase sold/yr 0.50 % increase downloaded / yr 0.30 % apps sold for fee (BC/$) per year $ 5.00 Cost of apps for fee (BC/$) 0.02 % revenue to BN per paid download 100,000 downloads per app per yr 100 number of apps sold each year by BN
13
14 Projected Revenues and Related Direct Costs Y1 Y2 Y3 Y4 Y5 ID's sold each year by BN 50, , , ,250 1,953,125 total revenue from ID / yr 1,500,000 3,750,000 9,375,000 23,437,500 58,593,750 revenue to BN for ID's 375, ,500 2,343,750 5,859,375 14,648,438 multiplier ` 1.5 % increase sold/yr $ Cost of ID (BC/$) 0.25 % revenue to BN per paid ID 24,164,063 total 5 year revenue to BN per contract 24,164, total including multilpier for 1 typical services
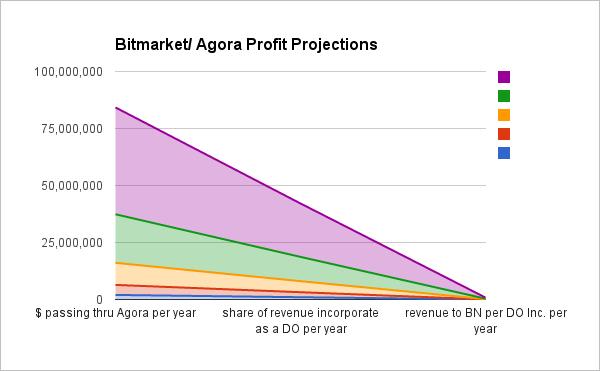
15 Projected Revenues and Related Direct Costs Y1 Y2 Y3 Y4 Y5 $ passing thru Agora per year 2,000,000 4,400,000 9,680,000 21,296,000 46,851,200 share of revenue incorporate as a DO per year 1,000,000 2,200,000 4,840,000 10,648,000 23,425,600 revenue to BN per DO Inc. per year 20,000 44,000 96, , ,512 multiplier ` 1.2 % increase in $ passing thru Agora per year 0.50 % of revenue incorporate as a DO per year 0.02 % revenue to BN per DO Inc. per year 842,272 total 5 year revenue to BN per contract 842, total including multilpier for 1 typical services
16
17 Projected Revenues and Related Direct Costs Y1 Y2 Y3 Y4 Y5 Family Contracts per year 50, , , ,400 1,171,280 revenue of contracts per year 750,000 1,650,000 3,630,000 7,986,000 17,569,200 revenue to BN per contract 375, ,000 1,815,000 3,993,000 8,784,600 multiplier ` 1.2 % increase of Family Contracts per year $ revenue per contract 0.50 % revenue to BN per contract per year 15,792,600 total 5 year revenue to BN per contract 15,792, total including multilpier for 1 typical services
18
19 Projected Revenues and Related Direct Costs Y1 Y2 Y3 Y4 Y5 Family Contracts per year revenue of contracts per year 75,000 86,250 99, , ,175 revenue to BN per contract 7,500 8,625 9,919 11,407 13,118 multiplier ` 0.15 % increase of Family Contracts per year $ revenue per contract 0.10 % revenue to BN per contract per year 50,568 total 5 year revenue to BN per contract 50, total including multilpier for 1 typical service
20 [1] ty cabaya:.
XML Publisher Balance Sheet Vision Operations (USA) Feb-02
 Feb-02") Page:1 Apr-01 May-01 Jun-01 Jul-01 ASSETS Current Assets Cash and Short Term Investments 15,862,304 51,998,607 9,198,226 Accounts Receivable - Net of Allowance 2,560,786
Page:1 Apr-01 May-01 Jun-01 Jul-01 ASSETS Current Assets Cash and Short Term Investments 15,862,304 51,998,607 9,198,226 Accounts Receivable - Net of Allowance 2,560,786
SmallBizU WORKSHEET 1: REQUIRED START-UP FUNDS. Online elearning Classroom. Item Required Amount ($) Fixed Assets. 1 -Buildings $ 2 -Land $
 Fixed Assets. 1 -Buildings $ 2 -Land $") WORKSHEET 1: REQUIRED START-UP FUNDS Item Required Amount () Fixed Assets 1 -Buildings 2 -Land 3 -Initial Inventory 4 -Equipment 5 -Furniture and Fixtures 6 -Vehicles 7 Total Fixed Assets Working Capital
WORKSHEET 1: REQUIRED START-UP FUNDS Item Required Amount () Fixed Assets 1 -Buildings 2 -Land 3 -Initial Inventory 4 -Equipment 5 -Furniture and Fixtures 6 -Vehicles 7 Total Fixed Assets Working Capital
Cost Estimation of a Manufacturing Company
 Cost Estimation of a Manufacturing Company Name: Business: Date: Economics of One Unit: Manufacturing Company (Only complete if you are making a product, such as a bracelet or beauty product) Economics
Factor Leave Accruals. Accruing Vacation and Sick Leave
 Factor Leave Accruals Accruing Vacation and Sick Leave Factor Leave Accruals As part of the transition of non-exempt employees to biweekly pay, the UC Office of the President also requires standardization
HUD NSP-1 Reporting Apr 2010 Grantee Report - New Mexico State Program
 HUD NSP-1 Reporting Apr 2010 Grantee Report - State Program State Program NSP-1 Grant Amount is $19,600,000 $9,355,381 (47.7%) has been committed $4,010,874 (20.5%) has been expended Grant Number HUD Region
Spheria Australian Smaller Companies Fund
 29-Jun-18 $ 2.7686 $ 2.7603 $ 2.7520 28-Jun-18 $ 2.7764 $ 2.7681 $ 2.7598 27-Jun-18 $ 2.7804 $ 2.7721 $ 2.7638 26-Jun-18 $ 2.7857 $ 2.7774 $ 2.7690 25-Jun-18 $ 2.7931 $ 2.7848 $ 2.7764 22-Jun-18 $ 2.7771
ACTUAL * COR ADMINISTRATION TARGETS * 2017 Target vs 2016 Target a) Number of New COR Registrations % Year (a)
 Number of New COR Registrations % Year (a)") 23-Jun-16 Date Prepared Section 1(a): BUDGET - COR ACTIVITIES ACTUAL * COR ADMINISTRATION TARGETS * # Variance (b-a) % Variance (b/a) (12 months) 2016 YTD (6 months) Year 1 Year 2 2016 (a) Year 3 2017
23-Jun-16 Date Prepared Section 1(a): BUDGET - COR ACTIVITIES ACTUAL * COR ADMINISTRATION TARGETS * # Variance (b-a) % Variance (b/a) (12 months) 2016 YTD (6 months) Year 1 Year 2 2016 (a) Year 3 2017
TERMS OF REFERENCE FOR THE INVESTMENT COMMITTEE
 I. PURPOSE The purpose of the Investment Committee (the Committee ) is to recommend to the Board the investment policy, including the asset mix policy and the appropriate benchmark for both ICBC and any
NR614: Foundations of Health Care Economics, Accounting and Financial Management
 NR614: Foundations of Health Care Economics, Accounting and Financial Management WEEK 7: Budgeting SLIDE 1: Week 7: Week Seven Sample Problem: Budgeting... There is one sample problem provided in week
Unrestricted Cash / Board Designated Cash & Investments December 2014
 Unrestricted Cash / Board Designated Cash & Investments December 2014 25.0 20.0 21.0 20.8 18.9 19.9 15.0 10.0 11.5 12.8 11.6 9.1 10.4 9.8 11.1 10.2 9.8 17.0 16.8 15.4 14.7 14.2 14.1 13.6 13.0 12.0 10.2
Review of Registered Charites Compliance Rates with Annual Reporting Requirements 2016
 Review of Registered Charites Compliance Rates with Annual Reporting Requirements 2016 October 2017 The Charities Regulator, in accordance with the provisions of section 14 of the Charities Act 2009, carried
Performance Report October 2018
 Structured Investments Indicative Report October 2018 This report illustrates the indicative performance of all Structured Investment Strategies from inception to 31 October 2018 Matured Investment Strategies
Algo Trading System RTM
 Year Return 2016 15,17% 2015 29,57% 2014 18,57% 2013 15,64% 2012 13,97% 2011 55,41% 2010 50,98% 2009 48,29% Algo Trading System RTM 89000 79000 69000 59000 49000 39000 29000 19000 9000 2-Jan-09 2-Jan-10
OTHER DEPOSITS FINANCIAL INSTITUTIONS DEPOSIT BARKAT SAVING ACCOUNT
 WEIGHTAGES JAN FEB MAR APR MAY JUN JUL AUG SEPT OCT NOV DEC ANNOUNCEMENT DATE 19.Dez.14 27.Jän.15 24.Feb.15 26.Mär.15 27.Apr.15 26.Mai.15 25.Jun.15 28.Jul.15 26.Aug.15 23.Sep.15 27.Okt.15 25.Nov.15 MUDARIB
QUESTION 2. QUESTION 3 Which one of the following is most indicative of a flexible short-term financial policy?
 QUESTION 1 Compute the cash cycle based on the following information: Average Collection Period = 47 Accounts Payable Period = 40 Average Age of Inventory = 55 QUESTION 2 Jan 41,700 July 39,182 Feb 18,921
Financial & Business Highlights For the Year Ended June 30, 2017
 Financial & Business Highlights For the Year Ended June, 17 17 16 15 14 13 12 Profit and Loss Account Operating Revenue 858 590 648 415 172 174 Investment gains net 5 162 909 825 322 516 Other 262 146
Business & Financial Services December 2017
 Business & Financial Services December 217 Completed Procurement Transactions by Month 2 4 175 15 125 1 75 5 2 1 Business Days to Complete 25 Jan Feb Mar Apr May Jun Jul Aug Sep Oct Nov Dec 217 Procurement
Big Walnut Local School District
 Big Walnut Local School District Monthly Financial Report for the month ended September 30, 2013 Prepared By: Felicia Drummey Treasurer BIG WALNUT LOCAL SCHOOL DISTRICT SUMMARY OF YEAR TO DATE FINANCIAL
WESTWOOD LUTHERAN CHURCH Summary Financial Statement YEAR TO DATE - February 28, Over(Under) Budget WECC Fund Actual Budget
 Budget WECC Fund Actual Budget") WESTWOOD LUTHERAN CHURCH Summary Financial Statement YEAR TO DATE - February 28, 2018 General Fund Actual A B C D E F WECC Fund Actual Revenue Revenue - Faith Giving 1 $ 213 $ 234 $ (22) - Tuition $ 226
WESTWOOD LUTHERAN CHURCH Summary Financial Statement YEAR TO DATE - February 28, 2018 General Fund Actual A B C D E F WECC Fund Actual Revenue Revenue - Faith Giving 1 $ 213 $ 234 $ (22) - Tuition $ 226
Key IRS Interest Rates After PPA
 Key IRS Rates - After PPA - thru 2011 Page 1 of 10 Key IRS Interest Rates After PPA (updated upon release of figures in IRS Notice usually by the end of the first full business week of the month) Below
DBS Asia Treasures Membership
 DBS Asia Treasures Membership Frequently Asked Questions 1. How do I join as a DBS Asia Treasures member? The DBS Asia Treasures membership is by invitation only. The membership may be extended to clients
Mitchell Electric Charitable Fund PO Box 409 Camilla, GA (229) or FAX:
 or FAX:") Mitchell Electric Charitable Fund PO Box 409 Camilla, GA 31730 (229) 336-5221 or 1-800-479-6034 FAX: 229-336-7088 For Office use only: Agency / Organization Application All attached sheets, including financial
Mitchell Electric Charitable Fund PO Box 409 Camilla, GA 31730 (229) 336-5221 or 1-800-479-6034 FAX: 229-336-7088 For Office use only: Agency / Organization Application All attached sheets, including financial
Isle Of Wight half year business confidence report
 half year business confidence report half year report contents new company registrations closed companies (dissolved) net company growth uk company share director age director gender naming trends sic
CPA Australia Plan Your Own Enterprise Competition
 Financial Plan Your financial plan should include: 1. A list of Start-Up Costs and how these will be paid for (eg from savings, bank loan or family loan) 2. A Breakeven Analysis, which includes: a list
1.2 The purpose of the Finance Committee is to assist the Board in fulfilling its oversight responsibilities related to:
 Category: BOARD PROCESS Title: Terms of Reference for the Finance Committee Reference Number: AB-331 Last Approved: February 22, 2018 Last Reviewed: February 22, 2018 1. PURPOSE 1.1 Primary responsibility
PHOENIX ENERGY MARKETING CONSULTANTS INC. HISTORICAL NATURAL GAS & CRUDE OIL PRICES UPDATED TO July, 2018
 Jan-01 $12.9112 $10.4754 $9.7870 $1.5032 $29.2595 $275.39 $43.78 $159.32 $25.33 Feb-01 $10.4670 $7.8378 $6.9397 $1.5218 $29.6447 $279.78 $44.48 $165.68 $26.34 Mar-01 $7.6303 $7.3271 $5.0903 $1.5585 $27.2714
Billing and Collection Agent Report For period ending January 31, To NANC
 Billing and Collection Agent Report For period ending January 31, 2016 To NANC February 4, 2016 NANPA FUND STATEMENT OF FINANCIAL POSITION JANUARY 31, 2016 Assets Cash Balance in bank account $ 3,587,973
Constructing a Cash Flow Forecast
 Constructing a Cash Flow Forecast Method and Worked Example A cash flow forecast shows the estimates of the timing and amounts of cash inflows and outflows over a period of time. The sections of a cash
Board of Directors October 2018 and YTD Financial Report
 Board of Directors October 2018 and YTD Financial Report Consolidated Financial Results Operating Margin October ($30,262) $129,301 ($159,563) Year-to-date $292,283 $931,358 ($639,076) Excess of Revenue
City of Joliet 2014 Revenue Review. October 2013
 City of Joliet 2014 Revenue Review October 2013 General Fund 2014 Est. Revenues = $163.6 M Licenses, Permits, Fees Gaming Taxes 5% 12% Sales Taxes 27% Income Taxes 9% Charges for Services 14% Other Taxes
Common stock prices 1. New York Stock Exchange indexes (Dec. 31,1965=50)2. Transportation. Utility 3. Finance
2. Transportation. Utility 3. Finance") Digitized for FRASER http://fraser.stlouisfed.org/ Federal Reserve Bank of St. Louis 000 97 98 99 I90 9 9 9 9 9 9 97 98 99 970 97 97 ""..".'..'.."... 97 97 97 97 977 978 979 980 98 98 98 98 98 98 987 988
Digitized for FRASER http://fraser.stlouisfed.org/ Federal Reserve Bank of St. Louis 000 97 98 99 I90 9 9 9 9 9 9 97 98 99 970 97 97 ""..".'..'.."... 97 97 97 97 977 978 979 980 98 98 98 98 98 98 987 988
HOLLY DRIVE LEADERSHIP ACADEMY CASHFLOW PROJECTIONS FISCAL YEAR
 FISCAL YEAR 201920 2020 2020 PRIOR YEAR P2 P1 P2 201920 201920 Jul19 Aug19 Sep19 Oct19 Nov19 Dec19 Jan20 Feb20 Mar20 Apr20 May20 Jun20 Accrual Actuals INCOME 80118096 Local Control Funding Formula Sources
Executive Summary. July 17, 2015
 Executive Summary July 17, 2015 The Revenue Estimating Conference adopted interest rates for use in the state budgeting process. The adopted interest rates take into consideration current benchmark rates
HIPIOWA - IOWA COMPREHENSIVE HEALTH ASSOCIATION Unaudited Balance Sheet As of July 31
 Unaudited Balance Sheet As of July 31 Total Enrollment: 407 Assets: Cash $ 9,541,661 $ 1,237,950 Invested Cash 781,689 8,630,624 Premiums Receivable 16,445 299,134 Prepaid 32,930 34,403 Assessments Receivable
HIPIOWA - IOWA COMPREHENSIVE HEALTH ASSOCIATION Unaudited Balance Sheet As of January 31
 Unaudited Balance Sheet As of January 31 Total Enrollment: 371 Assets: Cash $ 1,408,868 $ 1,375,117 Invested Cash 4,664,286 4,136,167 Premiums Receivable 94,152 91,261 Prepaid 32,270 33,421 Assessments
Draft Budget - 3 Rig July 2018 through June 2019
 Draft Budget - 3 Rig July 2018 through June 2019 Draft Budget 05/02/2018 July 18 August 18 September 18 October 18 November 18 December 18 January 19 February 19 March 19 April 19 May 19 June 19 TOTAL
Draft Budget - 4 Rig July 2018 through June 2019
 Draft Budget - 4 Rig July 2018 through June 2019 Draft Budget 05/02/2018 July 18 August 18 September 18 October 18 November 18 December 18 January 19 February 19 March 19 April 19 May 19 June 19 TOTAL
Investit Software Inc. INVESTOR PRO CANADA 20 UNIT CONDOMINIUM DEVELOPMENT EXAMPLE
 INVESTOR PRO CANADA 20 UNIT CONDOMINIUM DEVELOPMENT EXAMPLE INTRODUCTION This example uses the Development Condominium template. This practice example consists of two Sections; 1. The input information
Investing for now and the future. Co-opTrust Investment Services Presentation by Lydia Muchiri 26 June 2010
 Investing for now and the future Co-opTrust Investment Services Presentation by Lydia Muchiri 26 June 2010 Outline Saving vs Investing Key Considerations before starting Stages of life and investing Set
Revised October 17, 2016
 Revised October 17, 2016 60 ISM Manufacturing Purchasing Managers Index (September 2015 September 2016) 58 56 54 52 50 48 46 44 42 Sept-15 Oct Nov Dec Jan-16 Feb Mar Apr May Jun Jul Aug Sept Purchasing
Net Quick Assets. Target = $510,050 (6 months operating expenses) 12 Month Average Monthly Operating Expenses = $85,008
 12 Month Average Monthly Operating Expenses = $85,008") $800,000 $600,000 $400,000 Net Quick Assets Target = $510,050 (6 months operating expenses) 12 Month Average Monthly Operating Expenses = $85,008 Current Assets Current Liabilities Current Net FINANCIAL
$800,000 $600,000 $400,000 Net Quick Assets Target = $510,050 (6 months operating expenses) 12 Month Average Monthly Operating Expenses = $85,008 Current Assets Current Liabilities Current Net FINANCIAL
Billing and Collection Agent Report For period ending August 31, 2016 To B&C Working Group September 15, 2016
 Billing and Collection Agent Report For period ending August 31, 2016 To B&C Working Group September 15, 2016 Welch LLP - Chartered Professional Accountants 123 Slater Street, 3 rd floor, Ottawa, ON K1P
Unrestricted Cash / Board Designated Cash & Investments December 2015
 Unrestricted Cash / Board Designated Cash & Investments December 2015 25.0 21.0 20.0 19.5 18.9 18.1 16.8 16.5 15.9 15.0 10.0 11.0 12.8 9.1 10.4 9.8 11.1 14.7 14.2 14.1 9.9 12.0 8.4 13.0 10.2 11.6 14.9
Historical Pricing PJM COMED, Around the Clock. Cal '15 Cal '16 Cal '17 Cal '18 Cal '19 Cal '20 Cal '21 Cal '22
 $50 Historical Pricing PJM COMED, Around the Clock $48 $46 $44 $42 $40 $38 $36 $34 $32 $30 $28 $26 Cal '15 Cal '16 Cal '17 Cal '18 Cal '19 Cal '20 Cal '21 Cal '22 The information presented above was gathered
New Horizons Balance Sheet as at December 31, 1997
 Balance Sheet as at December 31, 1997 CURRENT ASSETS: Cash $152,350 Accounts Receivable 74,000 Office Supplies 800 Total Current Assets $227,150 CAPITAL ASSETS: Office Furniture $5,000 Less: Accumulated
Monthly Mutual Fund Report
 July, Monthly Mutual Fund Report Statistics for May-June Sales and Redemptions Total assets for all funds increased in May by $9. billion, or., to $.7 trillion. Money market funds had a net cash outflow
Billing and Collection Agent Report For period ending January 31, To B&C Working Group
 Billing and Collection Agent Report For period ending January 31, 2018 To B&C Working Group February 5, 2018 NANPA FUND STATEMENT OF FINANCIAL POSITION January 31, 2018 Assets Cash in bank $ 4,550,060
2009 Reassessment As Impacted by Senate Bill 711
 Saint Louis County 2009 Reassessment As Impacted by Senate Bill 711 Impacts of SB711 on the 2009 Reassessment Plan The County must notify property owners of changes in the projected tax liability resulting
Japan Securities Finance Co.,Ltd
 Japan Securities Finance Co.,Ltd \ mil ( )ratio of OR Mar-13 Mar-14 Securities Finance Bussiness 14,093 16,363 Margin Loan Business 6,625 9,240 (37.5%) (47.2%) Interest on Loans 1,760 4,012 Interest
Billing and Collection Agent Report For period ending April 30, To FCC Contract Oversight Sub Committee
 Billing and Collection Agent Report For period ending April 30, 2018 To FCC Contract Oversight Sub Committee May 10, 2018 NANPA FUND STATEMENT OF FINANCIAL POSITION April 30, 2018 Assets Cash in bank $
Big Walnut Local School District
 Big Walnut Local School District Monthly Financial Report for the month ended September 30, 2012 Prepared By: Felicia Drummey Treasurer BIG WALNUT LOCAL SCHOOL DISTRICT SUMMARY OF YEAR-TO-DATE FINANCIAL
SCHEDULE 10 INDEX FACTOR
 SCHEDULE 10 INDEX FACTOR SCHEDULE 10 INDEX FACTOR 1. GENERAL 1.1 Capitalized Terms Capitalized terms used in this Schedule have the definitions as set out in the Agreement to Design, Build, Finance and
1: Product Profitability Analysis - Exercise
 1: Product Profitability Analysis - Exercise PRODUCT TOTAL Filter Bolt Drum PRICE ( ) 12 6 15 COST ( ) 8 3 12 ANNUAL SALES ( ) 1,440k 1,800k 2,500k 5,740k AVERAGE STOCK ( ) 210k 850k 240k 1,300k 1 Typical
Regional overview Gisborne
 Regional overview Purchasing intentions - additional income-related rent subsidy (IRRS) places Area District 1 2 3 4+ TOTAL 3 35 5 7 total 3 35 5 7 7 8 9 1 11 Purchasing intentions - change within the
Development of Economy and Financial Markets of Kazakhstan
 Development of Economy and Financial Markets of Kazakhstan National Bank of Kazakhstan Macroeconomic development GDP, real growth, % 116 112 18 14 1 113,5 11,7 216,7223,8226,5 19,8 19,8 19,3 19,619,7 199,
AB SICAV I. Report of income for UK tax purposes. Dear Investor,
 AB SICAV I Report of income for UK tax purposes Dear Investor, This website comprises a report of income to investors who held investments in AB SICAV I as at 31 May 2017. The classes of shares listed
SCHEDULE 10 INDEX FACTOR
 DRAFT SCHEDULE 10 INDEX FACTOR SCHEDULE 10 INDEX FACTOR 1. GENERAL 1.1 Capitalized Terms Capitalized terms used in this Schedule have the definitions as set out in the Agreement to Design, Build, Finance
Historical Pricing PJM PSEG, Around the Clock. Cal '15 Cal '16 Cal '17 Cal '18 Cal '19 Cal '20 Cal '21 Cal '22
 $70 Historical Pricing PJM PSEG, Around the Clock $65 $60 $55 $50 $45 $40 $35 $30 $25 Cal '15 Cal '16 Cal '17 Cal '18 Cal '19 Cal '20 Cal '21 Cal '22 The information presented above was gathered and compiled
PRESS RELEASE. Securities issued by Hungarian residents and breakdown by holding sectors. January 2019
 7 March 2019 PRESS RELEASE Securities issued by Hungarian residents and breakdown by holding sectors January 2019 According to securities statistics, the amount outstanding of equity securities and debt
U.S. Natural Gas Storage Charts
 U.S. Natural Gas Storage Charts BMO Capital Markets Commodity Products Group November 26, 214 Total U.S. Natural Gas in Storage 5, Total Stocks This Week 3432 4, 3, 2, 1, Reported On: November 26, 214
TERMS OF REFERENCE FOR THE FINANCE AND AUDIT COMMITTEE
 I. PURPOSE A. The primary function of the Finance and Audit Committee (the Committee ) is to assist the Board in fulfilling its oversight responsibilities by reviewing: i) the accuracy of financial information
Net Quick Assets. Target = $475,816 (5 months operating expenses) 12 Month Average Monthly Operating Expenses = $95,163
 12 Month Average Monthly Operating Expenses = $95,163") $1,200,000 $1,000,000 $800,000 $600,000 $400,000 Net Quick Assets Target = $475,816 (5 months operating expenses) 12 Month Average Monthly Operating Expenses = $95,163 Current Assets Current Liabilities
$1,200,000 $1,000,000 $800,000 $600,000 $400,000 Net Quick Assets Target = $475,816 (5 months operating expenses) 12 Month Average Monthly Operating Expenses = $95,163 Current Assets Current Liabilities
Capturing equity gains whilst protecting portfolios
 Capturing equity gains whilst protecting portfolios Edward Park Q2 2018 MSCI North America Total Return in USD (2017 Discrete Calendar Months) 4.00% 3.50% 3.00% 2.50% 2.00% 1.50% 1.00% 0% 0.00% Jan-17
Regional overview Hawke's Bay
 Regional overview Purchasing intentions - additional income-related rent subsidy (IRRS) places Area Hastings Central 1 2 3 4+ TOTAL 5 5 25 125 3 3 1 7 total 8 8 35 195 7 8 9 1 11 Purchasing intentions
CONNECT FOR HEALTH COLORADO
 CONNECT FOR HEALTH COLORADO FISCAL YEAR 2017 BUDGET BOARD OF DIRECTORS PRESENTATION JUNE 13, 2016 1 Key Fiscal Year 2017 Budget Assumptions Carrier fee of 3.5% of exchange generated premiums for entire
Consumer Price Index (Base year 2014) Consumer Price Index
 Consumer Price Index") Consumer Price Index December 2016 (Base year 2014) Consumer Price Index 1 Release Date: January 2017 Detailed by: Expenditure groups Household welfare levels Household type Regions Briefing This publication
Consumer Price Index December 2016 (Base year 2014) Consumer Price Index 1 Release Date: January 2017 Detailed by: Expenditure groups Household welfare levels Household type Regions Briefing This publication
NATIONAL PTA. FINANCIAL STATEMENTS September (Unaudited)
") NATIONAL PTA FINANCIAL STATEMENTS September 2016 TABLE OF CONTENTS Executive Summary 1 National PTA Statement of Financial Position A 1 Statement of Net Assets A 4 Statement of Activities Actual vs. Budget
NATIONAL PTA FINANCIAL STATEMENTS September 2016 TABLE OF CONTENTS Executive Summary 1 National PTA Statement of Financial Position A 1 Statement of Net Assets A 4 Statement of Activities Actual vs. Budget
Consumer Price Index (Base year 2014) Consumer Price Index
 Consumer Price Index") Consumer Price Index December 2017 (Base year 2014) Consumer Price Index 1 Release Date: January 2018 Detailed by: Expenditure groups Household welfare levels Household type Regions Briefing This publication
Consumer Price Index December 2017 (Base year 2014) Consumer Price Index 1 Release Date: January 2018 Detailed by: Expenditure groups Household welfare levels Household type Regions Briefing This publication
CONNECT FOR HEALTH COLORADO
 CONNECT FOR HEALTH COLORADO FISCAL 2017 BUDGET FINANCE AND OPERATIONS COMMITTEE MAY 23, 2016 1 Key FY 2017 Budget Assumptions Carrier fee of 3.5% for entire period, Special Fee Assessment of $1.80 per
Aon Hewitt. Facts & Figures. July 2017 Update. Risk. Reinsurance. Human Resources. Empower Results
 Aon Hewitt Facts & Figures Risk. Reinsurance. Human Resources. Empower Results Facts & Figures Contents In this document... This button normally prints the whole document. If you want to print just the
December 10, Butler School District 53 1
 December 10, 2018 Butler School District 53 1 Key Terms Aggregate Levy annual corporate levy other than debt service Debt Service Levy made to retire the principal or pay interest on bonds Property Tax
Solution to Problem 31 Adjusting entries. Solution to Problem 32 Closing entries.
 Solution to Problem 31 Adjusting entries. 1. Utilities expense 27,000 Accounts payable 27,000 2. Rent revenue 4,000 Unearned revenue 4,000 3. Supplies 2,000 Supplies expense 2,000 4. Interest receivable
BNDES: The Financial Support for IT and Innovation Projects. December 2010
 BNDES: The Financial Support for IT and Innovation Projects December 2010 Demand Drivers for IT in Brazil Domestic demandis supporting growth: increasing employment rates and salaries; reducing social
FOR RELEASE: MONDAY, MARCH 21 AT 4 PM
 Interviews with 1,012 adult Americans conducted by telephone by Opinion Research Corporation on March 18-20, 2011. The margin of sampling error for results based on the total sample is plus or minus 3
Great Lakes Community Action Partnership, Inc. Financial Dashboard For the period ending February 28, 2019
 Financial Dashboard Cash Balances: Balance Sheet Current Last Month 9/30/2018 Current Last Month Year-to-Date Fund Group Gain (Loss): Operations Statements Corporate $ 1,117,912 $ 964,326 $ 611,684 Program
Review of Membership Developments
 RIPE Network Coordination Centre Review of Membership Developments 7 October 2009/ GM / Lisbon http://www.ripe.net 1 Applications development RIPE Network Coordination Centre 140 120 100 80 60 2007 2008
Six good reasons for choosing DNB in the new banking environment
 Six good reasons for choosing DNB in the new banking environment Bank of America Merrill Lynch, 18th Annual Banking & Insurance CEO Conference 2013 24 September, London Rune Bjerke, CEO of DNB 1 Reason
PRESS RELEASE. Securities issued by Hungarian residents and breakdown by holding sectors. October 2018
 PRESS RELEASE 10 December 2018 Securities issued by Hungarian residents and breakdown by holding sectors October 2018 According to securities statistics, the amount outstanding of equity securities and
Economic Activity Index ( GDB-EAI ) For the month of May 2013 G O V E R N M E N T D E V E L O P M E N T B A N K F O R P U E R T O R I C O
 For the month of May 2013 G O V E R N M E N T D E V E L O P M E N T B A N K F O R P U E R T O R I C O") Economic Activity Index ( GDB-EAI ) For the month of May 2013 General Commentary May 2013 GDB-EAI for the month of May registered a 3.4% year-over-year ( YOY ) reduction May 2013 EAI was 126.7, a 3.4%
Economic Activity Index ( GDB-EAI ) For the month of May 2013 General Commentary May 2013 GDB-EAI for the month of May registered a 3.4% year-over-year ( YOY ) reduction May 2013 EAI was 126.7, a 3.4%
Consumer Price Index (Base year 2014) Consumer Price Index
 Consumer Price Index") Consumer Price Index July 207 (Base year 204) Consumer Price Index Release Date: Augest 207 Detailed by: Expenditure groups Household welfare levels Household type Regions Briefing This publication provides
Consumer Price Index July 207 (Base year 204) Consumer Price Index Release Date: Augest 207 Detailed by: Expenditure groups Household welfare levels Household type Regions Briefing This publication provides
Department of Public Welfare (DPW)
") Department of Public Welfare (DPW) Office of Income Maintenance Electronic Benefits Transfer Card Risk Management Report Out-of-State Residency Review FISCAL YEAR 2014-2015 September 2014 (June, July and
Department of Public Welfare (DPW) Office of Income Maintenance Electronic Benefits Transfer Card Risk Management Report Out-of-State Residency Review FISCAL YEAR 2014-2015 September 2014 (June, July and
Mortgage Trends Update
 Mortgage Trends Update UK Finance: Mortgage Trends Update December 218 of first-time reaches 12-year high in 218 Key data highlights: There were 37, new first-time buyer mortgages completed in 218, some
Eagle Tree Condominium Association, Inc. Financial Package May 31, 2018
 Eagle Tree Condominium Association, Inc. Financial Package Assets Total Assets Liabilities Jupiter Eagle Tree Condominium Association BALANCE SHEET Operating Fund Reserve Fund Property Tax Total Cash &
LOUISVILLE GAS AND ELECTRIC COMPANY Gas Rates 2018 Monthly Billing Adjustments
 2018 Monthly Billing Adjustments GAS LINE TRACKER CHARGES GAS LINE TRACKER CHARGES DSM (2) PER MONTH PER METER PER MONTH PER CCF TAX CUTS AND JOBS ACT $ Per CCF Firm Trans. SURCREDIT ($ per ccf) (3) GAS
Asset Manager Performance Comparison
 Cape Peninsula University of Technology Retirement Fund August 2017 DISCLAIMER AND WARNINGS: Towers Watson (Pty) Ltd, a Willis Towers Watson company, is an authorised financial services provider. Although
Fiscal Year 2018 Project 1 Annual Budget
 Fiscal Year 2018 Project 1 Annual Budget Table of Contents Table Page Summary 3 Summary of Costs Table 1 4 Treasury Related Expenses Table 2 5 Summary of Full Time Equivalent Table 3 6 Positions Cost-to-Cash
Asset Manager Performance Comparison
 Cape Peninsula University of Technology Retirement Fund September 2017 DISCLAIMER AND WARNINGS: Towers Watson (Pty) Ltd, a Willis Towers Watson company, is an authorised financial services provider. Although
Fiscal 2014 Q4 Results
 Stephen MacPhail, President & CEO Doug Jamieson, Executive Vice-President & CFO Derek Green, President, CI Investments Steven Donald, President, Assante Wealth Management February 12, 2015 Important Information
Net Quick Assets. Target = $454,424 (5 months operating expenses) 12 Month Average Monthly Operating Expenses = $90,885
 12 Month Average Monthly Operating Expenses = $90,885") $1,200,000 $1,000,000 $800,000 $600,000 $400,000 Net Quick Assets Target = $454,424 (5 months operating expenses) 12 Month Average Monthly Operating Expenses = $90,885 Current Assets Current Liabilities
$1,200,000 $1,000,000 $800,000 $600,000 $400,000 Net Quick Assets Target = $454,424 (5 months operating expenses) 12 Month Average Monthly Operating Expenses = $90,885 Current Assets Current Liabilities
MEDICAID FEDERAL SHARE OF MATCHING FUNDS
 MEDICAID FEDERAL SHARE OF MATCHING FUNDS revised by EDR based on FFIS Estimated for FFY 2019 August 3, 2017 Effective State Budget Year State adopted February 2017 State State FY real Difference in state
FERC EL Settlement Agreement
 FERC EL05-121-009 Settlement Agreement Ray Fernandez Manager, Market Settlements Development Market Settlements Subcommittee June 14, 2018 Settlement Agreement Details Settlement Agreement Details FERC
Financial Statements. Kit Carson County Health Service District. October 2018
 Financial Statements Kit Carson County Health Service District Kit Carson County Health Service District Rooted in excellence. Growing in trust. FINANCIAL STATEMENT SUMMARY Income Statement Summary Kit
Stock Market Briefing: Daily Global Indexes
 Stock Market Briefing: June 3, 18 Dr. Edward Yardeni 16-972-7683 eyardeni@ Joe Abbott 732-497-36 jabbott@ Please visit our sites at blog. thinking outside the box Table Of Contents Table Of Contents 1-2
Ohlone Community College District
 Ohlone Community College District General Obligation Bond Refinancing Overview June 8, 2016 Outstanding General Obligation Bonds Issue Date Issue Amount Description Call Date Maturity Outstanding 6/19/2002
SCHEDULE 10 INDEX FACTOR
 SCHEDULE 10 INDEX FACTOR 1. GENERAL 1.1 Capitalized Terms Capitalized terms used in this Schedule have the definitions as set out in the Agreement to Design, Build, Finance and Maintain Nine New Schools
Using projections to manage your programs
 Using projections to manage your programs To project total provider reimbursements To do what ifs based on caseloads or other metrics To project amounts of admin & support available for spending Based
GPs for COST REIMBURSABLE SUBCONTRACTS
 GPs for COST REIMBURSABLE SUBCONTRACTS The FAR and DEAR clauses listed in this Exhibit, which are located in Chapters 1 and 9 of CFR Title 48 and available at http://www.gpo.gov/fdsys/ are hereby incorporated
ACA Reporting E-File Errors, Penalties & Exchange Notices
 ACA Reporting E-File Errors, Penalties & Exchange Notices Agenda 1). Who is ACA Reporting Service? (quickly) 2). Setting the ACA Reporting Stage 3). The Process Leading up to E-Filing 4). E-Filing through
Cash & Liquidity The chart below highlights CTA s cash position at June 2018 compared to June 2017.
 To: Chicago Transit Authority Board From: Jeremy Fine, Chief Financial Officer Re: Financial Results for June 2018 Date: August 15, 2018 I. Summary CTA s financial results are unfavorable to budget for
PRESS RELEASE. Securities issued by Hungarian residents and breakdown by holding sectors. October 2017
 11 December 2017 PRESS RELEASE Securities issued by Hungarian residents and breakdown by holding sectors October 2017 According to securities statistics, the amount outstanding of equity securities and