Vienna, 22 May Pasquale Tridico University Roma Tre -
|
|
|
- Emerald O’Neal’
- 5 years ago
- Views:
Transcription


1 Vienna, 22 May 2017 Pasquale Tridico University Roma Tre - tridico@uniroma3.it
2 The key arguments in this volume are that income inequality increased since 1980s because a new theoretical paradigm took place where labour and welfare are seen as costs to be compressed rather than as a fundamental part of aggregate demand to be expanded. This period also witnessed the growth of "financial capitalism", characterised by the strong dependency of economies on the financial sector, by the globalisation and intensification of international trade and capital mobility, and by the "flexibilisation" of labour markets which contributed to the reduction of wage shares and therefore to the increase of inequality. However, the welfare state is not a drain on economic performance and competitiveness, or is it a barrier to economic efficiency
3 1970s: Ideological switch, political change and technical progress 1980s: capital expansion globalisation and financialisation change in capital-labour relations 1990s and 2000s: labour flexibility, weakening of labour market institutions and adverse social policies recovery of profits and soar of financial rents and compensations wage share reduction INEQUALITY moderation of aggregate demand scarce GDP dynamics secular stagnation

4 In OECD: the richest 10% OWNS 10X INCOME 10% POOR On the world the top 1% own 48% of global wealth (about US$120 trillion). The richest 85 people in the world the likes of Bill Gates, Warren Buffett, and Carlos Slim own about US$70 trillion, more wealth than the roughly 3.5 billion people who make up the poorest half of the world s population. In the United States, the top 10 % (1%) own about 70% (38%) of wealth in the economy. Income (rather than wealth) follows the same trend in proportion: the top 10% (1%) own about 47% (20%) of income in the economy (Source: OECD, OXFAM, Forbes, WB, WID..)
5 Average Gini coefficient - OECD countries Wage share (adjusted) in G7 economies, from the end 1970s to 2016 (last 2 years projections) %
6 Adjusted labour income share (%) Wage share (adjusted) in rich OECD countries Germany France Italy United Kingdom United States Japan Canada Australia 65 Wage share (Adjusted) in selected OECD countries Greece Spain Portugal Ireland 45
7 Australia Austria Canada Czech Republic Denmark Finland France Germany Hungary Ireland Israel Italy Japan Netherlands New Zealand Norway Sweden United Kingdom United States OECD average
8 ineq wage_share_adj
9
10 Compensation financial sector and other sectors (USA) Avg compensation financial sector Avg Compensation other sectors Source: Financial Crisis Inquiry Commission (2011)
11 1. It favours the aggressive implementation of the principle downsize and distribute so that corporations managers have as the only objective to maximize and distribute dividends for the shareholders at the cost of squeezing production, cutting wages and downsizing. Moreover, assets are wasted in speculation strategies rather than in productive investments. 2. It favours an aggressive short-term strategy of corporations managers interested mainly to sell products and to the maximization of bonus and profits in the short terms at the expenses of the wage bill. 3. Labour market institutions and in particular labour flexibility are functional to these strategies.
 increases income vulnerability and further financial development credit consumption and the financialisation of the economy which allow for an expansion of the private")
12 1. Finance (financialisation) and Inequality Inequality generated by FC (through labour flexibility and welfare cuts the compression of the wage share the downsizing of workforce and distributing of profits among shareholders) increases income vulnerability and further financial development credit consumption and the financialisation of the economy which allow for an expansion of the private debt and further inequality [Stockhammer (2013); Galbraith, (2012); Stiglitz, (2012); Hein 2012 & 2015 ] 2. Inequality (credit availability) and Financial crisis Inequality may weaken aggregate demand and drag on the economy since higher income groups spend a smaller share of the income; moreover, income inequality boosts financial instability because it increases demand for credit and this may destabilize the aggregate demand, in particular during credit rationing time [Rajan, 2010; Cynamon and Fazzari (2013); Palley, 2012]
13 Wage compensation, which is shrinking, affects the labour capacity whose value is generally less than the value of the output produced. The excess of supply (which is also the surface of worker s exploitation) is compensated by creditconsumption. Workers suffer twice from these crises (being exploited and paid less, and being encouraged to increase credit consumption) Capitalists gain twice (because they gain from the exploitation which however produces excess of supply, and obtain returns from financial products). Goda and Lysandrou (2014); In this way the crisis is endemic to capitalism and to inequality
14 FINANCIAL-LED MODEL (institutional change: financial deregulation, labour market flexibility, welfare retrenchement, capital mobility, trade union weakening) Decline of productive investeements and increase of financial speculation increase of Financial compensation Indebteness Inequality Weakening and instability of aggregate demand Boom & Burst and financial instability GDP stagnation
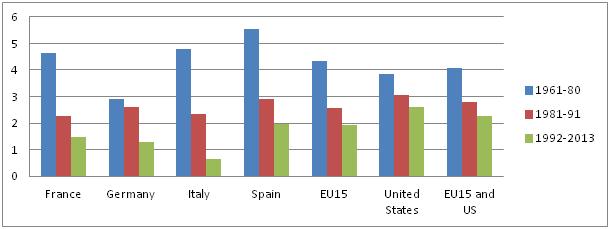
15 6 GDP growth per capita OECD countries, Source: OECD
16 The secular stagnation is intimately related to policies and features that shaped the financial-led model. Excess of S is a consequence of an excess of income going to the wealthiest part of the society, which has a lower propensity to consume (Kaldor, 1956, 1961). Second, the imbalance is a consequence of lower wages for workers and in turn of lower consumption and demand by them. Third, it is a consequence of a retrenchment tendency of public expenditure and welfare expenditure occurring among advanced economies in the last two decades and intensifying in the last years after the crisis, known as fiscal adjustments and austerity program (see Hein 2015). Hence, the solution to the secular stagnation can be found from one side in the fiscal policy and government deficit rather than in monetary policy and quantitative easing, which would absorb the excess of S. From another side, income distribution policies and wage increases would compensate the negative drag on the aggregate demand operated by excess of S. Finally, a program of public investment would increase the stock value of I.
17 Capital mobility Financial deregulation No growth + income inequality Structural adjustement
18


19
20 Source: Michael Roberts, 2015
21 7.0 Net dividends (% of GDP), USA Source: FREED database.
22 OECD-Total G7 6 5 Labour Productivity growth per hours (Y/Lh) OECD
23 Index (base year =1999) Labour productivity index Real wage index Source: ILO 2015, online database.
24 Reaction: shift in the political economy paradigm ideological change Tatcher and Reagan administrations 1970s-1980s Financialisation: finance, credit consumption, speculation and indebteness Decline of labour productivity in industrial and manufacturing sector (advanced economies) and profit fall Globalisation: Multinatonal companies, outsourcing, Capital mobility Policies, competiveness strategies, neoliberal discourses, institutional changes : 1990s-2000s Dividents and shareholder objectives "downsize and distribute" "corporate downsize" Compression of labour cost competitoveness strategies, international tax competition, export led strategies decline of trade union power Labour flexibility, wage stagnation and Wage share decline, Retrenchment of the role of the State in the Economy, Austerity programs
25 The globalisation of the economy increased the power of capital in relation to labour, and trade unions lost power, contributing to the deterioration of labour market institutions. During the process of financialisation and globalisation of economies, which identifies the shift towards what I called financial capitalism, labour markets were affected by radical changes too, involving above all an increase in labour flexibility.
26 Since 1980, and in particular since the Thatcher and Reagan administrations in the UK and the US, financial capitalism was shaped a set of neoliberal policies boosting financialisation and globalisation were implemented, such as deregulation of the financial sector, liberalization of trade, capital mobility, wage flexibility, privatization, structural adjustments, retrenchment of welfare states, the creation of a second pillar in the pension system i.e. the pension funds with the clear aim to collect easy savings.

27 CEO salaries, in financial capitalism, depend on the increase of value shares, and on the short-term results performance in the stock exchange. In 1950, the average American chief executive was paid about 20x as much as the typical employee of his firm. Today, ratio is +500 to 1. In 2011, Apple s Tim Cook received $378 million (6,258X the wage of an average Apple employee ($60,000). A typical worker at Walmart earns less than $25,000 a year; Michael Duke, the retailer s former chief executive, was paid more than $23 million in This represents the return of a patrimonial society as Piketty (2014) stated: the patrimonial society today is the financial class.
28 Before 2007 generous monetary policies. This increased opportunity in the financial sector, speculation, value shares, asset prices, dividends financial bubble; boom in the housing sector and the emerging of the huge insurance business. After 2007 even more QE by the Fed, BoE, BoJ, and..ecb QE favoured speculations more than real investments and did not allow, for the Keynes effect financial and labour compensation gap increased even more, and income inequality worsened also after the crisis. in CF, investment behaviour is not driven by macroeconomic policies (such as the Keynes effect) but by discourses and stories able to convince speculators, hedge funds owner and managers, feeling and perverse animal spirits (Erturk et al., 2008).
29 Financialisation during neoliberalism 350 Market capitalization, OECD countries, % of GDP,
30 Average Trade Union density (unionization rate) OECD countries 15
31
32 Average level of EPL OECD countries
33 A flexible labour market with compressed and low wages needs to be supplemented by credit consumption and developed financial tools to sustain consumption. Hence, a strong correlation between financialisation and labour flexibility was identified in our empirical analysis, suggesting complementarities between these two phenomena.
34 EPL Figure - Correlation scatter between financialisation and labour flexibility (EPL) in Portugal Czech Republic Germany Netherlands Slovenia Sweden Italy Austria Norway Korea France Poland Denmark Greece Finland SpainIsrael Belgium Australia Ireland Japan United King Canada United States Financialisation
35 Gini Figure - Correlation scatter between inequality and EPL in 2013 United States United Kingdom Japan Ireland Australia Spain Greece Canada New Zealand Estonia Italy Korea Poland France Netherlands Germany Hungary Austria Sweden Slovak Belgium Republic Finland Czech Repub Denmark Norway Slovenia EPL
36 United States.35.4 Japan United Kingdom Australia Portugal Ireland Canada New Zealand Estonia Italy.3 France Germany Netherlands.25 Norway Austria Sweden Finland Belgium Denmark Scores for the principal component of labour market institutions
37 Gini Figure - Correlation scatter between financialisation and inequality in 2013 Israel United States Portugal Italy Greece Ireland Spain Japan United Kin Australia Estonia New Zealand Poland Korea France Canada Germany Netherlands Hungary Austria Slovak Republic Czech Republic Slovenia Sweden Belgium Finland Norway Denmark Financialisation
38 Financialization + labour flexibility Neoliberalism => Inequality
39 Profit soar (rents and financial compensation) Wages stagnated Inequality increased Consumption kept up thanks to financialization private debt (financial innovation) public debt (bonds China-US) Stiglitz (2010); Brancaccio and Fontana (2011); Fitoussi and Saraceno (2010); Barba and Pivetti (2009); Tridico (2012)
40 Interactions and bubbles within the Finance-led Growth Model LABOR w/p Instable wages Precarious job FINANCE Financialization Demand for finance Price shares (financial) BUBBLE Finance for consumption Credits, loans, mortgages (credit) BUBBLE (Prices in the commodity market increase too) CONSUMPTION Movement of Portfolio Financial investments (speculative) BUBBLE Productive investments INVESTMENTS
41 Finally, income distribution was worsened by the retrenchment of the welfare state : with the justification that firms would be more competitive, and economies could attract more capitals as the so-called efficiency thesis would suggest.
42 Figure 16 The Welfare States since 1960 (Public Social Expenditure, % of GDP) Expansion and retrenchment of Welfare State Source: own elaboration on OECD data
43 Gini 2013 Figure Inequality (Gini) and Public Social Expenditure (% GDP) Chile Mexico Turkey Israel United States Japan United Kingdom Portugal Australia GreeceSpain Italy Ireland Estonia Canada New Zealand Poland France Netherlands Germany LuxembourgAustriaSweden Finland Belgium Norway Denmark Public social spending 2013
44 The model: Dep.var. is: inequality (Ineq) Indep. Var. are: financialisation (F), labour flexibility (EPL Employment Protection Legislation), trade union density (TU) public social spending (S). I use panel data for 34 OECD countries from 1990 to 2013, for a total of 816 observations.
45 Random-effects GLS regression Fixed-effect Regression Number of obs = 816; Number of groups = 34; anel = Model I Model II (with Model III control var) Var Coeff (St. er. in Coeff (St. er. in brackets) brackets) Financialisation (F) ** ( ) ** ( ) ** ( ) EPL (LF) ** ( ) ** ( ) ** ( ) TU density (TU) * ( ) * ( ) *** ( ) Social Spending (S) * ( ) * ( ) ** ( ) Unemployment ( ) ( ) FDI in ( ) ( ) Import ( ) 2.92e-06 ( ) Econ. Growth ( ) ( ) Tertiary Education lev ( ) ( ) Time dummies (years YES YES YES ) Constant ( ) ( ) ( ) R-sq = R-sq = R-sq =
46 .3 Liberal1990 Liberal2010 Mediterranean GINI Mediterranean1990 Continental1990 Continental Scandinavian2010 Scandinavian SOCIAL_SPENDING
47 40 Financial Capitalism United States 35 Gini 2012 Australia Portugal United Kingdom Greece Spain Ireland Italy Canada New Zealand Welfare Capitalism 30 France Netherlands Germany 25 Luxembourg Norway Austria Sweden Finland Belgium Denmark Public Social Spending 2012
48 Welfare Capitalism and Financial Capitalism
49 the increase in inequality, which has been very marked over the last two decades, is due to a radical change to the main features of the socioeconomic model of advanced economies. This change involves a shift towards financialisation, a pressure on labour through increased labour flexibility, the decline of trade unions power and the retrenchment of public social spending. Our sample was composed of data for 34 OECD countries during the period between 1990 and The econometric analysis produced very interesting results and the regression confirmed our hypothesis
Rome, 13 April Pasquale Tridico University Roma Tre -
 Rome, 13 April 2017 Pasquale Tridico University Roma Tre - tridico@uniroma3.it The key arguments in this volume are that income inequality increased during this period because labour and welfare became
SKEMA BUSINESS SCHOOL Global risk and the mounting wealth gap Michel Henry Bouchet
 SKEMA BUSINESS SCHOOL Global risk and the mounting wealth gap Michel Henry Bouchet MYTH = GLOBALIZATION GENERATES GROWING ECONOMIC WEALTH AND WELL-BEING FOR ALL Fact: Economic growth boils down to rising
Corrigendum. OECD Pensions Outlook 2012 DOI: ISBN (print) ISBN (PDF) OECD 2012
 ISBN (PDF) OECD 2012") OECD Pensions Outlook 2012 DOI: http://dx.doi.org/9789264169401-en ISBN 978-92-64-16939-5 (print) ISBN 978-92-64-16940-1 (PDF) OECD 2012 Corrigendum Page 21: Figure 1.1. Average annual real net investment
OECD Pensions Outlook 2012 DOI: http://dx.doi.org/9789264169401-en ISBN 978-92-64-16939-5 (print) ISBN 978-92-64-16940-1 (PDF) OECD 2012 Corrigendum Page 21: Figure 1.1. Average annual real net investment
Sources of Government Revenue in the OECD, 2016
 FISCAL FACT No. 517 July, 2016 Sources of Government Revenue in the OECD, 2016 By Kyle Pomerleau Director of Federal Projects Kevin Adams Research Assistant Key Findings OECD countries rely heavily on
Trade and Development Board Sixty-first session. Geneva, September 2014
 UNITED NATIONS CONFERENCE ON TRADE AND DEVELOPMENT Trade and Development Board Sixty-first session Geneva, 15 26 September 2014 Item 3: High-level segment Tackling inequality through trade and development:
Switzerland and Germany top the PwC Young Workers Index in developing younger people
 Press release Date 9 November 2015 Contact Mihnea Anastasiu Pages 5 Media Relations Manager Tel: +40 21 225 3546 Email: mihnea.anastasiu@ro.pwc.com Switzerland and Germany top the PwC Young Workers Index
HEALTH LABOUR MARKET TRENDS IN OECD COUNTRIES
 HEALTH LABOUR MARKET TRENDS IN OECD COUNTRIES Michael Schoenstein, OECD Health Division 3 rd Global Health Workforce Alliance Forum Recife, 11 November 2013 Main health labour market issues in OECD countries
Approach to Employment Injury (EI) compensation benefits in the EU and OECD
 compensation benefits in the EU and OECD") Approach to (EI) compensation benefits in the EU and OECD The benefits of protection can be divided in three main groups. The cash benefits include disability pensions, survivor's pensions and other short-
Approach to (EI) compensation benefits in the EU and OECD The benefits of protection can be divided in three main groups. The cash benefits include disability pensions, survivor's pensions and other short-
Investing for our Future Welfare. Peter Whiteford, ANU
 Investing for our Future Welfare Peter Whiteford, ANU Investing for our future welfare Presentation to Jobs Australia National Conference, Canberra, 20 October 2016 Peter Whiteford, Crawford School of
ITALY: FROM ECONOMIC DECLINE
 ITALY: FROM ECONOMIC DECLINE TO THE CURRENT CRISIS. A COMPARISON WITH FRANCE AND GERMANY Pasquale Tridico University Roma Tre tridico@uniroma3.it OBJECTIVE AND MOTIVATION OF THE PAPER: THE ITALIAN DECLINE
Introduction to Public Finance
 Introduction to Public Finance Lecture 2: Functions and size of the welfare state. Retirement, unemployment protection, health care, etc. Welfare expenditures, aging problem. 1 Outline of the lecture Basic
Trust and Fertility Dynamics. Arnstein Aassve, Università Bocconi Francesco C. Billari, University of Oxford Léa Pessin, Universitat Pompeu Fabra
 Trust and Fertility Dynamics Arnstein Aassve, Università Bocconi Francesco C. Billari, University of Oxford Léa Pessin, Universitat Pompeu Fabra 1 Background Fertility rates across OECD countries differ
The Outlook for the U.S. Economy and the Policies of the New President
 The Outlook for the U.S. Economy and the Policies of the New President Jason Furman Senior Fellow, PIIE SNS/SHOF Finance Panel Stockholm June 12, 2017 Peterson Institute for International Economics 1750
Declaration on Environmental Policy
 Declaration on Environmental Policy OECD Legal Instruments This document is published under the responsibility of the Secretary-General of the OECD. It reproduces an OECD Legal Instrument and may contain
GREEK ECONOMIC OUTLOOK
 CENTRE OF PLANNING AND ECONOMIC RESEARCH Issue 29, February 2016 GREEK ECONOMIC OUTLOOK Macroeconomic analysis and projections Public finance Human resources and social policies Development policies and
Sources of Government Revenue in the OECD, 2018
 FISCAL FACT No. 581 Mar. 2018 Sources of Government Revenue in the OECD, 2018 Amir El-Sibaie Analyst Key Findings In 2015, OECD countries relied heavily on consumption taxes, such as the value-added tax,
Sources of Government Revenue in the OECD, 2017
 FISCAL FACT No. 558 Aug. 2017 Sources of Government Revenue in the OECD, 2017 Amir El-Sibaie Analyst Key Findings: OECD countries rely heavily on consumption taxes, such as the value-added tax, and social
Economic Performance. Lessons from the past and a guide for the future Björn Rúnar Guðmundson, Director
 Economic Performance Lessons from the past and a guide for the future Björn Rúnar Guðmundson, Director Analysis of economic performance Capital and labour: The raw ingredients in economic development However,
Financial wealth of private households worldwide
 Economic Research Financial wealth of private households worldwide Munich, October 217 Recovery in turbulent times Assets and liabilities of private households worldwide in EUR trillion and annualrate
Recommendation of the Council on the Implementation of the Polluter-Pays Principle
 Recommendation of the Council on the Implementation of the Polluter-Pays Principle OECD Legal Instruments This document is published under the responsibility of the Secretary-General of the OECD. It reproduces
Empirical appendix of Public Expenditure Distribution, Voting, and Growth
 Empirical appendix of Public Expenditure Distribution, Voting, and Growth Lorenzo Burlon August 11, 2014 In this note we report the empirical exercises we conducted to motivate the theoretical insights
Sources of Government Revenue in the OECD, 2014
 FISCAL FACT Nov. 2014 No. 443 Sources of Government Revenue in the OECD, 2014 By Kyle Pomerleau Economist Key Findings OECD countries rely heavily on consumption taxes, such as the value added tax, and
PENSIONS IN OECD COUNTRIES: INDICATORS AND DEVELOPMENTS
 PENSIONS IN OECD COUNTRIES: INDICATORS AND DEVELOPMENTS Marius Lüske Directorate for Employment, Labour and Social Affairs, OECD Lisbon, 28.09.2018 Marius.LUSKE@oecd.org www.oecd.org/els OUTLINE Talk based
Statistical annex. Sources and definitions
 Statistical annex Sources and definitions Most of the statistics shown in these tables can be found as well in several other (paper or electronic) publications or references, as follows: the annual edition
WHAT WOULD THE NEIGHBOURS SAY?
 WHAT WOULD THE NEIGHBOURS SAY? HOW INEQUALITY MEANS THE UK IS POORER THAN WE THINK High Pay Centre About the High Pay Centre The High Pay Centre is an independent non-party think tank established to monitor
The OECD s Society at a Glance Simon Chapple OECD ELS/SPD Villa Vigoni, Italy, 9-11 th March 2011
 The OECD s Society at a Glance 2 Simon Chapple OECD ELS/SPD Villa Vigoni, Italy, 9- th March 2 Reconceptualisation for 2: Internal reasons OECD growth from 3 to 34 countries Other major economies (e.g.
Recommendation of the Council on Tax Avoidance and Evasion
 Recommendation of the Council on Tax Avoidance and Evasion OECD Legal Instruments This document is published under the responsibility of the Secretary-General of the OECD. It reproduces an OECD Legal Instrument
The intergenerational divide in Europe. Guntram Wolff
 The intergenerational divide in Europe Guntram Wolff Outline An overview of key inequality developments The key drivers of intergenerational inequality Macroeconomic policy Orientation and composition
Growth in OECD Unit Labour Costs slows to 0.4% in the third quarter of 2016
 Growth in OECD Unit Labour Costs slows to.4% in the third quarter of 26 Growth in unit labour costs (ULCs) in the OECD area slowed to.4% in the third quarter of 26 (compared with.6% in the previous quarter)
DANMARKS NATIONALBANK
 DANMARKS NATIONALBANK WEALTH, DEBT AND MACROECONOMIC STABILITY Niels Lynggård Hansen, Head of Economics and Monetary Policy. IARIW, Copenhagen, 21 August 2018 Agenda Descriptive evidence on household debt
Irish Economy and Growth Legal Framework for Growth and Jobs High Level Workshop, Sofia
 Irish Economy and Growth Legal Framework for Growth and Jobs High Level Workshop, Sofia Diarmaid Smyth, Central Bank of Ireland 18 June 2015 Agenda 1 Background to Irish economic performance 2 Economic
IMPLICATIONS OF LOW PRODUCTIVITY GROWTH FOR DEBT SUSTAINABILITY
 IMPLICATIONS OF LOW PRODUCTIVITY GROWTH FOR DEBT SUSTAINABILITY Neil R. Mehrotra Brown University Peterson Institute for International Economics November 9th, 2017 1 / 13 PUBLIC DEBT AND PRODUCTIVITY GROWTH
Budget repair and the size of Australia s government. Melbourne Economic Forum John Daley, Grattan Institute December 2015
 Budget repair and the size of Australia s government Melbourne Economic Forum John Daley, Grattan Institute December 2015 Budget repair and the size of Australia s government Attitudes to the best approach
C W S S u m m i t. Dambisa Moyo 16 May 2012 London
 2 0 1 2 C W S S u m m i t Dambisa Moyo 16 May 2012 London Table of Contents I Global Labour Market Picture II Six Labour Market Drivers III The Challenges Ahead 2 Global unemployment (millions) Unemployment
Ways to increase employment
 Ways to increase employment Iceland Luxembourg Spain Canada Italy Norway Denmark Germany Portugal Ireland Japan Belgium Switzerland Austria Slovenia United States New Zealand Finland France Netherlands
Sources of Government Revenue across the OECD, 2015
 FISCAL FACT Apr. 2015 No. 465 Sources of Government Revenue across the OECD, 2015 By Kyle Pomerleau Economist Key Findings OECD countries rely heavily on consumption taxes, such as the value added tax,
Statistical Annex. Sources and definitions
 Statistical Annex Sources and definitions Most of the statistics shown in these tables can also be found in two other (paper or electronic) publication and data repository, as follows: The annual edition
Stronger growth, but risks loom large
 OECD ECONOMIC OUTLOOK Stronger growth, but risks loom large Ángel Gurría OECD Secretary-General Álvaro S. Pereira OECD Chief Economist ad interim Paris, 3 May Global growth will be around 4% Investment
OECD HEALTH SYSTEM CHARACTERISTICS SURVEY 2012
 OECD HEALTH SYSTEM CHARACTERISTICS SURVEY 2012 Emily Hewlett OECD Health Data National Correspondents and Health Accounts Experts Meeting, 17 th October 2013 Health System Characteristics Survey 2012 HSC
BETTER POLICIES FOR A SUCCESSFUL TRANSITION TO A LOW-CARBON ECONOMY
 BETTER POLICIES FOR A SUCCESSFUL TRANSITION TO A LOW-CARBON ECONOMY Rintaro Tamaki Deputy Secretary-General, OECD International Forum for Sustainable Asia and the Pacific (ISAP)1 Yokohama, July 1 Four
8-Jun-06 Personal Income Top Marginal Tax Rate,
 8-Jun-06 Personal Income Top Marginal Tax Rate, 1975-2005 2005 2000 1999 1998 1997 1996 1995 1994 1993 1992 1991 1990 1989 1988 Australia 47% 47% 47% 47% 47% 47% 47% 47% 47% 47% 47% 48% 49% 49% Austria
The macroeconomic effects of a carbon tax in the Netherlands Íde Kearney, 13 th September 2018.
 The macroeconomic effects of a carbon tax in the Netherlands Íde Kearney, th September 08. This note reports estimates of the economic impact of introducing a carbon tax of 50 per ton of CO in the Netherlands.
Fiscal Policy in Japan
 Fiscal Policy in Japan - Issues and Future Directions- June 10th, 2015 Ministry of Finance General Government Gross Debt and Financial Balances (International Comparison) (%) 240 210 General Government
From a divided to a sharing economy
 The Equality Trust From a divided to a sharing economy Stewart Lansley Where do I park! UK Plc: The falling wage share share of wages in GDP, 1955-2014 Source: ONS National accounts UK Plc: Too Big to
EMPLOYMENT RATE IN EU-COUNTRIES 2000 Employed/Working age population (15-64 years)
") EMPLOYMENT RATE IN EU-COUNTRIES 2 Employed/Working age population (15-64 years EU-15 Denmark Netherlands Great Britain Sweden Portugal Finland Austria Germany Ireland Luxembourg France Belgium Greece Spain
EMPLOYMENT RATE IN EU-COUNTRIES 2 Employed/Working age population (15-64 years EU-15 Denmark Netherlands Great Britain Sweden Portugal Finland Austria Germany Ireland Luxembourg France Belgium Greece Spain
Income and Wealth Inequality in OECD Countries
 DOI: 1.17/s1273-16-1946-8 Verteilung -Vergleich Horacio Levy and Inequality in Countries The has longstanding experience in research on income inequality, with studies dating back to the 197s. Since 8
The Global Financial Crisis and the Return of the Nordic Model?
 The Global Financial Crisis and the Return of the Nordic Model? Lars Calmfors Embassy of Denmark and the Swedish Institute of International Affairs 18 November Topics 1. The global economic crisis 2. Globalisation
Slovak Competitiveness: Fundamentals, Indicators and Challenges
 Copyright rests with the author Slovak Competitiveness: Fundamentals, Indicators and Challenges Presentation by Mark De Broeck European Department, IMF Seminar Organized by the European Commission November
How Tax Reform Can Address America s Diminishing Investment and Economic Growth
 September 23, 2013 No. 395 Fiscal Fact How Tax Reform Can Address America s Diminishing Investment and Economic Growth By William McBride, PhD Introduction America s economic problems are often attributed
Tax Burden, Tax Mix and Economic Growth in OECD Countries
 Tax Burden, Tax Mix and Economic Growth in OECD Countries PAOLA PROFETA RICCARDO PUGLISI SIMONA SCABROSETTI June 30, 2015 FIRST DRAFT, PLEASE DO NOT QUOTE WITHOUT THE AUTHORS PERMISSION Abstract Focusing
TAX POLICY CENTER BRIEFING BOOK. Background. Q. What are the sources of revenue for the federal government?
 What are the sources of revenue for the federal government? FEDERAL BUDGET 1/4 Q. What are the sources of revenue for the federal government? A. About 48 percent of federal revenue comes from individual
10% 10% 15% 15% Caseload: WE. 15% Caseload: SS 10% 10% 15%
 Percentchangeincaseload 15% 10% 5% 0% 5% 10% 15% Caseload: AO 0 1 2 3 4 5 Percentchangein caseload 15% 10% 5% 0% 5% 10% 15% Caseload: NC 0 1 2 3 4 5 Years Years Percentchangein caseload 15% 10% 5% 0% 5%
Guidance on Transfer Pricing Documentation and Country-by-Country Reporting
 OECD/G20 Base Erosion and Profit Shifting Project Guidance on Transfer Pricing Documentation and Country-by-Country Reporting ACTION 13: 2014 Deliverable ANNEX II TO CHAPTER V. TRANSFER PRICING DOCUMENTATION
Pension Fund Investment and Regulation - An International Perspective and Implications for China s Pension System
 Pension Fund Investment and Regulation - An International Perspective and Implications for China s Pension System Yu-Wei Hu, Fiona Stewart and Juan Yermo Financial Affairs Division OECD, Paris OECD/IOPS
Turkey s Saving Deficit Issue From an Institutional Perspective
 Turkey s Saving Deficit Issue From an Institutional Perspective Engin KURUN, Ph.D CEO, Ziraat Asset Management Oct. 25th, 2011 - Istanbul 1 PRESENTATION Household and Institutional Savings Institutional
Low employment among the 50+ population in Hungary
 Low employment among the + population in Hungary The role of incentives, health and cognitive capacities Janos Divenyi (Central European University) and Gabor Kezdi (Central European University and IE-CRSHAS)
Economic state of the union, EuroMemo Engelbert Stockhammer Kingston University
 Economic state of the union, EuroMemo 2013 Engelbert Stockhammer Kingston University structure Economic developments Background: export-led growth and debt-led growth Growth, trade imbalances, ages and
Can employment be increased only at the cost of more inequality?
 Can employment be increased only at the cost of more inequality? Engines for More and Better Jobs in Europe ZEW Conference, Mannheim April 2013 Torben M Andersen Aarhus University Policy questions How
Social Expenditure in Japan: Trends and Backgrounds
 Social Expenditure in Japan: Trends and Backgrounds Junko Takezawa The 9th Social Experts Meeting the Center Mark Hotel in Seoul (28 29 October 2014) Presentation Outline 1. Trends in Social Expenditure
Assessing Developments and Prospects in the Australian Welfare State
 Assessing Developments and Prospects in the Australian Welfare State Presentation to OECD,16 November, 2016 Peter Whiteford, Crawford School of Public Policy https://socialpolicy.crawford.anu.edu.au/ peter.whiteford@anu.edu.au
The Case for Fundamental Tax Reform: Overview of the Current Tax System
 The Case for Fundamental Tax Reform: Overview of the Current Tax System Sources of Federal Receipts Projected for 2016 Excise Taxes 2.9% Estate & Gift Taxes 0.6% Corporate Income Taxes 9.8% Other Taxes
Macroeconomic Theory and Policy
 ECO 209Y Macroeconomic Theory and Policy Lecture 3: Aggregate Expenditure and Equilibrium Income Gustavo Indart Slide 1 Assumptions We will assume that: There is no depreciation There are no indirect taxes
A Retrospective on the Tax Law of 2017 and Prospective on the Next Tax Laws Note some estimates represent work in progress that is subject to revision
 A Retrospective on the Tax Law of 2017 and Prospective on the Next Tax Laws Note some estimates represent work in progress that is subject to revision Jason Furman Harvard Kennedy School M-RCBG Business
EMPLOYMENT RATE Employed/Working age population (15 64 years)
") EMPLOYMENT RATE 198 26 Employed/Working age population (15 64 years 8 % Finland 75 EU 15 EU 25 7 65 6 55 5 8 82 84 86 88 9 92 94 96 98 2 4** 6** 14.4.25/SAK /TL Source: European Commission 1 UNEMPLOYMENT
EMPLOYMENT RATE 198 26 Employed/Working age population (15 64 years 8 % Finland 75 EU 15 EU 25 7 65 6 55 5 8 82 84 86 88 9 92 94 96 98 2 4** 6** 14.4.25/SAK /TL Source: European Commission 1 UNEMPLOYMENT
Budget repair and the changing size of Australia s government. Crawford Australian Leadership Forum John Daley, Grattan Institute June 2016
 Budget repair and the changing size of Australia s government Crawford Australian Leadership Forum John Daley, Grattan Institute June 2016 Commonwealth expenditure is high relative to history; revenue
Appendix. December 2011 Ministry of Finance
 Appendix December 2011 Ministry of Finance International Comparison of General Government Gross Debt According to the projection by OECD, Japan s general government gross debt to GDP ratio is more than
Demographics and Secular Stagnation Hypothesis in Europe
 Demographics and Secular Stagnation Hypothesis in Europe Carlo Favero (Bocconi University, IGIER) Vincenzo Galasso (Bocconi University, IGIER, CEPR & CESIfo) Growth in Europe?, Marseille, September 2015
Hamid Rashid, Ph.D. Chief Global Economic Monitoring Unit Development Policy Analysis Division UNDESA, New York
 Hamid Rashid, Ph.D. Chief Global Economic Monitoring Unit Development Policy Analysis Division UNDESA, New York 1 Global macroeconomic trends Major headwinds Risks and uncertainties Policy questions and
Indicator B3 How much public and private investment in education is there?
 Education at a Glance 2014 OECD indicators 2014 Education at a Glance 2014: OECD Indicators For more information on Education at a Glance 2014 and to access the full set of Indicators, visit www.oecd.org/edu/eag.htm.
1 People in Paid Work
 1 People in Paid Work Indicator 1.1a Indicator 1.1b Indicator 1.2a Indicator 1.2b Indicator 1.3 Indicator 1.4 Indicator 1.5a Indicator 1.5b Indicator 1.6 Employment and Unemployment Trends (Republic of
Reporting practices for domestic and total debt securities
 Last updated: 27 November 2017 Reporting practices for domestic and total debt securities While the BIS debt securities statistics are in principle harmonised with the recommendations in the Handbook on
Health Care in Crisis
 Health Care in Crisis The Economic Imperative for Health Care Reform James Kvaal and Ben Furnas February 19, 2009 1 Center for American Progress Health Care in Crisis U.S. spends twice as much per capita
CANADA S LABOUR MARKET PRE- AND POST-CRISIS
 CANADA S LABOUR MARKET PRE- AND POST-CRISIS WILLIAM ROBSON PRESIDENT AND CEO, C.D. HOWE INSTITUTE PRESENTATION TO THE NERO MEETING AT THE OECD 20 JUNE 2011 CANADA S LABOUR MARKET HIGHLIGHTS Decent Top-Level
Macroeconomic scenarios for skill demand and supply projections, including dealing with the recession
 Alphametrics (AM) Alphametrics Ltd Macroeconomic scenarios for skill demand and supply projections, including dealing with the recession Paper presented at Skillsnet technical workshop on: Forecasting
LONG-TERM PROJECTIONS OF PUBLIC PENSION EXPENDITURE
 7. FINANCES OF RETIREMENT-INCOME SYSTEMS LONG-TERM PROJECTIONS OF PUBLIC PENSION EXPENDITURE Key results Public spending on pensions has been on the rise in most OECD countries for the past decades, as
The end of the welfare state: The view of the economist
 The end of the welfare state: The view of the economist Professor Nikos Maniadakis Associate Dean, National School of Public Health, GR End of welfare state: fact, illusion or desire? Prof. Nikos Maniadakis
WHAT ARE THE FINANCIAL INCENTIVES TO INVEST IN EDUCATION?
 INDICATOR WHAT ARE THE FINANCIAL INCENTIVES TO INVEST IN EDUCATION? Not only does education pay off for individuals ly, but the public sector also from having a large proportion of tertiary-educated individuals
Is the Western Welfare State Still Sustainable?
 Is the Western Welfare State Still Sustainable? James Heckman University of Chicago and University College Dublin ILO Institute March 23, 2007 1 / 36 Half a century ago, the free-market economist Friedrich
Statistical Annex ANNEX
 ISBN 92-64-02384-4 OECD Employment Outlook Boosting Jobs and Incomes OECD 2006 ANNEX Statistical Annex Sources and definitions Most of the statistics shown in these tables can be found as well in three
education (captured by the school leaving age), household income (measured on a ten-point
, household income (measured on a ten-point") A Web-Appendix A.1 Information on data sources Individual level responses on benefit morale, tax morale, age, sex, marital status, children, education (captured by the school leaving age), household income
A Web-Appendix A.1 Information on data sources Individual level responses on benefit morale, tax morale, age, sex, marital status, children, education (captured by the school leaving age), household income
Households capital available for renovation
 Households capital available for Methodical note Copenhagen Economics, 22 February 207 The task at hand has been twofold: firstly, we were to calculate an estimate of households average capital available
The Chilean Pension System: Favorable Results in International Comparison
 ISSN 0717-1528 The an Pension System: Favorable Results in International Comparison The pension system has been questioned Recently, the an pension system has shown an increasing dissatisfaction level,
OECD Report Shows Tax Burdens Falling in Many OECD Countries
 OECD Centres Germany Berlin (49-30) 288 8353 Japan Tokyo (81-3) 5532-0021 Mexico Mexico (52-55) 5281 3810 United States Washington (1-202) 785 6323 AUSTRALIA AUSTRIA BELGIUM CANADA CZECH REPUBLIC DENMARK
Nuts & Bolts of Corporate Tax Reform
 Nuts & Bolts of Corporate Tax Reform July 19, 2013 Presentation for the Alliance for a Just Society Steve Wamhoff, Citizens for Tax Justice The Work of Citizens for Tax Justice (CTJ) on Federal Tax Policy
INCOME INEQUALITY AND ECONOMIC GROWTH Eva Kotlánová 1.
 INCOME INEQUALITY AND ECONOMIC GROWTH Eva Kotlánová 1 1 Silesian University, School of Business Administration, Univerzitninam. 1934/3,73340 Karvina, Czech Republic Email:kotlanova@opf.slu.cz Abstract
Updates and revisions of national SUTs for the November 2013 release of the WIOD
 Updates and revisions of national SUTs for the November 2013 release of the WIOD Edited by Marcel Timmer (University of Groningen) With contributions from: Abdul A. Erumban, Reitze Gouma and Gaaitzen J.
Restoring Public Finances: Fiscal and Institutional Reform Strategies
 Restoring Public Finances: Fiscal and Institutional Reform Strategies Ronnie Downes Deputy Head Budgeting & Public Expenditures Rio de Janeiro 19-20 October 2015 Studies by OECD Senior Budget Officials
Political Developments & The 2017 Tax Cut and Jobs Act
 Political Developments & The 2017 Tax Cut and Jobs Act Moderator Elizabeth Creager, AT&T Assistant Vice President for Tax Panelists Rohit Kumar, PwC Principal & Tax Policy Services Leader Jon Lieber, PwC
Households Indebtedness and Financial Fragility
 9TH JACQUES POLAK ANNUAL RESEARCH CONFERENCE NOVEMBER 13-14, 2008 Households Indebtedness and Financial Fragility Tullio Jappelli University of Naples Federico II and Marco Pagano University of Naples
THE TAX SYSTEM IN BELGIUM COMPARED TO OTHER OECD COUNTRIES
 THE TAX SYSTEM IN BELGIUM COMPARED TO OTHER OECD COUNTRIES TOWARDS A WELL-BALANCED FUNDAMENTAL TAX REFORM IN BELGIUM Bert Brys, Ph.D. 14 October 2013 Senior Tax Economist Centre for Tax Policy and Administration
The determinants of income inequality in OECD countries
 Cambridge Journal of Economics 2017, 1 of 34 doi:10.1093/cje/bex069 The determinants of income inequality in OECD countries Pasquale Tridico* The objective of this paper is to identify the determinants
Public Financial Management (PFMx) Module
 Module") Public Financial Management (PFMx) Module 4 The Annual Budget Preparation and Approval This training material is the property of the International Monetary Fund (IMF) and is intended for use in IMF Fiscal
Public Financial Management (PFMx) Module 4 The Annual Budget Preparation and Approval This training material is the property of the International Monetary Fund (IMF) and is intended for use in IMF Fiscal
(1) employment, (2) informal employment, (3) wage distribution, (4) poverty, (5) labor productivity, and (6) inflation.
 employment, (2) informal employment, (3) wage distribution, (4) poverty, (5) labor productivity, and (6) inflation.") Within the context of the economic challenges that face Jordan, rising cost of living, efficiency and sufficiency of public services, falling aggregate demand, and the high unemployment rates, one can
Within the context of the economic challenges that face Jordan, rising cost of living, efficiency and sufficiency of public services, falling aggregate demand, and the high unemployment rates, one can
1 People in Paid Work
 1 People in Paid Work Indicator 1.1a Indicator 1.1b Indicator 1.2a Indicator 1.2b Indicator 1.3 Indicator 1.4 Indicator 1.5a Indicator 1.5b Indicator 1.6 Employment and Unemployment Trends (Republic of
Developing Housing Finance Systems
 Developing Housing Finance Systems Veronica Cacdac Warnock IIMB-IMF Conference on Housing Markets, Financial Stability and Growth December 11, 2014 Based on Warnock V and Warnock F (2012). Developing Housing
Coordinating Central and Local Governments Policy in Iceland. Björn Rúnar Guðmundsson Head of Economic Department Ministry of Economic Affairs
 Coordinating Central and Local Governments Policy in Iceland Björn Rúnar Guðmundsson Head of Economic Department Ministry of Economic Affairs A bird s eye view: Municipalities in Iceland Overall number
TAXATION OF TRUSTS IN ISRAEL. An Opportunity For Foreign Residents. Dr. Avi Nov
 TAXATION OF TRUSTS IN ISRAEL An Opportunity For Foreign Residents Dr. Avi Nov Short Bio Dr. Avi Nov is an Israeli lawyer who represents taxpayers, individuals and entities. Areas of Practice: Tax Law,
Growth has peaked amidst escalating risks
 OECD ECONOMIC OUTLOOK Growth has peaked amidst escalating risks 1 November 18 Ángel Gurría OECD Secretary-General Laurence Boone OECD Chief Economist http://www.oecd.org/eco/outlook/economic-outlook/ ECOSCOPE
Collective Bargaining in OECD and accession countries
 Collective Bargaining in OECD and accession countries www.oecd.org/employment/collective-bargaining.htm The, ultra-activity and retro-activity of collective agreements The detailed description of the building
PRODUCTIVE AGEING ROBERT BUTLER MEMORIAL LECTURE ILC GLOBAL ALLIANCE
 PRODUCTIVE AGEING ROBERT BUTLER MEMORIAL LECTURE ILC GLOBAL ALLIANCE Dr. Ros Altmann, CBE Business Champion for Older Workers 29 October 2014 Dr Ros Altmann Twitter: @rosaltmann Website: www.rosaltmann.com