Chapter 2: Existing Transportation System. Chapter 3. Socio Economic Profile. Old Town Fort Collins. Image 75 Credit: City of Fort Collins
|
|
|
- Marjorie Fields
- 5 years ago
- Views:
Transcription


1 Chapter 2: Existing Transportation System Chapter 3 Socio Economic Profile Old Town Fort Collins. Image 75 Credit: City of Fort Collins
2 Chapter 3: Socio-Economic Profile I. Socio-Economic Data In 2013, the North Front Range Metropolitan Planning Organization (NFRMPO) updated the Land Use Allocation Model for the North Front Range region. This model uses a base year of 2012 to generate socio economic data forecasts to the horizon year The resulting forecasts provide input to the NFRMPO Regional Travel Demand Model (RTDM) to project future travel volumes on roadways and potential transit ridership. The household and employment data are estimated for the area within the North Front Range Modeling Boundary, which is larger than the NFRMPO boundary. Overall Forecast In 2013, the NFRMPO contracted with Steven B. Fisher, Ph.D., Phyllis Resnick, Ph.D., and Logan Simpson Design to prepare a demographic forecast for the North Front Range portion of Larimer and Weld counties making up the North Front Range Modeling Boundary, Figure 3 1. The socio economic forecasts are divided into seven subregions, Figure 3 2. The NFRMPO municipalities and counties in each subregion are described in Table 3 1 and shown in Figure 3 3. The team worked closely with the State Demographer s office and a stakeholders group to develop North Front Range specific information. The report, 2040 Economic and Demographic Forecast, 23 describes the forecasting process and resulting anticipated growth in population, households, and employment from 2010 to 2040, in five year increments. Tables 3 2 through 3 4 summarize the results from the report. Table 3 1: NFRMPO Model Subregions Subregion NFRMPO Municipalities and Counties 1 Surrounding Area Eaton, LaSalle, Severance, Larimer County, Weld County 2 Greeley/Evans Evans, Garden City, Greeley, Milliken, Severance, Weld County, Windsor 3 Fort Collins Fort Collins, Larimer County 4 Loveland/Berthoud Berthoud, Johnstown, Loveland, Larimer County, Weld County 5 Extended Larimer County Larimer County 6 Extended Weld County Weld County 7 Central I 25 Johnstown, Milliken, Timnath, Windsor, Larimer County, Weld County Source: NFRMPO Land Use Allocation Model 23 Steve Fisher, Phyllis Resnick Economic and Demographic Forecast, North Front Range Metropolitan Planning Organization
3 Chapter 3: Socio Economic Profile Figure 3 1: North Front Range Modeling Boundary 77
4 Chapter 3: Socio Economic Profile Figure 3 2: North Front Range Subregions 78

5 Figure 3 3: North Front Range Subregions in the NFRMPO 79
6 Table 3 2: Population Projections Subregion Percent Growth (%) 1 50,867 89, % 2 115, , % 3 171, , % 4 78, , % 5 21,373 39, % 6 7,746 14, % 7 42, , % Total 488, , % Source: 2040 Economic and Demographic Forecast Table 3 3: Household Projections Subregion Percent Growth (%) 1 19,900 35, % 2 43,633 86, % 3 64,526 99, % 4 30,563 59, % 5 8,218 15, % 6 3,033 5, % 7 16,585 47, % Total 186, , % Source: 2040 Economic and Demographic Forecast Table 3 4: Employment Projections Subregion Percent Growth (%) 1 11,288 20, % 2 58, , % 3 101, , % 4 40,763 78, % 5 5,397 9, % 6 2,173 3, % 7 18,574 55, % Total 237, , % Source: 2040 Economic and Demographic Forecast 80
7 Land Use Allocation Model The Land Use Allocation Model (LUAM) is a parcel/land use based growth model. The LUAM distributes household and employment projections set in the 2040 Economic and Demographic Forecast report. The model allocates households and employment based on consolidated future land uses from local jurisdictions in the region, shown in Figure 3 3. These projections serve as control totals for the LUAM, meaning the population totals limit the allocation of households and employment. The North Front Range modeling area consists of seven sub regions: Central I 25, Fort Collins, Greeley, Loveland, Extended Larimer County, Extended Weld County, and Surrounding Area. The Upper Front Range (UFR) portion within the ozone nonattainment area (see Figure 4 1 in Chapter 4) is included for ozone conformity determinations. Table 3 2 highlights which municipalities and counties are contained in each subregion. Each subregion has individual control totals set for 2012, 2015, 2025, 2035, and 2040 for households and employment. Tables 3 5 and 3 6 summarize the results of the land use allocation by subregion. Figures 3 4 through 3 8 display the results of the land use allocation model by traffic analysis zone (TAZ). Table 3 5: Adjusted Household Data Subregion Percent Growth (%) 1 15,404 35, % 2 44,793 86, % 3 68,862 99, % 4 35,780 59, % 5 6,936 15, % 6 2,937 5, % 7 18,074 47, % Total 192, , % Source: NFRMPO Land Use Allocation Model Table 3 6: Adjusted Employment Data Subregion Percent Growth (%) 1 9,124 20, % 2 71, , % 3 101, , % 4 51,365 78, % 5 5,859 9, % 6 2,359 3, % 7 24,859 55, % Total 266, , % Source: NFRMPO Land Use Allocation Model 81

8 Figure 3 4: NFRMPO Future Land Use 82

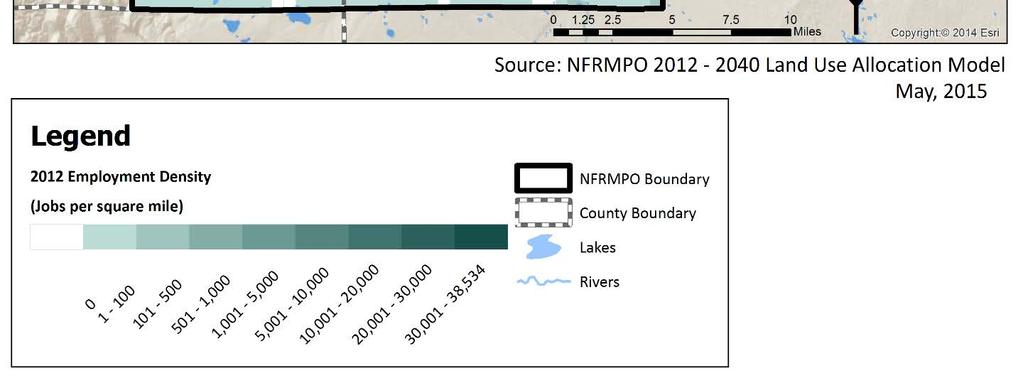
9 Figure 3 5: NFRMPO 2012 Employment 83

10 Figure 3 6: NFRMPO 2040 Employment 84

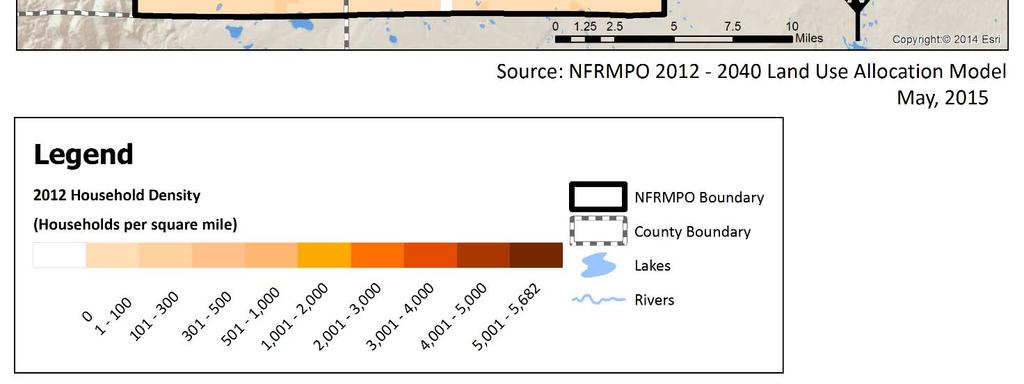
11 Figure 3 7: NFRMPO 2012 Households 85


12 Figure 3 8: NFRMPO 2040 Household Forecasts 86
13 Regional Travel Demand Model Households The 2040 Economic and Demographic Forecast, 24 projects households in the North Front Range will increase 0.2 percent annually between 2010 and For input into the travel model, household projections were classified by five household sizes, or the number of people occupying the household, and three income levels, illustrated in Table 3 7 for the 2012 base year and Table 3 8 for the 2040 projections. These classifications increase the sensitivity of the RTDM in response to household characteristics. Table 3 7: 2012 Household Size and Income Data Household Income (2010 dollars) 1 person HH 2 person HH 3 person HH 4 person HH 5+ person HH Total HH Percent Less than $20,000 17,186 1,936 33,401 8,798 11,759 73,080 38% (Low Income) $20, 000 $74,999 8,322 1,257 13,403 17,072 11,499 51,553 27% (Medium Income) $75,000 and higher 3,333 22,672 9,095 24,864 8,189 68,153 35% (High Income) Total 28,841 25,865 55,899 50,734 31, , % Percent 15% 14% 29% 26% 16% 100% Source: NFRMPO Regional Travel Demand Model Table 3 8: 2040 Household Size and Income Data Household Income (2010 dollars) 1 person HH 2 person HH 3 person HH 4 person HH 5+ person HH Total HH Percent Less than $20,000 31,306 3,526 60,845 16,027 21, ,125 38% (Low Income) $20, 000 $74,999 15,160 2,290 24,416 31,098 20,947 93,910 27% (Medium Income) $75,000 and higher 6,071 41,600 16,567 45,294 14, ,150 35% (High Income) Total 52,537 47, ,827 92,419 57, , % Percent 15% 14% 29% 26% 16% 100% Source: NFRMPO Regional Travel Demand Model 24 Steve Fisher, Phyllis Resnick Economic and Demographic Forecast, North Front Range Metropolitan Planning Organization
14 Employment Overall, employment is projected to grow at approximately two percent per year for the entire region, with Weld County projected to grow at a slightly higher rate than Larimer County. The location of employment for 2012 was determined by geocoding Quarterly Census of Employment and Wages (QCEW) data from the Bureau of Labor Statistics (BLS) to the street centerline map for the North Front Range. The results show each employer and the number of employees for each mapped location. These results were then aggregated to the TAZ level. Figure 3 9 shows major employers, those with more than 100 employees, across the North Front Range. In 2012, major employers were predominately within cities, as in previous years. These major employers were viewed as major activity centers due to their sizable contributions to transportation network use. For input into the RDTM, employment was divided into four categories defined by the National Industrial Classification System (NAICS): Basic, Medical, Retail, and Service. Basic jobs, also known as production distribution, are those based on outside dollars flowing into the local economy and include industries that manufacture and/or produce goods locally for export outside the region. Basic jobs include manufacturing, mining, utilities, transportation, and warehousing among others. Medical jobs include health care and social assistance. Retail jobs include retail trade, post offices, and food service. Service jobs include finance, insurance, real estate, and public administration. The Basic, Medical, Retail, and Service employment estimates for 2012 and forecasts for 2040 are shown in Table 3 9. The disaggregated total employment in the travel model does not account for people working from home. Classification Table 3 9: Classification of Employment Percent Percentage Percentage Growth Employees Employees (%) (%) (%) Basic 47, % 72, % 53.3% Medical 30, % 39, % 30.3% Retail 40, % 61, % 50.2% Service 148, % 255, % 72.5% Total 266, % 387, % 45.5% Source: NFRMPO Regional Travel Demand Model 88


15 Figure 3 9: 2012 Major Employers Aging Population According to the 2010 Census, the baby boomers population (those born between mid 1946 and mid 1964) 25 grew by more than 30 percent between 2000 and 2010 in Colorado. Figure 3 10 shows the significant increase in the 65+ population by 2040, compared to The likely impacts of new and pending retirees will impact the regional transportation system through: The increased demand for housing units as the in migration of new workers assume the jobs of the recently retired. The location and availability of amenities, health care, and entertainment for the senior population. The shift in the type of housing necessary to accommodate the growing senior population. The level of service and availability of transit for the senior population. 25 US Census, The Baby Boom Cohort in the United States: 2012 to 2060, pdf. 89
16 American Community Survey (ACS) data ( ) was used to identify the percentage of those aged 65 years and older by city in the NFRMPO region, Figure The cities range from six percent (Timnath) to 16 percent (Garden City). Figure 3 10: Colorado Population by Age in 2012 and Age ,000 40,000 60,000 80, , , , , , ,000 Number of Persons Source: Colorado Department of Local Affairs Larimer County is expected to have a larger percentage of its population over the age of 65, while a large portion of Weld County population growth is expected to be in the younger age brackets. The difference in general terms would be an increase in the percentage of retirees in Larimer County and an increase in the percentage of younger families with children in Weld County. Figures 3 12 and 3 13, depict this trend. 90

17 Figure 3 11: Percentage of Population 65 Years and Older by City 91
18 Figure 3 12: Larimer County Age Distribution Population 45,000 40,000 35,000 30,000 25,000 20,000 15,000 10,000 5, to 4 5 to 9 10 to to to to to to to to to 54 Age Group 55 to to to to to to to Source: State Department of Local Affairs, Demography Division, 2014 Figure 3 13: Weld County Age Distribution Population 45,000 40,000 35,000 30,000 25,000 20,000 15,000 10,000 5, to 4 5 to 9 10 to to to to to to to to to to to to to to to to Age Group Source: State Department of Local Affairs, Demography Division,
19 Vehicles by Household The number of vehicles available in households is slightly different between Larimer and Weld counties, with the overwhelming majority of households having two or more vehicles available, shown in Table Table 3 10: Number of Vehicles Available in Households by County Number of Vehicles Larimer County Weld County None 4.2% 4.3% % 25.3% % 42.0% 3 or more 24.7% 28.3% Source: US Census Bureau, Decennial Census, 2010 The vehicle availability per household is in line with commute patterns across the region. The NFRMPO 2010 Household Survey provides information about how residents in the region commute to work. The vast majority of people who commute to work do so in automobiles, Table Most commuters who use bicycles or walk to work live in Fort Collins or Greeley/Evans. Table 3 11: Commute to Work by Mode Travel Mode Commuter Trips (%) Auto/van/truck driver or passenger 89.3% Bike 6.2% Walk 3.4% Transit (local bus or express bus) 0.5% Other (don t know or refused) 0.6% Total 100% Source: NFRMPO Household Survey, 2010 J. Environmental Justice Background Executive Order 12898, Federal Actions to Address Environmental Justice (EJ) in Minority Populations and Low Income Populations (1994), was enacted to reinforce Title VI of the Civil Rights Act of The Civil Rights Act states, no person in the United States shall, on grounds of race, color, or national origin be excluded from participation in, be denied the benefits of, or be subjected to discrimination under any program or activity receiving Federal financial assistance. Executive Order also states, each Federal agency shall make achieving environmental justice part of its mission by identifying and addressing, as appropriate, disproportionately high and adverse human health or environmental effects of its programs, policies, and activities on minority populations and low income populations. 93
20 In May 2012, the US Department of Transportation (USDOT) issued an update to Order (a), Actions to Address Environmental Justice in Minority and Low Income Populations. The DOT order updates the original EJ order, which was published on April 15, The DOT order continues to be a key component in the promotion of EJ principles in all DOT programs, policies, and activities. The NFRMPO s EJ process follows three guiding principles outlined in the DOT Order: 1. To avoid, minimize, or mitigate disproportionately high and adverse human health and environmental effects, including social and economic effects, on minority and low income populations in relation to transportation improvements. 2. To ensure the full and fair participation by all potentially affected communities in the transportation decision making process. 3. To prevent the denial of, reduction in, or significant delay in the receipt of benefits by minority and lowincome populations. Under USDOT Order (a), 26 an adverse effect is defined as: Bodily impairment, infirmity, illness, or death; Air, noise, and water pollution and soil contamination; Destruction or disruption of man made or natural resources; Destruction or disruption of aesthetic values; Destruction or disruption of community cohesion or a community s economic vitality; Destruction or disruption of the availability of public and private facilities and services; Vibration; Displacement of persons, businesses, farms, or non profit organizations; Increased traffic congestion, isolation, exclusion, or separation of individuals within a given community or from a broader community; or Denial of, reduction in, or significant delay in the receipt of benefits of DOT programs, policies, or activities. The NFRMPO EJ process also includes a determination of whether a construction related activity on the existing transportation system will result in a disproportionately high and adverse effect on human health or the environment, which is defined by Order (a) as: Being predominantly borne by a minority and/or low income population or Suffered by the minority and/or low income population and is appreciably more severe or greater in magnitude than the adverse effect that will be suffered by the non minority and/or non low income populations. It is important to identify where significant numbers of minority and low income households are located within the region to comply with the requirements of Executive Order 12898, Federal Actions to Address Environmental Justice in Minority and Low Income Populations, and DOT Order (a). These orders were enacted to ensure
21 the full and fair participation of potentially affected communities in transportation decisions. The intent of EJ is to avoid, minimize, or mitigate disproportionately high and adverse impacts on minority populations and lowincome populations. The NFRMPO uses CDOT s Environmental Justice in Colorado s Statewide and Regional Planning Process Guidebook, as the framework for addressing EJ in the region. This section discusses minority and low income populations and the specific efforts in public outreach, mapping, and measuring the benefits and burdens. Low Income Populations Low income thresholds are determined by the Department of Housing and Urban Development (HUD) for the 64 counties in Colorado for use by the Department of Local Affairs (DOLA), which allocates Community Development Block Grants (CDBG). The methodology for determining low income follows the CDOT Environmental Justice Guidebook. Tables 3 12 and 3 13 show low income thresholds for Larimer and Weld counties as determined by HUD for FY Table 3 12: Larimer County HUD FY2012 Low Income Limits Persons per Household Income Limit Low Income Limit $43,550 $49,750 $55,950 $62,150 $67,150 $72,100 $77,100 $82,050 Very Low Income Limit Extremely Low Income Limit $27,200 $31,300 $35,000 $38,850 $42,000 $45,100 $48,200 $51,300 $16,350 $18,650 $21,000 $23,300 $25,200 $27,050 $28,900 $30,800 Table 3 13: Weld County HUD FY2012 Low Income Limits Persons per Household Income Limit Low Income Limit $38,300 $43,800 $49,250 $54,700 $59,100 $63,500 $67,850 $72,050 Very Low Income Limits Extremely Low Income Limits $23,950 $27,400 $30,800 $34,200 $36,950 $39,700 $42,450 $45,150 $14,350 $16,400 $18,450 $20,500 $22,150 $23,800 $25,450 $27,100 Households have been mapped using Census Tracts with ACS estimates from The dark blue areas in Figure 3 14 show Census tracts considered low income based on Median Household Income and Average Household Size. 95

22 Figure 3 14: HUD Low Income Areas Minority Populations Executive Order defines the term minority as anyone who is: American Indian and Alaskan Native a person having origins in any of the original people of North America and who maintains cultural identifications through tribal affiliation or community recognition. Asian or Pacific Islander (including Native Hawaiian) a person having origins in any of the original peoples of the Far East, Southeast Asia, the Indian subcontinent, or the Pacific Islands. Black/African American a person having origins in any of the black racial groups of Africa. Hispanic/Latino a person who is Mexican, Puerto Rican, Cuban, Central or South American, or other Spanish culture or origin, regardless of race. ACS estimates from show the largest minority population in the region is the Hispanic/Latino segment. The highest concentration, by percentage, of Hispanic/Latino residents is in Garden City at 66 percent, 96

23 Evans at 47 percent, LaSalle at 37 percent, and Greeley at 36 percent. By comparison, Fort Collins and Loveland have 10 percent and 12 percent, respectively. Census tracts show the largest concentrations of Hispanic/Latino residents in Figure 3 15 reside along the US 85 Corridor in Weld County and smaller pockets in northeast Fort Collins and southeast Loveland. Figure 3 15: Hispanic/Latino Minority Populations Figure 3 16 combines all remaining minority populations from ACS estimates. This analysis shows the predominance of the Hispanic/Latino minority and lack of diversity outside of Fort Collins and Greeley. The block groups in Fort Collins and Greeley are likely due to the presence of major universities and the influx of refugee populations over the past decade 97
 (2000), requires recipients of federal funds to examine the services they provide and identify any need for services to LEP populations.")
24 Figure 3 16: Minority Populations Other Environmental Justice Populations Limited English Proficiency Executive Order 13166, Improving Access to Services for Persons with Limited English Proficiency (LEP) (2000), requires recipients of federal funds to examine the services they provide and identify any need for services to LEP populations. Census tracts with a moderate to high percentage of residents who are proficient in another language, but speak English less than very well, are considered to be EJ populations. These languages include Spanish, Asian Languages, African Languages, Arabic, and other languages. Table 3 14 shows the top five LEP populations in the region. The NFRMPO is required to undertake special outreach for LEP populations. The NFRMPO maintains relationships with local translators who are available for public meetings and document translation for the region s LEP population and can be requested as needed. 98
25 Table 3 14: Other LEP Populations Language Total Percent of Population Spanish 16, % Asian Languages * 1, % Other Indo European Languages ** % African Languages *** % Arabic % *Asian Languages include, but are not limited to Chinese, Japanese, Korean, Thai, and Vietnamese. **Other Indo European Languages include, but are not limited to German, Greek, and Russian. ***African Languages include, but are not limited to Afro asiatic, Nilo Saharan, and Niger Congo. 65 Years of Age and Older The NFRMPO also considers the Senior Population (age 65 and older) in the EJ process. Census tracts with a moderate to high percentage of senior residents are considered to be EJ areas. Seniors face different transportation and mobility challenges which may increase the need for safety improvements in the roadway and pedestrian system, and increased transit, paratransit, demand response transportation systems, and increased transportation and transit connections throughout the region. Mapping the senior population in the region helps to show where to focus on those needs. Figure 3 11 in the Socio Economic Data Section shows the highest concentrations of residents age 65 and older by municipality. Disabled Populations Census tracts with a moderate to high percentage of residents who are disabled are considered to be EJ populations within the region. ACS designated disabilities include: Sensory Disabilities conditions including blindness, deafness, or a severe vision or hearing impairment Physical Disabilities conditions which substantially limit one or more basic physical activity. Mental Disabilities physical, mental, or emotional condition lasting more than six months and impair a person s ability to learn, remember, or concentrate. Self-Care Disabilities physical, mental, or emotional condition lasting more than six months which impair a person s ability to dress, bathe, or get around inside the home. Go-outside-home Disabilities physical, mental, or emotional condition lasting more than six months and impair a person s ability to go outside of the home to shop or visit a doctor s office. Employment Disabilities physical, mental, or emotional condition lasting more than six months which impair a person s ability to work at a job or business. 99
26 Disabled populations face different transportation and mobility challenges which may increase the need for safety improvements in the roadway and pedestrian system, increased transit, paratransit, and demandresponse transportation systems, and a higher need for mobility coordination efforts throughout the region. Additional information about existing and potential future transportation services are discussed in the 2040 Regional Transit Element (RTE). NFRMPO Environmental Justice Analysis Areas Figure 3 17 shows Census tracts with minority populations greater than the regional average of percent and tracts considered low income based on Median Household Income and Average Household Size. Census designated minority populations include Hispanic/Latino, Black (Non Hispanic), Native American (Non Hispanic), Asian (Non Hispanic), Hawaiian Pacific Islander (Non Hispanic), and Other (Non Hispanic). When implementing transportation projects within the region, an EJ Analysis must be performed on projects within these areas. Figure 3 17: Environmental Justice Areas 100
27 NFRMPO Environmental Justice Process and Analysis An EJ analysis must be completed on all projects included in the Transportation Improvement Program (TIP). If a project included in the TIP, or subsequent TIP amendments, lies within ¼ mile of or adjacent to an EJ population, an EJ analysis must be completed on the project individually. If it does not, the project is considered Non EJ. The benefits and burdens of each project must be examined individually on all EJ and Non EJ projects. An overall analysis on projects in the TIP determines if it meets EJ requirements. The analysis process follows the three guiding principles outlined in DOT order (a) listed in the EJ Background section. Chapter 12 includes an overall EJ analysis of regionally significant projects included in the FY TIP and 2040 RTP. An EJ analysis also includes a determination of whether the transportation related activity will result in a disproportionately high and adverse effect on human health and the environment as defined in DOT order (a). All EJ procedures are completed by NFRMPO staff. Table 3 15 lists the benefits and burdens of an EJ or Non EJ project. Table 3 15: Environmental Justice Benefits and Burdens Benefit Burden Decrease in travel time Air and water pollution Improved air quality Soil contamination Expanded employment opportunities Destruction or disruption of man made or natural resources Better access to transit options and alternative modes of transportation (walking and bicycling) Improved quality of transit Increased property values Adverse impacts on community cohesion or economic vitality Noise and vibration Decrease in property values 101
CHAPTER 2: SOCIO-ECONOMIC PROFILE
 2040 Regional Transit Element CHAPTER 2: SOCIO-ECONOMIC PROFILE STUDY AREA The study area for this 2040 RTE is the NFRMPO region, also designated by the Colorado Department of Transportation (CDOT) as
Chapter 10 Equity and Environmental Justice
 Chapter 10 Equity and Environmental Justice Introduction An important consideration for the 2040 Transportation Policy Plan is its impact on all populations in the Minneapolis-Saint Paul region, particularly
Appendix C-5 Environmental Justice and Title VI Analysis Methodology
 Appendix C-5 Environmental Justice and Title VI Analysis Methodology Environmental Justice Analysis SACOG is required by law to conduct an Environmental Justice (EJ) analysis as part of the MTP/SCS, to
Rifle city Demographic and Economic Profile
 Rifle city Demographic and Economic Profile Community Quick Facts Population (2014) 9,289 Population Change 2010 to 2014 156 Place Median HH Income (ACS 10-14) $52,539 State Median HH Income (ACS 10-14)
VILLAGE OF ST. CHARLES TITLE VI NON-DISCRIMINATION PLAN
 VILLAGE OF ST. CHARLES TITLE VI NON-DISCRIMINATION PLAN 110 W. SPRUCE STREET ST. CHARLES, MI 48655 Phone: 989-865-8287 Fax: 989-865-6480 Website: stcmi.com Title VI Coordinator: Deanna L. Koehler, Village
VILLAGE OF MARTIN TITLE VI NON-DISCRIMINATION PLAN
 VILLAGE OF MARTIN TITLE VI NON-DISCRIMINATION PLAN 1609 N. Main Street Martin, MI 49070 Phone: 269-672-7777 Fax: 269-672-7722 Website: www.martinmi.org Title VI Coordinator: Darcy Doezema, Clerk Phone:
TABLE 1. PROFILE OF GENERAL DEMOGRAPHIC CHARACTERISTICS
 Waterloo city, Iowa TABLE 1. PROFILE OF GENERAL DEMOGRAPHIC CHARACTERISTICS Estimate Lower Bound Upper Bound Total population 66,659 64,093 69,225 SEX AND AGE Male 32,096 30,415 33,777 Female 34,563 33,025
Proposed Service Change Title VI Compliance Review
 Proposed Service Change Title VI Compliance Review May 2014 Submitted by: Table of Contents 1. Purpose... 3 2. Background... 3 3. Definition of Title VI and Environmental Justice Impact Policies... 3 3.1
ACS DEMOGRAPHIC AND HOUSING ESTIMATES American Community Survey 1-Year Estimates
 DP05 ACS DEMOGRAPHIC AND HOUSING ESTIMATES 2012 American Community Survey 1-Year Estimates Supporting documentation on code lists, subject definitions, data accuracy, and statistical testing can be found
Mobiloil Federal Credit Union Employment Application
 Mobiloil Federal Credit Union Employment Application It is our policy to provide equal employment opportunity to all qualified persons without regard to race, creed, color, religious belief, sex, age,
Service and Fare Change Policies. Revised Draft
 Revised Draft June 19, 2013 1. INTRODUCTION It is the policy of the Sacramento Regional Transit District (RT) to provide quality service to all customers regardless of race, color, national origin, or
~ NOTICE OF MEETING ~ CAPITAL METROPOLITAN TRANSPORTATION AUTHORITY BOARD OF DIRECTORS MEETING
 ~ NOTICE OF MEETING ~ CAPITAL METROPOLITAN TRANSPORTATION AUTHORITY BOARD OF DIRECTORS MEETING 2910 East Fifth Street Austin, TX 78702 ~ AGENDA ~ Executive Assistant/Board Liaison Gina Estrada 512-389-7458
Monte Vista Population, ,744 4,651 4,564 4,467 4,458 4,432 4,451
 1 Monte Vista 4,8 4,7 4,6 4,5 4,4 4,3 4,2 4,1 4,61 4,612 4,61 4,676 Monte Vista, 2-213 4,744 4,651 4,564 4,467 4,458 4,432 4,451 4,418 4,412 4,355 2 21 22 23 24 25 26 27 28 29 21 211 212 213 Year Monte
ACS DEMOGRAPHIC AND HOUSING ESTIMATES American Community Survey 1-Year Estimates
 DP05 ACS DEMOGRAPHIC AND HOUSING ESTIMATES 2010 American Community Survey 1-Year s Supporting documentation on code lists, subject definitions, data accuracy, and statistical testing can be found on the
APPENDIX 6: CENSUS DATA BURLINGTON, VERMONT
 APPENDIX 6: CENSUS DATA BURLINGTON, VERMONT 2000 CENSUS DATA 2005-2007 AMERICAN COMMUNITY SURVEY Burlington city, Vermont - Fact Sheet - American FactFinder Page 1 of 2 FACT SHEET Burlington
American Community Survey 5-Year Estimates
 DP02 SELECTED SOCIAL CHARACTERISTICS IN THE UNITED STATES 2007-2011 American Community Survey 5-Year Estimates Supporting documentation on code lists, subject definitions, data accuracy, and statistical
To determine your eligibility for the program, the following documentation must be completed and submitted:
 Dear Applicant, As a participating jurisdiction in the St. Charles Urban County, the City of St. Peters will administer a St. Peters Urban County Home Improvement Loan Program (H.I.L.P) once federal funding
TECHNICAL REPORT NO. 11 (5 TH EDITION) THE POPULATION OF SOUTHEASTERN WISCONSIN PRELIMINARY DRAFT SOUTHEASTERN WISCONSIN REGIONAL PLANNING COMMISSION
 THE POPULATION OF SOUTHEASTERN WISCONSIN PRELIMINARY DRAFT SOUTHEASTERN WISCONSIN REGIONAL PLANNING COMMISSION") TECHNICAL REPORT NO. 11 (5 TH EDITION) THE POPULATION OF SOUTHEASTERN WISCONSIN PRELIMINARY DRAFT 208903 SOUTHEASTERN WISCONSIN REGIONAL PLANNING COMMISSION KRY/WJS/lgh 12/17/12 203905 SEWRPC Technical
TECHNICAL REPORT NO. 11 (5 TH EDITION) THE POPULATION OF SOUTHEASTERN WISCONSIN PRELIMINARY DRAFT 208903 SOUTHEASTERN WISCONSIN REGIONAL PLANNING COMMISSION KRY/WJS/lgh 12/17/12 203905 SEWRPC Technical
CHAPTER 3: GROWTH OF THE REGION
 CHAPTER OVERVIEW Introduction Introduction... 1 Population, household, and employment growth are invariably Residential... 2 expected continue grow in both the incorporated cities Non-Residential (Employment)
Environmental Justice Analysis. Appendix 3 to SFY MORPC TIP
 Environmental Justice Analysis Appendix 3 to SFY 2018-2021 MORPC TIP April 28, 2017 Table of Contents I. INTRODUCTION TO ENVIRONMENTAL JUSTICE... 2 A. Definition of Environmental Justice... 2 B. Regulatory
American Community Survey 5-Year Estimates
 DP05 ACS DEMOGRAPHIC AND HOUSING ESTIMATES 2011-2015 American Community Survey 5-Year Estimates Supporting documentation on code lists, subject definitions, data accuracy, and statistical testing can be
American Community Survey 5-Year Estimates
 DP05 ACS DEMOGRAPHIC AND HOUSING ESTIMATES 2011-2015 American Community Survey 5-Year Estimates Supporting documentation on code lists, subject definitions, data accuracy, and statistical testing can be
Local Business Profile All Sectors - Fairfield city, Ohio. Contents. What will I find in this report? My Customers
 Local Business Profile All Sectors -, Contents What will I find in this report? My Customers The My Customers section provides summarized demographic information for,. This information provides a snapshot
THE ECONOMY AND POPULATION OF THE SOUTHEASTERN WISCONSIN REGION
 THE ECONOMY AND POPULATION OF THE SOUTHEASTERN WISCONSIN REGION NEWSLETTER JANUARY214 The reports were developed under the guidance of the SEWRPC Advisory Committee on Regional Population and Economic
CHAPTER 3 POPULATION AND ECONOMIC CHARACTERISTICS
 CHAPTER 3 POPULATION AND ECONOMIC CHARACTERISTICS INTRODUCTION Population trends in La Vista and its respective planning jurisdiction serve as valuable indicators of future development needs and patterns
2. Demographics. Population and Households
 2. Demographics This analysis describes the existing demographics in. It will be used to identify the major demographic trends that may have an effect on public policy in in the next decade. Demographic
MEMORANDUM. Gloria Macdonald, Jennifer Benedict Nevada Division of Health Care Financing and Policy (DHCFP)
") MEMORANDUM To: From: Re: Gloria Macdonald, Jennifer Benedict Nevada Division of Health Care Financing and Policy (DHCFP) Bob Carey, Public Consulting Group (PCG) An Overview of the in the State of Nevada
MEMORANDUM To: From: Re: Gloria Macdonald, Jennifer Benedict Nevada Division of Health Care Financing and Policy (DHCFP) Bob Carey, Public Consulting Group (PCG) An Overview of the in the State of Nevada
CITY OF CALISTOGA DOWN PAYMENT ASSISTANCE PROGRAM LOAN APPLICATION
 DOWN PAYMENT ASSISTANCE PROGRAM LOAN APPLICATION Date Applicant s Name Phone Residence Address Home City, State, Zip Code Phone Mailing Address (If different) FAMILY INFORMATION Applicant or Co-Applicant
Tell us what you think. Provide feedback to help make American Community Survey data more useful for you.
 DP05 ACS DEMOGRAPHIC AND HOUSING ESTIMATES 2016 American Community Survey 1-Year Estimates Supporting documentation on code lists, subject definitions, data accuracy, and statistical testing can be found
Economic Overview New York
 Report created on October 20, 2015 Economic Overview Created using: Contact: Lisa.Montiel@suny.edu DEMOGRAPHIC PROFILE...3 EMPLOYMENT TRENDS...5 UNEMPLOYMENT RATE...5 WAGE TRENDS...6 COST OF LIVING INDEX...6
Economic Overview Long Island
 Report created on October 20, 2015 Economic Overview Long Island Created using: Contact: Lisa.Montiel@suny.edu DEMOGRAPHIC PROFILE...3 EMPLOYMENT TRENDS...5 UNEMPLOYMENT RATE...5 WAGE TRENDS...6 COST OF
Clay County Comprehensive Plan
 2011-2021 Clay County Comprehensive Plan Chapter 1: Demographic Overview Clay County Comprehensive Plan Demographic Overview Population Trends This section examines historic and current population trends
FUTURE LANDSCAPES. The effects of changing demographics. Background. Future landscapes: The effects of changing demographics February, 2007
 FUTURE LANDSCAPES The effects of changing demographics Background DRCOG Board Retreat 1 Our region is changing Demographic facts: Rapid growth of the older population Increasing immigration Flexible, creative
Florida: Demographic Trends
 Florida: Demographic Trends September 26, 2011 Presented by: The Florida Legislature Office of Economic and Demographic Research 850.487.1402 http://edr.state.fl.us Population Growth Recovering Population
WAITLIST APPLICATION CHECK LIST
 3550 VILLA LANE NAPA, CALIFORNIA 94558-3436 (707) 251-8077 WAITLIST APPLICATION CHECK LIST Thank you for your interest in Silverado Creek rental housing. For your convenience we ve summarized below the
E APPENDIX METHODOLOGY FOR LAND USE PROJECTIONS IN THE BOSTON REGION INTRODUCTION
 E APPENDIX METHODOLOGY FOR LAND USE PROJECTIONS IN THE BOSTON REGION INTRODUCTION The Metropolitan Area Planning Council (MAPC), the region s land use planning agency, is responsible for preparing detailed
Economic Overview Monterey County, California. July 22, 2016
 Economic Overview Monterey July 22, 2016 DEMOGRAPHIC PROFILE... 3 EMPLOYMENT TRENDS... 5 UNEMPLOYMENT RATE... 5 WAGE TRENDS... 6 COST OF LIVING INDEX... 6 INDUSTRY SNAPSHOT... 7 OCCUPATION SNAPSHOT...
Risk and Technology Review - Analysis of Socio-Economic Factors for Populations Living Near Hard Chromium Electroplating Facilities
 Risk and Technology Review - Analysis of Socio-Economic Factors for Populations Living Near Hard Chromium Electroplating Facilities Prepared by: EC/R Incorporated 501 Eastowne Drive, Suite 250 Chapel Hill,
Economic Overview Long Island
 Report created on August 29, 2017 Economic Overview Long Island Contact: Lisa.Montiel@suny.edu DEMOGRAPHIC PROFILE... 3 EMPLOYMENT TRENDS... 5 UNEMPLOYMENT RATE... 5 WAGE TRENDS... 6 COST OF LIVING INDEX...
Economic Overview City of Tyler, TX. January 8, 2018
 Economic Overview City of Tyler, TX January 8, 2018 DEMOGRAPHIC PROFILE...3 EMPLOYMENT TRENDS...5 WAGE TRENDS...5 COST OF LIVING INDEX...6 INDUSTRY SNAPSHOT...7 OCCUPATION SNAPSHOT...9 INDUSTRY CLUSTERS...
Economic Overview Loudoun County, Virginia. October 23, 2017
 Economic Overview October 23, 2017 DEMOGRAPHIC PROFILE... 3 EMPLOYMENT TRENDS... 5 UNEMPLOYMENT RATE... 5 WAGE TRENDS... 6 COST OF LIVING INDEX... 6 INDUSTRY SNAPSHOT... 7 OCCUPATION SNAPSHOT... 9 INDUSTRY
DEMOGRAPHIC PROFILE...3 EMPLOYMENT TRENDS...5 UNEMPLOYMENT RATE...5 WAGE TRENDS...6 COST OF LIVING INDEX...6 INDUSTRY SNAPSHOT...7
 March 14, 2017 DEMOGRAPHIC PROFILE...3 EMPLOYMENT TRENDS...5 UNEMPLOYMENT RATE...5 WAGE TRENDS...6 COST OF LIVING INDEX...6 INDUSTRY SNAPSHOT...7 OCCUPATION SNAPSHOT...9 INDUSTRY CLUSTERS... 12 EDUCATION
Title VI Non-Discrimination and Limited English Proficiency Plan
 Fargo-Moorhead Metropolitan Council of Governments Title VI Non-Discrimination and Limited English Proficiency Plan PREPARED BY: FARGO-MOORHEAD METROPOLITAN COUNCIL OF GOVERNMENTS ADOPTON: March 16, 2017
BINGHAMTON METROPOLITAN TRANSPORTATION STUDY CERTIFICATION NARRATIVE FY 2016
 BINGHAMTON METROPOLITAN TRANSPORTATION STUDY CERTIFICATION NARRATIVE FY 2016 The Binghamton Metropolitan Transportation Study Policy Committee is designated by the Governor of New York as the Metropolitan
FTA Title VI Requirements and SamTrans Service Plan Approval Schedule
 FTA Title VI Requirements and SamTrans Service Plan Approval Schedule Board of Directors January 9, 2013 Presentation Overview Title VI Overview Revised FTA Title VI requirements Impact of FTA Title VI
October 28, Economic Overview Yellowstone County, Montana
 October 28, 2016 Economic Overview Yellowstone DEMOGRAPHIC PROFILE...3 EMPLOYMENT TRENDS...5 UNEMPLOYMENT RATE...5 WAGE TRENDS...6 COST OF LIVING INDEX...6 INDUSTRY SNAPSHOT...7 OCCUPATION SNAPSHOT...9
June 9, Economic Overview Billings, MT MSA
 June 9, 2016 Economic Overview Billings, MT MSA DEMOGRAPHIC PROFILE... 3 EMPLOYMENT TRENDS... 5 UNEMPLOYMENT RATE... 5 WAGE TRENDS... 6 COST OF LIVING INDEX... 6 INDUSTRY SNAPSHOT... 7 OCCUPATION SNAPSHOT...
Economic Overview York County, South Carolina. February 14, 2018
 Economic Overview York County, February 14, 2018 DEMOGRAPHIC PROFILE... 3 EMPLOYMENT TRENDS... 5 UNEMPLOYMENT RATE... 5 WAGE TRENDS... 6 COST OF LIVING INDEX... 6 INDUSTRY SNAPSHOT... 7 OCCUPATION SNAPSHOT...
Economic Overview Fairfax / Falls Church. October 23, 2017
 Economic Overview Fairfax / Falls Church October 23, 2017 DEMOGRAPHIC PROFILE... 3 EMPLOYMENT TRENDS... 5 UNEMPLOYMENT RATE... 5 WAGE TRENDS... 6 COST OF LIVING INDEX... 6 INDUSTRY SNAPSHOT... 7 OCCUPATION
Limited English Proficiency (LEP) Plan
 Plan") Limited English Proficiency (LEP) Plan February 2018 2300 N Jog Road, 4th Floor West Palm Beach, FL 33411 Phone: 561.684.4170 www.palmbeachtpa.org Limited English Proficiency (LEP) Plan 2 Adopted February
Limited English Proficiency (LEP) Plan February 2018 2300 N Jog Road, 4th Floor West Palm Beach, FL 33411 Phone: 561.684.4170 www.palmbeachtpa.org Limited English Proficiency (LEP) Plan 2 Adopted February
MADISON ATHENS-CLARKE OCONEE REGIONAL TRANSPORTATION STUDY UNIFIED PLANNING WORK PROGRAM FY
 MADISON ATHENS-CLARKE OCONEE REGIONAL TRANSPORTATION STUDY UNIFIED PLANNING WORK PROGRAM FY - 2018 Final April 12, 2017 Prepared by: Athens-Clarke County Planning Department In Cooperation with: The Georgia
Economic Overview Capital District
 August 29, 2017 Economic Overview Capital District Contact: Lisa.Montiel@suny.edu DEMOGRAPHIC PROFILE... 3 EMPLOYMENT TRENDS... 5 UNEMPLOYMENT RATE... 5 WAGE TRENDS... 6 COST OF LIVING INDEX... 6 INDUSTRY
ECONOMIC OVERVIEW DuPage County, Illinois
 ECONOMIC OVERVIEW DuPage County, Illinois DEMOGRAPHIC PROFILE... 3 EMPLOYMENT TRENDS... 5 UNEMPLOYMENT RATE... 5 WAGE TRENDS... 6 COST OF LIVING INDEX... 7 INDUSTRY SNAPSHOT... 8 OCCUPATION SNAPSHOT...
REVOLVING LOAN FUND POLICY
 REVOLVING LOAN FUND POLICY The purpose of this policy is to provide guidance regarding loans from a revolving loan fund (RLF) to private and public entities for projects that benefit the community. Nothing
BOARD OF SUPERVISORS BUSINESS MEETING ACTION ITEM
 Date of Meeting: June 7, 2016 # 7 BOARD OF SUPERVISORS BUSINESS MEETING ACTION ITEM SUBJECT: ELECTION DISTRICT: Title VI Policies for Transit Service Countywide CRITICAL ACTION DATE: June 7, 2016 STAFF
Demographic and Economic Profile. Texas. Updated April 2006
 Demographic and Economic Profile Texas Updated April 2006 Metro and Nonmetro Counties in Texas Based on the most recent listing of core based statistical areas by the Office of Management and Budget (December
Economic Overview. Lawrence, KS MSA
 Economic Overview Lawrence, KS MSA March 5, 2019 DEMOGRAPHIC PROFILE... 3 EMPLOYMENT TRENDS... 5 UNEMPLOYMENT RATE... 5 WAGE TRENDS... 6 COST OF LIVING INDEX... 7 INDUSTRY SNAPSHOT... 8 OCCUPATION SNAPSHOT...
Economic Overview Western New York
 Report created on August 29, 2017 Economic Overview Western New Contact: Lisa.Montiel@suny.edu DEMOGRAPHIC PROFILE... 3 EMPLOYMENT TRENDS... 5 UNEMPLOYMENT RATE... 5 WAGE TRENDS... 6 COST OF LIVING INDEX...
COMPREHENSIVE PLAN UPDATE EXECUTIVE SUMMARY. Plan Abstract
 Village of Swansea, Illinois 10/26/2017 Executive Summary COMPREHENSIVE PLAN UPDATE EXECUTIVE SUMMARY A Plan Abstract The following are excerpts from Swansea s 2017 Comprehensive Plan Update Comprehensive
ONBOARD ORIGIN-DESTINATION STUDY
 REPORT ONBOARD ORIGIN-DESTINATION STUDY 12.23.2014 PREPARED FOR: ANCHORAGE METROPOLITAN AREA TRANSPORTATION SYSTEM (AMATS) 55 Railroad Row White River Junction, VT 05001 802.295.4999 www.rsginc.com SUBMITTED
Overview of Final Circular B Title VI Requirements and Guidelines for Recipients. February 2013
 Overview of Final Circular 4702.1B Title VI Requirements and Guidelines for Recipients February 2013 Title VI Prohibits discrimination on the basis of race, color, or national origin in Federally funded
Economic Overview Marlboro County Labor Shed. June 29, 2016
 Economic Overview Marlboro County Labor June 29, 2016 DEMOGRAPHIC PROFILE...3 EMPLOYMENT TRENDS...5 UNEMPLOYMENT RATE...5 WAGE TRENDS...6 COST OF LIVING INDEX...6 INDUSTRY SNAPSHOT...7 OCCUPATION SNAPSHOT...9
Economic Overview Prince William/Manassas. October 23, 2017
 Economic Overview Prince William/Manassas October 23, 2017 DEMOGRAPHIC PROFILE... 3 EMPLOYMENT TRENDS... 5 UNEMPLOYMENT RATE... 5 WAGE TRENDS... 6 COST OF LIVING INDEX... 6 INDUSTRY SNAPSHOT... 7 OCCUPATION
CHAPTER 16 POPULATION AND HOUSING, SOCIOECONOMICS, AND ENVIRONMENTAL JUSTICE 16.1 AFFECTED ENVIRONMENT/ENVIRONMENTAL SETTING
 CHAPTER 16 POPULATION AND HOUSING, SOCIOECONOMICS, AND ENVIRONMENTAL JUSTICE This chapter provides an overview of the existing social and economic conditions, demographics, and the characteristics of minority
Small Business Enterprise Program
 Small Business Enterprise Program Registration & Roster Enrollment Registration Does NOT Pre-Approve You (The City may use this information to develop bid lists, contract lists and reports. Prime contractors
OVERVIEW OF THE SAN DIEGO REGION Current Conditions and Future Trends
 OVERVIEW OF THE SAN DIEGO REGION Current Conditions and Future Trends Why do we need a Regional Comprehensive Plan? Let s examine the facts. It helps to look at some objective statistical information that
MetroWest Health Foundation Trends and Projections
 MetroWest Health Foundation Trends and Projections Seleeke Flingai, PhD, MPA Research Analyst II Metropolitan Area Planning Council November 16, 2018 DRAFT Natick, MA Photo credit: Natick Department of
Economic Overview Mohawk Valley
 Report created on August 29, 2017 Economic Overview Mohawk Valley Contact: Lisa.Montiel@suny.edu DEMOGRAPHIC PROFILE... 3 EMPLOYMENT TRENDS... 5 UNEMPLOYMENT RATE... 5 WAGE TRENDS... 6 COST OF LIVING INDEX...
Employment Application
 Employment Application To Applicant Instructions We appreciate your interest in our company and we are interested in reviewing your qualifications for our current open positions. To make this the best
State Employees Credit Union Application for Employment
 State Employees Credit Union Application for Employment Note: Application must be handwritten. Do not type. We appreciate your interest in our organization. Please complete the application as fully as
Lapkoff & Gobalet Demographic Research, Inc.
 Lapkoff & Gobalet Demographic Research, Inc. 22361 Rolling Hills Road, Saratoga, CA 95070-6560 (408) 725-8164 Fax (408) 725-1479 2120 6 th Street #9, Berkeley, CA 94710-2204 (510) 540-6424 Fax (510) 540-6425
Last Name First Name Middle Initial ADDRESS Street City County State Zip
 APPLICATION FOR EMPLOYMENT Kolberg-Pioneer, Inc. An Equal Opportunity Employer (HRF-002-03 01/16) This application is valid for the calendar year of 2018. Kolberg-Pioneer, Inc. will provide the Social
Findings from Focus Groups: Select Populations in Dane County
 W ISCONSIN STATE PLANNING GRANT Briefing Paper 3, September 2001 Findings from Focus Groups: Select Populations in Dane County Wisconsin is one of 20 states that received a grant in 2000-01 from the Health
TRADE ACT PARTICIPANT REPORT
 TRADE ACT PARTICIPANT REPORT REVISED PARTICIPANT RECORD LAYOUT Field Number Field Name Guidelines and Comments Section I: Identification and Characteristics of Applicant 1 I.1. State name Record the full
Economic Overview 45-Minute Commute From Airport Park. June 6, 2017
 Economic Overview 45-Minute Commute From Airport Park June 6, 2017 DEMOGRAPHIC PROFILE... 3 EMPLOYMENT TRENDS... 5 WAGE TRENDS... 5 COST OF LIVING INDEX... 6 INDUSTRY SNAPSHOT... 7 OCCUPATION SNAPSHOT...
Pennsylvania. Demographic and Economic Profile. Metro and Nonmetro Counties in Pennsylvania
 Demographic and Economic Profile Pennsylvania Updated June 2006 Metro and Nonmetro Counties in Pennsylvania Based on the most recent listing of core based statistical areas by the Office of Management
Vendor Information Form
 NEW YORK STATE HOUSING FINANCE AGENCY HOUSING TRUST FUND CORPORATION NEW YORK STATE AFFORDABLE HOUSING CORPORATION STATE OF NEW YORK MORTGAGE AGENCY STATE OF NEW YORK MUNICIPAL BOND BANK AGENCY TOBACCO
Urban Action Agenda Community Profiles COVER TO GO HERE. City of Beacon
 Urban Action Agenda Community Profiles COVER TO GO HERE City of Beacon COMMUNITY OVERVIEW MAP POPULATION & DEMOGRAPHICS Population Basics 27,828 Population (2015) Population Change 9.6% since 2000 5.1
Demographic and Economic Profile. New Mexico. Updated June 2006
 Demographic and Economic Profile New Mexico Updated June 2006 Metro and Nonmetro Counties in New Mexico Based on the most recent listing of core based statistical areas by the Office of Management and
Transitions. Population and Economic Trends For Northern Colorado
 Transitions Population and Economic Trends For Northern Colorado EDCC 2017 Elizabeth Garner State Demography Office Colorado Department of Local Affairs Demography.dola.colorado.gov Transitions to Watch
July Dear Provider:
 , Inc. Our Mission is to encourage and support the success and well-being of children, families and the child care community... July 2018 Dear Provider: To qualify for tier I reimbursement for meals served
Commission District 4 Census Data Aggregation
 Commission District 4 Census Data Aggregation 2011-2015 American Community Survey Data, U.S. Census Bureau Table 1 (page 2) Table 2 (page 2) Table 3 (page 3) Table 4 (page 4) Table 5 (page 4) Table 6 (page
Economic Overview Plant City Region. April 5, 2017
 Economic Overview Plant City Region April 5, 2017 DEMOGRAPHIC PROFILE... 3 EMPLOYMENT TRENDS... 5 WAGE TRENDS... 5 COST OF LIVING INDEX... 6 INDUSTRY SNAPSHOT... 7 OCCUPATION SNAPSHOT... 9 INDUSTRY CLUSTERS...
Demographic and Economic Profile. North Dakota. Updated June 2006
 Demographic and Economic Profile North Dakota Updated June 2006 Metro and Nonmetro Counties in North Dakota Based on the most recent listing of core based statistical areas by the Office of Management
Nutrition Services Division DCH 06 (REV. 8/2018) PAGE 1 of 6 MEAL BENEFIT FORM FOR PROVIDERS
 PAGE 1 of 6 MEAL BENEFIT FORM FOR PROVIDERS") PAGE 1 of 6 MEAL BENEFIT FORM FOR PROVIDERS Complete, sign, and return this form to your day care home (DCH) sponsor. If you need assistance completing this form, call: (213) 380-3850 Name of DCH provider:
PAGE 1 of 6 MEAL BENEFIT FORM FOR PROVIDERS Complete, sign, and return this form to your day care home (DCH) sponsor. If you need assistance completing this form, call: (213) 380-3850 Name of DCH provider:
Poverty in the United Way Service Area
 Poverty in the United Way Service Area Year 4 Update - 2014 The Institute for Urban Policy Research At The University of Texas at Dallas Poverty in the United Way Service Area Year 4 Update - 2014 Introduction
Larimer Home Ownership Program
 375 W. 37 th St., Suite 200, Loveland, CO 80538 Phone 970.635.5931 Fax 970.278.9904 Larimer Home Ownership Program Application & Information Packet For assistance in Spanish please call 970-635-5931 to
Visit our Publications and Open Data Catalogue to find our complete inventory of our freely available information products.
 Welcome to Mississauga Data This report and other related documents can be found at www.mississauga.ca/data. Mississauga Data is the official City of Mississauga website that contains urban planning related
INVITATON TO BID LAND USE & TRAVEL DEMAND MODELING BID OPENING: 9:00 A.M. (our clock), July 11, 2013
, July 11, 2013") INVITATON TO BID LAND USE & TRAVEL DEMAND MODELING 2013-01 BID OPENING: 9:00 A.M. (our clock), July 11, 2013 Financial Services Purchasing 419 Canyon Ave., Suite 300 Fort Collins, CO 80521 970.221.6243
INVITATON TO BID LAND USE & TRAVEL DEMAND MODELING 2013-01 BID OPENING: 9:00 A.M. (our clock), July 11, 2013 Financial Services Purchasing 419 Canyon Ave., Suite 300 Fort Collins, CO 80521 970.221.6243
Northwest Census Data Aggregation
 Northwest Census Data Aggregation 2011-2015 American Community Survey Data, U.S. Census Bureau Table 1 (page 2) Table 2 (page 2) Table 3 (page 3) Table 4 (page 4) Table 5 (page 4) Table 6 (page 5) Table
DEMOGRAPHY AND THE ECONOMY
 DEMOGRAPHY AND THE ECONOMY David Keyser State Demography Office September 22, 2011 Colorado.gov/demography Demography Powerful Big changes often predictable Informative Today Information about us Role
Riverview Census Data Aggregation
 Riverview Census Data Aggregation 2011-2015 American Community Survey Data, U.S. Census Bureau Table 1 (page 2) Table 2 (page 2) Table 3 (page 3) Table 4 (page 4) Table 5 (page 4) Table 6 (page 5) Table
Zipe Code Census Data Aggregation
 Zipe Code 66101 Census Data Aggregation 2011-2015 American Community Survey Data, U.S. Census Bureau Table 1 (page 2) Table 2 (page 2) Table 3 (page 3) Table 4 (page 4) Table 5 (page 4) Table 6 (page 5)
Zipe Code Census Data Aggregation
 Zipe Code 66103 Census Data Aggregation 2011-2015 American Community Survey Data, U.S. Census Bureau Table 1 (page 2) Table 2 (page 2) Table 3 (page 3) Table 4 (page 4) Table 5 (page 4) Table 6 (page 5)
Are Asian Americans and Pacific Islanders Financially Secure? An AARP Report about the Economic Well-being of AAPIs Age 50+
 DECEMBER 2014 Are Asian Americans and Pacific Islanders Financially Secure? An AARP Report about the Economic Well-being of AAPIs Age 50+ Executive Summary Welcome Are Asian Americans and Pacific Islanders
Utah. Demographic and Economic Profile. Metro and Nonmetro Counties in Utah
 Demographic and Economic Profile Utah Updated July 2006 Metro and Nonmetro Counties in Utah Based on the most recent listing of core based statistical areas by the Office of Management and Budget (December
ESKATON HAZEL SHIRLEY MANOR San Pablo Avenue, El Cerrito, CA PH: (510) FAX: (510) TDD: (800)
 FAX: (510) TDD: (800)") RCVD BY DATE TIME ESKATON HAZEL SHIRLEY MANOR 11025 San Pablo Avenue, El Cerrito, CA 94530 PH: (510) 232-3430 FAX: (510) 232-1056 TDD: (800) 735-2922 www.eskaton.org APPLICATION FOR HOUSING PLEASE PRINT
RCVD BY DATE TIME ESKATON HAZEL SHIRLEY MANOR 11025 San Pablo Avenue, El Cerrito, CA 94530 PH: (510) 232-3430 FAX: (510) 232-1056 TDD: (800) 735-2922 www.eskaton.org APPLICATION FOR HOUSING PLEASE PRINT
Urban Action Agenda Community Profiles COVER TO GO HERE. City of Beacon
 Urban Action Agenda Community Profiles COVER TO GO HERE City of Beacon COMMUNITY OVERVIEW MAP POPULATION & DEMOGRAPHICS Population Basics 2,212 Population (2015) Population Change 2. since 2000 0.5 Square
West Valley City: Fair Housing Equity Assessment
 West Valley City: Fair Housing Equity Assessment Prepared by Bureau of Economic and Business Research David Eccles School of Business University of Utah James Wood John Downen DJ Benway Darius Li April
Application for Health Coverage & Help Paying Costs
 Application for Health Coverage & Help Paying Costs Use this application to see what coverage choices you qualify for Affordable private health insurance plans that offer comprehensive coverage to help