REPORT TO THE CITY COUNCIL rd Avenue NE, Woodinville, WA
|
|
|
- Randolph Knight
- 5 years ago
- Views:
Transcription

. Total Operating Revenues Operating revenues exceeded forecast by 3%, totaling $20.2 million.")
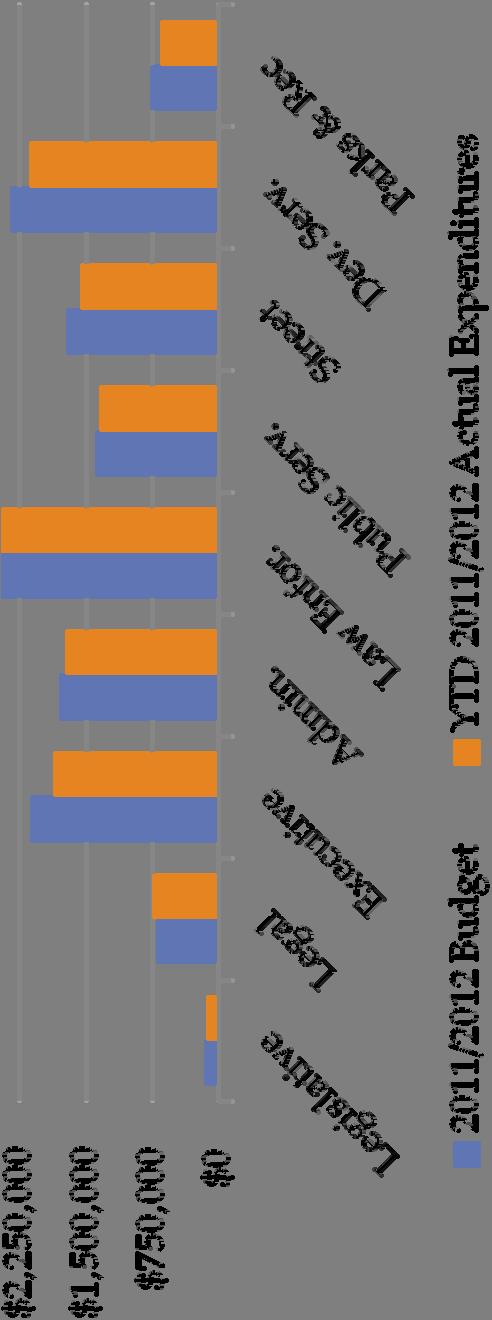
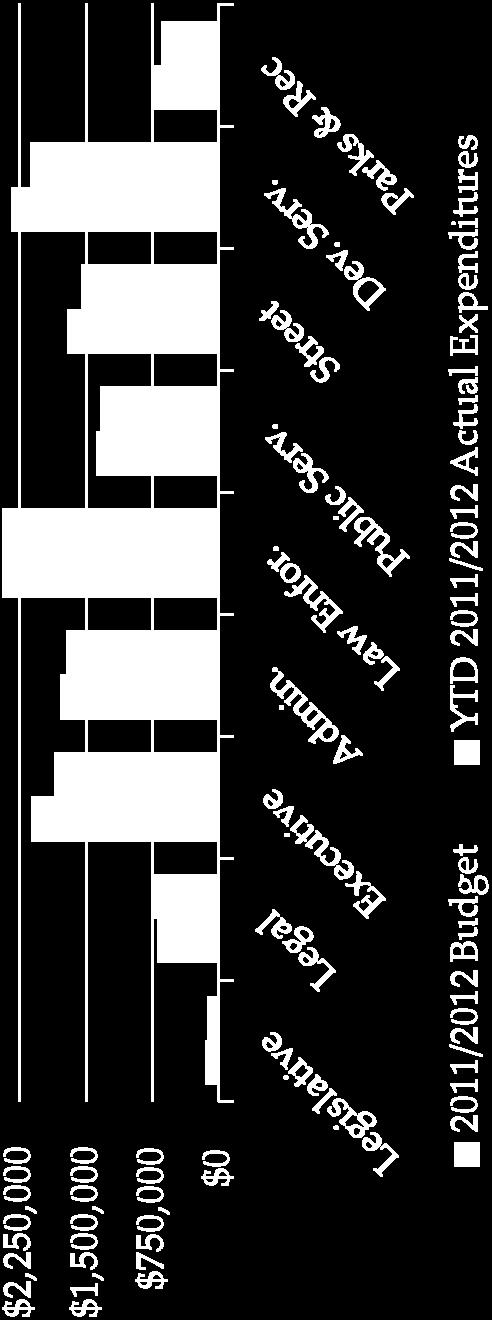
1 CITY OF WOODINVILLE, WA REPORT TO THE CITY COUNCIL rd Avenue NE, Woodinville, WA To: Honorable City Council From: Richard A. Leahy, City Manager By: Jim Katica, Finance Director Blaine Fritts, Senior Accountant Subject: Treasury Report for December 2012 Date: February 5, 2013 ISSUE: Shall the City Council receive the Treasury Report for December 2012? RECOMMENDATION: To receive the Treasury Report for the month of December BACKGROUND/DISCUSSION: Revenues and expenditures are reported through December 2012 (end of the biennium). Total Operating Revenues Operating revenues exceeded forecast by 3%, totaling $20.2 million. The major contributors to this unanticipated revenue and the amounts that the revenues exceed forecast are; Development Services, $515,000; Sales Tax, $94,000; and Street Fund, $51,000 (due in part to FEMA grant revenue for the January 2012 snow event). Primary Tax Revenues Sales Tax ended the biennium approximately $94,000 or 1% above forecast. Retail Trade, Accommodation & Food Services, Wholesale Trade and Admin & Support of Waste Management & Remedial Services comprised 65% of the sales tax revenue for the Biennium. The sum of all four of these economic sectors exceeded the prior biennium revenue by 8%. When compared to the prior biennium, sales tax from construction was down by 12%. Property Tax ended the biennium about $55,000 below forecast. Admission Tax, Utility Tax, and Field Rental revenues all exceeded projections by $21,000, $19,000 and $15,000 respectively. Development Services permit and fee revenues are $515,000 above forecast. Fire permits exceeded revenue estimates by $244,000 and zoning & subdivision fees exceeded revenue estimates by $230,000. Capital Project Revenues Real Estate Excise Tax (REET) ended the biennium $344,000 above forecast due to three large unanticipated property sales during the period. The City expected to only receive $22,000 in Park Impact fees during the biennium and fell short of that conservative estimate with actual revenue of $10,000. Traffic Impact fees fell short of the revenue forecast by $3,000. Expenditures Operating expenditures were budgeted at $17 million for the biennium (less transfers). The City actually incurred $15.5 million in expenditures, completing the biennium 10% under budget. Legal Services is the only department that exceeded the operating budget and ended the biennium $56,000 over budget. RECOMMENDED MOTION: I MOVE TO RECEIVE THE DECEMBER 2012 TREASURY REPORT. Attachment 1: December 2012 Treasury Report
2


3 Treasury Report December 2012 City of Woodinville, Washington rd Avenue NE Woodinville, Washington
4


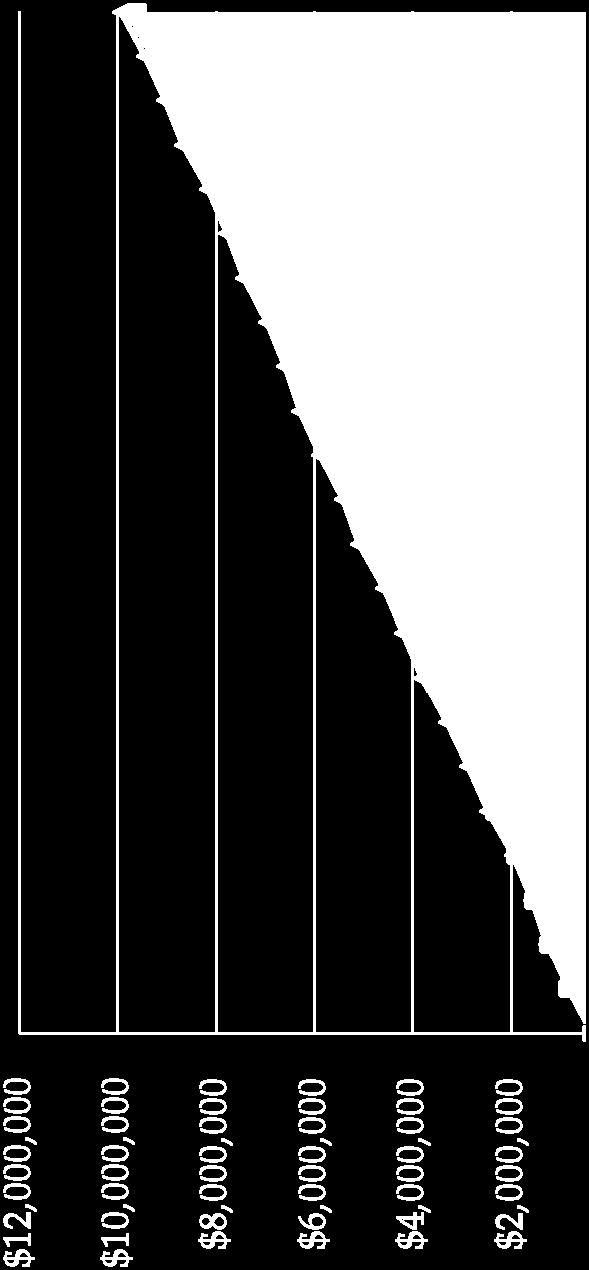
5 City of Woodinville, Washington Schedule No. 1: Monthly Comparison Graphs Revised Budget Actual Pd To Date Jan-1 1 $348,916 $344,438 Feb-11 $790,500 $812,220 Mar-11 $1,255,905 $1,272,624 Apr-11 $1,571,827 $1,584,235 May-1 1 $1,970,838 $1,979,898 Jun-11 $2,468,189 $2,482,907 Jul-11 $2,837,639 $2,878,835 Aug-11 $3,268,271 $3,309,152 Sep-11 $3,792,347 $3,808,760 Oct-11 $4,176,543 $4,192,946 Nov-11 $4,593,389 $4,588,637 Dec-1 1 $5,126,000 $5,078,824 Jan-12 $5,444,576 $5,420,109 Feb-12 $5,847,761 $5,875,960 Mar-12 $6,277,630 $6,298,079 Apr-12 $6,566,081 $6,604,096 May-12 $6,930,442 $6,957,538 Jun-12 $7,389,433 $7,420,509 Jul-12 $7,726,757 $7,772,930 Aug-12 $8,1 19,943 $8,169,443 Sep-12 $8,603,382 $8,671,391 Oct-12 $8,954,169 $9,042,912 Nov-12 $9,334,768 $9,454,890 Dec-12 $9,826,000 $9,937,571 $12,000,000 $10,000,000 $8,000,000 $6,000,000 $4,000,000 $2,000,000 $0 ti ra _- Sales Tax Comparison (including SST mitigation) Revised Budget v7' 1 71 c 2 Pd To Date ti N 4) (21 Revised Budget Actual Pd To Date Jan-11 $4,494 $4,901 Feb-11 $22,017 $22,249 Mar-11 $85,219 $93,790 Apr-11 $806,388 $720,604 May-11 $1,508,252 $1,507,174 Jun-11 $1,527,164 $1,516,847 Jul-11 $1,530,672 $1,519,520 Aug-11 $1,538,170 $1,521,240 Sep-11 $1,585,761 $1,547,511 Oct-11 $2,497,458 $2,194,970 Nov-11 $2,904,132 $2,909,523 Dec-11 $2,916,691 $2,914,121 Jan-12 $2,921,279 $2,915,525 Feb-12 $2,939,166 $2,934,405 Mar-12 $3,003,681 $3,001,687 Apr-12 $3,739,839 $3,818,149 May-12 $4,456,289 $4,402,623 Jun-12 $4,475,595 $4,456,089 Jul-12 $4,479,175 $4,451,494 Aug-12 $4,486,829 $4,456,689 Sep-12 $4,535,409 $4,544,567 Oct-12 $5,466,053 $5,347,326 Nov-12 $5,881,180 $5,851,430 Dec-12 $5,894,000 $5,838,706 $7,000,000 $6,000,000 $5,000,000 $4,000,000 $3,000,000 $2,000,000 $1,000,000 $0 Property Tax Comparison wzo" Revised Budget A--- Actual Pd To Date ti LL a co a 2 ci ti, ci 0 0) N N a) u_ N N O- D 0) < V) N N 0 Ṉ 1 a)
6


7 City of Woodinville, Washington Schedule No. 1: Monthly Comparison Graphs - continued Revised Budget Actual Pd To Date Jan-11 $87,683 $89,371 Feb-11 $196,028 $176,309 Mar-11 $292,821 $285,545 Apr-11 $385,277 $356,906 May-11 $477,129 $438,435 Jun-11 $554,797 $515,992 Jul-11 $627,316 $597,146 Aug-11 $705,503 $670,648 Sep-11 $776,290 $743,239 Oct-11 $850,972 $822,098 Nov-11 $931,024 $894,881 Dec-11 $1,009,123 $978,329 Jan-12 $1,096,110 $1,073,577 Feb-12 $1,183,142 $1,163,035 Mar-12 $1,267,798 $1,253,986 Apr-12 $1,352,119 $1,341,226 May-12 $1,446,787 $1,450,922 Jun-12 $1,534,712 $1,498,750 Jul-12 $1,584,716 $1,603,193 Aug-12 $1,689,745 $1,665,656 Sep-12 $1,751,582 $1,722,229 Oct-12 $1,817,472 $1,807,917 Nov-12 $1,860,501 $1,870,798 Dec-12 $1,957,380 $1,976,434 $2,500,000 $2,000,000 $1,500,000 $1,000,000 $500,000 $0 WA Revised Budget c-i c-i LL A Actual Pd To Date Utility Tax Comparison Actual rio a) vl ci (Cf.) Ct.) 10 (NI C co 'Ni U- N r-j N Cs] O 0_ as 2 < 2 cni (N rsi - 1 6_ 3 : 0 Revised Budget Actual Pd To Date Jan-11 $10,537 $7,980 Feb-11 $12,792 $11,385 Mar-11 $24,439 $114,194 Apr-11 $32,716 $125,678 May-11 $38,078 $132,649 Jun-11 $48,866 $151,605 Jul-11 $69,577 $165,946 Aug-11 $85,260 $190,020 Sep-11 $109,640 $200,903 Oct-11 $120,587 $211,772 Nov-11 $141,385 $223,291 Dec-11 $158,246 $232,506 Jan-12 $179,812 $251,959 Feb-12 $189,701 $258,505 Mar-12 $203,317 $276,893 Apr-12 $227,121 $283,211 May-12 $243,093 $295,264 Jun-12 $265,949 $309,115 Jul-12 $285,915 $462,047 Aug-12 $292,773 $478,212 Sep-12 $304,248 $498,803 Oct-12 $319,970 $656,589 Nov-12 $331,487 $681,570 Dec-12 $350,000 $694,636 $800,000 $700,000 $600,000 $500,000 $400,000 $300,000 $200,000 $100,000 $0 ci Real Estate Excise Tax Comparison (each 1/4%) Fizzi Revised Budget ci ci a) 2012 Actual Pd To Date 4 Actual ro ci C.) r I r si csi r I chi " ti lu 0-, " 0_ ro 0 0_ ro 5 2 Ln 0 z 0 LL 2 < 2 0
8


9 City of Woodinville, Washington Schedule No. 1: Monthly Comparison Graphs - continued Revised Budget Actual Pd To Date Jan-11 $2,542 $741 Feb-11 $5,084 $1,588 Mar-11 $7,626 $14,320 Apr-11 $10,168 $18,624 $450,000 May-11 $12,710 $18,624 $400,000 Jun-11 $15,252 $20,339 Jul-11 $17,794 $28,191 $350,000 Aug-11 $20,336 $31,288 $300,000 Sep-11 $22,878 $31,288 Oct-11 $25,420 $31,228 Nov-11 $27,962 $31,288 $250,000 $200,000 Dec-11 $30,504 $31,288 $150,000 Jan-12 $32,087 $31,803 Feb-12 $33,670 $34,288 Mar-12 $35,253 $36,283 $100,000 $50,000 Apr-12 $36,836 $41,032 $0 May-12 $38,419 $41,032 Jun-12 $40,002 $46,487 Jul-12 $41,585 $46,487 Aug-12 $43,168 $46,838 Sep-12 $44,751 $46,838 Oct-12 $46,334 $46,838 Nov-12 $47,917 $46,838 Dec-12 $49,500 $46,838 Traffic Impact Fees Comparison %-1 ti s-1 c-i IN CV CV IN (N CV NI CV N (N a-i a-i 1-1 ri 1-1 _6 07/4 Revised Budget A- Actual Pd To Date Actual c 0_ ts.,y, 0 a) ro cll CO a.,.13 D. a, n 0 0 Z Q@ Z Jan-11 Feb-11 Mar-11 Revised Budget $0 $0 $0 Actual Pd To Date Apr-11 $3,000 $0 $100,000 - $0 $0 $0 Park Impact Fees Comparison May-11 $3,000 $0 $90,000 -L- /WA' Revised Budget Jun-11 $3,000 $0 $80,000 Jul-11 $3,000 $0 $70,000 -A- Actual Pd To Date Aug-11 $6,000 $3,175 Sep-11 $6,000 $3,175 $60,000 Oct-11 $6,000 $3,175 $50,000 Nov-11 $6,000 $3,175 $40,000 Dec-11 $6,000 $3,175 Jan-12 $6,000 $3,175 $30,000 Feb-12 $9,000 $3,175 $20,000 Mar-12 $9,000 $6,350 $10,000 Apr-12 $9,000 $6,350 May-12 $12,000 $6,350 $0 r-1 r-i a-i I-I c-i T-I a-i IN CV r-i c-i ' ter (V 71 IN 71 CN c-i CV IN CV CV,-I IN N CN C 6 c ra a' co 0 a) co Jun-12 $15,000 $9,475 LL 2 a 2 - < Z 0 LL 2 LL 2-2, < a Jul-12 $15,000 $9,475 Aug-12 $18,000 $9,475 Sep-12 $21,000 $9,475 Oct-12 $22,000 $9,475 Nov-12 $22,000 $9,475 Dec-12 $22,000 $9,475 9 z
10


11 City of Woodinville, Washington Schedule No. 1: Monthly Comparison Graphs - continued Jan-11 $34,000 $34,411 Feb-11 $68,000 $63,550 Mar-11 $78,000 $132,563 Apr-11 $108,000 $178,988 May-11 $138,000 $237,991 Jun-11 $168,000 $269,474 Jul-11 $198,000 $296,548 Aug-11 $212,254 $358,783 Sep-11 $264,508 $405,411 Oct-11 $326,762 $452,649 Nov-11 $369,016 $491,206 Dec-11 $416,900 $522,824 Jan-12 $446,900 $566,746 Feb-12 $476,900 $623,161 Mar-12 $506,900 $689,825 Apr-12 $536,900 $761,240 May-12 $566,900 $818,534 Jun-12 $596,900 $906,270 Jul-12 $626,900 $938,016 Aug-12 $656,900 $1,059,161 Sep-12 $686,900 $1,090,915 Oct-12 $716,900 $1,144,457 Nov-12 $746,900 $1,211,791 Dec-12 $778,323 $1,293,814 $2,000,000 $1,800,000 $1,600,000 $1,400,000 $1,200,000 $1,000,000 $800,000 $600,000 $400,000 $200,000 Development Services Permits, Licenses and Fees Comparison $0 Wifi Revised Budget A- Actual Pd To Date -a- Actual / c-i c-i N--1 NI NI NI NI (-4 (-A r-4 c-i a-1 T-1 - en 6_ 4-, - < V) 0 ') 0 ra u_ 5 < m, -Y UP Z Revised Budget Actual Pd To Date Jan-11 $5,486 $3,218 Feb-11 $10,972 $3,882 Mar-11 $24,286 $14,044 Apr-11 $37,601 $22,791 May-11 $50,916 $33,812 Jun-11 $67,328 $44,535 Jul-11 $77,018 $57,493 Aug-11 $82,718 $118,967 Sep-11 $95,806 $126,832 Oct-11 $108,893 $131,515 Nov-11 $119,936 $133,920 Dec-11 $130,000 $137,297 Jan-12 $135,696 $138,004 Feb-12 $141,393 $183,083 Mar-12 $155,220 $187,104 Apr-12 $169,047 $187,169 May-12 $182,873 $191,686 Jun-12 $199,917 $194,034 Jul-12 $209,979 $195,406 Aug-12 $215,898 $244,134 Sep-12 $229,489 $255,514 Oct-12 $243,080 $277,423 Nov-12 $254,548 $279,227 Dec-12 $265,000 $280,063 $450,000 $400,000 $350,000 $300,000 $250,000 $200,000 $150,000 $100,000 $50,000 $0 Parks and Recreation Fees Comparison Wit Revised Budget A Actual Pd To Date -a- Actual
12


13 City of Woodinville, Washington Schedule No. 1: Monthly Comparison Graphs continued Revised Budget Revised Budget Actual Pd To Date Jan-11 $502,183 $522,192 Feb-11 $1,141,859 $1,096,333 Mar-11 $1,748,440 $1,770,344 Apr-11 $2,911,242 $2,894,346 May-11 $4,134,315 $4,213,713 Jun-11 $4,746,326 $4,921,650 Jul-11 $5,261,999 $5,487,990 Aug-11 $5,991,849 $6,109,966 Sep-11 $6,603,930 $6,844,964 Oct-11 $7,706,259 $7,997,391 Nov-11 $9,029,462 $9,214,874 Dec-11 $9,908,662 $9,877,596 Jan-12 $10,364,957 $10,387,912 Feb-12 $10,916,097 $11,031,178 Mar-12 $11,449,357 $11,651,237 Apr-12 $12,447,560 $12,972,794 May-12 $13,820,233 $14,028,116 * Jun-12 $14,560,233 $14,779,625 Jul-12 $15,188,060 $15,291,279 Aug-12 $15,769,587 $15,921,231 Sep-12 $16,428,347 $16,768,648 Oct-12 $17,504,206 $18,144,573 Nov-12 $18,722,503 $19,208,009 Actual Pd To Date Jan-11 $505,020 $492,842 Feb-11 $1,053,424 $811,994 Mar-11 $1,634,158 $1,333,027 Apr-11 $2,197,343 $1,720,774 May-11 $2,736,080 $2,140,417 Jun-11 $4,235,918 $3,551,249 Jul-11 $4,962,314 $4,225,290 Aug-11 $5,740,133 $4,905,364 Sep-11 $6,458,774 $5,463,072 Oct-11 $7,106,127 $6,046,716 Nov-11 $7,750,367 $6,682,952 Dec-11 $8,524,268 $7,479,837 Jan-12 $9,280,918 $8,032,511 Feb-12 $9,832,873 $8,426,562 Mar-12 $10,292,943 $8,868,781 Apr-12 $10,801,486 $9,350,295 May-12 $11,325,386 $9,780,255 Jun-12 $12,959,295 $11,169,586 Jul-12 $13,645,374 $11,649,268 Aug-12 $14,127,654 $12,511,940 Sep-12 $14,599,651 $13,150,473 Oct-12 $15,881,603 $13,919,646 Nov-12 $16,352,272 $14,558,820 Dec-12 $17,267,529 $15,560, General Fund, Streets, Parks & Rec, Development Svcs Equipment Repl., Unemployment, Affordable Housing Revenue Comparison $25,000,000 $20,000,000 $15,000,000 $10,000,000 $5,000,000 $0 $20,000,000 $18,000,000 $16,000,000 $14,000,000 $12,000,000 $10,000,000 ti,-1 CO CO "?7,07, Revised Budget Actual Pd To Date Dec-12 $19,330,063 $19,841,233 * Monthly budgeted revenue was adjusted There is no change to the total budgeted revenue. C ti General Fund, Streets, Parks & Rec, Development Svcs, Equipment Repl., Unemployment, Affordable Housing Expenditure Compariso n Budgeted, Amended and Actual $8,000,000 $6,000,000 $4,000,000 $2,000,000 $0 %o / Kevised uuaget A- Actual Pd To Date ci ti _o LL N co co Ṉ 1 a) u_ N ti LL N O N c-i 0 N r3
14


15 City of Woodinville, Washington Schedule No. 1: Monthly Comparison Graphs continued Revised Operating Revenue Revised Operating Exp Jan-11 $522,192 $492,842 Feb-11 $1,096,333 $811,994 Mar-11 $1,770,344 $1,333,027 Apr-11 $2,894,346 $1,720,774 May-11 $4,213,713 $2,140,417 Jun-11 $4,921,650 $3,551,158 Jul-11 $5,487,990 $4,225,199 Aug-11 $6,109,966 $4,905,273 Sep-11 $6,844,964 $5,463,072 Oct-11 $7,997,391 $6,046,716 Nov-11 $9,214,874 $6,682,952 Dec-11 $9,877,596 $7,479,837 Jan-12 $10,387,912 $8,032,511 Feb-12 $11,031,178 $8,426,562 Mar-12 $11,651,237 $8,868,781 Apr-12 $12,972,794 $9,350,295 May-12 $14,028,116 $9,780,255 Jun-12 $14,779,625 $11,169,586 Jul-12 $15,291,279 $11,649,268 Aug-12 $15,921,231 $12,511,940 Sep-12 $16,768,648 $13,150,473 Oct-12 $18,144,573 $13,919,646 Nov-12 $19,208,009 $14,558,820 Dec-12 $19,841,233 $15,560, General Fund, Streets, Parks & Rec, Development Svcs, Equipment Repl., Unemployment, Affordable Housing Revenue vs Expenditures $25,000,000 $20,000,000 $15,000,000 $10,000,000 $5,000,000 M Revised Operating Revenue A Revised Operating Exp r-i c-i s I r1 a I c taa u_ a) 2 < u- 2 ra cy, IS
16


17 City of Woodinville, Washington Schedule No. 2: Revised Biennial Budget vs. Expenditures by Department Legislative I 2009/2010 Budget 2009/2010 Actual Ex s - nditures 2011/2012 Budget YTD 2011/2012 Actual Expenditures $129,145 $149,954 $121,567 Legal 1 $557,000 $688,500 $744,581 Executive I $1,495,561 $1,298,167 $2,112,303 $1,846,800 Administrative $1,715,146 $1,508,452 $1,782,290 $1,721,042 Law Enforcement $5,544,500 $5,336,295 $6,067,642 $5,266,716 Public Services $1,792,921 $1,372,213 $1,336,445 Non-Departmental $850,097 $825,148 $0 $0 Street $1,517,731 $1,511,210 $1,700,048 $1,541,462 Development Services $2,762,204 $2,730,948 $2,334,254 $2,120,641 Parks & Rec $2,340,280 $1,917,839 $755,409 $637,130 $7,000,000 $6,000,000 $5,000,000 $4,000,000 $3,000,000 $2,000,000 $1,000,000 e0 e, \ e, e,,c,c.. e,`' a \ e,%,c, ;.. Owe, c,..). -..',, e,. eta -:.-',.... s c e,cc,c ' c' <<". 'Sv*.cNv cc, \'...,. c a...,...). -)...z. _.,.-., q,. hoc'.cs..., ' e.,...e, (...e",,k..c., c...,,, O - OC.. e Oe' If' 2009/2010 Budget 2009/2010 Actual Expenditures 2011/2012 Budget YTD 2011/2012 Actual Expenditures f 7
18
 Revised 2011-2012 % of % REVENUE SOURCES Budget Thru Dec 2012 Budget Variance Operations Property Tax $5,894,000 $5,838,706 99% -1% Sales Tax $8,800,000 $8,893,898")

19 City of Woodinville, Washington Schedule No. 3: City of Woodinville Monthly Revenue/Expenditure Financial Report (General Fund, Streets, Parks & 'Zee, Development Svcs., Unemployment, Affordable Housing) Revised % of % REVENUE SOURCES Budget Thru Dec 2012 Budget Variance Operations Property Tax $5,894,000 $5,838,706 99% -1% Sales Tax $8,800,000 $8,893, % 1% SST Mitigation $1,026,000 $1,043, % 2% Other Taxes $560,000 $560, % 0% Cable TV/PEG Fees/Licens es $379,391 $384, % 1% Grants/Intergov $437,000 $471, % 8% Other Chgs for Svcs $325,269 $301,733 93% -7% Miscellaneous $251,080 $269, % 7% Subtotal General Fund $17,672,740 $17,764, % 1% Gas Tax $428,000 $454, % 6% Development Services $778,323 $1,293, % 66% Parks & Recreation $265,000 $280, % 6% Admission Tax $380,000 $401, % 6% Subtotal Other Op Funds $1,851,323 $2,430, % 31% Total Revenue Operations $19,524,063 $20,194, % 3% Debt Service $1,064,076 $1,064, % EXPENDITURES Revised % of % Operations Budget Thru Dec 2012 udget Variance General Fund $12,172,902 $11,037,705 91% -9% Street Fund $1,700,048 $1,541,694 91% -9% Development Services $2,334,254 $2,120,641 91% -9% Parks & Recreation $755,409 $637,130 84% -16% Unemployment $186,000 $84,067 45% -55% Equipment Replacement $140,100 $139, % 0% Affordable Housing $0 $0 r r Total Expenditure Operations $17,288,713 $15,560,815 90% -10% Excluded: Debt Svc, Hotel/Motel, Surface Water, Reserve Funds, CIP Funds ry
20


21 City of Woodinville, Washington Schedule No. 4: Cash and Investment Activity 2012 December 2012 November 2012 October Beginning Cash & Investments $28,430,121 $28,346,014 $27,311,780 Receipts Deposits 216, , ,712 King County - ACH 29, ,112 1,368,675 State of Washington Wire 552, , ,953 State Investment Interest Revenue 4,939 3,576 3,645 Total Receipts 804,675 1,440,818 2,048,984 Total Available $29,234,796 $29,786,832 $29,360,764 Disbursements Claims 866,180 1,065, ,442 Payroll 302, , ,308 Total Disbursements 1,168,828 1,356,712 1,014,750 Ending Cash & Investments $28,065,968 $28, $28,346,014 Schedule No. 4: Schedule of Cash & Investments at Month End December November October Cash Bank Accounts (1) 2,778,798 3,700,803 4,077,182 State Investment Pool (2) 25,287,170 24,729,318 24,268,832 Total Cash and Investment Holdings $28,065,968 $28,430,121 $28,346,014 (I) Cash Balances reflect General Ledger Book Balances and not actual bank cash balances. (2) As of December 31, 2012, the State Investment Pool provided net earnings rate of 0.24%; Treasury Information source: http: // ces/domestic-finance/debt-management/interest-rate/yi eld_h istorical. shtm I Interest Rate Comparison 4.50% 4.00% 3.50% 3.00% 2.50% 2.00% 1.50% 1.00% 0.50% 0.00% I I I I "7- -F4 71 -Tr r.- S) NC) `,C) N.11 NC) N9 <1' NI' 'CI' N1' titi ec <z<,),o so" c' <4; C `0' <.(` C 0 << '?' >` y- 0 0 <<'2' >s)' 0 O'z' >`> 0 cf' LGIP Net Earnings Rate Year T-Bill is 3 Month T- Bill
22


23 City of Woodinville, Washington Schedule No. 5: City of Woodinville Monthly Revenue/Expenditure Report % of CIP RELATED REVENUE SOURCES Revised Budget Thru Dec 100% Budget Admission Tax $380,000 $401, % Real Estate Excise Tax I & II $700,000 $1,389, % Utility Tax $1,957,380 $1,976, % Parks Levy $62,000 $60,188 97% Park Impact Fees $22,000 $9,475 43% Traffic Impact Fees $49,500 $46,817 95% Grant $3,303,000 $317,161 10% Total Capital Projects Revenues $6,473,880 $4,201,047 65% % of CIP RELATED EXPENDITURES Revised Budget Thru Dec 100% Budget Street & Sidewalk Projects Overlay $1,446,000 $1,515, % Rock Wall I and II $100,000 $69,309 69% Sammamish Bridge Replacement $7,159,000 $696,208 10% Wood Duvall $600,000 $474,811 79% 202/148th Roundabouts $240,000 $238,722 99% SR522/ 195th $1,015,000 $879,364 87% NE 145th Pedestrian Improvements $330,000 $296,783 90% BNRP $165,716 $165, % School Safety Zones $600,000 $436,722 73% Total Street & Sidewalk Projects $11,655,716 $4,773,114 41% Parks Projects Sportfields $0 $176,986 Green Brier $62,000 $12,451 20% Eastside Rails Corridor Study $150,000 $0 0% Park Improvements - Tree Planting $187,000 $5,735 3% Total Parks Projects $399,000 $195,171 49% Surface Water Projects Chateau Reach Erosion/Sediment Control $261,000 $223,520 86% 140th/175th Street Storm Drain $205,000 $169,822 83% Sammamish River Outfall Water Quality Imp $405,000 $276,247 68% Misc Drainage Improvements $161,000 $18,426 11% Total Surface Water Projects $1,032,000 $688,014 67% Facility Projects Public Works Maintenance Shop $200,000 $106,228 53% Old Woodinville Schoolhouse RFP $100,000 $57,458 57% Emergency Generator $200,000 $0 0% Total Facility Projects $500,000 $163,686 33% TOTAL CIP Expenses $13,586,716 $5,819,986 43% -23


24 City of Woodinville 2011/2012 Biennial Budget Period End Review Presented to Council on 2/5/2013
25 Revenues

26 Sales Tax Revenue (including SST mitigation) $9,938,000


27 Five Largest Sales Tax Providers by NAICS
28 2012 Top 12 Sales Taxes Providers Providers (listed alphabetically) Craft Brew Alliance (Redhook) Haggen (Top Foods) McLendon s Molbaks PetSmart Ride Motorsports Ross Dress For Less Seattle SMSA (Verizon Wireless) Ste. Michelle Target TJX Companies (TJ Maxx) Willows Lodge
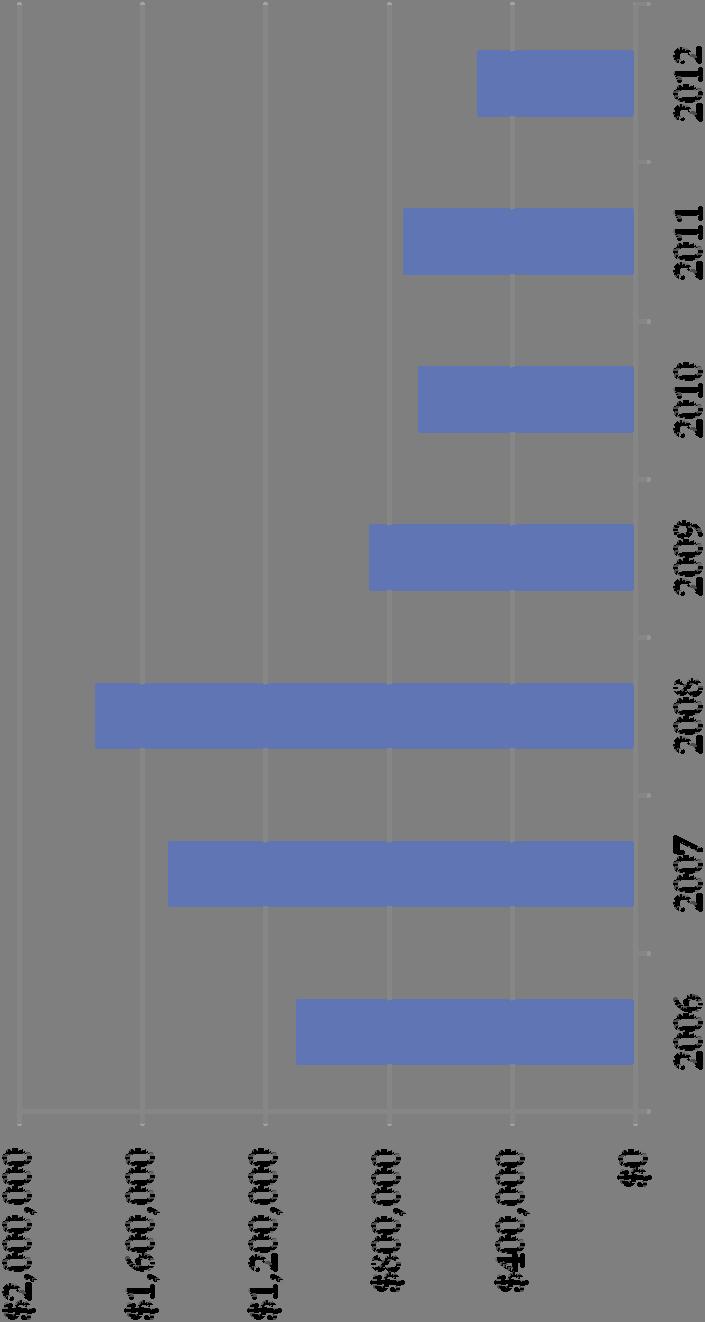
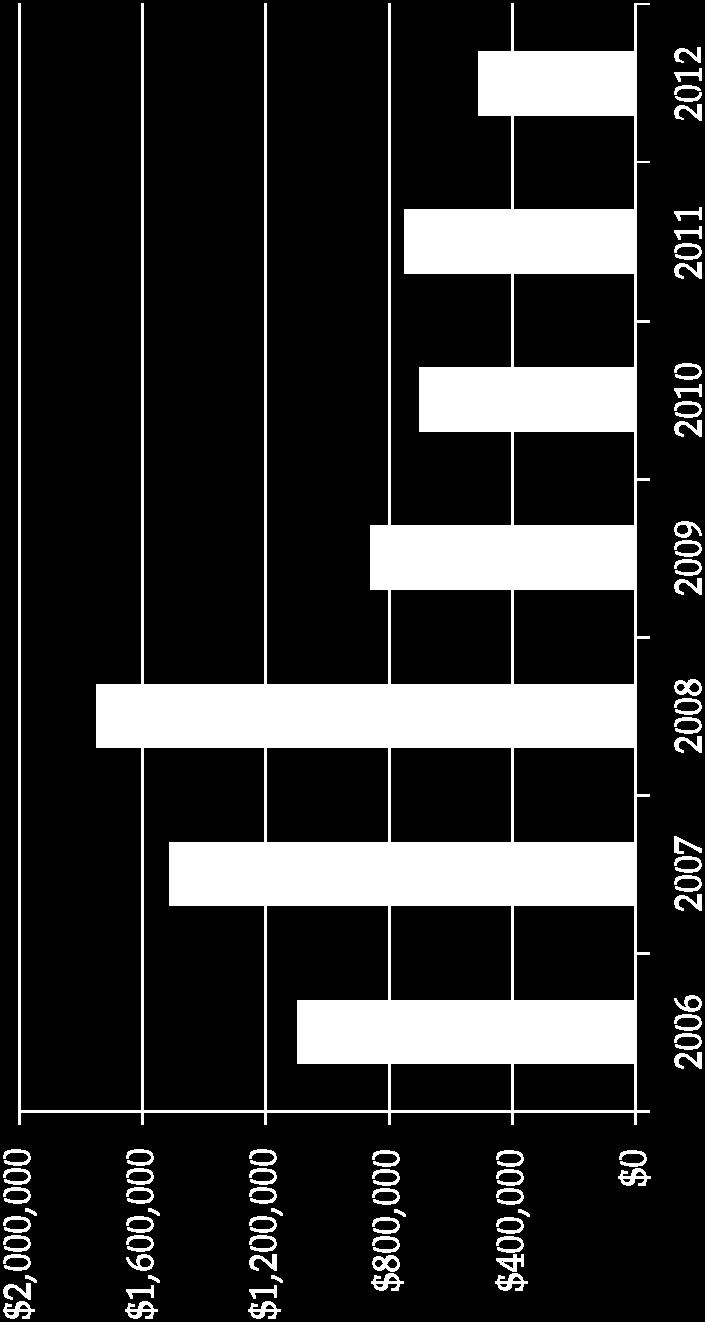
29 Construction Seven Year Comparison
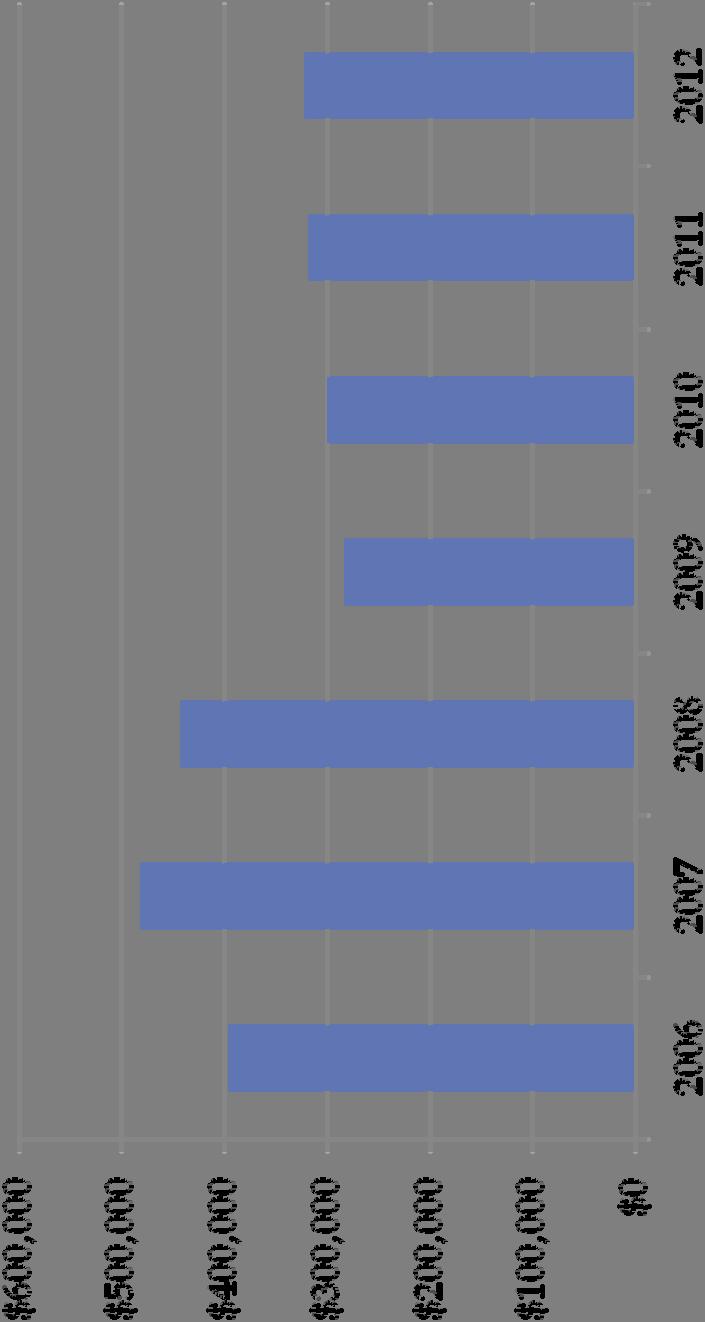
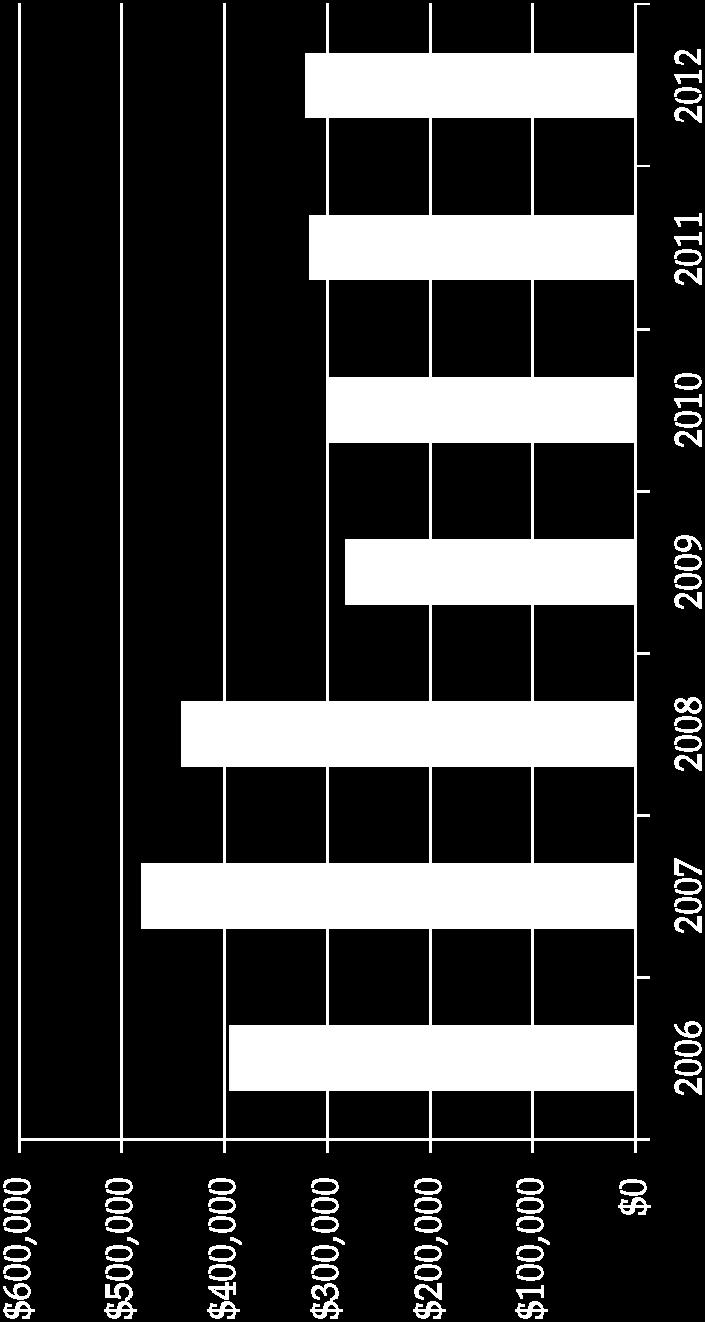
30 Manufacturing Seven Year Comparison


31 Wholesale Trade Seven Year Comparison


32 Retail Trade Seven Year Comparison

33 Accommodation & Food Service Seven Year Comparison

34 Property Tax Revenue


35 Utility Tax Revenue


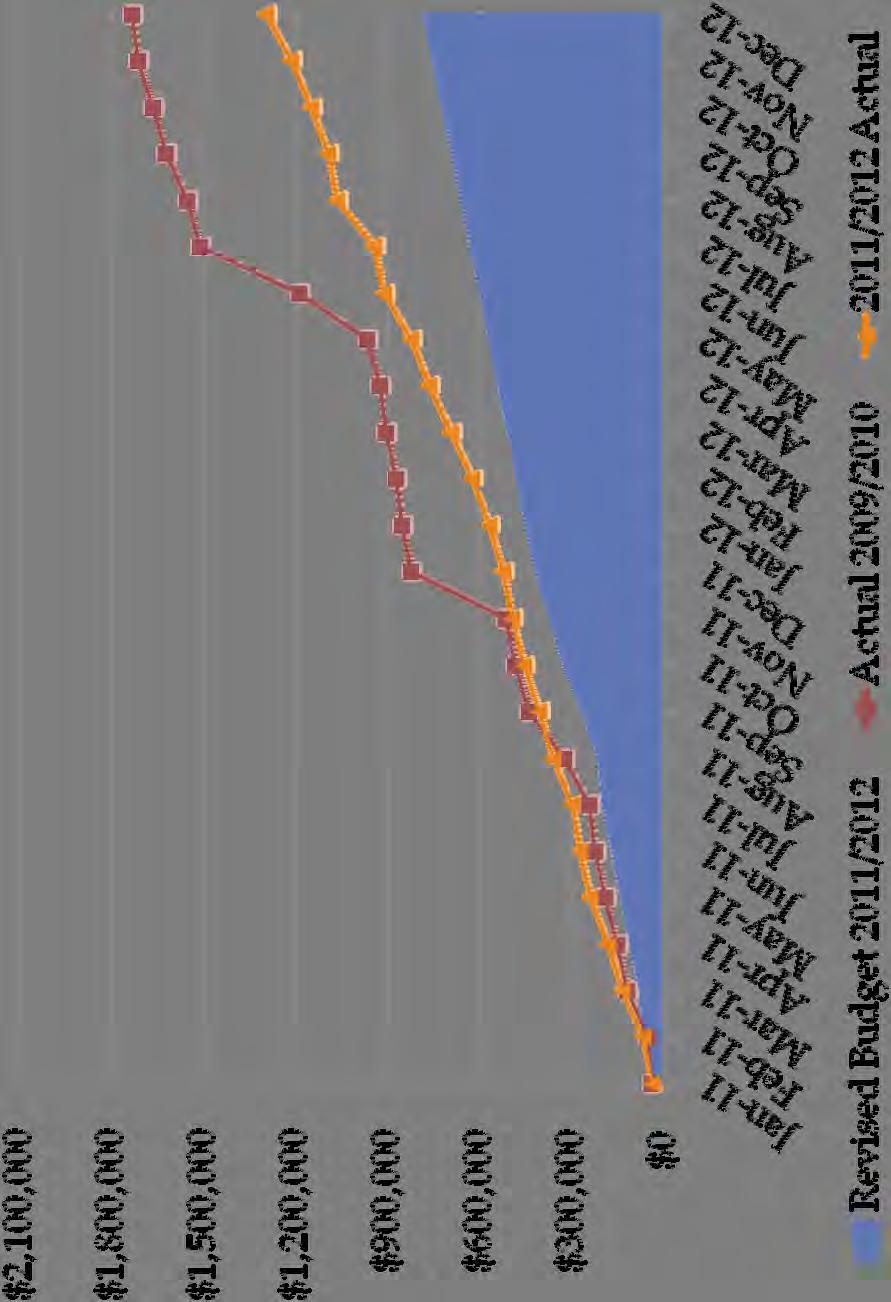
36 Real Estate Excise Tax Revenue
37 What Happened? Real Estate Excise Tax Revenue Unanticipated revenues: March 2011 Sale of Archstone Waterford Place Apartments July 2012 Sale of Sale of 3 industrial properties on Woodinville/Redmond Rd. and 2 on NE Woodinville Dr. October 2012 sale of Archstone Waterford Place Apartments Net result REET I and REET II each received $344,000 more revenue than forecasted.

38 Development Services Fees Revenue $1,294,000


39 Parks & Recreation Fees

40 Operating Revenue General, Street, Dev. Ser., Park & Rec,, Equipment Replacement, and Unemployment Funds (excluding transfers) $19,841,000
41 Expenditures


42 Biennial Expenditures (Millions of Dollars excluding transfers)


43 CIP Expenditures (excluding transfers)
44 Department Exp. Budget vs. Actual


45 Operating Expenditures General, Street, Dev. Ser., Park & Rec,, Equipment Replacement, and Unemployment Funds (excluding transfers) $15,561,000


46 Operating Revenues vs. Expenditures General, Street, Dev. Ser., Park & Rec,, Equipment Replacement, and Unemployment Funds (excluding transfers)
47 Questions?
REPORT TO THE CITY COUNCIL rd Avenue NE, Woodinville, WA
 CITY OF WOODINVILLE, WA REPORT TO THE CITY COUNCIL 1731 133rd Avenue NE, Woodinville, WA 9872 WWW.CI.WOODINVILLE.WA.US To: Honorable City Council Date: January 1, 212 From: Richard A. Leahy, City Manager
REPORT TO THE CITY COUNCIL rd Avenue NE, Woodinville, WA
 To: From: By: Subject: CITY OF WOODINVILLE, WA REPORT TO THE CITY COUNCIL 17301 133rd Avenue NE, Woodinville, WA 98072 WWW.CI.WOODINVILLE.WA.US Honorable City Council Richard A. Leahy, City Mana Jim Katica,
This is a placeholder for agenda item No. 9: Receive and File Treasurer Report for June 2012 as determined by the Council's meeting on 8/07/2012.
 CITY OF WOODINVILLE, WA REPORT TO THE CITY COUNCIL 17301 133rd Avenue NE, Woodinville, WA 98072 WWW.CLWOODINVILLE.WA.US To: Honorable City Council Date: 08/14/2012 From: Jennifer Kuhn, City Clerk Subject:
REPORT TO THE CITY COUNCIL rd Avenue NE, Woodinville, WA I I
 CITY OF WOODINVILLE, WA REPORT TO THE CITY COUNCIL 17301 133 rd Avenue NE, Woodinville, WA 98072 WWW.CI.WOODINVILLE.WA.US To: Honorable City Council p,~ 6 Date: October 6, 2009 From: By: Subject: Richard
Honorable City Council Date: 07/05/2016 Blaine Fritts, Finance Director; Dana Mason, Senior Accountant 2015/2016 Biennial Treasurv Report
 l To: By: s u b" >Jee t : CITY OF WOODINVILLE, WA REPORT TO THE CITY COUNCIL 17301 133rd Avenue NE, Woodinville, WA 98072 WWW.CI.WOODINVILLE.WA.US Honorable City Council Date: 07/05/2016 Blaine Fritts,
FINANCIAL ACTION SUMMARY
 City of Woodinville, WA Report to the City Council 17301 133 rd Avenue NE, Woodinville, WA 98072 www.ci.woodinville.wa.us To: Honorable City Council Date: 02/06/2018 By: Blaine Fritts, Finance Director;
Jennifer Kuhn, City Clerk PLACEHOLDER: Six year Financial Planning Model and Budget Issues
 CITY OF WOODINVILLE, WA REPORT TO THE CITY COUNCIL 17301 133rd Avenue NE, Woodinville, WA 98072 WVVW.CI.WOODINVILLE.WA.US To: Honorable City Council Date: 08/14/2012 From: Subject: Jennifer Kuhn, City
To: Honorable City Council D_ A f Date: Nov. 9, 2010
 ATTACHMENT 2 CITY OF WOODINVILLE, WA REPORT TO THE CITY COUNCIL 17301 133 rd Avenue NE, Woodinville, WA 98072 WWW.CI.WOODINVILLE.WA.US To: Honorable City Council D_ A f Date: Nov. 9, 2010 From: Richard
City of Milton 4th Qtr Financial Report
 1 TO: CC: FROM: Debra Perry, Mayor Milton City Council City Administrator Department Directors Lisa Tylor, Finance Director DATE: March 17, 2014 SUBJECT: - Fourth Quarter/Year-End Financial Status Report
City of Joliet 2014 Revenue Review. October 2013
 City of Joliet 2014 Revenue Review October 2013 General Fund 2014 Est. Revenues = $163.6 M Licenses, Permits, Fees Gaming Taxes 5% 12% Sales Taxes 27% Income Taxes 9% Charges for Services 14% Other Taxes
REPORT TO THE CITY COUNCIL rd Avenue NE, Woodinville, WA
 To: Honorable City Council From: Richard A. Leahy, City Manager CITY OF WOODINVILLE, WA REPORT TO THE CITY COUNCIL 17301 133rd Avenue NE, Woodinville, WA 98072 WWW.CI.WOODINVILLE.WA.US By: Alexandra Sheeks,
REPORT TO THE CITY COUNCIL rd Avenue NE, Woodinville, WA VVWW.CLWOODINVILLE.WA.US
 CITY OF WOODINVILLE, WA REPORT TO THE CITY COUNCIL 17301 133rd Avenue NE, Woodinville, WA 98072 VVWW.CLWOODINVILLE.WA.US To: Honorable City Council From: Richard A. Leahy, City Manager Subject: Status
~ FINANCIAL ACTION SUMMARY / Expenditure Required Amount Budgeted/Approved (Over)/Under Approved Amount
/Under Approved Amount") CITYOFWOODINVILLE, WA REPORT TO THE CITY COUNCIL 17301 133rct Avenue NE, Woodinville, WA 98072 WWW.Cl.WOODINVILLE.WA.US To: Honorable City Council Date: April 5, 2016 By Thomas E Hansen P E., Public Works
CITYOFWOODINVILLE, WA REPORT TO THE CITY COUNCIL 17301 133rct Avenue NE, Woodinville, WA 98072 WWW.Cl.WOODINVILLE.WA.US To: Honorable City Council Date: April 5, 2016 By Thomas E Hansen P E., Public Works
CITY OF WOODINVILLE, WA REPORT TO THE CITY COUNCIL rd Avenue NE, Woodinville, WA
 To: Honorable City Council From: Richard A. Leahy, City Manager CITY OF WOODINVILLE, WA REPORT TO THE CITY COUNCIL 1731 133rd Avenue NE, Woodinville, WA 9872 WWW.CI.WOODINVILLE.WA.US By: Alexandra Sheeks,
2016 General Fund Actual Revenues, Expenses & Fund Balance
 Month 2016 YTD Revenues 2016 YTD Expenses Fund Balance Jan 741,592 522,981 8,146,240 Feb 1,437,152 1,759,804 7,604,976 March 2,223,544 2,142,743 8,008,429 Apr 3,383,880 3,471,582 7,839,926 May 5,183,323
$180 $160 $140 $120 $100 $80 $60 $40 $20 $ Single Fam -New Apts -New
 2012 REVENUE FORECAST Presented by Brian Henshaw September 26, 2011 1 Economic Conditions Housing starts Federal & State deficits Sovereign-debt crisis Bankruptcies Unemployment Stock Market volatility
2013 Report on Parks and Recreation Operations
 To: From: By: Subject: CITY OF WOODINVILLE, WA REPORT TO THE CITY COUNCIL 17301 133rd Avenue NE, Woodinville, WA 98072 WWW.CI.WOODINYILLE.WA.US Honorable City Council Richard A. Leahy, City Manager V Alexandra
ISSUE: Shall the City Council receive a status report about annexation efforts?
 CITY OF WOODINVILLE, WA REPORT TO THE CITY COUNCIL 17301 133rd Avenue NE, Woodinville, WA 98072 WWW.CI.WOODINVILLE.WA.US To: Honorable City Council From: Richard A. Leahy, City ManagerPKV By: Alexandra
2013/2014 Biennial Budget 2 nd Quarter 2014 Financial Report and Mid-Year Budget Adjustment. Presented by City Council Study Session July 29, 2014
 2013/2014 Biennial Budget 2 nd Quarter 2014 Financial Report and Mid-Year Budget Adjustment Presented by City Council Study Session July 29, 2014 1 2 nd Quarter 2014 Financial Presentation General Fund
TO: Mayor & Council Budget Advisory Committee FROM: Lyman Howard Dean Rohla DATE: February 12, 2019 SUBJ: ACTUAL 2018 YEAR END FINANCIAL INFORMATION
 9605 NE 24 th Street Clyde Hill, Washington 98004 425-453-7800 Fax: 425-462-1936 www.clydehill.org TO: Mayor & Council Budget Advisory Committee FROM: Lyman Howard Dean Rohla DATE: February 12, 2019 SUBJ:
Spheria Australian Smaller Companies Fund
 29-Jun-18 $ 2.7686 $ 2.7603 $ 2.7520 28-Jun-18 $ 2.7764 $ 2.7681 $ 2.7598 27-Jun-18 $ 2.7804 $ 2.7721 $ 2.7638 26-Jun-18 $ 2.7857 $ 2.7774 $ 2.7690 25-Jun-18 $ 2.7931 $ 2.7848 $ 2.7764 22-Jun-18 $ 2.7771
By: To: FINANCIAL ACTION SUMMARY Expenditure Required Amount Budgeted/Aooroved Additional Amount Required $0 $0 $0
 To: By: CITY OF WOODINVILLE, WA REPORT TO THE CITY COUNCIL 17301 133rd Avenue NE, Woodinville, WA 98072 WWW.CI.WOODINVILLE.WA.US Honorable City Council ~ Date: 03/21/ Kellye Mazzoli, Assistant to the City
XML Publisher Balance Sheet Vision Operations (USA) Feb-02
 Feb-02") Page:1 Apr-01 May-01 Jun-01 Jul-01 ASSETS Current Assets Cash and Short Term Investments 15,862,304 51,998,607 9,198,226 Accounts Receivable - Net of Allowance 2,560,786
Page:1 Apr-01 May-01 Jun-01 Jul-01 ASSETS Current Assets Cash and Short Term Investments 15,862,304 51,998,607 9,198,226 Accounts Receivable - Net of Allowance 2,560,786
REPORT TO THE CITY COUNCIL rd Avenue NE, Woodinville, WA
 -----~---------------- To: From: By: Subject: CITY OF WOODINVILLE, WA REPORT TO THE CITY COUNCIL 17301 133rd Avenue NE, Woodinville, WA 98072 WWW.CI.WOODINVILLE.WA.US Honorable City Council e\a / Richard
City of Justin NOVEMBER
 City of Justin MONTHLY FINANCIAL REPORT NOVEMBER - 2018 1 Revenues: Sales tax revenue is up 14.5% from this time prior year and November s sales tax collections increased 2.4% from November 2017. The City
GENERAL FUND AT A GLANCE Category Budget YTD Actual % % Year Passed Resources 50.00% Uses 50.00% $0 $1,928,600
 City of Edmond Monthly Financial Report FY 2007/2008 Through the Month Ended Unaudited - Intended for Management Purposes Only The following is a summary of the City's financial results for operating funds.
Operating Budget Stability
 Operating Budget Stability March Financial Update Report to Agenda Executive Summary March Performance Against FY16 Budget March Performance Against Same Period Last Year Appendix Financial Detail: March
GENERAL FUND AT A GLANCE Category Budget YTD Actual % % Year Passed Resources 8.33% Uses 8.33% $0 $1,330,750
 City of Edmond Monthly Financial Report FY 2008/2009 Through the Month Ended Unaudited - Intended for Management Purposes Only The following is a summary of the City's financial results for operating funds.
Review of Membership Developments
 RIPE Network Coordination Centre Review of Membership Developments 7 October 2009/ GM / Lisbon http://www.ripe.net 1 Applications development RIPE Network Coordination Centre 140 120 100 80 60 2007 2008
Dulles Corridor Enterprise Financial Update Dulles Corridor Advisory Committee Meeting
 Dulles Corridor Enterprise Financial Update Dulles Corridor Advisory Committee Meeting December 15, 2014 Discussion Outline Finance Plan for the Metrorail Project Allocation of Estimated Capital Costs
Comprehensive Monthly Financial Report July 2013
 Comprehensive Monthly Financial Report July 2013 MONTHLY FINANCIAL REPORT PERFORMANCE AT A GLANCE ALL FUNDS SUMMARY GENERAL FUND REV VS EXP PROPERTY TAXES SALES TAXES FRANCHISE FEES UTILITY FUND REV VS
City Council Work Session Handouts. May 22, 2017
 City Council Work Session Handouts May 22, 2017 I. Review and Discuss Zoning File 17-11 II. III. Review and Discuss the City of Richardson Summer 2017 City Council Meeting Calendar and Budget Calendar
CURRENT FUND BALANCED BUDGET CASH PROJECTIONS
 TACOMA POWER CURRENT FUND BALANCED BUDGET CASH PROJECTIONS Estimated Cash for 2017-2018 250 200 150 100 50 Jan-18 Feb-18 Mar-18 Apr-18 May-18 Jun-18 Jul-18 Aug-18 Sep-18 Oct-18 Nov-18 Dec-18 Min 60% Min
Wells Branch Municipal Utility District. Accounting Report. July 17, 2018
 Wells Branch Municipal Utility District Accounting Report July 17, 2018 Financial Highlights: The operating fund has cash and investments of approximately $11.7 million; the debt service fund cash/investment
QUARTERLY FINANCIAL REPORT
 QUARTERLY FINANCIAL REPORT Page Key Trends...2 Executive Summary...3 Economic Indicators...4 General Fund...8 Public Safety & Justice...10 Land Use, Housing & Transportation...11 Health & Human Services...14
City of Baker City Financial Report for the General Fund Report for the Month Ending August 31, % of Year Elapsed
 Financial Report for the General Fund Fund/Department Description August YTD REVENUE General Fund Beginning Working Capital $ - $ - $ 941,012 0.0% Year-end adjustments are in process. Preliminary BWC will
City of Baker City Financial Report for the General Fund Report for the Month Ending September 30, % of Year Elapsed
 Financial Report for the General Fund Fund/Department Description September YTD REVENUE General Fund Beginning Working Capital $ - $ 1,179,959 $ 941,012 125.4% Preliminary Property Taxes - - 2,746,080
Key IRS Interest Rates After PPA
 Key IRS Rates - After PPA - thru 2011 Page 1 of 10 Key IRS Interest Rates After PPA (updated upon release of figures in IRS Notice usually by the end of the first full business week of the month) Below
Wells Branch Municipal Utility District. Accounting Report. December 19, 2017
 Wells Branch Municipal Utility District Accounting Report December 19, 2017 Financial Highlights: The operating fund has cash and investments of approximately $8.9 million; the debt service fund cash/investment
Attached for your review is the City's budget status report as of September 30, 2018.
 CITY OF MilfCreek WASHINGTON 15728 Main Street, Mill Creek/ WA 98012 Administration 425-745-1891 Police 425-745-6175 All Other Departments 425-551-7254 DATE: TO: THROUGH: FROM: SUBJECT: October 18, 2018
CAPITAL IMPROVEMENT PLAN
 20192024 CAPITAL IMPROVEMENT PLAN City of Woodinville, Washington WOODINVILLE CITY COUNCIL Mayor James Evans Deputy Mayor Elaine Cook Councilmember Al Taylor Councilmember Susan BoundySanders Councilmember
Monthly Labour Force Survey Statistics December 2018
 800 Monthly Labour Force Survey Statistics CALGARY CMA Table 282-0135 Labour force survey estimates (LFS), by census metropolitan area based on 2011 census boundaries, 3-month moving average, seasonally
Monthly Labour Force Survey Statistics November 2018
 800 Monthly Labour Force Survey Statistics CALGARY CMA Table 282-0135 Labour force survey estimates (LFS), by census metropolitan area based on 2011 census boundaries, 3-month moving average, seasonally
Balance Sheet - Consolidated August 31, 2018
 1 ASSETS Current Assets - Funds Total Operating Total KVFD Reserve Total Restricted Total Capital Reserve Total Snow Removal Reserve Total COP Reserve Fund Total Current Assets - Funds Current Assets -
Budget Status Report. Month Ending
 Budget Status Report Month Ending March 31, 2017 REVENUES - GENERAL FUND BUDGET ESTIMATE & ACTUAL RECEIPTS BUDGETED YTD ACTUAL YTD % GENERAL FUND REVENUE SOURCE REVENUE REVENUE COLLECTED BALANCE TAXES
-~----~ ~~~~~ ~ Honorable City Council Jennifer Kuhn, City Clerk Corrected Pages to the Preliminary Budget
 -~----~---- ----~~~~~ --... ~ To: From: Subject: CITY OF WOODINVILLE, WA REPORT TO THE CITY COUNCIL 17301 133rd Avenue NE, Woodinville, WA 98072 WWW.CJ.WOODJNVILLE.WA.US Honorable City Council Jennifer
CURRENT FUND BALANCED BUDGET CASH PROJECTIONS
 March 2018 Cash Projections - 1 - Tacoma Power TACOMA POWER CURRENT FUND BALANCED BUDGET CASH PROJECTIONS Estimated Cash for 2017-2018 250 200 150 AMOUNT (millions) 100 50 0 Dec-17 Jan-18 Feb-18 Mar-18
QUARTERLY FINANCIAL REPORT
 QUARTERLY FINANCIAL REPORT Page Key Trends Summary...2 Executive Summary...3 Economic Indicators...4 General Fund...8 Public Safety & Justice...10 Land Use, Housing & Transportation...11 Health & Human
Biennial Budget PUBLIC HEARING NOVEMBER 13, 2018
 2019-2020 Biennial Budget PUBLIC HEARING NOVEMBER 13, 2018 This Evening s Session: 2 2019-2020 Public Hearing on Proposed Biennial Budget Receive public testimony Review of Proposed 3% tax levy increase
CITY OF WOODINVILLE CLAIMS
 CITY OF WOODINVILLE CLAIMS "I, the undersigned, do hereby certify under penalty ofpeijury that the materials have been furnished, the services rendered or the labor performed as described herein, and shown
Sales Tax Collection Report. For The Month Ending 03/31/14. February 2014 Sales
 Sales Tax Collection Report For The Month Ending 03/31/14 February 2014 Sales Report Prepared By The Sales Tax Department 1 Sales Tax Report Table of Contents Page 3 Sales Tax Recap of Gross Receipts Collected
Quarterly Reporting Package Financial Commentary Q3 2012
 Overview All Funds Quarterly Reporting Package Financial Commentary Q3 2012 The financial report for the third quarter shows the City operated at a $5.6 million deficit. Consistent with the first half
September 2014 Monthly Financial Report PREPARED BY
 September 2014 Monthly Financial Report PREPARED BY Financial Accounting & Reporting Division City of Phoenix Monthly Financial Report September 2014 Table of Contents by Programs Page Performance Status
January 2015 Monthly Financial Report PREPARED BY
 January 2015 Monthly Financial Report PREPARED BY Financial Accounting & Reporting Division City of Phoenix Monthly Financial Report January 2015 Table of Contents by Programs Page Performance Status
Cash & Liquidity The chart below highlights CTA s cash position at March 2017 compared to March 2016.
 To: Chicago Transit Authority Board From: Jeremy Fine, Chief Financial Officer Re: Financial Results for March 2017 Date: May 10, 2017 I. Summary CTA s financial results are $0.6 million favorable to budget
Tooele County. Financial Recovery Plan 3rd Quarter 2014 Update
 Tooele County Financial Recovery Plan 3rd Quarter 2014 Update Original Projection 14,000,000 Tooele County Cash 2009-2015 12,000,000 10,000,000 8,000,000 6,000,000 4,000,000 2,000,000 - Ahead of Projection
03/10/2016 New Holly-Consolidated Page: 1 3:15 PM BALANCE SHEET 02/29/2016
 03/10/2016 New Holly-Consolidated Page: 1 3:15 PM BALANCE SHEET CURRENT PRIOR CHANGE **** ASSETS **** OPERATIONS FUND 10001 Operating Checking-Washington Trust Bank 103,331.53 98,162.64 5,168.89 10101
Dulles Corridor Enterprise Financial Update Dulles Corridor Advisory Committee Meeting
 Dulles Corridor Enterprise Financial Update Dulles Corridor Advisory Committee Meeting May 30, 2014 Discussion Outline Finance Plan for the Metrorail Project Allocation of Estimated Capital Costs and TIFIA
Wells Branch Municipal Utility District. Accounting Report. February 20, 2018
 Wells Branch Municipal Utility District Accounting Report February 20, 2018 Financial Highlights: The operating fund has cash and investments of approximately $10.7 million; the debt service fund cash/investment
Financial Report - FY 2017 Year to Date May 31, 2017
 Financial Report - FY 2017 Year to Date July 19, 2017 1 Major Highlights Revenue Sales tax remittances received through YTD April 2017 are 4.2% higher than YTD April 2016 Plaza Saltillo lease income budgeted
SCHOOL BOARD OF POLK COUNTY
 SCHOOL BOARD OF POLK COUNTY P.O. BOX 391 1915 SOUTH FLORAL AVENUE BARTOW, FLORIDA 33831 BARTOW, FLORIDA 33830 (863) 534-0500 SUNCOM 515-1321 FAX (863) 534-0705 April 14, 2015 To: School Board Members Kathryn
City of Bothell Budget Status Report For the Quarter Ending December 31, 2013
 I. BIENNIUM STATUS City of Bothell 2013-2014 Budget Status Report For the Quarter Ending December 31, 2013 On December 31, 2013, the City concluded the fourth quarter of the 2013-2014 biennium. The budget
Removed Projects TR th Way SE (Snake Hill) Improvements o Will be completed in TR th Ave SE Gap Project
 Improvements o Will be completed in TR th Ave SE Gap Project") Agenda Bill City Council Regular Meeting June 19, 2018 SUBJECT: 2019-2024 Six-Year Transportation Improvement Plan (TIP) DATE SUBMITTED: June 12, 2018 DEPARTMENT: Public Works NEEDED FROM COUNCIL: Action
Agenda Bill City Council Regular Meeting June 19, 2018 SUBJECT: 2019-2024 Six-Year Transportation Improvement Plan (TIP) DATE SUBMITTED: June 12, 2018 DEPARTMENT: Public Works NEEDED FROM COUNCIL: Action
Capital Overview. Capital projects also include purchase of infrastructure, plant, and equipment that meet the following thresholds:
 Capital Overview The capital budget consists of capital projects, which are a set of activities that maintain or improve a city asset, often referred to as infrastructure-from buildings, to park trails,
METRO INVESTMENT REPORT ALL FUNDS
 METRO INVESTMENT REPORT ALL FUNDS DECEMBER 2012 Metropolitan Transit Authority of Harris County Investment Report Portfolio Summary Management Report The following is a summary of METRO's Investment Portfolios:
Monthly Financial Report
 AGENDA ITEM NO: 4.C.1 Monthly Financial Report with data through October 2017 (Unaudited) The data contained in this report has not been independently audited. Alameda Municipal Power Financial Report
Economic and Revenue Outlook: June 2014
 Economic and Revenue Outlook: June 2014 May 28 th, 2014 Oregon Office of Economic Analysis Mark McMullen Josh Lehner Economic Overview 2 Strong Job Growth Recently 3.5% Oregon Employment Growth 6 Month
General Fund Revenue
 Millions Percent of Kathy Steinert, Director of Fiscal Services Phone: 541.923.8927 145 SE Salmon Ave Redmond, OR 97756 kathy.steinert@redmond.k12.or.us Date: May 23, 2014 To: Redmond School District Board
QUESTION 2. QUESTION 3 Which one of the following is most indicative of a flexible short-term financial policy?
 QUESTION 1 Compute the cash cycle based on the following information: Average Collection Period = 47 Accounts Payable Period = 40 Average Age of Inventory = 55 QUESTION 2 Jan 41,700 July 39,182 Feb 18,921
2001 Treasurer's Report
 PO Box 5942 Atlanta GA 31107 2001 Compiled by Dennis McCarthy Contents: Cash Flow 2001 Year End 2000 Year End Projected Budget (2001 & 2002) Dues Summary Monthly Reports Cash Flow Report 2001Jan01 Through
Current Employment Statistics
 Current Employment Statistics October 2017 If you have any questions or seek additional information, please contact: Vermont Department of Labor Economic and Labor Market Information Division 802-828-4202
HUD NSP-1 Reporting Apr 2010 Grantee Report - New Mexico State Program
 HUD NSP-1 Reporting Apr 2010 Grantee Report - State Program State Program NSP-1 Grant Amount is $19,600,000 $9,355,381 (47.7%) has been committed $4,010,874 (20.5%) has been expended Grant Number HUD Region
Cash & Liquidity The chart below highlights CTA s cash position at August 2018 compared to August 2017.
 To: Chicago Transit Authority Board From: Jeremy Fine, Chief Financial Officer Re: Financial Results for August 2018 Date: October 10, 2018 I. Summary CTA s financial results are favorable to budget for
Current Employment Statistics
 Current Employment Statistics December 2017 If you have any questions or seek additional information, please contact: Vermont Department of Labor Economic and Labor Market Information Division 802-828-4202
Business & Financial Services December 2017
 Business & Financial Services December 217 Completed Procurement Transactions by Month 2 4 175 15 125 1 75 5 2 1 Business Days to Complete 25 Jan Feb Mar Apr May Jun Jul Aug Sep Oct Nov Dec 217 Procurement
Net Quick Assets. Target = $475,816 (5 months operating expenses) 12 Month Average Monthly Operating Expenses = $95,163
 12 Month Average Monthly Operating Expenses = $95,163") $1,200,000 $1,000,000 $800,000 $600,000 $400,000 Net Quick Assets Target = $475,816 (5 months operating expenses) 12 Month Average Monthly Operating Expenses = $95,163 Current Assets Current Liabilities
$1,200,000 $1,000,000 $800,000 $600,000 $400,000 Net Quick Assets Target = $475,816 (5 months operating expenses) 12 Month Average Monthly Operating Expenses = $95,163 Current Assets Current Liabilities
HIPIOWA - IOWA COMPREHENSIVE HEALTH ASSOCIATION Unaudited Balance Sheet As of July 31
 Unaudited Balance Sheet As of July 31 Total Enrollment: 407 Assets: Cash $ 9,541,661 $ 1,237,950 Invested Cash 781,689 8,630,624 Premiums Receivable 16,445 299,134 Prepaid 32,930 34,403 Assessments Receivable
BUDGETWATCH February 2016 Flash Report
 February 2016 Flash Report Overall Latest Condition (reporting on operations for January and subsidies through February): Overall, preliminary results were on target for the month and slightly favorable
METRO. Fiscal Year 2013 Monthly Board Report. November 2012
 METRO Fiscal Year 2013 Monthly Board Report Revenue Expense Ridership Performance 12/13/2012 Table of Contents Section A Section B Section C Section D Section E Section F Section G Section H Section I
METRO. Fiscal Year 2012 Monthly Board Report. September 2012 (Fourth Quarter Fiscal Year-to-Date)
") METRO Fiscal Year 2012 Monthly Board Report Revenue Expense Ridership Performance (Fourth Quarter Fiscal Year-to-Date) This report is based on a preliminary closing of the year-end financials for FY2012
METRO Fiscal Year 2012 Monthly Board Report Revenue Expense Ridership Performance (Fourth Quarter Fiscal Year-to-Date) This report is based on a preliminary closing of the year-end financials for FY2012
Fiscal Year 2018 Project 1 Annual Budget
 Fiscal Year 2018 Project 1 Annual Budget Table of Contents Table Page Summary 3 Summary of Costs Table 1 4 Treasury Related Expenses Table 2 5 Summary of Full Time Equivalent Table 3 6 Positions Cost-to-Cash
HIPIOWA - IOWA COMPREHENSIVE HEALTH ASSOCIATION Unaudited Balance Sheet As of January 31
 Unaudited Balance Sheet As of January 31 Total Enrollment: 371 Assets: Cash $ 1,408,868 $ 1,375,117 Invested Cash 4,664,286 4,136,167 Premiums Receivable 94,152 91,261 Prepaid 32,270 33,421 Assessments
2010 Economic Forecast: U.S. and State Conditions
 2010 Economic Forecast: U.S. and State Conditions Russell R. Evans Director and Research Economist Center for Applied Economic Research Oklahoma State University Stillwater russell.evans@okstate.edu http://www.spears.okstate.edu/caer
Sedona Fire District. Monthly Financial Report. Monthly Financial Report September Attached are the following for your information and review:
 Sedona Fire District Monthly Financial Report Monthly Financial Report September 2018 Attached are the following for your information and review: 1. Sheet as of September 30, 2018. 2. Summary of Reconciled
Regional overview Gisborne
 Regional overview Purchasing intentions - additional income-related rent subsidy (IRRS) places Area District 1 2 3 4+ TOTAL 3 35 5 7 total 3 35 5 7 7 8 9 1 11 Purchasing intentions - change within the
METRO. Fiscal Year 2013 Monthly Board Report. December 2012 (First Quarter Fiscal Year-to-Date)
") METRO Fiscal Year 2013 Monthly Board Report Revenue Expense Ridership Performance (First Quarter Fiscal Year-to-Date) 1/14/2013 Table of Contents Section A Section B Section C Section D Section E Section
METRO Fiscal Year 2013 Monthly Board Report Revenue Expense Ridership Performance (First Quarter Fiscal Year-to-Date) 1/14/2013 Table of Contents Section A Section B Section C Section D Section E Section
REVENUE ASSUMPTIONS. Actual Actual Adopted Revised Adopted TOTAL SOURCES BEGINNING FUND BALANCE $
 General Government Funds Revenues REVENUE ASSUMPTIONS This section explains and illustrates the estimates for revenue sources included in the General Government funds of the 2009/ Biennial. Key funding
Pre-Existing Condition Insurance Plan Washington State (PCIP-WA) January 2012 Financial Review
 January 2012 Financial Review") Pre-Existing Condition Insurance Plan Washington State (PCIP-WA) January 2012 Financial Review 1. Financial Statements January 2012 U Sheet Due to the timing of the HHS reimbursement receipts, there is
Pre-Existing Condition Insurance Plan Washington State (PCIP-WA) January 2012 Financial Review 1. Financial Statements January 2012 U Sheet Due to the timing of the HHS reimbursement receipts, there is
Pre-Existing Condition Insurance Plan Washington State (PCIP-WA) February 2012 Financial Review
 February 2012 Financial Review") Pre-Existing Condition Insurance Plan Washington State (PCIP-WA) February 2012 Financial Review 1. Financial Statements February 2012 U Sheet Due to the timing of the HHS reimbursement receipts, there
Pre-Existing Condition Insurance Plan Washington State (PCIP-WA) February 2012 Financial Review 1. Financial Statements February 2012 U Sheet Due to the timing of the HHS reimbursement receipts, there
Financial Performance Report for the month ending July 31, 2016
 Financial Performance Report 2017 for the month ending July 31, 2016 Finance Department 2255 West Berry Avenue, Littleton, Colorado 80120 littletongov.org Issued August 31, 2017 Revenues - At a Glance
CITY OF WOODINVILLE, WA REPORT TO THE CITY COUNCIL rd Avenue NE, Woodinville, WA WWVV.CI.WOODINVILLE.WA.US
 To: From: By: Subject: CITY OF WOODINVILLE, WA REPORT TO THE CITY COUNCIL 17301 133rd Avenue NE, Woodinville, WA 98072 WWVV.CI.WOODINVILLE.WA.US Honorable City Council Richard A. Leahy, City Mana er r
Key Labor Market and Economic Metrics
 Key Labor Market and Economic Metrics May Update Incorporates Data Available on May 27 th, 2016 This reference is the result of a collaboration between the Bureau of Labor Market Information and Strategic
Board of Directors October 2018 and YTD Financial Report
 Board of Directors October 2018 and YTD Financial Report Consolidated Financial Results Operating Margin October ($30,262) $129,301 ($159,563) Year-to-date $292,283 $931,358 ($639,076) Excess of Revenue
METRO. Monthly Board Report. June 2006
 METRO Monthly Board Report Operating Capital Service Performance June 26 7/17/26 June 26 MONTHLY BOARD REPORT INDEX Section A Section B Section C Section D Section E Section F Section G Operating Budget
Washington State Health Insurance Pool Treasurer s Report February 2018 Financial Review
 Washington State Health Insurance Pool Treasurer s Report February 2018 Financial Review 1. 2017 Interim III Assessment Required An assessment of $8.5 M was required to adequately fund the pool until the
Economic Outlook: Grand Strand Economy
 Economic Outlook: Grand Strand Economy 20 th Annual Economic Growth and Real Estate Summit Pine Lakes Country Club, September 29, 2017 Robert F. Salvino, Ph.D. E. Craig Wall Sr. College of Business Coastal
Management Reports. June for PREPARED BY POWERED BY
 Management Reports for June 217 PREPARED BY POWERED BY Contents 1. Management Reports Cashflow Forecast Actual vs Budget P&L Forecast Where Did Our Money Go? Net Worth 2. Understanding your Reports 3.
General Fund Revenues, Expenditures & Other Changes in Fund Balance Midway ISD
 General Fund Revenues, Expenditures & Other Changes in Fund Balance For the Month Ended July 31, 2017 with Comparative Prior Year Balances Revenue Code Actual Current Mo Actual Year-to- Date Encumbrances
Washington State Health Insurance Pool Treasurer s Report January 2018 Financial Review
 Washington State Health Insurance Pool Treasurer s Report January 2018 Financial Review 1. 2017 Interim III Assessment Required An assessment of $8.5 M was required to adequately fund the pool until the
Washington State Health Insurance Pool Treasurer s Report September 2018 Financial Review
 Washington State Health Insurance Pool Treasurer s Report September 2018 Financial Review 1. 2018 Interim III Assessment Required An assessment of $8.5 M was required to adequately fund the pool until