BOW VALLEY REGIONAL TRANSIT SERVICES COMMISSION REGULAR MEETING. BVRTSC Boardroom 221 Beaver Street, Banff, AB. AGENDA March 14, :00 4:00 pm
|
|
|
- Brent Dalton
- 5 years ago
- Views:
Transcription
1 BOW VALLEY REGIONAL TRANSIT SERVICES COMMISSION REGULAR MEETING BVRTSC Boardroom 221 Beaver Street, Banff, AB. AGENDA March 14, :00 4:00 pm 1. Call to Order 2. Approval of the Agenda 3. Minutes Approval of the January 10, 2018 Regular Meeting Minutes (attached) 4. Old Business (including Standing Items) a) CAO s Monthly Report b) Bring Forward List of Pending Items c) Transit Service Monthly Statistics (attached) 5. New Business a) Preliminary Q4 Results b) Preliminary 2017 KPI s c) Request for Decision Token Transit 6. Adjournment
2 BOW VALLEY REGIONAL TRANSIT SERVICES COMMISSION REGULAR MEETING BVRTSC Boardroom 221 Beaver Street, Banff, AB. MINUTES January 10, 2017: 2:00 4:00 pm BOARD MEMBERS PRESENT Davina Bernard, ID#9 Chair Dave Schebek, ID#9 Brian Standish, Town of Banff Vi Sandford, Town of Canmore Joanna McCallum, Town of Canmore BOARD MEMBERS ABSENT Chip Olver, Town of Banff BOARD ADMINISTRATION PRESENT Martin Bean, Chief Administrative Officer Steve Nelson, Manager of Operations ADMINISTRATION PRESENT Danielle Morine, ID#9 Adrian Field, Town of Banff Alex Kolesch, Parks Canada ADMINISTRATION ABSENT Jacob Johnson, Town of Canmore 1. Call to Order Davina Bernard calls meeting to order at 2:00PM. 2. Approval of the Agenda BVRTSC18-01 Davina Bernard moves to approve agenda as presented CARRIED UNANIMOUSLY
3 3. Minutes One administrative edit noted. BVRTSC18-02 Davina Bernard moves to approve minutes as amended CARRIED UNANIMOUSLY 4. Old Business (including Standing Items) a) CAO s Monthly Report b) Bring Forward List of Pending Items None due c) Transit Service Monthly Statistics (attached) 5. New Business a) Commission Structure and Hiring Update Anticipate all positions being filled by March b) Automatic Passenger Counter Report Demonstration APC units are in place and we are working through reporting procedures to be able to best present statistics c) February Meeting Cancellation There will be no meeting in February. Next meeting will be March 14 th. BVRTSC18-03 Davina Bernard moves to go In-Camera to discuss HR matters at 2:47pm BVRTSC18-04 Davina Bernard moves to come out of In-Camera at 2:54pm 6. Adjournment BVRRTSC18-05 Davina Bernard moves to adjourn the meeting at 2:55PM CARRIED UNANIMOUSLY CARRIED UNANIMOUSLY CARRIED UNANIMOUSLY

4 CAO Report
5 CAO Update March 2018 o Financial: o Preliminary year end financials have been finalized and are being presented this month. The annual BVRTSC financial audit is being conducted by Avail LLP on March 15 th and 16 th. Results from this audit will be present by Avail at the April Commission meeting. o All GreenTRIP and PTIF submission for amounts spent to date have been submitted and approvals have been received from the Provincial with reimbursement to follow shortly. Further submissions will be occurring in the next couple of weeks to meet the March 31 st deadline for PTIF submissions and the Province s year end. o Andrea Stuart has started as Financial Controller and will be transitioning over the next few weeks from the Town of Banff. Mirka Cedidlova has joined us as Accounting and Payroll Administrator as of February 20 th. Lake Louise Service: o We are still in discussions with Parks Canada and ID9 with regards to providing a service between Banff and Lake Louise in Parks Canada currently has an RFP circulating for a service in 2018 between Banff and Lake Louise, similar to the service operated in Banff Local Service: o We have received our three new buses and they are in the process of being outfitted for service. The GreenTRIP/PTIF claim is submitted and pending for the bulk of the cost of these buses. o Wraps are currently being designed for these three buses and the animals will be Mule Deer, Coyote and Beaver. o Plans are also moving forward for additional shelters, a transit hub and a bus storage facility in Banff. 1
6 Regional Service: o Regional service saw a significant jump in ridership in January 2018 of 34% over January February ridership numbers are also strong with an increase of 32% or 12,282 riders. Canmore Local Service: o Ridership in January was the strongest yet, with a total of 8,392 riders using Route 5. We believe that the schedule change and the improved connections to Regional service are encouraging more transit use. Ridership in February showed our biggest increase over 2016 of 37% and total ridership of o Vicinity bus is due to arrive in early June for Canmore local service. The wrap on this bus will be Red Fox. o Canmore building renovations are complete, with some work still occurring in the yard. Removal of the scale has taken place, which allows a significant amount of additional usable space within the yard. Epcor is currently having issues with the water lines freezing so full utilization of the new services is not available as of yet. They have provided a temporary water trailer to help with cleaning. General: o Roam is providing a second bus on the Minnewanka service this summer. Options we are looking at for a bus is purchase a surplus bus from Red Deer Transit or from Calgary Transit. Lease options are proving to be scarce for low floor, wheelchair accessible vehicles. o An RFP has been posted for a Calgary to Banff service provider for this summer and will be evaluated/finalized over the next week. The BVRTSC in conjunction with the TOB, TOC and Parks Canada are working towards a solution for providing service from Calgary this summer, similar to the On-It service provided last year. As the Calgary Regional Partnership will not be in existence to provide the service this year, the process has begun to find a suitable service provider to coordinate and operate all aspects of the program. 2
7 o Corrie DiManno has joined us as of February 15 th in the role of Marketing and Communications Coordinator. In a couple of short weeks we have seen great improvements in our social media presence as well as some fun and effective campaigns moving forward! Examples of projects being worked on: Canmore Eagles bus and ticket campaign from Banff Lux Cinema movie and bus campaign o Don is moving forward with driver hiring and has a class starting at the end of March with approximately 6 candidates and plans for another class later in April. o BVRTSC will be putting out an RFP for a real time sign and arrival prediction solution. As we have not considered options and competitive pricing alternatives since the BVRTSC has been in existence, we feel that the timing is appropriate. o Steve is working with our web developer to provide a website scheduling tool that will provide live updates of schedule times to replace the pdf versions that we currently have on our website. This tool is scheduled to be rolled out before the end of April. We will be leaving the pdf versions of the schedule on the website for anyone that would require a printed version. o Link below is to an article from CUTA on continued government support for transit: 3

8 Bring Forward List
9 BRING FORWARD LIST OF ITEMS PENDING (as of March 2018) ITEM Date Initiated Pending Date Comments: BVRTSC17-81 Davina Bernard moves to have Administration discuss Canmore bus storage contra agreement within the audit review in April to ensure the correct reporting practice November 2017 April


).")

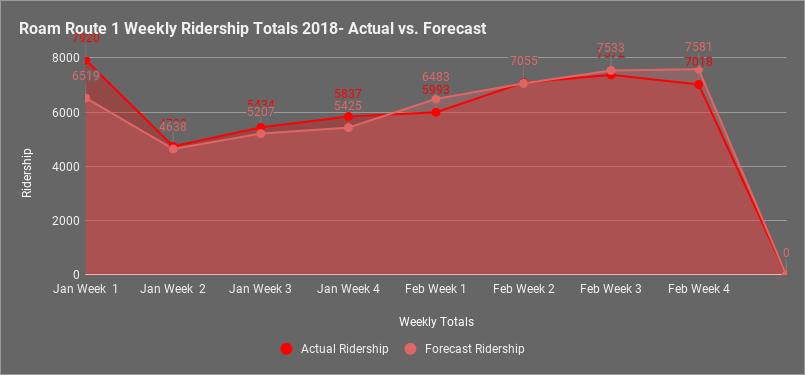
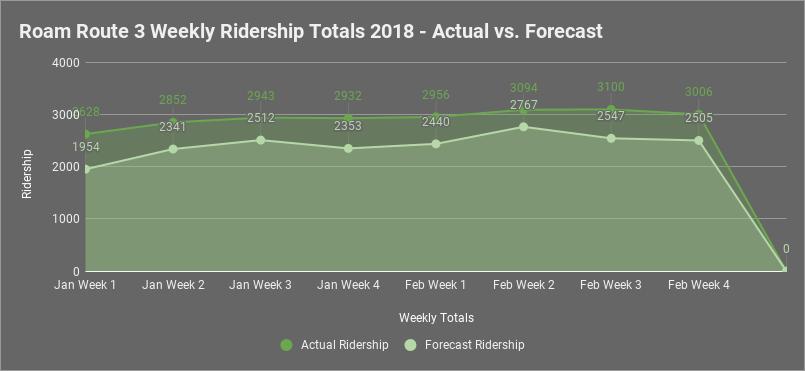
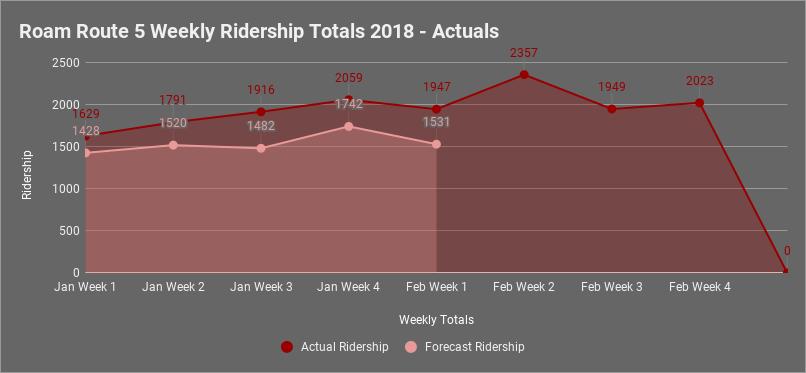
10 Bow Valley Regional Transit Services Commission Ridership and Revenue Statistics Month Type Banff Local Canmore Local Regional February Strollers Bikes Observations: February Observations: Route 1 ridership steady compared to February 2017 with 0.4% increase in Ridership. Route 2 ridership down a little at -4.7% over February o Banff Local revenues up 1.3% over February 2017 (Route 1 and 2 combined). Route 3 ridership up 20% compared to February 2017! o Regional revenues up 42% (Large LITP purchase from Town of Banff ($11K)). Route 5 ridership up 40% compared to February Just shy of 8,300 trips! o Canmore Local revenue comparison to February 2017 is down slightly. February pass sales dip, along with slightly lower cash fares. Pass sales can often come in waves as Monthly, 3 Month and 6 Month passes expire.
11
12

13 Route 1 (Sulphur/Banff Ave) Route 2 (Tunnel Mtn/Banff Springs Hotel) Route 4 (Cave and Basin) Banff Local Transit Totals Banff Local Transit Totals Banff Local Transit Totals Banff Local Transit Totals Banff Local Transit Totals % Change Month RT RT RT1 2018% Change RT RT RT % Change % Change (Not incl. Rte6) January 19,391 23,567 26, % 22,261 24,429 22, % N/A N/A N/A 41,973 41,652 47,189 48, % February 20,973 27,697 27, % 22,446 24,820 23, % N/A N/A N/A 41,240 43,419 52,146 51, % March 24,034 6,822 7, % 23,928 5,557 5, % N/A N/A N/A 46,484 47,962 56,275 13, % April 18,226 #DIV/0! 16,355 #DIV/0! N/A 37,483 34,581 48, % May 30,882 #DIV/0! 22,549 #DIV/0! % 52,462 53,431 62, % June 37,896 #DIV/0! 26,196 #DIV/0! % 64,295 64,092 71, % July 50,540 #DIV/0! 31,655 #DIV/0! 951 2, % 79,171 82,195 95, % August 52,621 #DIV/0! 32,553 #DIV/0! 830 2, % 81,401 85,174 99, % September 37,009 #DIV/0! 24,406 #DIV/0! 676 1, % 60,204 61,415 73, % October 24,252 #DIV/0! 15,358 #DIV/0! N/A ,371 39,610 43, % November 20,240 #DIV/0! 17,004 #DIV/0! 33,785 37,244 38, % December 27,465 #DIV/0! 23,551 #DIV/0! 44,156 51,016 52, % YTD 363,529 58,086 61, % 278,262 54,806 51, % 3,374 7, % 618, , , , % Route 3 (CB Regional) Route 5 (Canmore Local) Route 6 (Minnewanka) Route 1 5.8% Month % Change % Change % Change Route 2-5.9% January 8,502 9,892 12, % N/A 6,551 8, % Route % February 8,081 10,182 12, % N/A 5,864 8, % Route % March 8,137 2,158 3, % N/A 1,561 2, % Route % April 7,911 #DIV/0! N/A #DIV/0! Route % May 9,753 #DIV/0! N/A #DIV/0! 2, % June 10,831 #DIV/0! N/A #DIV/0! 6, % July 11,513 #DIV/0! N/A #DIV/0! 10, % August 11,089 #DIV/0! N/A #DIV/0! 10, % September 9,720 #DIV/0! N/A #DIV/0! 2, % October 9,881 #DIV/0! N/A #DIV/0! November 11,164 #DIV/0! 8,570 #DIV/0! December 9,999 #DIV/0! 7,597 #DIV/0! YTD 116,581 22,232 28, % 16,167 13,976 18, % 32, %
14
15
16 BANFF LOCAL TRANSIT REVENUE BREAKDOWN 2018 Actual Month Fares Passes Other Total Budget January $26,116 $9,415 $35,531 February $27,287 $4,794 $32,081 March $0 April $0 May $0 June $0 July $0 August $0 September $0 October $0 November $0 December $0 Totals: $53,403 $14,209 $0 $67,612 $ Actual Month Fares Passes Other Total Budget January $25,948 $4,074 $0 $30,022 $28, February $26,579 $5,078 $0 $31,657 $28, March $27,064 $4,640 $0 $31,704 $28, April $24,413 $2,012 $0 $26,425 $33, May $37,695 $2,457 $0 $40,152 $33, June $38,890 $4,772 $0 $43,662 $33, July $53,179 $1,318 $0 $54,497 $38, August $53,395 $1,972 $0 $55,367 $38, September $41,805 $5,392 $0 $47,197 $38, October $24,275 $1,415 $0 $25,690 $33, November $19,296 $5,488 $0 $24,784 $33, December $27,772 $2,826 $0 $30,598 $33, Totals: $400,311 $41,444 $0 $441,755 $401,400
17 REVENUE Month Running Total 2018 Running Total Running Total Difference 2017 to 2018 Monthly Difference 2017 to 2018 Monthly % Difference January $31,352 $28,378 $30,022 $35,531 $30,022 $35,531 $5,509 $5, % February $25,006 $21,417 $31,657 $32,081 $61,679 $67,612 $5,933 $ % March $25,175 $22,757 $31,704 $0 $93,383 April $20,711 $22,872 $26,425 $0 $119,808 May $35,268 $32,790 $40,152 $0 $159,960 June $44,419 $35,412 $43,662 $0 $203,622 July $46,553 $50,207 $54,497 $0 $258,119 August $53,075 $51,812 $55,367 $0 $313,486 September $43,912 $38,938 $47,197 $0 $360,683 October $21,253 $23,802 $25,690 $0 $386,373 November $25,892 $26,920 $24,784 $0 $411,157 December $25,939 $31,650 $30,598 $0 $441,755 Grand Total: $398,555 $386,955 $441,755 $67,612 $386,956
18 CANMORE LOCAL TRANSIT REVENUE BREAKDOWN 2018 Actual Month Fares Passes Other Total Budget Info January $5,495 $2,828 $8,323 February $4,444 $1,081 $5,525 March $0 April $0 May $0 June $0 July $0 August $0 September $0 October $0 November $0 December $0 Totals: $9,939 $3,909 $0 $13,848 $ Actual Month Fares Passes Other Total Budget Info January $6,173 $26,156 0 $32,329 $10,000 February $4,812 $845 0 $5,657 $10,000 March $5,653 $2,786 0 $8,439 $12,000 April $3,905 $2,503 0 $6,408 $12,000 May $5,162 $2,124 0 $7,286 $15,000 June $5,092 $1,924 0 $7,016 $20,000 July $4,691 $1,811 0 $6,502 $24,000 August $4,857 $1,413 0 $6,270 $25,000 September $4,333 $1,226 0 $5,559 $22,000 October $4,189 $2,848 0 $7,037 $18,000 November $5,487 $2,303 0 $7,790 $16,000 December $4,973 $2,999 0 $7,972 $12,000 Totals: $59,327 $48,938 0 $108,265 $196,000 *Includes Pass Sales from Dec and Jan both to customers and vendors
19 REVENUE Month Running Total 2018 Running Total Running Total Difference 2017 to 2018 Monthly Difference 2017 to 2018 Monthly % Difference January $32,329 $8,323 $32,329 $8,323 -$24,006 -$24, % February $5,657 $5,525 $37,986 $13,848 -$24,138 -$ % March $8,439 $0 $46,425 April $6,408 $0 $52,833 May $7,286 $0 $60,119 June $7,016 $0 $67,135 July $6,502 $0 $73,637 August $6,270 $0 $79,907 September $5,559 $0 $85,466 October $7,037 $0 $92,503 November $7,790 $0 $100,293 December $7,972 $0 $108,265 Grand Total: $0 $13,848 $836,898
20 CANMORE/BANFF REGIONAL TRANSIT REVENUE BREAKDOWN 2018 Actual Month Fares Passes Other Total Budget January $30,111 $15,529 $45,640 February $30,467 $28,266 $58,733 March $0 April $0 May $0 June $0 July $0 August $0 September $0 October $0 November $0 December $0 Totals: $60,578 $43,795 $0 $104,373 $ Actual Month Fares Passes Other Total Budget January $27,058 $16,704 $0 $43,762 $32,567 February $28,782 $12,336 $0 $41,118 $32,567 March $31,087 $17,258 $0 $48,345 $32,567 April $28,564 $11,570 $0 $40,134 $37,567 May $36,208 $14,160 $0 $50,368 $37,567 June $41,044 $21,917 $0 $62,961 $37,567 July $44,256 $11,226 $0 $55,482 $42,567 August $41,387 $15,472 $0 $56,859 $42,567 September $34,728 $12,679 $0 $47,407 $42,567 October $33,727 $14,639 $0 $48,366 $37,567 November $33,304 $16,523 $0 $49,827 $37,567 December $31,818 $17,530 $0 $49,348 $37,567 Totals: $411,963 $182,014 $0 $593,977 $450,800
21 REVENUE Month Running Total 2018 Running Total Running Total Difference 2017 to 2018 Monthly Comparison 2017 to 2018 Monthly % Difference January $39,725 $36,444 $43,762 $45,640 $43,762 $45,640 $1,878 $1, % February $32,590 $36,166 $41,118 $58,733 $84,880 $104,373 $19,493 $17, % March $31,375 $35,579 $48,345 $0 $133,225 April $33,430 $38,277 $40,134 $0 $173,359 May $45,147 $40,017 $50,368 $0 $223,727 June $47,013 $52,881 $62,961 $0 $286,688 July $44,636 $55,007 $55,482 $0 $342,170 August $41,241 $58,764 $56,859 $0 $399,029 September $35,253 $40,801 $47,407 $0 $446,436 October $43,129 $42,992 $48,366 $0 $494,802 November $44,467 $47,838 $49,827 $0 $544,629 December $34,301 $47,383 $49,348 $0 $593,977 Grand Total: $472,307 $532,149 $593,977 $104,373 $593,977


22 New Business - No reports to attach
23 th Quarter Financial Update
24 Bow Valley Regional Transit Services Commission Income Statement January - December 2017 Income Administrative Route 1 Route 2 Canmore Local (Route 5) Cave and Basin (Route 4) CB Regional (Route 3) Lake Minnewanka (Route 6) Total 4100 Farebox $ 0 $ 181,260 $ 193,887 $ 53,707 $ 7,884 $ 380,613 $ 0 $ 817,350 Total 4150 Passes $ 0 $ 21,194 $ 21,485 $ 50,727 $ 0 $ 188,551 $ 0 $ 281, Advertising & Marketing Revenue 0 14,931 14,002 10,917 1,092 11,592 52,534 Total 4300 Partner Programs $ 0 $ 330,877 $ 75,023 $ 0 $ 0 $ 0 $ 0 $ 405, Requisition Recoveries Town of Banff TOB - Capital 14,045 40,282 40,282 30, , TOB - Operating 150,833 80, ,787 98, ,101 Total Town of Banff $ 164,878 $ 120,412 $ 352,069 $ 0 $ 0 $ 128,810 $ 0 $ 766, Town of Canmore TOC - Capital 14, ,459 44, TOC - Operating 100, ,408 98, ,314 Total Town of Canmore $ 114,600 $ 0 $ 0 $ 361,697 $ 0 $ 128,810 $ 0 $ 605, Other 6,000 6, ID ID 9 - Capital 14,045 14, ID 9 - Operating 20,000 20,000 Total ID 9 $ 34,045 $ 0 $ 0 $ 0 $ 0 $ 0 $ 0 $ 34,045 Total 4400 Requisition Recoveries $ 313,522 $ 120,412 $ 352,069 $ 361,697 $ 0 $ 257,621 $ 6,000 $ 1,411, Other Recoveries 1,300 1,386 24, , , , Other Total 4500 Other Recoveries $ 1,300 $ 1,386 $ 24,706 $ 0 $ 65,820 $ 0 $ 136,707 $ 229,920 Total 4700 Charter Sales $ 0 $ 767 $ 767 $ 0 $ 0 $ 0 $ 0 $ 1, Route Detour Fee Grant Income 6, , Other Income 23,471 23,471 Total 7600 Other Income $ 23,471 $ 0 $ 0 $ 0 $ 0 $ 0 $ 0 $ 23,471 Total Income $ 344,629 $ 670,857 $ 681,970 $ 477,877 $ 74,796 $ 838,408 $ 142,707 $ 3,231,243 Cost of Goods Sold 5714 Bus advertising costs Commission 1,692 1,536 1, ,002 6,539 Total Cost of Goods Sold $ 0 $ 1,842 $ 1,686 $ 2,343 $ 340 $ 1,127 $ 0 $ 7,339 Gross Profit $ 344,629 $ 669,015 $ 680,283 $ 475,534 $ 74,455 $ 837,281 $ 142,707 $ 3,223,904 Other Income 7100 Interest Income 4,742 4, Foreign Exchange Gain/Loss Total Other Income $ 4,194 $ 0 $ 0 $ 0 $ 0 $ 0 $ 0 $ 4,194 TOTAL Page 1 of 4
25 Bow Valley Regional Transit Services Commission Income Statement January - December 2017 Expenses Administrative Route 1 Route 2 Canmore Local (Route 5) Cave and Basin (Route 4) CB Regional (Route 3) Lake Minnewanka (Route 6) 5100 Salaries & Wages Wages 138,835 15,376 15,376 16,402 1,064 14, ,404 Total 5130 Benefits $ 33,671 $ 3,327 $ 3,308 $ 3,549 $ 201 $ 3,105 $ 0 $ 47,161 Total 5100 Salaries & Wages $ 172,505 $ 18,703 $ 18,685 $ 19,950 $ 1,265 $ 17,457 $ 0 $ 248, Training & Conferences Conference Fees Meals & Travel 6, , Training 1,479 1,479 Total 5170 Training & Conferences $ 9,040 $ 767 $ 768 $ 848 $ 0 $ 923 $ 0 $ 12, Travel Expense Mileage ,450 Total 5180 Travel Expense $ 1,343 $ 364 $ 411 $ 629 $ 0 $ 245 $ 196 $ 3, Operating Contracts Direct Operating Cost 2,074 35,119 35,021 41,428 4,063 36,991 5, , Drivers wages 0 228, , ,075 23, ,504 61, , Drivers uniforms ,581 1, , Drivers recruitment 67 1,775 1,782 2,092 2, , Training , Driver recognition 1, , Auto 0 0 Total 5230 Driver and Op Benefits $ 0 $ 55,581 $ 50,577 $ 54,319 $ 5,349 $ 58,238 $ 8,346 $ 232,409 Total 5220 Direct Operating Cost $ 4,137 $ 322,065 $ 293,669 $ 332,470 $ 33,368 $ 327,613 $ 76,903 $ 1,390, Maintenance Parts ,993 53,149 24,057 1,040 95,121 8, , Vehicle Supplies 4 3,635 3,635 4, , , Maintenance Labour 2,812 57,452 57,577 74,870 10,651 75,654 14, ,510 Total 5240 Maintenance $ 3,667 $ 114,079 $ 114,360 $ 103,465 $ 11,715 $ 176,256 $ 24,190 $ 547,733 Total 5200 Operating Contracts $ 7,827 $ 436,144 $ 408,029 $ 435,995 $ 45,083 $ 503,870 $ 101,093 $ 1,938, Fuel ,915 49,141 64,531 2, ,228 13, , Insurance Expense General Liability Insurance 3,603 3, Fleet insurance 1,429 6,346 5,277 5,184 1,068 7,532 3,534 30,369 Total 5300 Insurance Expense $ 5,032 $ 6,346 $ 5,277 $ 5,184 $ 1,068 $ 7,532 $ 3,534 $ 33, General Operating Expenses Office Supplies 14,328 1,100 1,100 2,060 2, , Bank Service Charges 2, ,000 1, , Janitorial Supplies & Services TOTAL Page 2 of 4
26 Bow Valley Regional Transit Services Commission Income Statement January - December 2017 Administrative Route 1 Route 2 Canmore Local (Route 5) Cave and Basin (Route 4) CB Regional (Route 3) Lake Minnewanka (Route 6) 5354 Postage and Office Delivery Miscellaneous Expense , Memberships 3,297 3, Cell Phone 1, ,230 1, , Office Phone 4, ,000 1,500 8, Board meeting expense Cash over/short Software and License Fees 9, ,187 12, Brinks service fees 1,364 1,364 1,343 2,439 6,509 Total 5350 General Operating Expenses $ 36,487 $ 5,464 $ 5,465 $ 7,527 $ 0 $ 9,912 $ 585 $ 65, Interest & Penalties Lease Expense Bus Lease 29,625 29,625 59, Bus Storage 12,432 12, ,936 34, Parks Canada Land Rent Total 5400 Lease Expense $ 0 $ 42,182 $ 42,182 $ 0 $ 0 $ 10,086 $ 0 $ 94, Professional/contractual fees Accounting Fees 32,389 1,671 1,672 3, , , Payroll service fee ,000 3, Bookkeeping Services Legal Fees Recruitment Costs Website , Business Hosting Expenses 1,274 1, Web hosting & Software Lic (annual fee - Trapeze) 18,414 18,392 7,288 1,534 12,814 3,311 61, Nextbus 1,723 10,353 10,353 8,372 1,749 14,715 1,338 48, Security Fee 2,870 2,870 5, IT Support 528 1,000 1,000 1,030 2, , Office rent 23,528 2,640 2,640 2,841 31, Copier 1, , Bus wrap repair Contract Work 11, , Utilities 3,448 3, Customer Centre Support 8,323 7,824 7,824 6,217 1,086 15,642 3,000 49, Infrastructure Maintenance 22,812 3,153 3,173 2, ,662 33,748 Total 5600 Professional/contractual fees $ 108,570 $ 49,678 $ 49,694 $ 30,178 $ 5,111 $ 53,846 $ 10,950 $ 308,027 Total 5700 Advertising and Marketing $ 53 $ 18,229 $ 14,934 $ 12,351 $ 3,677 $ 14,928 $ 11,083 $ 75, Uncategorized Expenses 0 0 TOTAL Page 3 of 4
27 Bow Valley Regional Transit Services Commission Income Statement January - December 2017 Administrative Route 1 Route 2 Canmore Local (Route 5) Cave and Basin (Route 4) CB Regional (Route 3) Lake Minnewanka (Route 6) Total Expenses $ 341,764 $ 635,791 $ 594,586 $ 577,193 $ 58,572 $ 736,026 $ 140,516 $ 3,084,450 Other Expenses 5900 Amortization Expense 0 0 Total Other Expenses $ 0 $ 0 $ 0 $ 0 $ 0 $ 0 $ 0 $ 0 Net Surplus (Deficit) $ 7,058 $ 33,223 $ 85,697 -$ 101,659 $ 15,883 $ 101,255 $ 2,191 $ 143,649 Allocation of Route 6 $ 2,191 -$ 2,191 Allocation of Route 4 $ 5,655 $ 4,850 -$ 15,883 $ 5,378 Allocation of Commission Expenses $ (9,249) $ 2,443 $ 2,096 $ 2,386 $ 2,324 Totals $ 0 $ 41,322 $ 92,643 -$ 99,272 $ 0 $ 108,957 $ 0 $ 143,649 TOTAL Town of Banff Town of Banff CB Regional $ 54, Opening Reserves 22,529 Banff Local $ 133, adjustment 188,443 Net to Banff Reserves: $ 188, Ending Reserves 210,972 Town of Canmore Town of Canmore CB Regional $ 54, Opening Reserves 125,512 Canmore Local $ (99,272.26) 2017 adjustment (44,794) Net to Canmore Reserves: $ (44,793.94) Ending Reserves 80,718 Total Service Hours Route % Route % Route % Route % Total hours % Page 4 of 4

28 th Quarter Financial Update
29 Bow Valley Regional Transit Services Commission Budget vs. Actuals: FY FY17 P&L Classes - ALL ROUTES January - December 2017 Oct - Dec, 2017 Total Actual Budget % of Budget Actual Budget % of Budget Income Total 4100 Farebox $ 172, $ 188, % $ 817, $ 908, % Total 4150 Passes $ 76, $ 53, % $ 281, $ 199, % 4200 Advertising & Marketing Rev 7, , % 52, , % Total 4300 Partner Programs $ 101, $ 103, % $ 405, $ 415, % 4400 Requisition Recoveries Town of Banff TOB - Capital 125, , TOB - Operating 160, , % 641, , % Total Town of Banff $ 285, $ 160, % $ 766, $ 641, % Town of Canmore TOC - Capital 44, , TOC - Operating 140, , % 560, , % Total Town of Canmore $ 184, $ 140, % $ 605, $ 560, % ID ID 9 - Capital 14, , ID 9 - Operating 5, , % 19, , % Total ID 9 $ 19, $ 5, % $ 34, $ 20, % Total 4400 Requisition Recoveries $ 489, $ 305, % $ 1,405, $ 1,221, % 4500 Other Recoveries 198, , % 235, , % Other Total 4500 Other Recoveries $ 198, $ 142, % $ 235, $ 181, % 4700 Charter Sales % 1, , % Banff LOCAL Charter Sales Total 4700 Charter Sales $ 0.00 $ % $ 1, $ 3, % 4800 Route Detour Fee % % 4900 Grant Income 6, , Other Income , % 23, , % 7601 Billable Expense Income Total 7600 Other Income $ $ 10, % $ 23, $ 40, % Total Income $ 1,051, $ 820, % $ 3,231, $ 3,031, % Cost of Goods Sold Budget vs. Actuals ALL YTD 1 of 4
30 Bow Valley Regional Transit Services Commission Budget vs. Actuals: FY FY17 P&L Classes - ALL ROUTES January - December 2017 Oct - Dec, 2017 Total Actual Budget % of Budget Actual Budget % of Budget 5714 Bus advertising costs Commission , % 6, , % Total Cost of Goods Sold -$ $ 3, % $ 7, $ 12, % Gross Income $ 1,052, $ 817, % $ 3,223, $ 3,019, % Expenses 5100 Salaries & Wages Wages 53, , % 201, , % Total 5130 Benefits $ 10, $ 13, % $ 47, $ 53, % 5137 Recruitment Costs % , % Total 5100 Salaries & Wages $ 63, $ 64, % $ 248, $ 258, % 5170 Training & Conferences 3, , % 3, , % 5172 Meals & Travel , % 6, , % 5173 Training 1, Total 5170 Training & Conferences $ 4, $ 5, % $ 12, $ 20, % 5180 Travel Expense Mileage , % 2, , % Total 5180 Travel Expense $ 1, $ 1, % $ 3, $ 6, % 5200 Operating Contracts , % 5220 Direct Operating Cost 43, , % 160, , % 5221 Drivers wages 222, , % 978, ,055, % 5222 PT drivers wages Drivers uniforms 2, , % 5, , % 5226 Drivers recruitment 5, , % 8, , % 5227 Training , % 2, , % 5228 Driver recognition 2, % 2, , % 5229 Auto Total 5230 Driver Benefits $ 52, $ 0.00 $ 232, $ 0.00 Total 5220 Direct Operating Cost $ 329, $ 324, % $ 1,390, $ 1,407, % 5240 Maintenance Parts 139, , % 236, , % Includes $108,183 for engine replacements, covered above with capital funding Vehicle Supplies 1, , % 18, , % 5260 Maintenance Labour 75, , % 293, , % Budget vs. Actuals ALL YTD 2 of 4
31 Bow Valley Regional Transit Services Commission Budget vs. Actuals: FY FY17 P&L Classes - ALL ROUTES January - December 2017 Oct - Dec, 2017 Total Actual Budget % of Budget Actual Budget % of Budget Total 5240 Maintenance $ 217, $ 85, % $ 547, $ 379, % Includes $108,183 for engine replacements, covered above with capital funding. Total 5200 Operating Contracts $ 547, $ 410, % $ 1,938, $ 1,792, % Includes $108,183 for engine replacements, covered above with capital funding Fuel 82, , % 304, , % 5300 Insurance Expense General Liability Insurance % 3, , % 5320 Fleet insurance 6, , % 30, , % Additional buses part year Total 5300 Insurance Expense $ 7, $ 6, % $ 33, $ 29, % 5350 General Operating Expenses % % 5351 Office Supplies 15, , % 20, , % Includes $13,040 covered with capital funding above 5352 Bank Service Charges 1, , % 5, , % 5353 Janitorial Supplies & Services % , % 5354 Postage and Delivery % , % 5355 Miscellaneous Expense 1, % 1, , % 5356 Memberships % 3, , % 5357 Cell Phone 1, , % 4, , % 5358 Office Phone 1, , % 8, , % 5359 Board meeting expense % , % 5360 Cash over/short Software and License Fees 7, % 12, , % Includes $6,951 covered with capital funding above 5364 Brinks service fees 1, , % 6, , % Total 5350 General Op Expenses $ 31, $ 12, % $ 65, $ 51, % Includes $19,991 covered with capital funding above 5391 Interest & Penalties Lease Expense % 5410 Bus Lease 14, , % 59, , % 5420 Bus Storage 8, , % 34, , % 5430 Parks Canada Land Rent % % Total 5400 Lease Expense $ 23, $ 25, % $ 94, $ 102, % 5600 Professional/contractual fees Accounting Fees 5, , % 43, , % More reporting, coverage for November/December 5612 Payroll service fee % 3, , % 5613 Book keeping Legal Fees % , % Budget vs. Actuals ALL YTD 3 of 4
32 Bow Valley Regional Transit Services Commission Budget vs. Actuals: FY FY17 P&L Classes - ALL ROUTES January - December 2017 Oct - Dec, 2017 Total Actual Budget % of Budget Actual Budget % of Budget 5616 Recruitment Costs % , % 5617 Website , % 1, , % 5619 Business Hosting Expenses 1, % 1, , % 5620 Web hosting/trapeze 40, , % 61, , % Includes $32,687 covered with capital funding above (smart cards) 5622 Nextbus 3, , % 48, , % 5623 Security Fee 1, , % 5, , % 5624 IT Support 1, , % 5, , % 5626 Office rent 2, , % 31, , % 5627 Copier % 2, , % 5628 Bus wrap repair , % , % 5629 Contract Work 11, , % 13, , % 5630 Utilities 1, % 3, , % 5631 Customer Centre Support 15, , % 49, , % 5632 Infrastructure Maintenance 22, , % 33, , % Includes $22,756 covered with capital funds (office repair) Total 5600 Professional/contract fees $ 111, $ 78, % $ 308, $ 323, % 5700 Advertising and Marketing 9, , % 75, , % Total Expenses $ 881, $ 704, % $ 3,084, $ 3,019, % Net Operating Surplus (Deficit) $ 171, $ 112, % $ 139, $ % Other Income 7100 Interest Income 1, , Foreign Exchange Gain/Loss Total Other Income $ 2, $ 0.00 $ 4, $ 0.00 Other Expenses 5900 Amortization Expense 68, , % 290, , % Short fall in budgeting amortization Total Other Expenses $ 68, $ 55, % $ 290, $ 226, % Short fall in budgeting amortization Net Other Income -$ 66, $ 55, % -$ 286, $ 226, % Net Surplus (Deficit) $ 105, $ 57, % -$ 146, $ 226, % Budget vs. Actuals ALL YTD 4 of 4

33 2017 Year End KPI s
34 Bow Valley Regional Transit Services Commission Banff Local Service - Route Monthly Budget/Actual KPIs with 2016 Actuals KPI 2017 Jan 2017 Jan Jan 2017 Feb 2017 Feb Feb 2017 Mar 2017 Mar Mar 2017 Q Q1 Q Q1 ACTUAL Budget COMP ACTUAL Budget COMP ACTUAL Budget COMP ACTUAL Budget COMP ACTUAL % % % % Revenue per Service Hour $ $ % $ $ % $ $ % $ $ % $ Gross Cost per Service Hour $ $ % $ $ % $ $ % $ $ % $ Direct Operating Cost per Service Hour $ $ % $ $ % $ $ % $ $ % $ Overhead per Service Hour $ 9.55 $ % $ 9.36 $ % $ 7.64 $ % $ 8.84 $ % $ 8.60 Lease/Amortization per Service Hour $ $ % $ $ % $ $ % $ $ % $ 8.48 Net Cost per Service Hour (CUTA) $ 4.13 $ % $ 8.42 $ % $ 5.92 $ % $ 6.15 $ % $ % Cost Recovery (CUTA) 96% 81% 91% 81% 93% 81% 93% 81% 65% Ridership 23,495 19, % 27,693 19, % 31,779 21, % 82,967 59, % 133,335 Service Hours % % % 1,574 1, % 3,148 Ridership per Service Hour % % % % 42 Q Q KPI 2017 Apr 2017 Apr April 2017 May 2017 May May 2017 Jun 2017 Jun June 2017 Q Q2 Q Q2 ACTUAL Budget COMP ACTUAL Budget COMP ACTUAL Budget COMP ACTUAL Budget COMP ACTUAL % % % % Revenue per Service Hour $ $ % $ $ % $ $ % $ $ % $ Gross Cost per Service Hour $ $ % $ $ % $ $ % $ $ % $ Direct Operating Cost per Service Hour $ $ % $ $ % $ $ % $ $ % $ Overhead per Service Hour $ 9.97 $ % $ 8.02 $ % $ 5.83 $ % $ 7.78 $ % $ 9.06 Lease/Amortization per Service Hour $ $ % $ $ % $ 8.72 $ % $ 9.84 $ % $ 8.21 Net Cost per Service Hour (CUTA) $ 7.26 $ % $ (0.66) $ % $ (3.04) $ % $ 0.90 $ % $ % Cost Recovery (CUTA) 91% 86% 101% 93% 104% 96% 99% 91% 63% Ridership 29,148 21, % 37,914 33, % 42,032 43, % 109,094 98, % 151,243 Service Hours % % % 1,677 1, % 3,251 Ridership per Service Hour % % % % 47
35 Bow Valley Regional Transit Services Commission Banff Local Service - Route Monthly Budget/Actual KPIs with 2016 Actuals KPI 2017 Jul 2017 Jul July 2017 Aug 2017 Aug Aug 2017 Sept 2017 Sep Sept 2017 Q Q3 Q Q3 ACTUAL Budget COMP ACTUAL Budget COMP ACTUAL Budget COMP ACTUAL Budget COMP ACTUAL % % % % Revenue per Service Hour $ $ % $ $ % $ $ % $ $ % $ Gross Cost per Service Hour $ $ % $ $ % $ $ % $ $ % $ Direct Operating Cost per Service Hour $ $ % $ $ % $ $ % $ $ % $ Overhead per Service Hour $ 5.22 $ % $ 4.47 $ % $ 7.77 $ % $ 5.68 $ % $ 9.79 Lease/Amortization per Service Hour $ 5.62 $ % $ 5.62 $ % $ 7.77 $ % $ 6.17 $ % $ 5.23 Net Cost per Service Hour (CUTA) $ 3.23 $ % $ 7.92 $ % $ $ % $ $ % $ % Cost Recovery (CUTA) 94% 76% 86% 76% 60% 76% 79% 76% 67% Ridership 56,676 62, % 58,460 65, % 42,558 46, % 157, , % 232,260 Service Hours 1, % 1, % % 2,851 2, % 4,425 Ridership per Service Hour % % % % 52 Q Q KPI 2017 Oct 2017 Oct Oct 2017 Nov 2017 Nov Nov 2017 Dec 2017 Dec Dec 2017 Q Q4 Q Q4 ACTUAL Budget COMP ACTUAL Budget COMP ACTUAL Budget COMP ACTUAL Budget COMP ACTUAL % % % % Revenue per Service Hour $ $ % $ $ % $ $ % $ $ % $ Gross Cost per Service Hour $ $ % $ $ % $ $ % $ $ % $ Direct Operating Cost per Service Hour $ $ % $ $ % $ $ % $ $ % $ Overhead per Service Hour $ 9.26 $ % $ $ % $ 2.75 $ % $ $ % $ 5.18 Lease/Amortization per Service Hour $ $ % $ $ % $ $ % $ $ % $ 8.11 Net Cost per Service Hour (CUTA) $ (0.96) $ % $ $ % $ $ % $ $ % $ % Cost Recovery (CUTA) 101% 87% 79% 87% 87% 87% 88% 87% 49% Ridership 26,313 25, % 21,934 21, % 28,192 29, % 76,439 75, % 130,359 Service Hours % % % 1,574 1, % 3,148 Ridership per Service Hour % % % % 41
36 Bow Valley Regional Transit Services Commission Banff Local Service - Route Monthly Budget/Actual KPIs with 2016 Actuals TOTAL 2017 KPI 2017 TOTAL 2017 TOTAL TOTAL 2016 TOTAL ACTUAL Budget COMP ACTUAL % Revenue per Service Hour $ $ % $ Gross Cost per Service Hour $ $ % $ Direct Operating Cost per Service Hour $ $ % $ Overhead per Service Hour $ 7.84 $ % $ 7.81 Lease/Amortization per Service Hour $ 8.79 $ % $ 7.30 Net Cost per Service Hour (CUTA) $ 9.35 $ % $ % Cost Recovery (CUTA) 88% 83% 64% Ridership 426, , % 647,197 Service Hours 7,676 7, % 13,972 Ridership per Service Hour % 46
37 BVRTSC Approved Budget Bow Valley Regional Transit Services Commission Banff Local Service - Route Monthly Budget/Actual KPIs with 2016 Actuals Q KPI 2017 Jan 2017 Jan Jan 2017 Feb 2017 Feb Feb 2017 Mar 2017 Mar Mar 2017 Q Q1 Q Q1 ACTUAL Budget COMP ACTUAL Budget COMP ACTUAL Budget COMP ACTUAL Budget COMP ACTUAL % % % % Revenue per Service Hour $ $ % $ $ % $ $ % $ $ % $ Gross Cost per Service Hour $ $ % $ $ % $ $ % $ $ % $ Direct Operating Cost per Service Hour $ $ % $ $ % $ $ % $ $ % $ Overhead per Service Hour $ 9.55 $ % $ 9.36 $ % $ 7.64 $ % $ 8.85 $ % $ 8.60 Lease/Amortization per Service Hour $ $ % $ $ % $ $ % $ $ % $ 8.48 Net Cost per Service Hour (CUTA) $ $ % $ $ % $ $ % $ $ % $ % Cost Recovery (CUTA) 56% 34% 46% 34% 47% 34% 50% 34% 65% Ridership 23,694 21, % 24,453 21, % 24,496 21, % 72,643 65, % 133,335 Service Hours % % % 1,574 1, % 3,148 Ridership per Service Hour % % % % 42 Q KPI 2017 Apr 2017 Apr April 2017 May 2017 May May 2017 Jun 2017 Jun June 2017 Q Q2 Q Q2 ACTUAL Budget COMP ACTUAL Budget COMP ACTUAL Budget COMP ACTUAL Budget COMP ACTUAL % % % % Revenue per Service Hour $ $ % $ $ % $ $ % $ $ % $ Gross Cost per Service Hour $ $ % $ $ % $ $ % $ $ % $ Direct Operating Cost per Service Hour $ $ % $ $ % $ $ % $ $ % $ Overhead per Service Hour $ 9.97 $ % $ 8.02 $ % $ 5.98 $ % $ 7.90 $ % $ 9.06 Lease/Amortization per Service Hour $ $ % $ $ % $ $ % $ $ % $ 8.21 Net Cost per Service Hour (CUTA) $ $ % $ $ % $ $ % $ $ % $ % Cost Recovery (CUTA) 42% 38% 55% 44% 75% 47% 58% 43% 63% Ridership 18,878 18, % 24,919 24, % 29,851 28, % 73,648 71, % 151,243 Service Hours % % % 1,574 1, % 3,251 Ridership per Service Hour % % % % 47
38 BVRTSC Approved Budget Bow Valley Regional Transit Services Commission Banff Local Service - Route Monthly Budget/Actual KPIs with 2016 Actuals Q KPI 2017 Jul 2017 Jul July 2017 Aug 2017 Aug Aug 2017 Sept 2017 Sep Sept 2017 Q Q3 Q Q3 ACTUAL Budget COMP ACTUAL Budget COMP ACTUAL Budget COMP ACTUAL Budget COMP ACTUAL % % % % Revenue per Service Hour $ $ % $ $ % $ $ % $ $ % $ Gross Cost per Service Hour $ $ % $ $ % $ $ % $ $ % $ Direct Operating Cost per Service Hour $ $ % $ $ % $ $ % $ $ % $ Overhead per Service Hour $ 4.96 $ % $ 4.08 $ % $ 7.16 $ % $ 4.93 $ % $ 9.79 Lease/Amortization per Service Hour $ 9.43 $ % $ 9.04 $ % $ 9.27 $ % $ 8.53 $ % $ 5.23 Net Cost per Service Hour (CUTA) $ (0.86) $ % $ $ % $ $ % $ $ % $ % Cost Recovery (CUTA) 101% 65% 74% 65% 44% 65% 68% 65% 67% Ridership 38,958 39, % 40,767 39, % 30,882 29, % 110, , % 232,260 Service Hours % % % 1,862 1, % 4,425 Ridership per Service Hour % % % % 52 Q KPI 2017 Oct 2017 Oct Oct 2017 Nov 2017 Nov Nov 2017 Dec 2017 Dec Dec 2017 Q Q4 Q Q4 ACTUAL Budget COMP ACTUAL Budget COMP ACTUAL Budget COMP ACTUAL Budget COMP ACTUAL % % % % Revenue per Service Hour $ $ % $ $ % $ $ % $ $ % $ Gross Cost per Service Hour $ $ % $ $ % $ $ % $ $ % $ Direct Operating Cost per Service Hour $ $ % $ $ % $ $ % $ $ % $ Overhead per Service Hour $ 9.26 $ % $ $ % $ 2.75 $ % $ $ % $ 5.18 Lease/Amortization per Service Hour $ $ % $ $ % $ $ % $ $ % $ 8.11 Net Cost per Service Hour (CUTA) $ $ % $ $ % $ $ % $ $ % $ % Cost Recovery (CUTA) 43% 35% 38% 35% 37% 35% 39% 35% 49% Ridership 17,010 16, % 16,579 17, % 24,626 16, % 58,215 58, % 130,359 Service Hours % % % 1,574 1, % 3,148 Ridership per Service Hour % % % % 41
39 BVRTSC Approved Budget Bow Valley Regional Transit Services Commission Banff Local Service - Route Monthly Budget/Actual KPIs with 2016 Actuals TOTAL 2017 KPI 2017 TOTAL 2017 TOTAL 2017 Total 2016 TOTAL ACTUAL Budget COMP ACTUAL % Revenue per Service Hour $ $ % $ Gross Cost per Service Hour $ $ % $ Direct Operating Cost per Service Hour $ $ % $ Overhead per Service Hour $ 7.83 $ % $ 7.81 Lease/Amortization per Service Hour $ 9.96 $ % $ 7.30 Net Cost per Service Hour (CUTA) $ $ % $ % Cost Recovery (CUTA) 53% 44% 64% Ridership 315, , % 647,197 Service Hours 6,584 6, % 13,972 Ridership per Service Hour % 46
40 Bow Valley Regional Transit Services Commission CB Regional Service - Route Monthly Budget/Actual KPIs with 2016 Actuals Q KPI 2017 Jan 2017 Jan Jan 2017 Feb 2017 Feb Feb 2017 Mar 2017 Mar Mar 2017 Q Q1 Q Q1 ACTUAL Budget COMP ACTUAL Budget COMP ACTUAL Budget COMP ACTUAL Budget COMP ACTUAL % % % % Revenue per Service Hour $ $ % $ $ % $ $ % $ $ % $ Gross Cost per Service Hour $ $ % $ $ % $ $ % $ $ % $ Direct Operating Cost per Service Hour $ $ % $ $ % $ $ % $ $ % $ Overhead per Service Hour $ 9.67 $ % $ 9.48 $ % $ 7.73 $ % $ 8.96 $ % $ 9.52 Lease/Amortization per Service Hour $ $ % $ $ % $ $ % $ $ % $ Net Cost per Service Hour (CUTA) $ $ % $ $ % $ $ % $ $ % $ 8.07 % Cost Recovery (CUTA) 74% 52% 72% 52% 79% 52% 75% 52% 90% Ridership 9,503 8, % 9,300 8, % 11,052 8, % 29,855 24, % 24,720 Service Hours % % % 1,825 1, % 1,362 Ridership per Service Hour % % % % 18 Q KPI 2017 Apr 2017 Apr April 2017 May 2017 May May 2017 Jun 2017 Jun June 2017 Q Q2 Q Q2 ACTUAL Budget COMP ACTUAL Budget COMP ACTUAL Budget COMP ACTUAL Budget COMP ACTUAL % % % % Revenue per Service Hour $ $ % $ $ % $ $ % $ $ % $ Gross Cost per Service Hour $ $ % $ $ % $ $ % $ $ % $ Direct Operating Cost per Service Hour $ $ % $ $ % $ $ % $ $ % $ Overhead per Service Hour $ $ % $ 7.91 $ % $ 6.01 $ % $ 7.92 $ % $ 8.41 Lease/Amortization per Service Hour $ $ % $ $ % $ $ % $ $ % $ Net Cost per Service Hour (CUTA) $ $ % $ $ % $ (15.66) $ % $ $ % $ % Cost Recovery (CUTA) 58% 68% 66% 68% 117% 68% 79% 68% 60% Ridership 9,489 9, % 11,841 9, % 12,691 9, % 34,021 28, % 27,867 Service Hours % % % 1,825 1, % 1,679 Ridership per Service Hour % % % % 17
41 Bow Valley Regional Transit Services Commission CB Regional Service - Route Monthly Budget/Actual KPIs with 2016 Actuals Q KPI 2017 Jul 2017 Jul July 2017 Aug 2017 Aug Aug 2017 Sept 2017 Sep Sept 2017 Q Q3 Q Q3 ACTUAL Budget COMP ACTUAL Budget COMP ACTUAL Budget COMP ACTUAL Budget COMP ACTUAL % % % % Revenue per Service Hour $ $ % $ $ % $ $ % $ $ % $ Gross Cost per Service Hour $ $ % $ $ % $ $ % $ $ % $ Direct Operating Cost per Service Hour $ $ % $ $ % $ $ % $ $ % $ Overhead per Service Hour $ 5.11 $ % $ 4.38 $ % $ 7.92 $ % $ 5.72 $ % $ Lease/Amortization per Service Hour $ $ % $ $ % $ $ % $ $ % $ Net Cost per Service Hour (CUTA) $ 0.32 $ % $ 8.13 $ % $ $ % $ $ % $ % Cost Recovery (CUTA) 100% 82% 92% 82% 59% 82% 82% 82% 85% Ridership 13,258 11, % 12,788 11, % 11,725 11, % 37,771 34, % 31,428 Service Hours % % % 1,825 1, % 1,825 Ridership per Service Hour % % % % 17 Q KPI 2017 Oct 2017 Oct Oct 2017 Nov 2017 Nov Nov 2017 Dec 2017 Dec Dec 2017 Q Q4 Q Q4 ACTUAL Budget COMP ACTUAL Budget COMP ACTUAL Budget COMP ACTUAL Budget COMP ACTUAL % % % % Revenue per Service Hour $ $ % $ $ % $ $ % $ $ % $ Gross Cost per Service Hour $ $ % $ $ % $ $ % $ $ % $ Direct Operating Cost per Service Hour $ $ % $ $ % $ $ % $ $ % $ Overhead per Service Hour $ 9.37 $ % $ $ % $ 2.79 $ % $ $ % $ 4.27 Lease/Amortization per Service Hour $ $ % $ $ % $ $ % $ $ % $ Net Cost per Service Hour (CUTA) $ $ % $ 2.31 $ % $ $ % $ $ % $ % Cost Recovery (CUTA) 56% 66% 98% 66% 87% 66% 82% 66% 66% Ridership 11,731 9, % 12,438 9, % 12,190 9, % 36,359 27, % 30,290 Service Hours % % % 1,825 1, % 1,825 Ridership per Service Hour % % % % 17
42 Bow Valley Regional Transit Services Commission CB Regional Service - Route Monthly Budget/Actual KPIs with 2016 Actuals 2017 TOTAL TOTAL TOTAL Total 2016 TOTAL KPI ACTUAL Budget COMP ACTUAL % Revenue per Service Hour $ $ % $ Gross Cost per Service Hour $ $ % $ Direct Operating Cost per Service Hour $ $ % $ Overhead per Service Hour $ 8.21 $ % $ 7.81 Lease/Amortization per Service Hour $ $ % $ Net Cost per Service Hour (CUTA) $ $ % $ % Cost Recovery (CUTA) 80% 67% 77% Ridership 138, , % 114,305 Service Hours 7,300 7, % 6,691 Ridership per Service Hour % 17
43 Bow Valley Regional Transit Services Commission Canmore Local Service - Route Monthly Budget/Actual KPIs with 2016 Actuals Q KPI 2017 Jan 2017 Jan Jan 2017 Feb 2017 Feb Feb 2017 Mar 2017 Mar Mar 2017 Q Q1 Q Q1 ACTUAL Budget COMP ACTUAL Budget COMP ACTUAL Budget COMP ACTUAL Budget COMP ACTUAL % % % % Revenue per Service Hour $ $ % $ $ % $ $ % $ $ % Gross Cost per Service Hour $ $ % $ $ % $ $ % $ $ % Direct Operating Cost per Service Hour $ $ % $ $ % $ $ % $ $ % Overhead per Service Hour $ 9.42 $ % $ 9.23 $ % $ 7.53 $ % $ 8.73 $ % Lease/Amortization per Service Hour $ $ % $ $ % $ $ % $ $ % Net Cost per Service Hour (CUTA) $ $ % $ $ % $ $ % $ $ % % Cost Recovery (CUTA) 59% 27% 12% 27% 16% 27% 30% 27% Ridership 6,571 7, % 6,028 7, % 7,291 7, % 19,890 22, % Service Hours % % % 1,874 1, % Ridership per Service Hour % % % % Q KPI 2017 Apr 2017 Apr April 2017 May 2017 May May 2017 Jun 2017 Jun June 2017 Q Q2 Q Q2 ACTUAL Budget COMP ACTUAL Budget COMP ACTUAL Budget COMP ACTUAL Budget COMP ACTUAL % % % % Revenue per Service Hour $ 9.77 $ % $ $ % $ $ % $ $ % Gross Cost per Service Hour $ $ % $ $ % $ $ % $ $ % Direct Operating Cost per Service Hour $ $ % $ $ % $ $ % $ $ % Overhead per Service Hour $ 9.83 $ % $ 8.02 $ % $ 5.86 $ % $ 7.82 $ % Lease/Amortization per Service Hour $ $ % $ $ % $ $ % $ $ % Net Cost per Service Hour (CUTA) $ $ % $ $ % $ $ % $ $ % % Cost Recovery (CUTA) 10% 33% 12% 33% 18% 33% 13% 33% Ridership 4,585 9, % 6,228 9, % 6,414 9, % 17,227 28, % Service Hours % % % 1,874 1, % Ridership per Service Hour % % % %
44 Bow Valley Regional Transit Services Commission Canmore Local Service - Route Monthly Budget/Actual KPIs with 2016 Actuals Q KPI 2017 Jul 2017 Jul July 2017 Aug 2017 Aug Aug 2017 Sept 2017 Sep Sept 2017 Q Q3 Q Q3 ACTUAL Budget COMP ACTUAL Budget COMP ACTUAL Budget COMP ACTUAL Budget COMP ACTUAL % % % % Revenue per Service Hour $ $ % $ $ % $ 7.97 $ % $ $ % Gross Cost per Service Hour $ $ % $ $ % $ $ % $ $ % Direct Operating Cost per Service Hour $ $ % $ $ % $ $ % $ $ % Overhead per Service Hour $ 5.25 $ % $ 4.50 $ % $ 7.71 $ % $ 5.76 $ % Lease/Amortization per Service Hour $ $ % $ $ % $ $ % $ $ % Net Cost per Service Hour (CUTA) $ $ % $ $ % $ $ % $ $ % % Cost Recovery (CUTA) 16% 41% 12% 41% 8% 41% 11% 41% Ridership 6,088 11, % 6,164 11, % 5,533 11, % 17,785 34, % Service Hours % % % 1,874 1, % Ridership per Service Hour % % % % Q KPI 2017 Oct 2017 Oct Oct 2017 Nov 2017 Nov Nov 2017 Dec 2017 Dec Dec 2017 Q Q4 Q Q4 ACTUAL Budget COMP ACTUAL Budget COMP ACTUAL Budget COMP ACTUAL Budget COMP ACTUAL % % % % Revenue per Service Hour $ 8.35 $ % $ $ % $ $ % $ $ % Gross Cost per Service Hour $ $ % $ $ % $ $ % $ $ % Direct Operating Cost per Service Hour $ $ % $ $ % $ $ % $ $ % Overhead per Service Hour $ 9.12 $ % $ $ % $ 2.71 $ % $ $ % Lease/Amortization per Service Hour $ $ % $ $ % $ $ % $ $ % Net Cost per Service Hour (CUTA) $ $ % $ $ % $ $ % $ $ % % Cost Recovery (CUTA) 13% 32% 18% 32% 18% 32% 16% 32% Ridership 6,263 8, % 7,723 8, % 7,288 8, % 21,274 26, % Service Hours % % % 1,875 1, % Ridership per Service Hour % % % %
45 Bow Valley Regional Transit Services Commission Canmore Local Service - Route Monthly Budget/Actual KPIs with 2016 Actuals 2017 TOTAL TOTAL TOTAL Total 2016 TOTAL KPI ACTUAL Budget COMP ACTUAL % Revenue per Service Hour $ $ % Gross Cost per Service Hour $ $ % Direct Operating Cost per Service Hour $ $ % Overhead per Service Hour $ 8.08 $ % Lease/Amortization per Service Hour $ $ % Net Cost per Service Hour (CUTA) $ $ % % Cost Recovery (CUTA) 18% 33% Ridership 76, , % Service Hours 7,497 7, % Ridership per Service Hour %
46 Bow Valley Regional Transit Services Commission Cave and Basin - Route Monthly Budget/Actual KPIs with 2016 Actuals Q KPI 2017 Apr 2017 Apr April 2017 May 2017 May May 2017 Jun 2017 Jun June 2017 Q Q2 Q Q2 ACTUAL Budget COMP ACTUAL Budget COMP ACTUAL Budget COMP ACTUAL Budget COMP ACTUAL % % % % Revenue per Service Hour #DIV/0! #DIV/0! #DIV/0! $ $ % $ $ % $ $ % Gross Cost per Service Hour #DIV/0! #DIV/0! #DIV/0! $ $ % $ $ % $ $ % Direct Operating Cost per Service Hour #DIV/0! #DIV/0! #DIV/0! $ $ - #DIV/0! $ $ - #DIV/0! $ $ - #DIV/0! Overhead per Service Hour #DIV/0! #DIV/0! #DIV/0! $ 9.78 $ % $ 4.98 $ % $ 6.65 $ % Lease/Amortization per Service Hour #DIV/0! #DIV/0! #DIV/0! $ 2.15 $ % $ 1.26 $ % $ 1.46 $ % Net Cost per Service Hour (CUTA) #DIV/0! #DIV/0! #DIV/0! $ $ % $ $ % $ $ % % Cost Recovery (CUTA) #DIV/0! #DIV/0! 12% 61% 18% 61% 12% 41% Ridership #DIV/0! #DIV/0! #DIV/0! 1,851 0 #DIV/0! Service Hours 0 0 #DIV/0! % % % Ridership per Service Hour #DIV/0! #DIV/0! #DIV/0! 15 0 #DIV/0! 7 0 #DIV/0! 10 0 #DIV/0! Q KPI 2017 Jul 2017 Jul July 2017 Aug 2017 Aug Aug 2017 Sept 2017 Sep Sept 2017 Q Q3 Q Q3 ACTUAL Budget COMP ACTUAL Budget COMP ACTUAL Budget COMP ACTUAL Budget COMP ACTUAL % % % % Revenue per Service Hour $ $ % $ $ % $ 7.01 $ - #DIV/0! $ $ % Gross Cost per Service Hour $ $ % $ $ % $ $ % $ $ % Direct Operating Cost per Service Hour $ $ % $ $ % $ $ - #DIV/0! $ $ % Overhead per Service Hour $ 4.93 $ % $ 4.23 $ % $ 7.82 $ % $ 5.57 $ % Lease/Amortization per Service Hour $ 1.26 $ % $ 1.26 $ % $ 1.57 $ % $ 1.36 $ % Net Cost per Service Hour (CUTA) $ $ % $ $ % $ $ % $ $ % % Cost Recovery (CUTA) 22% 1% 31% 1% 8% 0% 19% 1% Ridership 2,005 0 #DIV/0! 2,057 0 #DIV/0! 1,283 0 #DIV/0! 5,345 0 #DIV/0! Service Hours % % % % Ridership per Service Hour 14 0 #DIV/0! 15 0 #DIV/0! 9 0 #DIV/0! 13 0 #DIV/0!
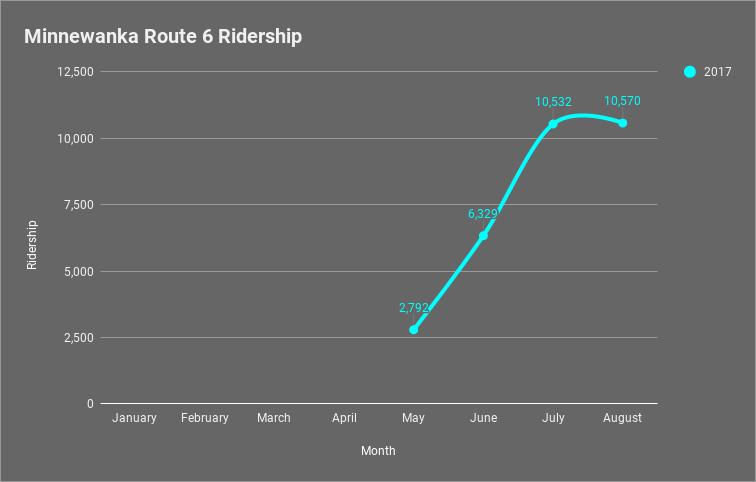
47 Bow Valley Regional Transit Services Commission Lake Minnewanka - Route Monthly Budget/Actual KPIs with 2016 Actuals Q KPI 2017 Apr 2017 Apr April 2017 May 2017 May May 2017 Jun 2017 Jun June 2017 Q Q Q Q2 ACTUAL Budget COMP ACTUAL Budget COMP ACTUAL Budget COMP ACTUAL Budget COMP ACTUAL % % % % Revenue per Service Hour #DIV/0! #DIV/0! #DIV/0! $ - $ - #DIV/0! $ - $ - #DIV/0! $ - $ - #DIV/0! Gross Cost per Service Hour #DIV/0! #DIV/0! #DIV/0! $ $ % $ $ % $ $ % Direct Operating Cost per Service Hour #DIV/0! #DIV/0! #DIV/0! $ $ % $ $ % $ $ % Overhead per Service Hour #DIV/0! #DIV/0! #DIV/0! $ 7.71 $ - #DIV/0! $ 6.05 $ - #DIV/0! $ 7.23 $ - #DIV/0! Lease/Amortization per Service Hour #DIV/0! #DIV/0! #DIV/0! $ $ % $ 9.20 $ % $ $ % Net Cost per Service Hour (CUTA) #DIV/0! #DIV/0! #DIV/0! $ $ % $ $ % $ $ % % Cost Recovery (CUTA) #DIV/0! #DIV/0! 0% 0% 0% 0% 0% 0% Ridership 0 0 #DIV/0! 2,792 4, % 6,329 8, % 9,121 12, % Service Hours 0 0 #DIV/0! % % % Ridership per Service Hour #DIV/0! #DIV/0! #DIV/0! % % % Q KPI 2017 Jul 2017 Jul July 2017 Aug 2017 Aug Aug 2017 Sept 2017 Sep Sept 2017 Q Q3 Q Q3 ACTUAL Budget COMP ACTUAL Budget COMP ACTUAL Budget COMP ACTUAL Budget COMP ACTUAL % % % % Revenue per Service Hour $ - $ - #DIV/0! $ - $ - #DIV/0! $ - $ - #DIV/0! $ - $ - #DIV/0! Gross Cost per Service Hour $ $ % $ $ % $ $ % $ $ % Direct Operating Cost per Service Hour $ $ % $ $ % $ $ % $ $ % Overhead per Service Hour $ 5.14 $ - #DIV/0! $ 4.41 $ - #DIV/0! $ 7.77 $ - #DIV/0! $ 5.54 $ - #DIV/0! Lease/Amortization per Service Hour $ 8.98 $ % $ 8.98 $ % $ $ % $ $ % Net Cost per Service Hour (CUTA) $ $ % $ $ % $ $ % $ $ % % Cost Recovery (CUTA) 0% 0% 0% 0% 0% 0% 0% 0% Ridership 10,532 10, % 10,570 10, % 2,607 4, % 23,709 24, % Service Hours % % % % Ridership per Service Hour % % % %
48 Bow Valley Regional Transit Services Commission Budget Summary - TOTAL Budgeted Annual KPIs KPI YTD ACTUAL ACTUAL Budget Budget Budget Revenue per Service Hour $ $ $ $ $ Gross Cost per Service Hour $ $ $ $ $ Direct Operating Cost per Service Hour $ $ $ $ $ Overhead per Service Hour $ 7.81 $ 7.92 $ 8.15 $ $ Lease/Amortization per Service Hour $ $ $ 9.25 $ $ Net Cost per Service Hour (CUTA) $ $ $ $ $ % Cost Recovery (CUTA) 71% 56% 54% 54% 54% Ridership 761, , ,354 1,090,659 1,195,781 Service Hours 20,663 31,100 30,864 33,189 33,189 Ridership per Service Hour
49 Bow Valley Regional Transit Services Commission Budget Summary - TOTAL 2017 Quarterly Budget KPIs with 2017 Actuals KPI 2017 Q Q Q Q Q Q Q Q Q Q Q Q TOTAL 2017 TOTAL 2016 TOTAL ACTUAL Budget ACTUAL ACTUAL Budget ACTUAL ACTUAL Budget ACTUAL ACTUAL Budget ACTUAL ACTUAL BUDGET ACTUAL Revenue per Service Hour $ $ $ $ $ $ $ $ $ $ $ $ $ $ $ $ - Gross Cost per Service Hour $ $ $ $ $ $ $ $ $ $ $ $ $ $ $ Direct Operating Cost per Service Hou$ $ $ $ $ $ $ $ $ $ $ $ $ $ $ Overhead per Service Hour $ 8.84 $ 9.18 $ 8.88 $ 7.78 $ 8.17 $ 8.84 $ 5.59 $ 6.63 $ $ $ 9.18 $ 4.84 $ 7.92 $ 8.15 $ 7.81 Lease/Amortization per Service Hour $ $ 9.87 $ $ $ 9.45 $ $ 9.62 $ 7.93 $ 7.99 $ $ $ $ $ 9.25 $ Net Cost per Service Hour (CUTA) $ $ $ $ $ $ $ $ $ $ $ $ $ $ $ % Cost Recovery (CUTA) 61% 49% 73% 55% 55% 59% 54% 59% 70% 55% 53% 59% 56% 54% 71% Ridership 205, , , , , , , , , , , , , , ,502 Service Hours 6,847 6,847 4,510 7,742 7,690 4,930 9,663 9,480 6,250 6,848 6,847 4,973 31,100 30,864 20,663 Ridership per Service Hour
50 Bow Valley Regional Transit Services Commission Budget Summary - Banff Local Service - ROUTE Budgeted Annual KPIs routes 1 and 2 route 1 route 1 KPI ACTUAL ACTUAL Budget Budget Budget Revenue per Service Hour $ $ $ $ $ Gross Cost per Service Hour $ $ $ $ $ Direct Operating Cost per Service Hou $ $ $ $ $ Overhead per Service Hour $ 7.81 $ 7.84 $ 8.74 $ $ Lease/Amortization per Service Hour $ 7.30 $ 8.79 $ 6.63 $ $ Net Cost per Service Hour (CUTA) $ $ 9.35 $ $ $ % Cost Recovery (CUTA) 64% 88% 83% 69% 69% Ridership 647, , , , ,059 Service Hours 13,972 7,676 7,676 8,308 8,308 Ridership per Service Hour
51 BVRTSC Approved Budget Bow Valley Regional Transit Services Commission Budget Summary - Banff Local Service - ROUTE Budgeted Annual KPIs routes 1 and 2 route 2 route 2 KPI YTD ACTUAL ACTUAL Budget Budget Budget Revenue per Service Hour $ $ $ $ $ Gross Cost per Service Hour $ $ $ $ $ Direct Operating Cost per Service Hou $ $ $ $ $ Overhead per Service Hour $ 7.81 $ 7.83 $ 9.18 $ $ Lease/Amortization per Service Hour $ 7.30 $ 9.96 $ 7.90 $ $ Net Cost per Service Hour (CUTA) $ $ $ $ $ % Cost Recovery (CUTA) 64% 53% 44% 42% 42% Ridership 647, , , , ,166 Service Hours 13,972 6,584 6,296 7,244 7,244 Ridership per Service Hour
52 Bow Valley Regional Transit Services Commission Budget Summary - Canmore/Banff Regional - ROUTE Budgeted Annual KPIs KPI YTD ACTUAL ACTUAL Budget Budget Budget Revenue per Service Hour $ $ $ $ $ Gross Cost per Service Hour $ $ $ $ $ Direct Operating Cost per Service Hou $ $ $ $ $ Overhead per Service Hour $ 7.81 $ 8.21 $ 9.18 $ $ Lease/Amortization per Service Hour $ $ $ $ $ Net Cost per Service Hour (CUTA) $ $ $ $ $ % Cost Recovery (CUTA) 77% 80% 67% 64% 64% Ridership 114, , , , ,949 Service Hours 6,691 7,300 7,300 7,953 7,953 Ridership per Service Hour
53 Bow Valley Regional Transit Services Commission Budget Summary - Canmore Local Service - ROUTE Budgeted Annual KPIs KPI YTD ACTUAL ACTUAL Budget Budget Budget Revenue per Service Hour $ $ $ $ Gross Cost per Service Hour $ $ $ $ Direct Operating Cost per Service Hour $ $ $ $ Overhead per Service Hour $ 8.08 $ 9.18 $ $ Lease/Amortization per Service Hour $ $ $ $ Net Cost per Service Hour (CUTA) $ - $ $ $ $ % Cost Recovery (CUTA) 18% 33% 25% 25% Ridership 76, ,000 92,500 94,350 Service Hours 7,497 7,496 7, Ridership per Service Hour NA

54 Token Transit Title Page
55 Request for Decision Report Submitter: Steve Nelson Date of Summary: February 27 th,2018 Title of Initiative: Cashless Fare/Mobile Ticketing Technology Objective To enter into a pilot program agreement for 1 year with Token Transit Inc. to provide BVRTSC customers with mobile ticketing and pass distribution. Administration Recommendation That the Commission authorizes Administration to enter into a 1-year service agreement with Token Transit Inc. for the provision of a mobile ticketing pilot program for BVRTSC customers. Summary BVRTSC currently offers is customers the ability to pay for single ride and multiple ride fares in a variety of ways including cash on the bus, the purchase of Smart Cards at select vendor locations, town halls and at the BVRTSC Office in Banff. For some time now, BVRTSC has heard from customers that we are missing the ability to purchase fares/passes online and on the bus using credit cards or debit cards. BVRTSC Administration has reached out to numerous fare providers to enquire about potential options for mobile ticketing solutions, and they typically involve expensive hardware to be installed on each of the Roam buses, as well as some backend IT infrastructure required at each transit garage. BVRTSC contacted Token Transit Inc. of Delaware, and discovered their solution is a software App based solution requiring no upfront investment costs in hardware, and no back-end IT integration. This solution would allow BVRTSC to provide mobile fare ticketing for all it s routes 1

56 and buses at minimal cost, while still integrating fare/ridership information with our current farebox technology. A brief overview of how the solution works: Roam customers download the Token Transit App to their device. Enter their credit card or debit card information. Choose the Roam fare type they wish to purchase and confirm their purchase. Activate their fare prior to boarding a Roam bus. (Monthly, single trip etc.) Show the uniquely generated ticket to the Roam Driver. o The Roam driver confirms the validity of the ticket and records the trip on Roam s existing smart fareboxes. Vendor Background What is Token Transit/Mobile Ticketing? Token Transit is a mobile ticketing app that lets customers pay for and ride public transit with their phone. Token Transit accepts credit, debit or a prepaid debit cards as forms of payment. All personal and credit card information is securely stored, using encrypted Payment Card Industry Data Security Standard (PCI DSS) compliant servers. Token Transit sends payment receipts to addresses registered to a user s account. A short video is available here to view how Token Transit works. 2


57 Commission members are encouraged to try the Token Transit App for yourself. Download Token Transit from the app store in one of three ways: Search for Token Transit in the App or Play Store Text TOKEN to for a download link Visit tokentransit.com/app In addition to the information collected by Roam s existing smart fareboxes, Token Transit provides an administrative dashboard to report the detailed sales and ridership analytics showing use of Token Transit passes based on the location of the user/app. Cost to Implement The cost to implement the Token Transit solution is based on a percentage of each fare purchase. 10% of each fare purchase is collected by Token Transit, and the remaining 90% is collected and forwarded to BVRTSC each month. All bank or credit card transaction fees are included in the 10% Token Transit fee. There are zero capital costs associated for hardware with this pilot project. There will be some costs to print information/promotional materials. Resources Required to Implement Token Transit handles all implementation tasks of rolling out this mobile ticketing solution. Token Transit also provides robust marketing materials that BVRTSC can use in the promotion of the new service. Token Transit provides standard marketing material templates that we will customize for your agency. 3


58 Materials provided: King/Queen Panels Interior Panels/Posters Bench Ads Wallet-sized Marketing Cards Resources Required to Maintain The Token Transit App is maintained by Token Transit, and all customer service issues related to the fares purchased and the App itself are managed by Token Transit. Essentially this is a service provided to the public, integrated with some backend BVRTSC security features to ensure tickets presented to Roam drivers are valid. Transfer of Funds Token Transit works with 3rd party payment processor Stripe to handle all payment processing. Stripe has been audited by a PCI-certified auditor and is certified to PCI Service Provider Level 1. This is the most stringent level of certification available in the payments industry. The process is simple and secure. 1. Agency provides Token Transit with financial information for fund transfers. 2. Agency receives sales revenue from Token Transit app. 3. Token Transit sends Agency bank transfer reports when revenue is reconciled. Token Transit automatically generates bank transfer reports with a detailed record of all sales in 4

59 each bank transfer. These reports can be delivered to the agency by or uploaded via FTP: Reports are ed to a custom list of recipients. Each will contain a high-level overview and attached CSV files containing aggregate sales, individual sales, and individual refunds. FTP: Reports are uploaded via FTP to a provided FTP server with a username/password. The session can be encrypted via SSL depending on server configuration. Three CSV files containing aggregate sales, individual sales, and individual refunds will be uploaded. In the Agency Web Portal, agency finance departments will be able to see when transfer reports are created and resend the reports to their . They will also be able to contact Token Transit directly if they have any questions. Agencies will also be able to see each day s sales, gross sales and passes sold, with up to date information and see past sales trends and download a.csv for reports for specific dates. 5


60 And adjust and edit fare offerings anytime for special events or scheduled fare changes. And have the capability to issue a refund or suspend a specific user. 6


61 Risk Management This mobile ticketing solution is offered to the public as a service by way of a signed 1-year service agreement between BVRTSC and Token Transit. Clear information would be presented in all BVRTSC marketing materials making it clear that should customers choose to participate in this 1-year pilot project for mobile ticketing, they are in fact entering into agreement with a 3 rd party service provider Token Transit. BVRTSC/Roam is then accepting their mobile ticket as payment for Roam transit service/travel. The mobile tickets produced by Token Transit and pushed to customers are unique from one day to the next and feature animated text with current date/time display. BVRTSC provides unique images to Token Transit, along with the different fare types that can be purchases (Banff Local Senior Monthly Pass for example). Token Transit then creates a backend dashboard to randomly combine the photos provided with a unique background colour, and animated text showing the current date/time. Every day, each Token Transit pass will be a unique photo and background colour, that our Roam operators will be aware of, through the use of a driver office display monitor. Example of a unique animated Ticket to be shown to driver it s unique that it s the mountain image, with a blue background for Feb 27 at 1138AM. 7

62 Example of a Roam Driver monitor in each Roam garage office - Drivers can see on the screen each day what to expect on a Token Transit Ticket. In the example below, Friday Sept 1 st 2017, all Token Transit mobile tickets would be a green background and an image of a museum. Roam would supply local images from Canmore/Banff to be used on all tickets. Financial Impact As mentioned earlier in this report, Token Transit withholds 10% of fares purchased through their app. It is anticipated that the 10% in fare revenue loss would be minimized by a couple factors. A reduction in cash processing fees with Brinks; the potential increase in ridership due to ease of use and fare payment; a reduction in the number of Smart Cards needed to be purchased, coded, processed. Passengers could now choose to use their phone instead of a smart card. Administration would review the impact to revenues after the first 6 months of the 1-year pilot project to identify any impacts revenues. Next Steps Enter into agreement with Token Transit for a 1-year pilot program to evaluate the uptake of a mobile ticketing option. Provide Token Transit with the information and imagery they require to start implementation of a mobile ticketing solution for Roam. Work with our Marketing and Communications Administrator to coordinate messaging to the public with a planned roll out for May Coordinate the marketing material provided by Token Transit to ensure Roam Brand Standards are tightly integrated. Work with our staff to train and familiarize them with the new fare option. 8
BOW VALLEY REGIONAL TRANSIT SERVICES COMMISSION REGULAR MEETING. BVRTSC Boardroom, Banff. AGENDA July 14, 2016: 2:00 4:00 pm
 BOW VALLEY REGIONAL TRANSIT SERVICES COMMISSION REGULAR MEETING BVRTSC Boardroom, Banff AGENDA July 14, 2016: 2:00 4:00 pm 1. Call to Order 2. Approval of the Agenda 3. Approval of the June 8, 2016 Regular
BOW VALLEY REGIONAL TRANSIT SERVICES COMMISSION REGULAR MEETING. BVRTSC Boardroom 221 Beaver Street, Banff, AB. AGENDA
 BOW VALLEY REGIONAL TRANSIT SERVICES COMMISSION REGULAR MEETING BVRTSC Boardroom 221 Beaver Street, Banff, AB. AGENDA September 12th, 2018 2:00-4:00pm 1. Call to Order 2. Approval of the Agenda 3. Minutes
Operating Budget. Third Quarter Financial Report (July 2005 March 2006)
") Third Quarter Financial Report (July 2005 March 2006) INDEX A. Executive Summary...page 2 B. Revenue and Expense Analysis...page 3 C. Budget Variance Reports...page 14 D. Ridership and Performance Measures...page
Third Quarter Financial Report (July 2005 March 2006) INDEX A. Executive Summary...page 2 B. Revenue and Expense Analysis...page 3 C. Budget Variance Reports...page 14 D. Ridership and Performance Measures...page
METRO MONTHLY BOARD REPORT
 METRO Revenue Expenses Service Performance Fiscal Year FY2011 Table of Contents Section A Section B Section C Section D Section E Section F Section G Section H Summary Sales Tax Revenue Fare Revenue Operating
METRO. Fiscal Year 2012 Monthly Board Report. December 2011 (First Quarter Fiscal Year-to-Date)
") METRO Fiscal Year 2012 Monthly Board Report Revenue Expense Ridership Performance (First Quarter Fiscal Year-to-Date) 1/27/2012 Table of Contents Section A Section B Section C Section D Section E Section
METRO Fiscal Year 2012 Monthly Board Report Revenue Expense Ridership Performance (First Quarter Fiscal Year-to-Date) 1/27/2012 Table of Contents Section A Section B Section C Section D Section E Section
METRO. Fiscal Year 2014 Monthly Board Report. May 2014
 METRO Fiscal Year 2014 Monthly Board Report Revenue Expense Ridership Performance 7/11/2014 Table of Contents Section A Section B Section C Section D Section E Section F Section G Section H Section I Section
METRO. Fiscal Year 2012 Monthly Board Report. September 2012 (Fourth Quarter Fiscal Year-to-Date)
") METRO Fiscal Year 2012 Monthly Board Report Revenue Expense Ridership Performance (Fourth Quarter Fiscal Year-to-Date) This report is based on a preliminary closing of the year-end financials for FY2012
METRO Fiscal Year 2012 Monthly Board Report Revenue Expense Ridership Performance (Fourth Quarter Fiscal Year-to-Date) This report is based on a preliminary closing of the year-end financials for FY2012
METRO. Monthly Board Report. June 2006
 METRO Monthly Board Report Operating Capital Service Performance June 26 7/17/26 June 26 MONTHLY BOARD REPORT INDEX Section A Section B Section C Section D Section E Section F Section G Operating Budget
Budget Process Overview and Cost Allocation Methodology
 Budget Process Overview and Cost Allocation Methodology 1 Cost Allocation Agreement Guiding Principles Operate a consolidated regional public transportation system within and between the Participating
Examples of FTA Eligible Revenues by Category
 Examples of FTA Eligible Revenues by Category A. TRANSPORTATION REVENUES DESCRIPTION OF REVENUES Includes regular and discounted cash fares, pre-purchased tickets or tokens, and cash contributions or donations
Operating Budget Stability
 Operating Budget Stability March Financial Update Report to Agenda Executive Summary March Performance Against FY16 Budget March Performance Against Same Period Last Year Appendix Financial Detail: March
1. Summary E&S is in the process of completing the internal compliance reviews for Q1 through Q3 of FY17.
 NAHAC FINANCE SUMMARY Prepared By: Chantell Legacy Date Prepared: 11/21/2017 1. Summary E&S is in the process of completing the internal compliance reviews for Q1 through Q3 of FY17. 2. Finance Report
METRO. Fiscal Year 2017 Monthly Performance Report. Revenue Expense Ridership Performance. October 2016
 METRO Fiscal Year 2017 Monthly Performance Report Revenue Expense Ridership Performance 11/18/2016 Table of Contents Section A Section B Section C Section D Section E Section F Section G Section H Section
METRO. Fiscal Year 2013 Monthly Board Report. January 2013
 METRO Fiscal Year 2013 Monthly Board Report Revenue Expense Ridership Performance 2/14/2013 Table of Contents Section A Section B Section C Section D Section E Section F Section G Section H Section I Section
Review of Membership Developments
 RIPE Network Coordination Centre Review of Membership Developments 7 October 2009/ GM / Lisbon http://www.ripe.net 1 Applications development RIPE Network Coordination Centre 140 120 100 80 60 2007 2008
METRO. Fiscal Year Monthly Performance Report. Revenue Expense Ridership Performance. February 2018 (First Quarter Fiscal Year-to Date)
") METRO Fiscal Year 2018 Monthly Performance Report Revenue Expense Ridership Performance (First Quarter Fiscal Year-to Date) 3/12/2018 Table of Contents Section A Section B Section C Section D Section E
METRO Fiscal Year 2018 Monthly Performance Report Revenue Expense Ridership Performance (First Quarter Fiscal Year-to Date) 3/12/2018 Table of Contents Section A Section B Section C Section D Section E
Cash & Liquidity The chart below highlights CTA s cash position at December 2017 compared to December 2016.
 To: Chicago Transit Authority Board From: Jeremy Fine, Chief Financial Officer Re: Financial Results for December 2017 Date: February 14, 2018 I. Summary CTA s financial results are $4.7 million favorable
Greater Portland Transit District 114 Valley Street Portland ME 04102
 Greater Portland Transit District 114 Valley Street Portland ME 04102 November 1, 2017 [SUBMITTED BY E-MAIL] Nathan Poore Town Manager Town of Falmouth 271 Falmouth Road Falmouth, ME 04105 Re: Preliminary
NATIONAL PTA. FINANCIAL STATEMENTS September (Unaudited)
") NATIONAL PTA FINANCIAL STATEMENTS September 2016 TABLE OF CONTENTS Executive Summary 1 National PTA Statement of Financial Position A 1 Statement of Net Assets A 4 Statement of Activities Actual vs. Budget
NATIONAL PTA FINANCIAL STATEMENTS September 2016 TABLE OF CONTENTS Executive Summary 1 National PTA Statement of Financial Position A 1 Statement of Net Assets A 4 Statement of Activities Actual vs. Budget
Cash & Liquidity The chart below highlights CTA s cash position at March 2017 compared to March 2016.
 To: Chicago Transit Authority Board From: Jeremy Fine, Chief Financial Officer Re: Financial Results for March 2017 Date: May 10, 2017 I. Summary CTA s financial results are $0.6 million favorable to budget
Capital Metropolitan Transportation Authority Monthly Performance & Financial Report For Period Ending October 31, 2012 Soft Close
 Capital Metropolitan Transportation Authority Monthly Performance & Financial Report For Period Ending October 31, 2012 Soft Close Table of Contents SUMMARY REPORT Financial Performance -Sales Tax 3 -Other
Cash & Liquidity The chart below highlights CTA s cash position at September 2017 compared to September 2016.
 To: Chicago Transit Authority Board From: Jeremy Fine, Chief Financial Officer Re: Financial Results for September 2017 Date: November 15, 2017 I. Summary CTA s financial results are $7.7 million favorable
SmallBizU WORKSHEET 1: REQUIRED START-UP FUNDS. Online elearning Classroom. Item Required Amount ($) Fixed Assets. 1 -Buildings $ 2 -Land $
 Fixed Assets. 1 -Buildings $ 2 -Land $") WORKSHEET 1: REQUIRED START-UP FUNDS Item Required Amount () Fixed Assets 1 -Buildings 2 -Land 3 -Initial Inventory 4 -Equipment 5 -Furniture and Fixtures 6 -Vehicles 7 Total Fixed Assets Working Capital
WORKSHEET 1: REQUIRED START-UP FUNDS Item Required Amount () Fixed Assets 1 -Buildings 2 -Land 3 -Initial Inventory 4 -Equipment 5 -Furniture and Fixtures 6 -Vehicles 7 Total Fixed Assets Working Capital
METRO. Fiscal Year 2013 Monthly Board Report. November 2012
 METRO Fiscal Year 2013 Monthly Board Report Revenue Expense Ridership Performance 12/13/2012 Table of Contents Section A Section B Section C Section D Section E Section F Section G Section H Section I
METRO. Fiscal Year Monthly Performance Report. Revenue Expense Ridership Performance. November 2018 (Third Quarter Fiscal Year-to Date)
") METRO Fiscal Year 2019 Monthly Performance Report Revenue Expense Ridership Performance (Third Quarter Fiscal Year-to Date) 12/12/2018 Table of Contents Section A Section B Section C Section D Section
METRO Fiscal Year 2019 Monthly Performance Report Revenue Expense Ridership Performance (Third Quarter Fiscal Year-to Date) 12/12/2018 Table of Contents Section A Section B Section C Section D Section
Cash & Liquidity The chart below highlights CTA s cash position at August 2018 compared to August 2017.
 To: Chicago Transit Authority Board From: Jeremy Fine, Chief Financial Officer Re: Financial Results for August 2018 Date: October 10, 2018 I. Summary CTA s financial results are favorable to budget for
Cash & Liquidity The chart below highlights CTA s cash position at June 2018 compared to June 2017.
 To: Chicago Transit Authority Board From: Jeremy Fine, Chief Financial Officer Re: Financial Results for June 2018 Date: August 15, 2018 I. Summary CTA s financial results are unfavorable to budget for
Charlotte County Airport Authority BUDGET WORKSHOP AGENDA August 2, :00 A.M. Punta Gorda Airport
 Authority Commissioners James Herston, Chair Robert D. Hancik, A.A.E., Vice-Chair Kathleen Coppola, Secretary/Treasurer Paul Andrews, Asst. Secretary/Treasurer Pam Seay, Commissioner C CEO James W. Parish,
METRO. Fiscal Year 2013 Monthly Board Report. December 2012 (First Quarter Fiscal Year-to-Date)
") METRO Fiscal Year 2013 Monthly Board Report Revenue Expense Ridership Performance (First Quarter Fiscal Year-to-Date) 1/14/2013 Table of Contents Section A Section B Section C Section D Section E Section
METRO Fiscal Year 2013 Monthly Board Report Revenue Expense Ridership Performance (First Quarter Fiscal Year-to-Date) 1/14/2013 Table of Contents Section A Section B Section C Section D Section E Section
VIIl. Agency Financial Plans and 12-Month Allocations
 VIIl. Agency Financial Plans and 12-Month Allocations New York City Transit MTA NEW YORK CITY TRANSIT FEBRUARY FINANCIAL PLAN FOR 2006-2009 2005 FINAL ESTIMATE AND ADOPTED BUDGET FOR 2006 In accordance
MONTHLY FINANCIAL STATUS JUNE 2018
 (Millions) MONTHLY FINANCIAL STATUS To: Dave Genova, General Manager and CEO ACTION DISCUSSION INFO From: Heather McKillop, CFO and AGM Administration x Date: July 10, VS. BUDGET YTD VS. BUDGET JUNE VS.
FY2014 Operating Budget Performance Report
 Finance & Administration Committee Information Item IV-C September 11, 2014 FY2014 Operating Budget Performance Report Washington Metropolitan Area Transit Authority Board Action/Information Summary Action
MONTHLY FINANCIAL STATUS JANUARY 2019
 (Millions) MONTHLY FINANCIAL STATUS To: Dave Genova, General Manager and CEO ACTION DISCUSSION INFO From: Heather McKillop, CFO and AGM Administration x Date: March 12, 2019 VS. BUDGET YTD 2019 VS. BUDGET
Net Quick Assets. Target = $510,050 (6 months operating expenses) 12 Month Average Monthly Operating Expenses = $85,008
 12 Month Average Monthly Operating Expenses = $85,008") $800,000 $600,000 $400,000 Net Quick Assets Target = $510,050 (6 months operating expenses) 12 Month Average Monthly Operating Expenses = $85,008 Current Assets Current Liabilities Current Net FINANCIAL
$800,000 $600,000 $400,000 Net Quick Assets Target = $510,050 (6 months operating expenses) 12 Month Average Monthly Operating Expenses = $85,008 Current Assets Current Liabilities Current Net FINANCIAL
Cash & Liquidity The chart below highlights CTA s cash position at March 2018 compared to March 2017.
 To: Chicago Transit Authority Board From: Jeremy Fine, Chief Financial Officer Re: Financial Results for March 2018 Date: May 9, 2018 I. Summary CTA s financial results are $0.9 million favorable to budget
Finance Report for DCEO Steering Group. Financial Year 2017/18, August Executive Summary
 Finance Report for DCEO Steering Group Financial Year 2017/18, August 2017 Executive Summary Partially through quarter 2, forecast and costs remain within our accepted variance level. There are no material
General Fund Revenue
 Millions Percent of Kathy Steinert, Director of Fiscal Services Phone: 541.923.8927 145 SE Salmon Ave Redmond, OR 97756 kathy.steinert@redmond.k12.or.us Date: May 23, 2014 To: Redmond School District Board
Operating Budget. Second Quarter Financial Report
 Second Quarter Financial Report INDEX A. Executive Summary... A-1 B. Revenue and Expense Analysis... B-1 C. Budget Variance Reports... C-1 D. Ridership and Performance Measures... D-1 Board Budget Committee
Net Quick Assets. Target = $475,816 (5 months operating expenses) 12 Month Average Monthly Operating Expenses = $95,163
 12 Month Average Monthly Operating Expenses = $95,163") $1,200,000 $1,000,000 $800,000 $600,000 $400,000 Net Quick Assets Target = $475,816 (5 months operating expenses) 12 Month Average Monthly Operating Expenses = $95,163 Current Assets Current Liabilities
$1,200,000 $1,000,000 $800,000 $600,000 $400,000 Net Quick Assets Target = $475,816 (5 months operating expenses) 12 Month Average Monthly Operating Expenses = $95,163 Current Assets Current Liabilities
MONTHLY FINANCIAL STATUS AUGUST 2018
 (Millions) MONTHLY FINANCIAL STATUS To: Dave Genova, General Manager and CEO ACTION DISCUSSION INFO From: Heather McKillop, CFO and AGM Administration x Date: October 9, VS. BUDGET YTD VS. BUDGET AUGUST
ACTUAL * COR ADMINISTRATION TARGETS * 2017 Target vs 2016 Target a) Number of New COR Registrations % Year (a)
 Number of New COR Registrations % Year (a)") 23-Jun-16 Date Prepared Section 1(a): BUDGET - COR ACTIVITIES ACTUAL * COR ADMINISTRATION TARGETS * # Variance (b-a) % Variance (b/a) (12 months) 2016 YTD (6 months) Year 1 Year 2 2016 (a) Year 3 2017
23-Jun-16 Date Prepared Section 1(a): BUDGET - COR ACTIVITIES ACTUAL * COR ADMINISTRATION TARGETS * # Variance (b-a) % Variance (b/a) (12 months) 2016 YTD (6 months) Year 1 Year 2 2016 (a) Year 3 2017
XML Publisher Balance Sheet Vision Operations (USA) Feb-02
 Feb-02") Page:1 Apr-01 May-01 Jun-01 Jul-01 ASSETS Current Assets Cash and Short Term Investments 15,862,304 51,998,607 9,198,226 Accounts Receivable - Net of Allowance 2,560,786
Page:1 Apr-01 May-01 Jun-01 Jul-01 ASSETS Current Assets Cash and Short Term Investments 15,862,304 51,998,607 9,198,226 Accounts Receivable - Net of Allowance 2,560,786
Capital Metropolitan Transportation Authority Monthly Financial Report For Period Ending November 30, 2013
 Capital Metropolitan Transportation Authority Monthly Financial Report For Period Ending November 30, 2013 Table of Contents SUMMARY REPORT Financial Performance -Sales Tax Revenue 3 -Other Revenue 4 -Operating
Financial Report - FY 2017 Year to Date May 31, 2017
 Financial Report - FY 2017 Year to Date July 19, 2017 1 Major Highlights Revenue Sales tax remittances received through YTD April 2017 are 4.2% higher than YTD April 2016 Plaza Saltillo lease income budgeted
Business & Financial Services December 2017
 Business & Financial Services December 217 Completed Procurement Transactions by Month 2 4 175 15 125 1 75 5 2 1 Business Days to Complete 25 Jan Feb Mar Apr May Jun Jul Aug Sep Oct Nov Dec 217 Procurement
The year to date is less than budget and prior year by 15.4 million and 11.6 million, respectively.
 To: Chicago Transit Authority Board From: Jeremy Fine, Chief Financial Officer Re: Financial Results for September 2016 Date: November 16, 2016 I. Summary CTA s financial results are $0.3 million unfavorable
MONTHLY FINANCIAL STATUS OCTOBER 2018
 (Millions) MONTHLY FINANCIAL STATUS To: Dave Genova, General Manager and CEO ACTION DISCUSSION INFO From: Heather McKillop, CFO and AGM Administration x Date: December 11, VS. BUDGET YTD VS. BUDGET OCTOBER
Public Transportation
 Municipal Manager Marketing & Customer Service Program Planning Transit Operations & Maintenance Transit Planning Transit Operations Para Transit Services Vehicle Maintenance Non-Vehicle Maintenance PT
Cash & Liquidity The chart below highlights CTA s cash position at January 2018 compared to January 2017.
 To: Chicago Transit Authority Board From: Jeremy Fine, Chief Financial Officer Re: Financial Results for January 2018 Date: March 14, 2018 I. Summary CTA s financial results are $1.7 million unfavorable
Strategic Plan Progress Report Goal 2 Focus. July 2015 San Francisco, California
 Strategic Plan Progress Report Goal 2 Focus July 2015 San Francisco, California 1 Goal 2 focus Make transit, walking, bicycling, taxi, ridesharing and carsharing the preferred means of travel Objective
August 31, 2016 Financial Report
 August 31, 2016 Financial Report Capital Metropolitan Transportation Authority 10/14/2016 Table of Contents SUMMARY REPORTS Budgetary Performance - Revenue 2 - Sales Tax Revenue 6 - Operating Expenses
Capital Metropolitan Transportation Authority
 Capital Metropolitan Transportation Authority Monthly Performance Report (Covering Performance Data Through March and April 2010) Capital Metropolitan Transportation Authority 1 Performance Report Contents
Financial Management Report... 3
 November 13, 2013 Table of Contents Financial Management Report... 3 OPERATING FUNDS STATEMENT OF REVENUES & EXPENSES... 3 METROPOLITAN COUNCIL INVESTMENT PERFORMANCE SHORT-TERM PORTFOLIO... 4 METROPOLITAN
TOWN OF WESTOVER HILLS FY 2019 BUDGET TABLE OF CONTENTS. Page Combined Budget Cover Page (statutory) 2 Budget Summary 4 Property Tax Rates 5
 2 Budget Summary 4 Property Tax Rates 5") TABLE OF CONTENTS Page Combined Budget Cover Page (statutory) 2 Budget Summary 4 Property Tax Rates 5 General Fund Budget Budget Summary 7 Water Fund Reimbursement 8 Revenues 9 Administration Expense 10
TABLE OF CONTENTS Page Combined Budget Cover Page (statutory) 2 Budget Summary 4 Property Tax Rates 5 General Fund Budget Budget Summary 7 Water Fund Reimbursement 8 Revenues 9 Administration Expense 10
Public Transportation
 Municipal Manager Marketing & Customer Service Program Planning Transit Planning Para Transit Services Transit Operations & Maintenance Transit Operations Vehicle Maintenance Non-Vehicle Maintenance PT
DART Fare Structure Programs
 DART Fare Structure Programs Budget & Finance Committee November 13, 2018 Joseph G. Costello Senior Vice President, Finance 0 Calendar Date Nov 13 Dec 11 Jan 22 Feb 26 Mar 26 Apr 23 May 28 Jun 18 Jul 18
Cash & Liquidity The chart below highlights CTA s cash position at February 2017 compared to February 2016.
 To: Chicago Transit Authority Board From: Jeremy Fine, Chief Financial Officer Re: Financial Results for February 2017 Date: April 5, 2017 I. Summary CTA s financial results are $0.3 million favorable
Tax Return Questionnaire Tax Year
 Tax Return Questionnaire - 2018 Tax Year - Page 1 of 18 Print this form out, take some time to fill it out, and bring it with you when you come to the office. This will save you time and money and help
Tax Return Questionnaire Tax Year
 Print this form out, take some time to fill it out, and bring it with you when you come to the office. This will save you time and money, and help us help you more effectively. Tax Return Questionnaire
Financial Statements of ST. JOHN S TRANSPORTATION COMMISSION
 Financial Statements of ST. JOHN S TRANSPORTATION COMMISSION Table of Contents Statement of Responsibility 1 Page Independent Auditor s Report 2 Statement of Operations and Accumulated Surplus 3 Statement
VALLEY METRO RPTA FY18 Budget EXECUTIVE SUMMARY
 VALLEY METRO RPTA FY18 Budget EXECUTIVE SUMMARY FY18 ADOPTED ANNUAL OPERATING AND CAPITAL BUDGET Valley Metro Regional Public Transportation Authority (RPTA) provides public transportation services for
Net Quick Assets. Target = $454,424 (5 months operating expenses) 12 Month Average Monthly Operating Expenses = $90,885
 12 Month Average Monthly Operating Expenses = $90,885") $1,200,000 $1,000,000 $800,000 $600,000 $400,000 Net Quick Assets Target = $454,424 (5 months operating expenses) 12 Month Average Monthly Operating Expenses = $90,885 Current Assets Current Liabilities
$1,200,000 $1,000,000 $800,000 $600,000 $400,000 Net Quick Assets Target = $454,424 (5 months operating expenses) 12 Month Average Monthly Operating Expenses = $90,885 Current Assets Current Liabilities
Balancing the Transportation Needs of a Growing City
 Balancing the Transportation Needs of a Growing City FY 2019 and FY 2020 Operating Budget SFMTA Board Meeting Ed Reiskin, Director of Transportation March 20, 2018 1 Revises Baselines: FY 2019-2020 ($
Fiscal Year 2018 Project 1 Annual Budget
 Fiscal Year 2018 Project 1 Annual Budget Table of Contents Table Page Summary 3 Summary of Costs Table 1 4 Treasury Related Expenses Table 2 5 Summary of Full Time Equivalent Table 3 6 Positions Cost-to-Cash
METRO. Fiscal Year 2015 Monthly Board Report. February 2015
 METRO Fiscal Year 2015 Monthly Board Report Revenue Expense Ridership Performance 4/2/2015 Table of Contents Section A Section B Section C Section D Section E Section F Section G Section H Section I Section
HART Financial Snapshot. HART Finance and Audit Committee January 23, 2017
 HART Financial Snapshot HART Finance and Audit Committee January 23, 2017 1 Requested January 3, 2017 Cash flow management overview Fund balance update including year end fund balance reported in the past
1.2 The purpose of the Finance Committee is to assist the Board in fulfilling its oversight responsibilities related to:
 Category: BOARD PROCESS Title: Terms of Reference for the Finance Committee Reference Number: AB-331 Last Approved: February 22, 2018 Last Reviewed: February 22, 2018 1. PURPOSE 1.1 Primary responsibility
Operations & Finance Committee Meeting Agenda
 Operations & Finance Committee Meeting Agenda Nashville MTA Committee Meetings Music City Central Meeting Room 400 Charlotte Ave., Nashville, TN 37219 Thursday, November 16, 2017 The Operations & Finance
FOR RELEASE: MONDAY, MARCH 21 AT 4 PM
 Interviews with 1,012 adult Americans conducted by telephone by Opinion Research Corporation on March 18-20, 2011. The margin of sampling error for results based on the total sample is plus or minus 3
Strategic Plan Progress Report Goal 4 Focus. May 2015 San Francisco, California
 Strategic Plan Progress Report Goal 4 Focus May 2015 San Francisco, California 1 Goal 4 focus Create a workplace that delivers outstanding service Objective 4.1 Improve internal communications Objective
Special City Council Meeting Agenda Consolidated as of February 1, 2019
 Special City Council Meeting Agenda Consolidated as of February 1, 2019 Thursday, February 7, 2019 4:00 p.m. Council Chambers, Guelph City Hall, 1 Carden Street Please turn off or place on non-audible
FY17 FY16 Valley Metro RPTA Sources of Funds FY17 vs FY16
 FY17 ADOPTED ANNUAL OPERATING AND CAPITAL BUDGET Valley Metro Regional Public Transportation Authority (RPTA) provides public transportation services for Maricopa County located in the metro Phoenix, Arizona.
Review of Registered Charites Compliance Rates with Annual Reporting Requirements 2016
 Review of Registered Charites Compliance Rates with Annual Reporting Requirements 2016 October 2017 The Charities Regulator, in accordance with the provisions of section 14 of the Charities Act 2009, carried
Base Budget Training. George Hannah Budget Analyst II. Martha Lynch Financial Consultant. Leah Graber Systems Analyst / SAMIS Administrator
 Base Budget Training George Hannah Budget Analyst II Martha Lynch Financial Consultant Leah Graber Systems Analyst / SAMIS Administrator Introductions & Overview Main Topics CSC Fiscal Timeline Indirect
Finance Report for DCEO Steering Group. Financial Year 2017/18, June Executive Summary
 Finance Report for DCEO Steering Group Financial Year 2017/18, June 2017 Executive Summary The Qtr 1 budget review has been included as an appendix to this report with commentary and a draft budget for
Air Berlin PLC Berlin, 15 August 2012 Analysts and Investors conference call
 Air Berlin PLC Berlin, 15 August 2012 Analysts and Investors conference call 2012 is the transition year business transformation Transition cost incur in 2012 due to the initiatives taken 2011 Measures
Memorandum. May 28, Mr. Ken Bleiwas Office of the State Comptroller 59 Maiden Lane, 29 th Floor New York, New York Dear Mr.
 Memorandum State of New York May 28, 2014 Mr. Ken Bleiwas Office of the State Comptroller 59 Maiden Lane, 29 th Floor New York, New York 10038 Dear Mr. Bleiwas, This represents the MTA s First Quarter,
City of Justin NOVEMBER
 City of Justin MONTHLY FINANCIAL REPORT NOVEMBER - 2018 1 Revenues: Sales tax revenue is up 14.5% from this time prior year and November s sales tax collections increased 2.4% from November 2017. The City
FY 2011 and FY 2012 Operating Budget APRIL 6, 2010 SAN FRANCISCO, CALIFORNIA
 FY 2011 and FY 2012 Operating Budget APRIL 6, 2010 SAN FRANCISCO, CALIFORNIA Overview Original approved FY 2010 budget (April 2008) = $816.7M FY 2010 Approved Budget (April 2009) = $768.6M ($129M deficit
Cash & Liquidity The chart below highlights CTA s cash position at July 2016 compared to July 2015.
 To: Chicago Transit Authority Board From: Jeremy Fine, Chief Financial Officer Re: Financial Results for July 2016 Date: September 14, 2016 I. Summary CTA s financial results are $0.4 million favorable
METRO. Fiscal Year Monthly Performance Report. Revenue Expense Ridership Performance. May 2018 (Second Quarter Fiscal Year-to Date)
") METRO Fiscal Year 2018 Monthly Performance Report Revenue Expense Ridership Performance (Second Quarter Fiscal Year-to Date) 6/12/2018 Table of Contents Section A Section B Section C Section D Section
METRO Fiscal Year 2018 Monthly Performance Report Revenue Expense Ridership Performance (Second Quarter Fiscal Year-to Date) 6/12/2018 Table of Contents Section A Section B Section C Section D Section
REVENUE & RIDERSHIP REPORT OCTOBER 2017
 REVENUE & RIDERSHIP REPORT OCTOBER 2017 Monthly passenger revenue 3.5% above last year and 1.4% below budget Monthly ridership 3.4% below budget and 6.3% below last year Year-to-date revenue 3.5% and ridership
Sales Tax Collection Report. For The Month Ending 03/31/14. February 2014 Sales
 Sales Tax Collection Report For The Month Ending 03/31/14 February 2014 Sales Report Prepared By The Sales Tax Department 1 Sales Tax Report Table of Contents Page 3 Sales Tax Recap of Gross Receipts Collected
NORTH SYRACUSE CENTRAL SCHOOL DISTRICT. Fund Balance & Budget Assumptions December 3, 2018
 NORTH SYRACUSE CENTRAL SCHOOL DISTRICT Fund Balance & Budget Assumptions 2019-2020 December 3, 2018 1 AGENDA Fund Balance Reserves Economic Factors Revenue Assumptions Expenditure Assumptions Budget Timeline
Strategic Plan Progress Report Goal 3 Focus. June 2014 San Francisco, California
 Strategic Plan Progress Report Goal 3 Focus June 2014 San Francisco, California 1 Goal 3 focus Improve the environment and quality of life in San Francisco Objective 3.1 Reduce the Agency s and the transportation
April 30, 2016 Financial Report
 2016 April 30, 2016 Financial Report Capital Metropolitan Transportation Authority 6/15/2016 Table of Contents SUMMARY REPORT Budgetary Performance - Revenue 2 - Sales Tax Revenue 6 - Operating Expenses
SUN-KAP ENTERPRISES,LLC TAX AND FINANCIAL PLANNING 1260 Huntington Dr., Suite 205 South Pasadena, CA Phone Fax
 SUN-KAP ENTERPRISES,LLC TAX AND FINANCIAL PLANNING 1260 Huntington Dr., Suite 205 South Pasadena, CA 91030 Phone 323-254-2729 Fax 323-254-2739 NOTE: REMEMBER TO BRING ALL OF YOUR W-2, 1099, 1098, K-1 AND
February 2016 Financial Report
 2016 February 2016 Financial Report Capital Metropolitan Transportation Authority 4/13/2016 Table of Contents SUMMARY REPORT Budgetary Performance - Revenue 2 - Sales Tax Revenue 5 - Operating Expenses
2017 Schedule C Business Tax Organizer Gurr & Company LLC
 Here is your tax organizer to assist you in gathering the information necessary information for your business tax return for 2017. The Internal Revenue Service matches information returns with amounts
MINUTES OF THE REGULAR MEETING OF COUNCIL of the Town of Banff in the Province of Alberta Town Hall Council Chamber Monday, April 10, 2017 at 2:00 pm
 Page 31 MINUTES OF THE REGULAR MEETING OF COUNCIL of the Town of Banff in the Province of Alberta Town Hall Council Chamber Monday, at 2:00 pm COUNCIL MEMBERS PRESENT Karen Sorensen Mayor Chip Olver Councillor
The Financial Reporting Checklists Every Firm should be Doing
 The Financial Reporting Checklists Every Firm should be Doing Presented by Rebecca Kelley, CPA Maggie Kennedy, CPA FM34 4/5/2017 3:00 PM - 4:15 PM The handouts and presentations attached are copyright
NORTH SYRACUSE CENTRAL SCHOOL DISTRICT. Fund Balance & Budget Assumptions December 4, 2017
 NORTH SYRACUSE CENTRAL SCHOOL DISTRICT Fund Balance & Budget Assumptions 2018-2019 December 4, 2017 1 AGENDA Fund Balance Reserves Economic Factors Revenue Assumptions Expenditure Assumptions Budget Timeline
TransHelp Program and Accessible Transportation 2008 Budget Document
 TransHelp and Accessible Transportation 28 Budget Document TransHelp Program and Accessible Transportation 28 Budget Document This report incorporates Part B of the Transportation 28 Budget Document Section
MiWay Business Plan and 2015 Budget
 MiWay 2015-2018 Business Plan and 2015 Budget Agenda Existing Core Services Vision and Mission Service Delivery Model Service Level Issues and Trends Service Area Information Accomplishments Benchmarks
Public Transportation
 Municipal Manager Administration Marketing and Customer Service Program Planning Transit Operations and Maintenance Transit Planning Transit Operations Para Transit Services Vehicle Maintenance Non-Vehicle
Audit and Finance Subcommittee
 MEETING OF THE Audit and Finance Subcommittee MEETING DATE January 12, 2017 TIME LOCATION 12:00 p.m. Valley Metro 101 N. 1st Ave., 10th Floor Lake Mead Conference Room (10B) Phoenix, AZ 85003 VALLEY METRO
Monthly Board of Directors Meeting
 Monthly Board of Directors Meeting The Bay Tree Lakes Property Owners Association Board of Directors monthly meeting was held at the Bay Tree Lakes Clubhouse on Tuesday, September 16, 2008 at 7:00 pm.
Foxtons Interim results presentation For the period ended 30 June 2018
 Foxtons Interim results presentation For the period ended 30 June 2018 Important information This presentation includes statements that are, or may be deemed to be, forward-looking statements. These forward-looking
Isle Of Wight half year business confidence report
 half year business confidence report half year report contents new company registrations closed companies (dissolved) net company growth uk company share director age director gender naming trends sic
CHARLESTON COUNTY PUBLIC LIBRARY ANNUAL BUDGET FISCAL YEAR 2019
 CHARLESTON COUNTY PUBLIC LIBRARY ANNUAL BUDGET FISCAL YEAR 2019 GENERAL FUND BUDGET HIGHLIGHTS The General Fund finances the day-to-day provision of library services for Charleston County. The Library