Market Outlook for Corn, Wheat, and Soybeans
|
|
|
- Bruce Harrison
- 5 years ago
- Views:
Transcription
1 Market Outlook for Corn, Wheat, and Soybeans Identifying Risks - Protecting Profits Can you go wrong with $5 Corn, $12 Beans and $8 Wheat? Progressive Farmer Meeting St. Johns, Michigan Jim Hilker Agriculture, Food, and Resource Economics Department Michigan State University March 14, 2008
2 MONTHLY CORN FUTURES
3
4 Corn and Soy Meetings 2008 %Change in Plantings, Alma Corn Soys Wheat Average Min Max Standard Deviation Median # took
5 Corn and Soy Meetings 2008 %Change in Plantings, Coldwater Corn Soys Wheat Average Min Max Standard Deviation Median # took
6 Corn and Soy Meetings 2008 %Change in Plantings, Monroe Corn Soys Wheat Average Min Max Standard Deviation Median # took
7 Corn and Soy Meetings 2008 %Change in Plantings, Plainwell Corn Soys Wheat Average Min Max Standard Deviation Median # took
8 Corn and Soy Meetings 2008 %Change in Plantings, Peck Corn Soys Wheat Average Min Max Standard Deviation Median # took
9 Corn and Soy Meetings 2008 %Change in Plantings, Frankenmuth Corn Soys Wheat Average Min Max Standard Deviation Median # took
10 Corn and Soy Meetings 2008 %Change in Plantings, Combined Corn Soys Wheat Average Min Max Standard Deviation Median # took
11
12
13
14

15 Weekly Natural Gas Futures

16
17
18
19
20 TABLE 1 SUPPLY/DEMAND BALANCE SHEET FOR CORN Est. Proj. USDA Ave (million acres) Acres Planted Acres Harvested Bu./Harvested Acre (million bushels) Beginning Stocks Production Imports Total Supply Use: Feed and Residual Food, Seed and Ind Ethanol for fuel Total Domestic Exports Total Use Ending Stocks Ending Stocks, %of Use U.S. Loan Rate $1.98 $1.98 $1.95 $1.95 $1.95 $1.95 $1.95 $1.95 U.S. Season Average Farm Price, $/Bu. $2.32 $2.42 $2.06 $2.00 $3.04 $4.00 $4.60 $3.85 Source: USDA and Jim Hilker. ( )
21 Corn Yields Years Corn Yields Linear (Corn Yields) Bushels/Acre
22 Corn Yields Years Corn Yields Linear (Corn Yields) Bushels/Acre
23 TABLE 1 SUPPLY/DEMAND BALANCE SHEET FOR CORN Est. Proj. USDA Ave (million acres) Acres Planted Acres Harvested Bu./Harvested Acre (million bushels) Beginning Stocks Production Imports Total Supply Use: Feed and Residual Food, Seed and Ind Ethanol for fuel Total Domestic Exports Total Use Ending Stocks Ending Stocks, %of Use U.S. Loan Rate $1.98 $1.98 $1.95 $1.95 $1.95 $1.95 $1.95 $1.95 U.S. Season Average Farm Price, $/Bu. $2.32 $2.42 $2.06 $2.00 $3.04 $4.00 $4.60 $3.85 Source: USDA and Jim Hilker. ( )
24
25
26
27 TABLE 1 SUPPLY/DEMAND BALANCE SHEET FOR CORN Est. Proj. USDA Ave (million acres) Acres Planted Acres Harvested Bu./Harvested Acre (million bushels) Beginning Stocks Production Imports Total Supply Use: Feed and Residual Food, Seed and Ind Ethanol for fuel Total Domestic Exports Total Use Ending Stocks Ending Stocks, %of Use U.S. Loan Rate $1.98 $1.98 $1.95 $1.95 $1.95 $1.95 $1.95 $1.95 U.S. Season Average Farm Price, $/Bu. $2.32 $2.42 $2.06 $2.00 $3.04 $4.00 $4.60 $3.85 Source: USDA and Jim Hilker. ( )
28 Ethanol Futures

29 Gasoline Futures
30
31
32
33
34
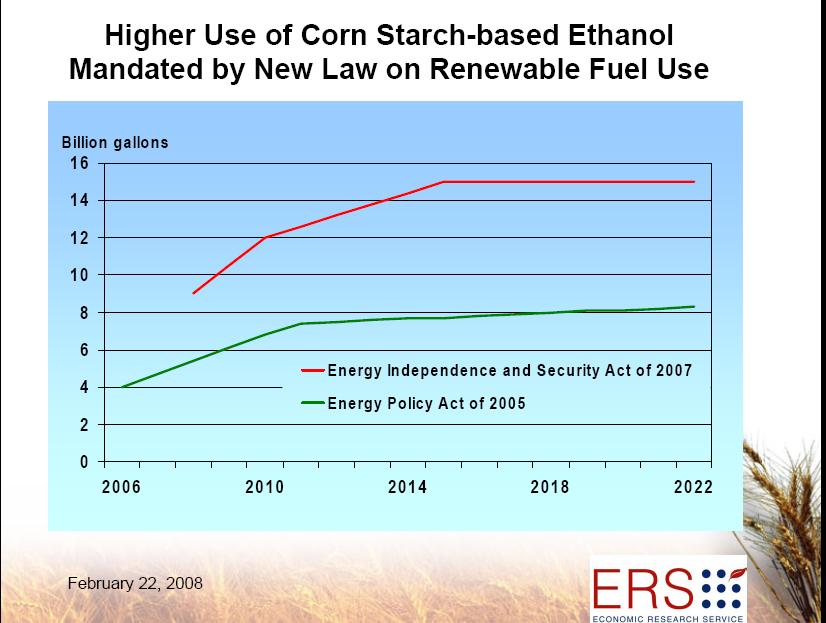
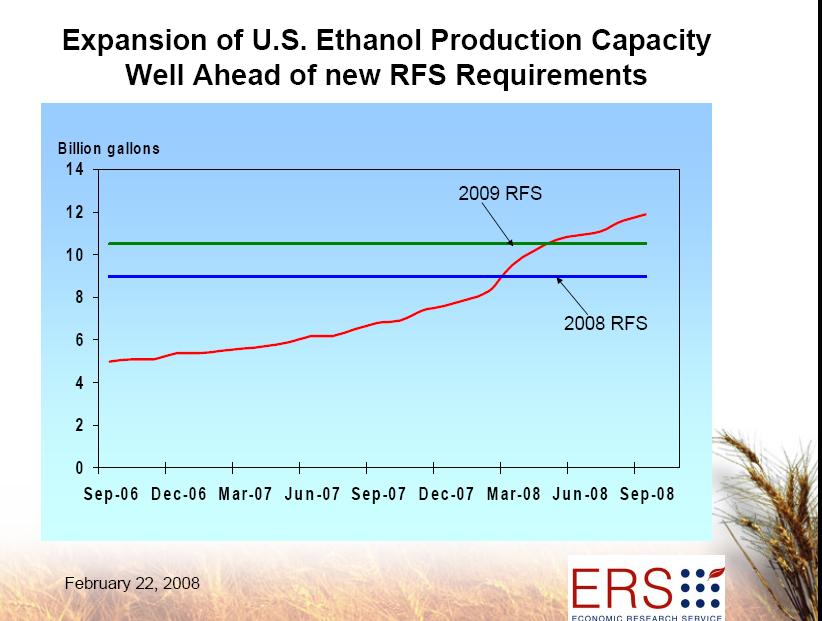
35 Policy Themes Dec 19, 2007: New energy bill signed by President (EISA) Corn ethanol is mandated to grow from 9 billion gallons in 2008 to 13.2 in 2012 to 15 in 2015 Was 7.5 in 2012 in 1995 Energy Act Federal and state tax credits Oxygenation requirements Macroeconomic policy (e.g., exchange rates, growth, inflation, and interest rates)
36 ENERGY MARKETS Crystal balls are very cloudy High by historical standards Extremely volatile Linkages to commodities Price of ethanol driven by price of oil which drives gasoline which in turn sets parameters on break-even prices for corn to ethanol manufacturers.
37 Current ethanol capacity is 7.5 B gal 5.8 B gal under construction 13+ B gal within next three years Several plants were placed on hold in mid and late 2006 as expected profit prospects dimmed B illio n g a l Renewable Fuel Standard for Conventional Biofuels
38 Corn Price Table1: Estimated Break Even Ethanol Prices for a New Plant 0% Return on Equity 12% Return on Equity 60 Million Gallon Plant 120 Million Gallon Plant 60 Million Gallon Plant 120 Million Gallon Plant $2.00 $1.19 $1.14 $1.32 $1.24 $3.00 $1.44 $1.40 $1.57 $1.49 $4.00 $1.70 $1.66 $1.83 $1.75 $5.00 $1.96 $1.91 $2.09 $2.00 $6.00 $2.21 $2.16 $2.34 $2.25 Source: Eidman V. Assumes: $90/bl oil, $2.74/gal wholesale gasoline price, DDGS price = 90% corn price, Inv = $ m gal or $ m gal Jan 29, 2008: Delivered $5.01, Ethanol $2.20, Natural $7.99/mmBtu

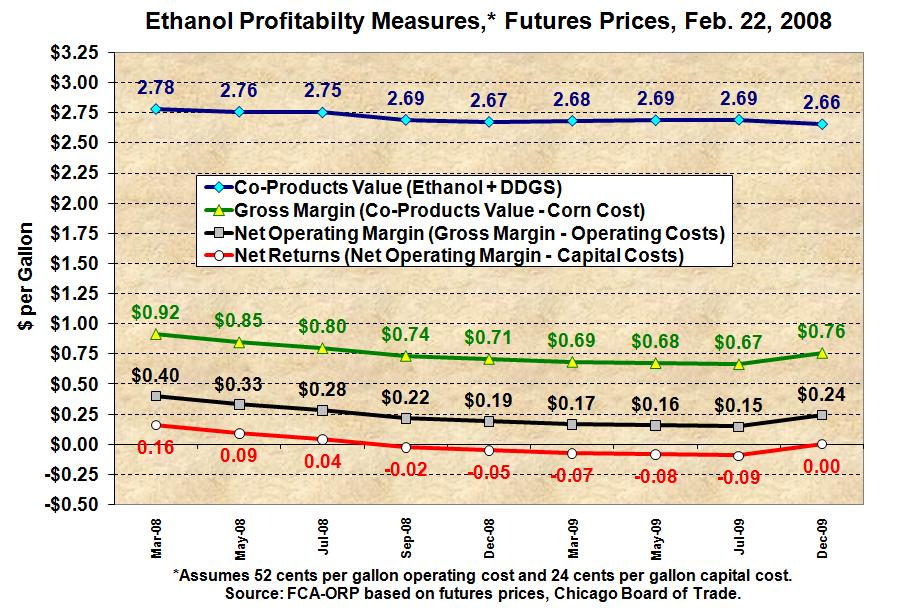
39 Estimated Historical Ethanol Gross Margins
40 Costs Gross Margin Needs to Cover $ $0.90 gal (Eidman) Capital is $0.25 of this component
41 Ethanol to Gas Relationship Sold at a premium when needed for an oxygenate. Averaged $0.64/gal in 2006 (wholesale) Has fallen as this market is getting filled and in response to logistics challenges 2007 premium fell to $0.10/gal Oct 2007 discount was $0.45 Long-run with substantial volume will sell closer to its relative energy value
42
43
44
45
46 TABLE 1 SUPPLY/DEMAND BALANCE SHEET FOR CORN Est. Proj. USDA Ave (million acres) Acres Planted Acres Harvested Bu./Harvested Acre (million bushels) Beginning Stocks Production Imports Total Supply Use: Feed and Residual Food, Seed and Ind Ethanol for fuel Total Domestic Exports Total Use Ending Stocks Ending Stocks, %of Use U.S. Loan Rate $1.98 $1.98 $1.95 $1.95 $1.95 $1.95 $1.95 $1.95 U.S. Season Average Farm Price, $/Bu. $2.32 $2.42 $2.06 $2.00 $3.04 $4.00 $4.60 $3.85 Source: USDA and Jim Hilker. ( )
47
48
49
50
51
52 Exports Years Exports Linear (Exports) Bushels(millions)
53 U.S. Grain Exports GRAINS INSPECTED AND/OR WEIGHED FOR EXPORT - 1,000 BUSHELS CURRENT PREVIOUS WEEK ENDING MARKET YEAR MARKET YEAR GRAIN 03/06/08 02/28/08 03/08/07 TO DATE TO DATE WHEAT 18,122 17,013 20, , ,351 RYE OATS BARLEY ,540 16,429 FLAXSEED , CORN 44,791 50,122 37,365 1,324,799 1,126,234 SORGHUM 5,252 4,634 2, ,015 81,738 SOYBEANS 29,857 34,081 29, , ,476 SUNFLOWER TOTAL 98, ,897 90,786 3,287,172 2,701,
54 U.S. Grain Export Sales USDA Export Sales Report 03/13 07:30 Export Sales Report for Week Ending 03/06/08 (in mil bus) Weekly New Crop Sales GRAINS Sales Unshipped Total Prev Yr Weekly Unshipped Corn Sorghum Soybeans All Wheat Durum Hard Red Spring Hard Red Winter Soft Red Winter White Wheat OTHER COMMODITIES Soyoil (000 mt) Soymeal (000 mt) Rice (000 mt) Upland Cotton(000bales)
55 TABLE 1 SUPPLY/DEMAND BALANCE SHEET FOR CORN Est. Proj. USDA Ave (million acres) Acres Planted Acres Harvested Bu./Harvested Acre (million bushels) Beginning Stocks Production Imports Total Supply Use: Feed and Residual Food, Seed and Ind Ethanol for fuel Total Domestic Exports Total Use Ending Stocks Ending Stocks, %of Use U.S. Loan Rate $1.98 $1.98 $1.95 $1.95 $1.95 $1.95 $1.95 $1.95 U.S. Season Average Farm Price, $/Bu. $2.32 $2.42 $2.06 $2.00 $3.04 $4.00 $4.60 $3.85 Source: USDA and Jim Hilker. ( )
56 World Coarse Grain Supply and Use 1/ (Million Metric Tons) =============================================================================== : Supply : Use : :=========================:=======================:Ending Region : : : : Domestic 2/ : :stocks :Beginning:Produc-: :===============: : : stocks : tion :Imports: Feed : Total :Exports: =============================================================================== : : 2005/06 : World 3/ : United States : Total foreign : Major exporters 4/ : Argentina : Australia : Canada : Major importers 5/ : EU-27 6/ : Japan : Mexico : N. Afr & Mideast 7/: Saudi Arabia : Southeast Asia 8/ : South Korea : Selected other : Brazil : China : FSU-12 : Russia : Ukraine : : ===============================================================================
57 World Coarse Grain Supply and Use 1/ (Million Metric Tons) =============================================================================== : Supply : Use : :=========================:=======================:Ending Region : : : : Domestic 2/ : :stocks :Beginning:Produc-: :===============: : : stocks : tion :Imports: Feed : Total :Exports: =============================================================================== : 2006/07 (Estimated) : World 3/ : United States : Total foreign : Major exporters 4/ : Argentina : Australia : Canada : Major importers 5/ : EU-27 6/ : Japan : Mexico : N. Afr & Mideast 7/: Saudi Arabia : Southeast Asia 8/ : South Korea : Selected other : Brazil : China : FSU-12 : Russia : Ukraine : ===============================================================================
58 World Coarse Grain Supply and Use 1/ (Cont'd.) (Million Metric Tons) =============================================================================== : Supply : Use : :=========================:=======================:Ending Region : : : : Domestic 2/ : :stocks :Beginning:Produc-: :===============: : : stocks : tion :Imports: Feed : Total :Exports: =============================================================================== : : 2007/08 (Projected) World 3/ : February : March : United States : February : March : Total foreign : February : March : Major exporters 4/ : February : March : Argentina Feb : Mar : Australia Feb : Mar : Canada Feb : Mar : ===============================================================================
59 World Coarse Grain Supply and Use 1/ (Cont'd.) (Million Metric Tons) =============================================================================== : Supply : Use : :=========================:=======================:Ending Region : : : : Domestic 2/ : :stocks :Beginning:Produc-: :===============: : : stocks : tion :Imports: Feed : Total :Exports: =============================================================================== : 2007/08 (Projected) Major importers 5/ : February : March : EU-27 6/ Feb : Mar : Japan Feb : Mar : Mexico Feb : Mar : N Afr/M.East 7/Feb : Mar : Saudi Arabia Feb : Mar : S.-east Asia 8/Feb : Mar : South Korea Feb : Mar : Selected other : Brazil Feb : Mar : China Feb : Mar : FSU-12 Feb : Mar : Russia Feb : Mar : Ukraine Feb : Mar : ===============================================================================
60
61 TABLE 1 SUPPLY/DEMAND BALANCE SHEET FOR CORN Est. Proj. USDA Ave (million acres) Acres Planted Acres Harvested Bu./Harvested Acre (million bushels) Beginning Stocks Production Imports Total Supply Use: Feed and Residual Food, Seed and Ind Ethanol for fuel Total Domestic Exports Total Use Ending Stocks Ending Stocks, %of Use U.S. Loan Rate $1.98 $1.98 $1.95 $1.95 $1.95 $1.95 $1.95 $1.95 U.S. Season Average Farm Price, $/Bu. $2.32 $2.42 $2.06 $2.00 $3.04 $4.00 $4.60 $3.85 Source: USDA and Jim Hilker. ( )
62 Corn Prices Years Prices/bushel
63 Corn Prices versus E.S Years Prices/bushel Ending Stocks
64 Corn Prices versus E.S. to Use Years 1978 Prices/bushel Ending Stocks
65 U.S. Corn Price vs Ending Stocks/Use Ratio Price ($/BU) Ending Stocks/Use Ratio
66 Corn Futures Month Year Close Mar May July Sept Dec Mar May July Dec Dec
67 Corn Futures Futures Detail DAY CORN (C) [10 minute delay] Future Symbol Search Symbol Lookup More Info Month Last Chg Open High Low Volume Open Int Trade Time chart options Mar '6s 3'0 558'0 568'0 558' /13/08 13:41 chart options May '4s 2'2 568'4 579'4 567' /13/08 13:41 chart options Jul '4s 2'0 581'4 591'0 579' /13/08 13:41 chart options Sep '0s 4'2 584'0 588'6 580' /13/08 13:41 chart options Dec '2s 4'2 581'4 590'0 579' /13/08 13:41 chart options Mar '4s 4'6 591'0 597'2 587' /13/08 13:41 chart options May '0s 5'0 594'0 601'0 591' /13/08 13:41 chart options Jul '0s 5'0 594'4 601'0 594' /13/08 13:41 chart options Dec '4s 2'0 555'4 559'0 555' /13/08 13:41 chart options Mar '4s 3' /13/08 13:41 chart options Jul '0s 3' /13/08 13:41 chart options Dec '4s 2'0 556'0 556'0 552' /13/08 13:41 Thu, Mar 13, :15 PM CDT *Quotes are in market time

68 May 08 Corn Futures
69

70 July 08 Corn Futures
71

72 Dec 08 Corn Futures
73
74 TABLE 1 SUPPLY/DEMAND BALANCE SHEET FOR CORN Est. Proj. USDA Ave (million acres) Acres Planted Acres Harvested Bu./Harvested Acre (million bushels) Beginning Stocks Production Imports Total Supply Use: Feed and Residual Food, Seed and Ind Ethanol for fuel Total Domestic Exports Total Use Ending Stocks Ending Stocks, %of Use U.S. Loan Rate $1.98 $1.98 $1.95 $1.95 $1.95 $1.95 $1.95 $1.95 U.S. Season Average Farm Price, $/Bu. $2.32 $2.42 $2.06 $2.00 $3.04 $4.00 $4.60 $3.85 Source: USDA and Jim Hilker. ( )
75 Corn Futures Futures Detail DAY CORN (C) [10 minute delay] Future Symbol Search Symbol Lookup More Info Month Last Chg Open High Low Volume Open Int Trade Time chart options Mar '6s 3'0 558'0 568'0 558' /13/08 13:41 chart options May '4s 2'2 568'4 579'4 567' /13/08 13:41 chart options Jul '4s 2'0 581'4 591'0 579' /13/08 13:41 chart options Sep '0s 4'2 584'0 588'6 580' /13/08 13:41 chart options Dec '2s 4'2 581'4 590'0 579' /13/08 13:41 chart options Mar '4s 4'6 591'0 597'2 587' /13/08 13:41 chart options May '0s 5'0 594'0 601'0 591' /13/08 13:41 chart options Jul '0s 5'0 594'4 601'0 594' /13/08 13:41 chart options Dec '4s 2'0 555'4 559'0 555' /13/08 13:41 chart options Mar '4s 3' /13/08 13:41 chart options Jul '0s 3' /13/08 13:41 chart options Dec '4s 2'0 556'0 556'0 552' /13/08 13:41 Thu, Mar 13, :15 PM CDT *Quotes are in market time
76 Corn Futures Month Year Close Mar May July Sept Dec Mar May July Dec Dec

77 Ethanol Futures
78 Ethanol Plants Bu/MillionsRunning Sum Caro /07 Woodbury Albion Riga 06/ months Riga 07/ /08 Maryville Ithaca /09 Maryville II or 09?? Riga II? or 09?? Watervliet Corunna McBain Manistee Alma
79 Michigan Corn Yields Years Corn Yields "Trend Yields" Bushels/Acre
80 1/11/2008 Michigan Supply/Use Balance Sheet for Corn Estimated Projected Projected Corn Marketing Year 2004/ / / / /09 Corn Grain Production Thousand Acres Planted Acres Harvested Acres Yield bushels/acre Million Bushels Beginning stocks Production Imports Total Supply Corn Use Livestock Feed Ethanol Canada for Ethanol Other Exports to Canda Exports out of Michigan to U.S Other Uses and Residual Total Disapperance Ending Stocks
81 MONTHLY SPRING WHEAT FUTURES

82 May Spring Wheat Futures
83 MONTHLY CBT WHEAT FUTURES
84
85
86 TABLE 2 SUPPLY/DEMAND BALANCE SHEET FOR WHEAT Est. Proj. USDA Ave (Million Acres) Acres Planted Acres Harvested Bu./Harvested Acre (Million Bushels) Beginning Stocks Production Imports Total Supply Use: Food Seed Feed and Residual Total Domestic Exports Total Use Ending Stocks Ending Stocks, %of Use U.S. Loan Rate $2.80 $2.75 $2.75 $2.75 $2.75 $2.75 $2.75 U.S. Season Average U.S. $/Bu. $3.40 $3.40 $3.42 $4.26 $6.65 $7.00 $5.50 Michigan $/Bu. $3.35 $2.95 $3.05 $3.40 $5.30 $6.10 $5.40 Source: USDA and Jim Hilker. ( )
87
88
89 TABLE 2 SUPPLY/DEMAND BALANCE SHEET FOR WHEAT Est. Proj. USDA Ave (Million Acres) Acres Planted Acres Harvested Bu./Harvested Acre (Million Bushels) Beginning Stocks Production Imports Total Supply Use: Food Seed Feed and Residual Total Domestic Exports Total Use Ending Stocks Ending Stocks, %of Use U.S. Loan Rate $2.80 $2.75 $2.75 $2.75 $2.75 $2.75 $2.75 U.S. Season Average U.S. $/Bu. $3.40 $3.40 $3.42 $4.26 $6.65 $7.00 $5.50 Michigan $/Bu. $3.35 $2.95 $3.05 $3.40 $5.30 $6.10 $5.40 Source: USDA and Jim Hilker. ( )
90 Wheat Yields Wheat Yield Years Linear (Wheat Yield) Bushels/Acre
91
92 TABLE 2 SUPPLY/DEMAND BALANCE SHEET FOR WHEAT Est. Proj. USDA Ave (Million Acres) Acres Planted Acres Harvested Bu./Harvested Acre (Million Bushels) Beginning Stocks Production Imports Total Supply Use: Food Seed Feed and Residual Total Domestic Exports Total Use Ending Stocks Ending Stocks, %of Use U.S. Loan Rate $2.80 $2.75 $2.75 $2.75 $2.75 $2.75 $2.75 U.S. Season Average U.S. $/Bu. $3.40 $3.40 $3.42 $4.26 $6.65 $7.00 $5.50 Michigan $/Bu. $3.35 $2.95 $3.05 $3.40 $5.30 $6.10 $5.40 Source: USDA and Jim Hilker. ( )
93 U.S. Grain Exports GRAINS INSPECTED AND/OR WEIGHED FOR EXPORT - 1,000 BUSHELS CURRENT PREVIOUS WEEK ENDING MARKET YEAR MARKET YEAR GRAIN 03/06/08 02/28/08 03/08/07 TO DATE TO DATE WHEAT 18,122 17,013 20, , ,351 RYE OATS BARLEY ,540 16,429 FLAXSEED , CORN 44,791 50,122 37,365 1,324,799 1,126,234 SORGHUM 5,252 4,634 2, ,015 81,738 SOYBEANS 29,857 34,081 29, , ,476 SUNFLOWER TOTAL 98, ,897 90,786 3,287,172 2,701,
94 U.S. Grain Export Sales USDA Export Sales Report 03/13 07:30 Export Sales Report for Week Ending 03/06/08 (in mil bus) Weekly New Crop Sales GRAINS Sales Unshipped Total Prev Yr Weekly Unshipped Corn Sorghum Soybeans All Wheat Durum Hard Red Spring Hard Red Winter Soft Red Winter White Wheat OTHER COMMODITIES Soyoil (000 mt) Soymeal (000 mt) Rice (000 mt) Upland Cotton(000bales)
95 World Wheat Supply and Use 1/ (Million Metric Tons) =============================================================================== : Supply : Use : :=========================:=======================:Ending Region : : : : Domestic 2/ : :stocks :Beginning:Produc-: :===============: : : stocks : tion :Imports: Feed : Total :Exports: =============================================================================== : : 2005/06 : World 3/ : United States : Total foreign : Major exporters 4/ : Argentina : Australia : Canada : EU-27 5/ : Major importers 6/ : Brazil : China : Select. Mideast 7/ : N. Africa 8/ : Pakistan : Southeast Asia 9/ : Selected other : India : FSU-12 : Russia : Kazakhstan : Ukraine : : ===============================================================================
96 World Wheat Supply and Use 1/ (Million Metric Tons) =============================================================================== : Supply : Use : :=========================:=======================:Ending Region : : : : Domestic 2/ : :stocks :Beginning:Produc-: :===============: : : stocks : tion :Imports: Feed : Total :Exports: =============================================================================== : 2006/07 (Estimated) : World 3/ : United States : Total foreign : Major exporters 4/ : Argentina : Australia : Canada : EU-27 5/ : Major importers 6/ : Brazil : China : Select. Mideast 7/ : N. Africa 8/ : Pakistan : Southeast Asia 9/ : Selected other : India : FSU-12 : Russia : Kazakhstan : Ukraine : ===============================================================================
97 World Wheat Supply and Use 1/ (Cont'd.) (Million Metric Tons) =============================================================================== : Supply : Use : :=========================:=======================:Ending Region : : : : Domestic 2/ : :stocks :Beginning:Produc-: :===============: : : stocks : tion :Imports: Feed : Total :Exports: =============================================================================== : : 2007/08 (Projected) World 3/ : February : March : United States : February : March : Total foreign : February : March : Major exporters 4/ : February : March : Argentina Feb : Mar : Australia Feb : Mar : Canada Feb : Mar : EU-27 5/ Feb : Mar : ===============================================================================
98 World Wheat Supply and Use 1/ (Cont'd.) (Million Metric Tons) =============================================================================== : Supply : Use : :=========================:=======================:Ending Region : : : : Domestic 2/ : :stocks :Beginning:Produc-: :===============: : : stocks : tion :Imports: Feed : Total :Exports: =============================================================================== Major importers 6/ : February : March : Brazil Feb : Mar : China Feb : Mar : Sel. Mideast 7/Feb : Mar : N. Africa 8/ Feb : Mar : Pakistan Feb : Mar : SE Asia 9/ Feb : Mar : Selected other : India Feb : Mar : FSU-12 Feb : Mar : Russia Feb : Mar : Kazakhstan Feb : Mar : Ukraine Feb : Mar : ===============================================================================
99
100
101
102 TABLE 2 SUPPLY/DEMAND BALANCE SHEET FOR WHEAT Est. Proj. USDA Ave (Million Acres) Acres Planted Acres Harvested Bu./Harvested Acre (Million Bushels) Beginning Stocks Production Imports Total Supply Use: Food Seed Feed and Residual Total Domestic Exports Total Use Ending Stocks Ending Stocks, %of Use U.S. Loan Rate $2.80 $2.75 $2.75 $2.75 $2.75 $2.75 $2.75 U.S. Season Average U.S. $/Bu. $3.40 $3.40 $3.42 $4.26 $6.65 $7.00 $5.50 Michigan $/Bu. $3.35 $2.95 $3.05 $3.40 $5.30 $6.10 $5.40 Source: USDA and Jim Hilker. ( )
103 Wheat Prices Years Prices/bushel
104 Wheat Prices versus E.S Years Prices/bushel Ending Stocks
105 Wheat Prices versus E.S. to Use Years Prices/bushel Ending Stocks
106 U.S. Wheat Price vs Ending Stocks/Use Ratio Price ($/BU) Ending Stocks/Use Ratio
107 Wheat Futures Month Year Close Mar May July Sept July July
108 Wheat Futures Futures Detail DAY WHEAT (W) [10 minute delay] Future Symbol Search Symbol Lookup More Info Month Last Chg Open High Low Volume Open Int Trade Time chart options Mar '0s -36'0 1275'0 1275'0 1275' /13/08 13:41 chart options May '0s -38'4 1265'0 1318'0 1240' /13/08 13:41 chart options Jul '4s -31'4 1234'0 1270'0 1210' /13/08 13:41 chart options Sep '4s -31'0 1241'0 1253'0 1217' /13/08 13:41 chart options Dec '4s -35'0 1248'0 1280'0 1220' /13/08 13:41 chart options Mar '0s -39'0 1225'0 1225'0 1225' /13/08 13:41 chart options May '0s 16' /13/08 13:41 chart options Jul '0s -22'4 1114'0 1125'0 1110' /13/08 13:41 chart options Sep '0s -12' /13/08 13:41 chart options Dec '0s -20' /13/08 13:41 chart options Jul '0s -20'0 1090'0 1110'0 1090' /13/08 13:41 Thu, Mar 13, :23 PM CDT *Quotes are in market time

109 May 08 Wheat Futures
110

111 July 08 Wheat Futures
112

113 Dec 08 Wheat Futures
114
115 TABLE 2 SUPPLY/DEMAND BALANCE SHEET FOR WHEAT Est. Proj. USDA Ave (Million Acres) Acres Planted Acres Harvested Bu./Harvested Acre (Million Bushels) Beginning Stocks Production Imports Total Supply Use: Food Seed Feed and Residual Total Domestic Exports Total Use Ending Stocks Ending Stocks, %of Use U.S. Loan Rate $2.80 $2.75 $2.75 $2.75 $2.75 $2.75 $2.75 U.S. Season Average U.S. $/Bu. $3.40 $3.40 $3.42 $4.26 $6.65 $7.00 $5.50 Michigan $/Bu. $3.35 $2.95 $3.05 $3.40 $5.30 $6.10 $5.40 Source: USDA and Jim Hilker. ( )
116 Wheat Futures Futures Detail DAY WHEAT (W) [10 minute delay] Future Symbol Search Symbol Lookup More Info Month Last Chg Open High Low Volume Open Int Trade Time chart options Mar '0s -36'0 1275'0 1275'0 1275' /13/08 13:41 chart options May '0s -38'4 1265'0 1318'0 1240' /13/08 13:41 chart options Jul '4s -31'4 1234'0 1270'0 1210' /13/08 13:41 chart options Sep '4s -31'0 1241'0 1253'0 1217' /13/08 13:41 chart options Dec '4s -35'0 1248'0 1280'0 1220' /13/08 13:41 chart options Mar '0s -39'0 1225'0 1225'0 1225' /13/08 13:41 chart options May '0s 16' /13/08 13:41 chart options Jul '0s -22'4 1114'0 1125'0 1110' /13/08 13:41 chart options Sep '0s -12' /13/08 13:41 chart options Dec '0s -20' /13/08 13:41 chart options Jul '0s -20'0 1090'0 1110'0 1090' /13/08 13:41 Thu, Mar 13, :23 PM CDT *Quotes are in market time
117 Wheat Prices Years Prices/bushel
118 Wheat Prices Years Prices/bushel
119
120 Wheat Futures Futures Detail DAY WHEAT (W) [10 minute delay] Future Symbol Search Symbol Lookup More Info Month Last Chg Open High Low Volume Open Int Trade Time chart options Mar '0s -36'0 1275'0 1275'0 1275' /13/08 13:41 chart options May '0s -38'4 1265'0 1318'0 1240' /13/08 13:41 chart options Jul '4s -31'4 1234'0 1270'0 1210' /13/08 13:41 chart options Sep '4s -31'0 1241'0 1253'0 1217' /13/08 13:41 chart options Dec '4s -35'0 1248'0 1280'0 1220' /13/08 13:41 chart options Mar '0s -39'0 1225'0 1225'0 1225' /13/08 13:41 chart options May '0s 16' /13/08 13:41 chart options Jul '0s -22'4 1114'0 1125'0 1110' /13/08 13:41 chart options Sep '0s -12' /13/08 13:41 chart options Dec '0s -20' /13/08 13:41 chart options Jul '0s -20'0 1090'0 1110'0 1090' /13/08 13:41 Thu, Mar 13, :23 PM CDT *Quotes are in market time
121 Wheat Futures Month Year Close Mar May July Sept July July
122 MONTHLY SOYBEAN FUTURES
123
124 TABLE 3 SUPPLY/DEMAND BALANCE SHEET FOR SOYBEANS Est. Proj. USDA Ave (Million Acres) Acres Planted Acres Harvested Bu./Harvested Acre (Million Bushels) Beginning Stocks Production Imports Total Supply Use: Crushings Exports Seed and Residual Total Use Ending Stocks Ending Stocks, %of Use U.S. Loan Rate $5.00 $5.00 $5.00 $5.00 $5.00 $5.00 $5.00 $5.00 U.S. Season Average Farm Price, $/Bu. $5.53 $7.34 $5.74 $5.66 $6.43 $10.40 $11.50 $9.25 Source: USDA and Jim Hilker. ( )
125 Soybean Yields Soybean Yield Years Linear (Soybean Yield) Bushels/Acre
126
127 U.S. Grain Exports GRAINS INSPECTED AND/OR WEIGHED FOR EXPORT - 1,000 BUSHELS CURRENT PREVIOUS WEEK ENDING MARKET YEAR MARKET YEAR GRAIN 03/06/08 02/28/08 03/08/07 TO DATE TO DATE WHEAT 18,122 17,013 20, , ,351 RYE OATS BARLEY ,540 16,429 FLAXSEED , CORN 44,791 50,122 37,365 1,324,799 1,126,234 SORGHUM 5,252 4,634 2, ,015 81,738 SOYBEANS 29,857 34,081 29, , ,476 SUNFLOWER TOTAL 98, ,897 90,786 3,287,172 2,701,
128 U.S. Grain Export Sales USDA Export Sales Report 03/13 07:30 Export Sales Report for Week Ending 03/06/08 (in mil bus) Weekly New Crop Sales GRAINS Sales Unshipped Total Prev Yr Weekly Unshipped Corn Sorghum Soybeans All Wheat Durum Hard Red Spring Hard Red Winter Soft Red Winter White Wheat OTHER COMMODITIES Soyoil (000 mt) Soymeal (000 mt) Rice (000 mt) Upland Cotton(000bales)
129 World Soybean Supply and Use 1/ (Million Metric Tons) =============================================================================== : Supply : Use : :=========================:=======================:Ending Region : : : : : :stocks :Beginning:Produc-: : Domestic : : : stocks : tion :Imports: Crush : Total :Exports: =============================================================================== : : 2005/06 World 2/ : United States : Total foreign : Major exporters 3/ : Argentina : Brazil : Major importers 4/ : China : EU-27 : Japan : Mexico : : : 2006/07 (Estimated) World 2/ : United States : Total foreign : Major exporters 3/ : Argentina : Brazil : Major importers 4/ : China : EU-27 : Japan : Mexico : ===============================================================================
130 World Soybean Supply and Use 1/ (Million Metric Tons) =============================================================================== : Supply : Use : :=========================:=======================:Ending Region : : : : : :stocks :Beginning:Produc-: : Domestic : : : stocks : tion :Imports: Crush : Total :Exports: =============================================================================== : 2007/08 (Projected) World 2/ : February : March : United States : February : March : Total foreign : February : March : Major exporters 3/ : February : March : Argentina Feb : Mar : Brazil Feb : Mar : Major importers 4/ : February : March : China Feb : Mar : EU-27 Feb : Mar : Japan Feb : Mar : Mexico Feb : Mar : ===============================================================================
131
132
133
134
135
136 TABLE 3 SUPPLY/DEMAND BALANCE SHEET FOR SOYBEANS Est. Proj. USDA Ave (Million Acres) Acres Planted Acres Harvested Bu./Harvested Acre (Million Bushels) Beginning Stocks Production Imports Total Supply Use: Crushings Exports Seed and Residual Total Use Ending Stocks Ending Stocks, %of Use U.S. Loan Rate $5.00 $5.00 $5.00 $5.00 $5.00 $5.00 $5.00 $5.00 U.S. Season Average Farm Price, $/Bu. $5.53 $7.34 $5.74 $5.66 $6.43 $10.40 $11.50 $9.25 Source: USDA and Jim Hilker. ( )
137 Soybean Prices Years Prices/bushel
138 Soybean Prices versus E.S Years Prices/bushel Ending Stocks
139 Soybean Prices versus E.S. to Use Years Prices/bushel Ending Stocks
140 U.S. Soybean Price vs Ending Stocks/Use Ratio Price ($/BU) Ending Stocks/Use Ratio
141 Soybean Futures Futures Detail DAY SOYBEANS (S) [10 minute delay] Future Symbol Search Symbol Lookup More Info Month Last Chg Open High Low Volume Open Int Trade Time chart options Mar '0s 8'0 1398'0 1412'0 1387' /13/08 13:41 chart options May '6s 7'6 1413'0 1430'4 1400' /13/08 13:41 chart options Jul '6s 8'2 1427'0 1444'0 1415' /13/08 13:41 chart options Aug '0s 6'0 1424'0 1429'0 1405' /13/08 13:41 chart options Sep '0s -1'0 1384'0 1390'0 1364' /13/08 13:41 chart options Nov '4s 3'2 1334'0 1348'0 1316' /13/08 13:41 chart options Jan '0s 5'0 1349'0 1353'0 1326' /13/08 13:41 chart options Mar '0s -1'0 1357'0 1358'0 1331' /13/08 13:41 chart options May '0s 6' /13/08 13:41 chart options Jul '0s -1'0 1363'0 1363'0 1338' /13/08 13:41 chart options Aug '0s -1' /13/08 13:41 chart options Sep '0s 0' /13/08 13:41 chart options Nov '0s -3'0 1290'0 1298'0 1275' /13/08 13:41 chart options Jul '0s -5' /13/08 13:41 chart options Nov '0s 0'0 1275'0 1275'0 1275' /13/08 13:41 Thu, Mar 13, :33 PM CDT *Quotes are in market time
142 Soy Sector Futures Month Year Soybeans Soymeal Soyoil Mar May July Sept Nov Dec 337 Dec Nov Dec 317 Dec Nov Dec 311 Dec 57.00

143 May 08 Soy Futures
144

145 July 08 Soy Futures
146

147 Nov 08 Soy Futures
148
149 TABLE 3 SUPPLY/DEMAND BALANCE SHEET FOR SOYBEANS Est. Proj. USDA Ave (Million Acres) Acres Planted Acres Harvested Bu./Harvested Acre (Million Bushels) Beginning Stocks Production Imports Total Supply Use: Crushings Exports Seed and Residual Total Use Ending Stocks Ending Stocks, %of Use U.S. Loan Rate $5.00 $5.00 $5.00 $5.00 $5.00 $5.00 $5.00 $5.00 U.S. Season Average Farm Price, $/Bu. $5.53 $7.34 $5.74 $5.66 $6.43 $10.40 $11.50 $9.25 Source: USDA and Jim Hilker. ( )

150 Nov 09 Soy Futures

151 Nov 10 Soy Futures
152 Soybean Futures Futures Detail DAY SOYBEANS (S) [10 minute delay] Future Symbol Search Symbol Lookup More Info Month Last Chg Open High Low Volume Open Int Trade Time chart options Mar '0s 8'0 1398'0 1412'0 1387' /13/08 13:41 chart options May '6s 7'6 1413'0 1430'4 1400' /13/08 13:41 chart options Jul '6s 8'2 1427'0 1444'0 1415' /13/08 13:41 chart options Aug '0s 6'0 1424'0 1429'0 1405' /13/08 13:41 chart options Sep '0s -1'0 1384'0 1390'0 1364' /13/08 13:41 chart options Nov '4s 3'2 1334'0 1348'0 1316' /13/08 13:41 chart options Jan '0s 5'0 1349'0 1353'0 1326' /13/08 13:41 chart options Mar '0s -1'0 1357'0 1358'0 1331' /13/08 13:41 chart options May '0s 6' /13/08 13:41 chart options Jul '0s -1'0 1363'0 1363'0 1338' /13/08 13:41 chart options Aug '0s -1' /13/08 13:41 chart options Sep '0s 0' /13/08 13:41 chart options Nov '0s -3'0 1290'0 1298'0 1275' /13/08 13:41 chart options Jul '0s -5' /13/08 13:41 chart options Nov '0s 0'0 1275'0 1275'0 1275' /13/08 13:41 Thu, Mar 13, :33 PM CDT *Quotes are in market time
153 Soy Sector Futures Month Year Soybeans Soymeal Soyoil Mar May July Sept Nov Dec 337 Dec Nov Dec 317 Dec Nov Dec 311 Dec 57.00
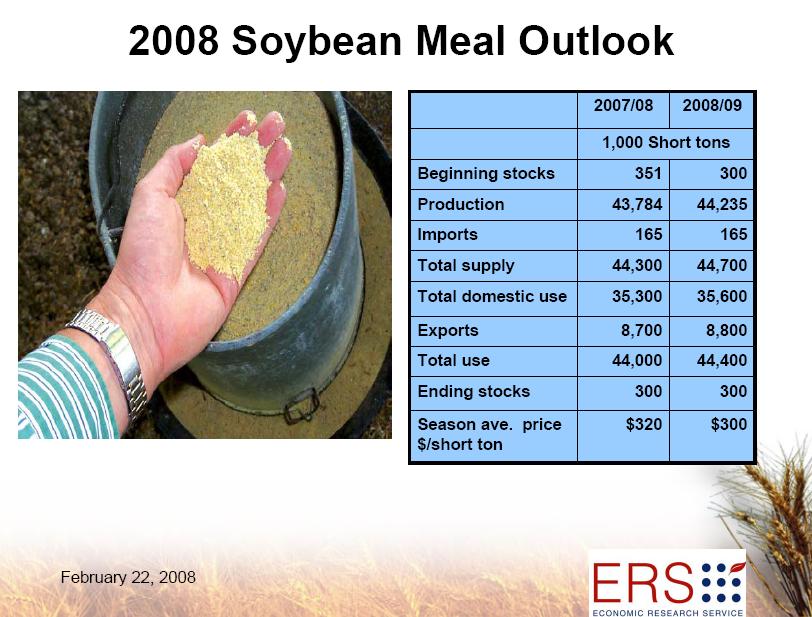
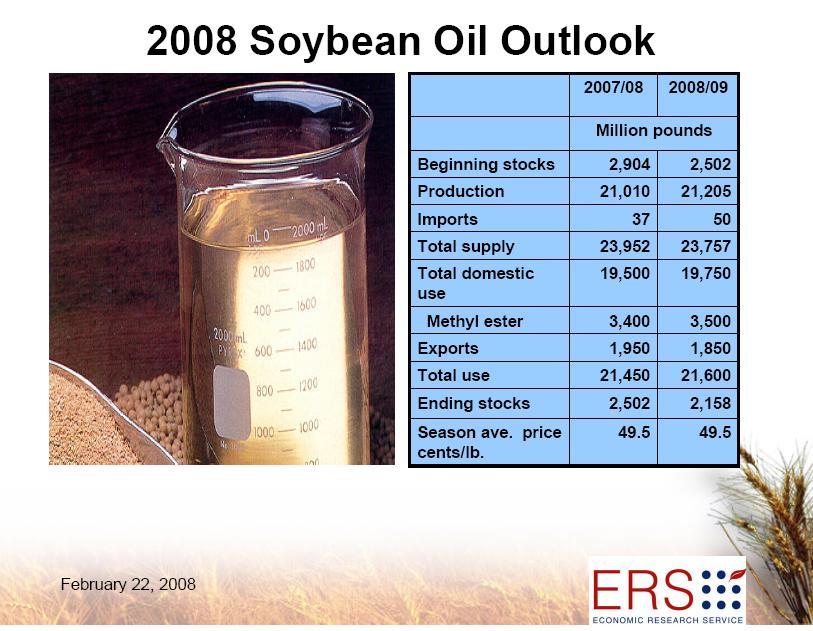
154 U.S. Soybeans and Products Supply and Use (Domestic Measure) 1/ =============================================================================== : : : 2007/08 Projections Item : 2005/06 : 2006/07 :=============================== : : Est. : February March =============================================================================== : : Million pounds SOYBEAN OIL: : Beginning stocks : 1,699 3,010 2,904 2,904 Production : 20,387 20,487 21,010 21,195 Imports : Supply, total : 22,122 23,535 23,952 24,137 Domestic : 17,959 18,743 19,500 18,900 For methyl ester 4/ : 1,555 2,796 3,400 2,800 Exports : 1,153 1,888 1,950 2,400 Use, total : 19,112 20,630 21,450 21,300 Ending stocks : 3,010 2,904 2,502 2,837 Average price (c/lb) 2/ : : : : Thousand short tons SOYBEAN MEAL: : Beginning stocks : Production : 41,244 43,027 43,784 43,784 Imports : Supply, total : 41,557 43,497 44,300 44,300 Domestic : 33,195 34,360 35,300 35,300 Exports : 8,048 8,786 8,700 8,700 Use, total : 41,243 43,146 44,000 44,000 Ending stocks : Average price ($/s.t.) 2/ : : ===============================================================================
155
156
157
158
159
160
161 Soymeal Futures Futures Detail DAY SOYBEAN MEAL (SM) [10 minute delay] Future Symbol Search Symbol Lookup More Info Month Last Chg Open High Low Volume Open Int Trade Time chart options Mar s /13/08 13:55 chart options May s /13/08 13:55 chart options Jul s /13/08 13:55 chart options Aug s /13/08 13:55 chart options Sep s /13/08 13:55 chart options Oct s /13/08 13:55 chart options Dec s /13/08 13:55 chart options Jan s /13/08 13:55 chart options Mar s /13/08 13:55 chart options May s /13/08 13:55 chart options Jul s /13/08 13:55 chart options Aug s /13/08 13:55 chart options Sep s /13/08 13:55 chart options Oct s /13/08 13:55 chart options Dec s /13/08 13:55 chart options Jul s /13/08 13:55 chart options Oct s /13/08 13:55 chart options Dec s /13/08 13:55 Thu, Mar 13, :37 PM CDT *Quotes are in market time

162 July 08 Meal Futures
163
164 Soyoil Futures Futures Detail DAY SOYBEAN OIL (BO) [10 minute delay] Future Symbol Search Symbol Lookup More Info Month Last Chg Open High Low Volume Open Int Trade Time chart options Mar s /13/08 12:25 chart options May s /13/08 13:41 chart options Jul s /13/08 13:41 chart options Aug s /13/08 13:41 chart options Sep s /13/08 13:41 chart options Oct s /13/08 13:41 chart options Dec s /13/08 13:41 chart options Jan s /13/08 13:41 chart options Mar s /13/08 13:41 chart options May s /13/08 13:41 chart options Jul s /13/08 13:41 chart options Aug s /13/08 13:41 chart options Sep s /13/08 13:41 chart options Oct s /13/08 13:41 chart options Dec s /13/08 13:41 chart options Jul s /13/08 13:41 chart options Oct s /13/08 13:41 chart options Dec s /13/08 13:41 Thu, Mar 13, :40 PM CDT *Quotes are in market time

165 May 08 SoyOil Futures
166 Soy Sector Futures Month Year Soybeans Soymeal Soyoil Mar May July Sept Nov Dec 337 Dec Nov Dec 317 Dec Nov Dec 311 Dec 57.00
167 My Cash Bids for U.S. Zip Code 48824, Radius 100 miles Elevator Distance Date Corn Corn, New Soybeans Soybeans, New HRW #1 SRW ADM GRAIN CO 13 3/ ADM GRAIN CO 17 3/ MACCPS 29 3/ WOODBURY GRAIN LLC 30 3/
168 Break-even soybean price / bu for alternative cor soy yields given corn price of 5.00 $/bu Soybean yield, bu/acre Corn 130 $12.45 $10.93 $9.75 yield 140 $13.73 $12.05 $10.74 bu/acre 150 $15.01 $13.17 $11.74
169 Break-even soybean yield (bu/ acre) for alternativ corn & soybean prices given an expected corn yield of 140 bu / acre Soybean price, $/ bu $9.60 $12.00 $14.40 Corn $ price $ $/bu $
170
171 SO HOW DO I MAKE CORN AND SOYBEAN PRICING DECISIONS? The first step in this new approach is to select the appropriate time window for pricing corn and soybean crops. The second step in the new approach is to determine the relevant set of crop pricing strategies. The third step in the new approach is to decide on the proportions of the crop to be marketed via each of the pricing strategies. The fourth step in the new approach is to evaluate performance after the marketing window is completed. University of Illinois,
172 Decide on the proportions of the crop to be marketed via each of the pricing strategies. Mechanical Active Self-Directed %? %? Externally-Managed %? %?

173 Decide on the proportions of the crop to be marketed via each of the pricing strategies.
174 Decide on the proportions of the crop to be marketed via each of the pricing strategies. Mechanical Active Self-Directed 0 %? 25 %? Externally-Managed 25%? 50 %?
175 Decide on the proportions of the crop to be marketed via each of the pricing strategies. Mechanical Active Self-Directed 60 %? 10 %? Externally-Managed 20%? 10 %?
176
177
178
179
180
181
182
183
Soybeans face make or break moment Futures need a two-fer to avoid losses By Bryce Knorr, senior grain market analyst
 Soybeans face make or break moment Futures need a two-fer to avoid losses By Bryce Knorr, senior grain market analyst A year ago USDA shocked the market by cutting its forecast of soybean production, helping
Risk Management & Profitability
 Risk Management & Profitability The challenge to making money and being profitable in any industry is 2 fold First you have to maximize production and minimize cost. Second, you have to know how to manage
Soybeans face long road End to tariffs wouldn t help 2018 exports much By Bryce Knorr, senior grain market analyst
 Soybeans face long road End to tariffs wouldn t help 2018 exports much By Bryce Knorr, senior grain market analyst Forecasting grain prices is relatively easy in normal times. Most models assume the future
Marketing Strategies for Robert Anwender Grain Merchandiser
 Marketing Strategies for 2015 Robert Anwender Grain Merchandiser Marketing Tips for 2015 and Forward! Build a Knowledge Base: Stay in tune with market fundamentals Understand how a volatile dollar affects
AGRICULTURAL COMMODITY FUNDAMENTALS AND OUTLOOK
 AGRICULTURAL COMMODITY FUNDAMENTALS AND OUTLOOK Lewis Hagedorn Agricultural Commodity Strategist, J.P. Morgan Chase Bank NA lewis.a.hagedorn@jpmorgan.com 212.834.846 A L L Y P R I V A T E A N D CONFIDENTIA
BUSINESS AND MARKETING TOOLS FOR PROFITABLE FARMING. Summer Crossroads: Volatility and Opportunity. Bryce Knorr Farm Futures Magazine
 Summer Crossroads: Volatility and Opportunity Bryce Knorr Farm Futures Magazine Don t Bury The Lead Why were soybeans up more than 50 cents despite higher acres? 2014 crop likely smaller Acreage up in
Advance Trading, Inc. Supply/Demand Summary
 Corn Advance Trading, Inc. Supply/Demand Summary Planted Acres 88.0 94.0 90.2 90.2 0.0 89.1 89.1 0.0 % Harvested 91.8% 92.2% 91.7% 91.7% 91.8% 91.8% Harvested Acres 80.8 86.7 82.7 82.7 0.0 81.8 81.8 0.0
Fall 2017 Crop Outlook Webinar
 Fall 2017 Crop Outlook Webinar Chris Hurt, Professor & Extension Ag. Economist James Mintert, Professor & Director, Center for Commercial Agriculture Fall 2017 Crop Outlook Webinar October 13, 2017 50%
Purdue Outlook Update 2011
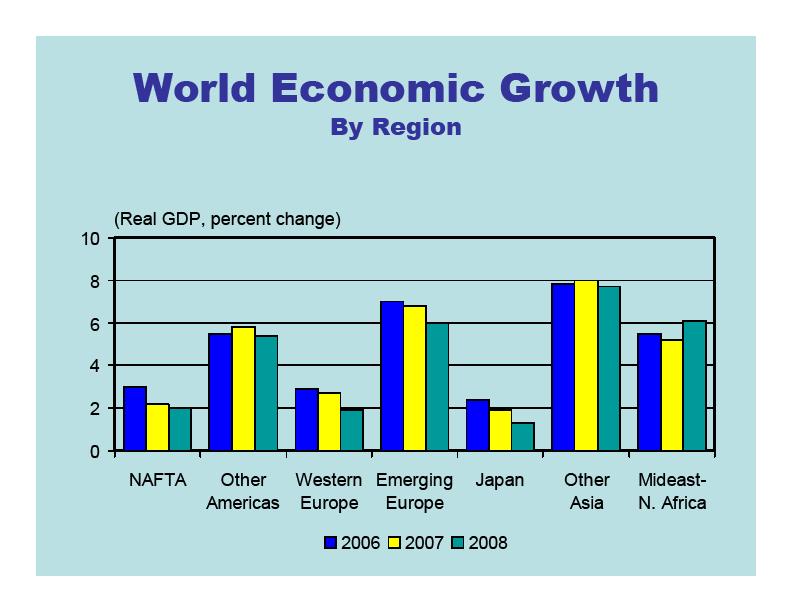
 Percent Purdue Outlook Update 211 211 Indiana Agricultural Outlook Corinne Alexander & Chris Hurt hurtc@purdue.edu Ethanol World Economic Growth Dollar Value Surprises and Uncertainty! Change Wheat Production
UK Grain Marketing Series January 19, Todd D. Davis Assistant Extension Professor. Economics
 Introduction to Basis, Cash Forward Contracts, HTA Contracts and Basis Contracts UK Grain Marketing Series January 19, 2016 Todd D. Davis Assistant Extension Professor Outline What is basis and how can
Wheat market may take patience Exports, seasonal weakness weigh on prices for now. By Bryce Knorr, Senior Grain Market Analyst
 Wheat market may take patience Exports, seasonal weakness weigh on prices for now By Bryce Knorr, Senior Grain Market Analyst The best days of the wheat rally may still be ahead. But first the market may
Crops Marketing and Management Update
 Crops Marketing and Management Update Grains and Forage Center of Excellence Dr. Todd D. Davis Assistant Extension Professor Department of Agricultural Economics Vol. 2018 (2) February 14, 2018 Topics
Crops Marketing and Management Update
 Crops Marketing and Management Update Grains and Forage Center of Excellence Dr. Todd D. Davis Assistant Extension Professor Department of Agricultural Economics Vol. 2018 (3) March 11, 2018 Topics in
10/06/2013. USA: Planting Progress Corn. XXVI FEFAC Congress
 XXVI FEFAC Congress Outlook on the EU and global oilseeds and cereals markets / campaign 2013 1014. COCERAL view on the impacts of the EU financial markets reform Stefan Vogel Vice President COCERAL Price
Fourth Quarter 2014 Earnings Conference Call. 26 November 2014
 Fourth Quarter 2014 Earnings Conference Call 26 November 2014 Safe Harbor Statement & Disclosures The earnings call and accompanying material include forward-looking comments and information concerning
Evaluation and Outlook of the US Inland Barge Industry. June 2003
 Prepared for: US Inland Barge Multi- Client Study Participants Evaluation and Outlook of the US Inland Barge Industry June 2003 Prepared by: TABLE OF CONTENTS LIST OF FIGURES... 3 BACKGROUND... 7 METHODOLOGY...
GAO. U.S. DEPARTMENT OF AGRICULTURE Marketing Assistance Loan Program Should Better Reflect Market Conditions
 GAO November 1999 United States General Accounting Office Report to the Ranking Minority Member, Subcommittee on Forestry, Conservation, and Rural Revitalization, Committee on Agriculture, Nutrition, and
Storing Unpriced Grain: Strategies & Tools
 Storing Unpriced Grain: Strategies & Tools December 2013 Steven D. Johnson Farm & Ag Business Management Specialist (515) 957-5790 sdjohns@iastate.edu www.extension.iastate.edu/polk/farm-management Crop
Crop Risk Management
 Crop Risk Management January 28 th, 2010 Steven D. Johnson Farm & Ag Business Management Specialist (515) 957 5790 sdjohns@iastate.edu www.extension.iastate.edu/polk/farmmanagement.htm Source: Johnson,
Crops Marketing and Management Update
 Crops Marketing and Management Update Department of Agricultural Economics Princeton REC Dr. Todd D. Davis Assistant Extension Professor -- Crop Economics Marketing & Management Vol. 2016 (2) February
SOYBEAN COMPLEX SPRING OUTLOOK
 30 141 W. Jackson Boulevard THE HIGHTOWER REPORT FUTURES ANALYSIS & FORECASTING Suite 4002 Chicago, Illinois 60604 312-786-4450 / 800-662-9346 www.futures-research.com Special Report SOYBEAN COMPLEX SPRING
4Q 2017 Earnings Call. 22 November 2017
 4Q 2017 Earnings Call 22 November 2017 1 Safe Harbor Statement & Disclosures The earnings call and accompanying material include forward-looking comments and information concerning the company s plans
Michael V. Dunn Commissioner Commodity Futures Trading Commission. Agricultural Outlook Forum February 24,
 Michael V. Dunn Commissioner Commodity Futures Trading Commission Agricultural Outlook Forum February 24, 2011 1 Commodity Futures Trading Commission Mission Statement To Protect Market Users and the Public
Crops Marketing and Management Update
 Crops Marketing and Management Update Grains and Forage Center of Excellence Dr. Todd D. Davis Assistant Extension Professor Department of Agricultural Economics Vol. 2017 (2) February 16, 2017 Topics
2Q 2018 Earnings Call. 18 May 2018
 2Q 2018 Earnings Call 18 May 2018 1 Safe Harbor Statement & Disclosures The earnings call and accompanying material include forward-looking comments and information concerning the company s plans and projections
Turner s Take WASDE Expectations vs. Sept WASDE report:
 Published by: Craig Turner 11/4/2013 4:02:09 PM In this issue 1) CORN: USDA Friday exected to be bearish. Looking to short Corn ahead of WASDE 2) SOYBEANS: Short Bean Ideas with Long Call Protection 3)
3Q 2018 Earnings Call. 17 August 2018
 3Q 2018 Earnings Call 17 August 2018 1 Safe Harbor Statement & Disclosures The earnings call and accompanying material include forward-looking comments and information concerning the company s plans and
THE HIGHTOWER REPORT
 Futures Analysis & Forecasting HightowerReport.com March 21, 214 Strategies for March 31st Report: Non-standard Options New, non-standard options at the CME can be great tools for commodity traders, especially
Closing Grain & Soybean Comments
 SRW and HRW futures finished 7-10 cents lower and were down 10-12 at their lowest point. HRS futures finished just 3-7 cents lower. The continued US shutout on major export business, stronger US dollar
2015 Third Quarter Earnings Call. November 5, 2015
 2015 Third Quarter Earnings Call November 5, 2015 20 5 The Andersons, Inc. Forward Looking Statements Certain information discussed today constitutes forward-looking statements. Actual results could differ
Commodity Price Outlook & Risks
 Commodity Outlook & Risks Research Department, Commodities Team 1 December 22, 20 www.imf.org/commodities commodities@imf.org This monthly report presents a price outlook and risk assessment for selected
3Q17 and 9M17 Results NOVEMBER 2017
 3Q17 and 9M17 Results NOVEMBER 2017 Brazilian Fertilizer Market The Company & Financial Highlights Outlook In thousands of metric tons BRAZILIAN FERTILIZER MARKET - DELIVERIES +9.8% +1.3% +6.7% +3.3% 22,294
Background Information
 March 1998 Revised March 19, 1998 Statutory Authority Sections 131 through 136 of the Federal Agriculture Improvement and Reform Act of 1996 (1996 Act), P.L. 104-127 (7 USC 7231-7236) require that a nonrecourse
Third Quarter Earnings Call. November 8, 2016
 Third Quarter Earnings Call November 8, 2016 Forward Looking Statements & Non-GAAP Measures Certain information discussed today constitutes forward-looking statements. Actual results could differ materially
Commodity Price Outlook & Risks
 Commodity Outlook & Risks Research Department, Commodities Team 1 September 18, 20 www.imf.org/commodities commodities@imf.org This monthly report presents a price outlook and risk assessment for selected
ACE 427 Spring Lecture 6. by Professor Scott H. Irwin
 ACE 427 Spring 2013 Lecture 6 Forecasting Crop Prices with Futures Prices by Professor Scott H. Irwin Required Reading: Schwager, J.D. Ch. 2: For Beginners Only. Schwager on Futures: Fundamental Analysis,
How to Write a Pre-Harvest Marketing Plan
 How to Write a Pre-Harvest Marketing Plan Edward Usset, Grain Marketing Economist University of Minnesota Columnist, Corn & Soybean Digest usset001@umn.edu www.cffm.umn.edu Three slides that explain the
Common Crop Insurance Policy 2011 Crop Year
 Common Crop Insurance Policy 2011 Crop Year Source: RMA Common Crop Insurance Policy An initiative by the Risk Management Agency (RMA) to combine and simplify the crop insurance program RMA has combined
By Tom Leffler and Larry Glenn. 14- Day RSI. 10-Day Moving Avg. Today's Low
 www.lefflercom.com By Tom Leffler and Larry Glenn TODAY S THOUGHT Friday, December 30, 2016 HAPPY NEW YEAR 2017 MONDAY, JAN 2 ND GRAINS OPEN AT 7 PM.TUESDAY, JAN 3 RD LIVESTOCK OPENS AT 8:30 AM Tues Jan
Seed Cotton Informational Meeting. Price Loss Coverage Program (PLC)
") Seed Cotton Informational Meeting Price Loss Coverage Program (PLC) PLC Overview PLC is an Income Support Program PLC payments are not dependent upon planting of the crop PLC is the default program election
Seed Cotton Informational Meeting Price Loss Coverage Program (PLC) PLC Overview PLC is an Income Support Program PLC payments are not dependent upon planting of the crop PLC is the default program election
Influences on the Market. Common Marketing Terms. Types of Contracts. Terms of Contracts
 Jackie Reichter DeBruce Grain, Nebraska City Grain Marketing Commodity od Exchanges/Futures Symbols Influences on the Market Common Marketing Terms Types of Contracts Terms of Contracts Commodity Exchanges
Agricultural Act of 2014
 Farm Bill Cash Flow 2017 Outlook Conference for Agricultural Lenders Grand Forks Oct. 16 Fargo Oct. 31 Andrew Swenson Extension Farm Management Specialist Department of Agribusiness and Applied Economics
Fall fertilizer costs pinch budgets Three-year high in urea leads market gains By Bryce Knorr, grain market analyst
 Fall fertilizer costs pinch budgets Three-year high in urea leads market gains By Bryce Knorr, grain market analyst Fertilizer costs start September at their highest levels in a couple years, putting further
Macroeconomic Outlook: Implications for Agriculture. It has been 26 years since we have experienced a significant recession
 Macroeconomic Outlook: Implications for Agriculture John B. Penson, Jr. Regents Professor and Stiles Professor of Agriculture Texas A&M University Our Recession History September 1902 August1904 23 May
2014 Actual Average County Yield. times. higher of: Month Market Year Average Price or National Loan Rate 86% times
 Cotton Transition, Price Loss Coverage, County Agricultural Risk Coverage, and Individual Agricultural Risk Coverage Diagram for the 2014 Crop Year May 15, 2014 Step 1: Producers on a farm must make a
2014 Farm Bill Update. International Crop Expo February 19, 2015
 2014 Farm Bill Update International Crop Expo February 19, 2015 Decisions Operators and Owners Need to Make Yield Update Base Reallocation Choice of Safety Net Yield Update Everyone should attempt to update
Commodity Programs in 2014 Farm Bill. Key Provisions
 Commodity Programs in 2014 Farm Bill Gary Schnitkey, Jonathan Coppess, Nick Paulson, and Carl Zulauf University of Illinois The Ohio State University (February 13, 2014) 1 Key Provisions Eliminates direct,
Factors in the Hog Market. Michael Swanson Ph.D. Wells Fargo Ag Industries
 Factors in the Hog Market June 2011 Michael Swanson Ph.D. Wells Fargo Ag Industries System analysis: new linkages No more domestic markets No market will be purely domestic New secondary drivers Global
NGFA Country Elevator Conference St. Louis, Missouri Dec. 9, 2013
 Pat Westhoff (westhoffp@missouri.edu) Director, Food and Agricultural Policy Research Institute Professor, Agricultural and Applied Economics University of Missouri www.fapri.missouri.edu NGFA Country
Commodity Price Outlook & Risks
 Commodity Outlook & Risks Research Department, Commodities Team 1 December 17, 20 www.imf.org/commodities commodities@imf.org This monthly report presents a price outlook and risk assessment for selected
Understanding Markets and Marketing
 Art Understanding Markets and Marketing Randy Fortenbery School of Economic Sciences College of Agricultural, Human, and Natural Resource Sciences Washington State University The objective of marketing
Commodity Price Outlook & Risks
 Commodity Outlook & Risks Research Department, Commodities Team March, 2 www.imf.org/commodities commodities@imf.org This monthly report presents a price outlook and risk assessment for selected commodities
Managing Agricultural Risk July 2011
 Managing Agricultural Risk July 2011 Michael Swanson Ph.D. Wells Fargo Ag Industries Easy to confuse Dangerous when confused Wells Fargo Ag Industries - 2 Is Agricultural Risk Rising? Yes Quantifiably
Fundamental Factors Affecting Agricultural and Other Commodities. Research & Product Development Updated July 11, 2008
 Fundamental Factors Affecting Agricultural and Other Commodities Research & Product Development Updated July 11, 2008 Outline Review of key supply and demand factors affecting commodity markets World stocks-to-use
Agricultural Economic Update
 Agricultural Economic Update March 2, 217 Nate Kauffman Omaha Branch Executive and Economist Federal Reserve Bank of Kansas City The views expressed are those of the author and do not necessarily reflect
Brian Grossman (312) ZANER Ag. Burn It All Down Monday Markets
 ZANER Ag. Burn It All Down Monday Markets") Brian Grossman (312) 277-0119 @AgHedgeBrian bgrossman@zaner.com Ag Burn It All Down Monday Markets USDA report day, Friday did little to entice much of any market direction and ultimately left much market
Brian Grossman (312) 277-0119 @AgHedgeBrian bgrossman@zaner.com Ag Burn It All Down Monday Markets USDA report day, Friday did little to entice much of any market direction and ultimately left much market
Second Quarter 2011 Earnings Conference Call. 18 May 2011
 Second Quarter 2011 Earnings Conference Call 18 May 2011 Safe Harbor Statement & Disclosures The earnings call and accompanying material include forward-looking comments and information concerning the
Market Outlook. David Reinbott.
 Market Outlook David Reinbott Agriculture Business Specialist P.O. Box 187 Benton, MO 63736 (573) 545-3516 http://extension.missouri.edu/scott/agriculture.aspx reinbottd@missouri.edu Cotton Fundamentals
GRAIN HEDGE POSITION REPORT
 GRAIN HEDGE POSITION REPORT CROP: Corn DATE: April 16, 2006 LONG POSITION SHORT POSITION Total Grain on Hand 753896 Grain in Transit Total Offsite Grain Total Stocks 753896 Unpriced Grain Storage 106375
Farm Bill Meeting Stoddard County
 Farm Bill Meeting Stoddard County David Reinbott Agriculture Business Specialist P.O. Box 187 Benton, MO 63736 (573) 545-3516 http://extension.missouri.edu/scott/agriculture.aspx reinbottd@missouri.edu
MARKETLINE. Soybeans: South American Pressure. Cash Only. Future Hedgers. What to Sell. Future Hedgers. Only
 MARKETLINE www.progressiveag.com 701-277-9210 1-800-450-1404 February 26, 2016 What to Sell Cash Only Cash Only Future Hedgers Future Hedgers Week s Rank 2015 2016 2015 2016 1. HRS Wheat 30% 0% 30% 0%
EU Market Situation for Poultry. Committee for the Common Organisation of the Agricultural Markets 24 August 2017
 EU Market Situation for Poultry Committee for the Common Organisation of the Agricultural Markets 24 August 217 -7.2% -7.7% -1.6% -1.7% -1.7% -2.1% -2.5% 4.1% 3.6% 3.5% 2.8% 1.9% 1.2%.8%.8%.6%.4%.2%.%.%.%.%
December 6-7, Steven D. Johnson. Farm & Ag Business Management Specialist
 December 6-7, 2018 Steven D. Johnson Farm & Ag Business Management Specialist (515) 957-5790 sdjohns@iastate.edu www.extension.iastate.edu/polk/farm-management 1 Learning Objectives Highlight Current Corn
Post Harvest Marketing Tips
 Post Harvest Marketing Tips (from my best friends) Edward Usset Grain Marketing Economist, University of Minnesota usset001@umn.edu Corn & Soybean Digest columnist Center for Farm Financial Management
Winter fertilizer bargains could be rare Global market shows signs of stability By Bryce Knorr, grain market analyst
 Winter fertilizer bargains could be rare Global market shows signs of stability By Bryce Knorr, grain market analyst While fertilizer costs continued to edge mostly higher this week, the strong summer
DCP VERSUS ACRE in 2013 For Indiana Farms
 DCP VERSUS ACRE in 2013 For Indiana Farms The extension of the last farm bill for 2013 crops means that individuals need to make the decision of whether to participate in the regular Direct and Countercyclical
Farm Bill Meeting Scott County
 Farm Bill Meeting Scott County David Reinbott Agriculture Business Specialist P.O. Box 187 Benton, MO 63736 (573) 545-3516 http://extension.missouri.edu/scott/agriculture.aspx reinbottd@missouri.edu 1.
2002 FSRIA. Farm Security & Rural Investment Act. (2002 Farm Bill) How much money is spent with the United States Department of Agriculture (USDA)?
 How much money is spent with the United States Department of Agriculture (USDA)?") 2002 FSRIA Farm Security & Rural Investment Act (2002 Farm Bill) Some general background: How much money is spent with the United States Department of Agriculture (USDA)? How much money is spent on farm
2002 FSRIA Farm Security & Rural Investment Act (2002 Farm Bill) Some general background: How much money is spent with the United States Department of Agriculture (USDA)? How much money is spent on farm
BESTER DERIVATIVE TRADING TECHNICAL BRIEF
 9 November 2018 US DOLLAR INDEX BESTER DERIVATIVE TRADING TECHNICAL BRIEF The US Dollar Index is developing the third upward leg inside an upward sloping channel which started in September. Resistance
Fourth Quarter 2011 Earnings Conference Call. 23 November 2011
 Fourth Quarter 2011 Earnings Conference Call 23 November 2011 Safe Harbor Statement & Disclosures The earnings call and accompanying material include forward-looking comments and information concerning
Informed Storage: Understanding the Risks and Opportunities
 Art Informed Storage: Understanding the Risks and Opportunities Randy Fortenbery School of Economic Sciences College of Agricultural, Human, and Natural Resource Sciences Washington State University The
Pat Westhoff FAPRI-MU, University of Missouri
 Agricultural Lender meetings Dexter and Sikeston, MO December 1, 214 Pat Westhoff (westhoffp@missouri.edu) FAPRI-MU, University of Missouri www.fapri.missouri.edu Eliminates many existing farm programs
1Q 2019 Earnings Call. 15 February 2019
 1Q 2019 Earnings Call 15 February 2019 1 Safe Harbor Statement & Disclosures The earnings call and accompanying material include forward-looking comments and information concerning the company s plans
Fourth Quarter 2016 Earnings Conference Call. 23 November 2016
 Fourth Quarter 2016 Earnings Conference Call 23 November 2016 Safe Harbor Statement & Disclosures The earnings call and accompanying material include forward-looking comments and information concerning
Structure and Function of the Federal Reserve System
 1/17/17 Economic Outlook Cortney Cowley Economist Federal Reserve Bank of Kansas City Omaha Branch October, 17 The views expressed are those of the author and do not necessarily reflect the opinions of
Grain Stocks. Corn Stocks Up 11 Percent from March 2014 Soybean Stocks Up 34 Percent All Wheat Stocks Up 6 Percent
 Grain Stocks ISSN: 1949-0925 Released March 31, 2015, by the National Agricultural Statistics Service (NASS), Agricultural Statistics Board, United s Department of Agriculture (USDA). Corn Stocks Up 11
Agriculture Update. Global. Food versus feed in the wheat market. Commodities Research. Sharp decline in corn supplies requires more wheat feeding
 Agriculture Update Food versus feed in the wheat market Commodities Research Sharp decline in corn supplies requires more wheat feeding We forecast that the US drought will bring corn supplies sharply
Step Up Your Grain Game! Crop Economics for 2018
 Step Up Your Grain Game! Crop Economics for 2018............................... Roy Arnott, P.Ag. & Darren Bond, P.Ag. Farm Management Specialists What we already know Doing your cost of production for
Second Quarter Earnings Call. August 8, 2018
 Second Quarter Earnings Call August 8, 2018 1 Safe Harbor and Non-GAAP Financial Measures Certain information discussed today constitutes forward-looking statements. Actual results could differ materially
Should Basic Underwriting Rules be Applied to Average Crop Revenue Election and Supplemental Revenue?
 Journal of Agricultural and Applied Economics, 42,3(August 2010):517 535 Ó 2010 Southern Agricultural Economics Association Should Basic Underwriting Rules be Applied to Average Crop Revenue Election and
MARKETLINE. Soybeans: Bullish Acreage Report. Cash Only. Future Hedgers. What to Sell. Future Hedgers. Only
 MARKETLINE www.progressiveag.com 701-277-9210 1-800-450-1404 April 1, 2016 What to Sell Cash Only Cash Only Future Hedgers Future Hedgers Week s Rank 2015 2016 2015 2016 1. HRS Wheat 30% 0% 30% 0% 2. Soybeans
Indicators of the Kansas Economy
 Governor s Council of Economic Advisors Indicators of the Kansas Economy A Review of Economic Trends and the Kansas Economy 1000 S.W. Jackson St. Suite 100 Topeka, KS 66612-1354 Phone: (785) 296-0967 Fax:
Managing Margins in 2017
 Managing Margins in 2017 12 th Farming for the Future Conference Coalition to Support Iowa s Farmers Ames, Iowa Jan. 19, 2017 Alejandro Plastina Assistant Professor plastina@iastate.edu 515-294-6160 Chad
Second Quarter 2016 Earnings Conference Call. 20 May 2016
 Second Quarter 2016 Earnings Conference Call 20 May 2016 Safe Harbor Statement & Disclosures The earnings call and accompanying material include forward-looking comments and information concerning the
Dairy Outlook. July By Jim Dunn Professor of Agricultural Economics, Penn State University. Market Psychology
 Dairy Outlook July 2013 By Jim Dunn Professor of Agricultural Economics, Penn State University Market Psychology The CME block price fell by 5% in the last month, ending 8.75 /lb. lower at $1.665/lb. Most
RECESSION AND RECOVERY IN NEBRASKA AND THE U.S.
 RECESSION AND RECOVERY IN NEBRASKA AND THE U.S. Alison Felix Senior Economist Federal Reserve Bank of Kansas City The views expressed are those of the presenter and do not necessarily reflect the positions
The Common Crop (COMBO) Policy
 Policy") The Common Crop (COMBO) Policy Agricultural Marketing Policy Center Linfield Hall P.O. Box 172920 Montana State University Bozeman, MT 59717-2920 Tel: (406) 994-3511 Fax: (406) 994-4838 Email: ampc@montana.edu
The Common Crop (COMBO) Policy Agricultural Marketing Policy Center Linfield Hall P.O. Box 172920 Montana State University Bozeman, MT 59717-2920 Tel: (406) 994-3511 Fax: (406) 994-4838 Email: ampc@montana.edu
Saturday, January 5, Notes from Al
 Get This Newsletter Every Saturday from Al Kluis Commodities..."Your Markets, Right Now"...AlKluis.com Saturday, January 5, 2013 Notes from Al Happy New Year and welcome to a volatile 2013. It has been
Jefferies 2014 Global Industrials Conference. August 11, 2014
 Jefferies 2014 Global Industrials Conference August 11, 2014 Disclaimer Safe Harbor Statement under the Private Securities Litigation Reform Act of 1995 This presentation contains forward-looking statements
North American Free Trade Agreement & the Canadian Sugar Market
 North American Free Trade Agreement & the Canadian Sugar Market USDA Agricultural Outlook Forum February 19, 2010 North American Sugar Industry Canadian Sugar Operations Prior to 1980, there were ten sugar
MONTHLY MILK & FEED MARKET UPDATE
 MONTHLY MILK & FEED MARKET UPDATE Provided By: Curtis Bosma - (312) 870-1185 - curtisb@highgroundtrading.com December 2014 A Sinking Ship? As the leaves began to fall, so did milk futures. Cheese sellers
AGRICULTURAL RISK MANAGEMENT. Global Grain Geneva November 12, 2013
 AGRICULTURAL RISK MANAGEMENT Global Grain Geneva November 12, 2013 Managing Price Risk is Easier to Swallow Than THE ALTERNATIVE Is Your Business Protected Is Your Business Protected Is Your Business Protected
Top Producer Conference Chicago, Illinois January 21, 2009
 Top Producer Conference Chicago, Illinois January 21, 2009 A Primer on Risk Management 2009 Jeff Beal JERRY GULKE S STRATEGIC MARKETING SERVICES, INC. PO BOX 6222, ROCKFORD, IL, 61125 Phone: 602-795-5893
DAILY MARKET REPORT 16 APRIL 2019
 DAILY MARKET REPORT 16 APRIL 2019 Unigrain (Pty) Ltd Tel. No. : +27 11 692 4400 Fax. No. : +27 11 412 1183 Economic Indicators Quote at 12h00 previous day Current quote Change % Change Rand/Dollar 13.93
Banco Central de la República Argentina
 Macroeconomic effects of commodity prices evolution and its relation with monetary policy in emerging countries Banco Central de la República Argentina The implementation of monetary policy: Lessons from
Grain Market Prospects for 2017
 Grain Market Prospects for 2017 A Test Drive of 2017 Grain Sales Strategies Jewell, Kansas January 10, 2017 DANIEL O BRIEN EXTENSION AGRICULTURAL ECONOMIST Probability of Corn Futures Trends Examining
PRF Insurance: background
 Rainfall Index and Margin Protection Insurance Plans 2017 Ag Lenders Conference Garden City, KS October 2017 Dr. Monte Vandeveer KSU Extension Agricultural Economist PRF Insurance: background Pasture,
Weather & crops conditions
 Trade Weekly volume - thousand tonnes Total MY - million tonnes Weekly volume - thousand tonnes Total MY - million tonnes Weekly volume - thousand tonnes Total MY - million tonnes Million tonnes Production
DAILY GRAINS COMMENTARY Monday January 04, 2016
 DAILY GRAINS COMMENTARY Monday January 04, 2016 DAILY SOY COMPLEX COMMENTARY Nice widespread rains for central/northern Brazil plus selling? SOY BEANS -4.4, BEAN OIL -0.4, SOYMEAL -0.4 OVERNIGHT DEVELOPMENTS:
Fertilizer market starts to crack India nabs lower prices in latest urea tender By Bryce Knorr, grain market analyst
 Fertilizer market starts to crack India nabs lower prices in latest urea tender By Bryce Knorr, grain market analyst When India talks in the fertilizer market, the world listens. The large importer of