BUSINESS AND MARKETING TOOLS FOR PROFITABLE FARMING. Summer Crossroads: Volatility and Opportunity. Bryce Knorr Farm Futures Magazine
|
|
|
- Ann Hardy
- 5 years ago
- Views:
Transcription
1 Summer Crossroads: Volatility and Opportunity Bryce Knorr Farm Futures Magazine
2 Don t Bury The Lead Why were soybeans up more than 50 cents despite higher acres? 2014 crop likely smaller Acreage up in the air The report changed everything; the report changed nothing. We could still see beans with an 8 or a 9 or beans with an 11 or 12 handle.
3 Stocks/Use Ratios Favor Rebounds December Corn May s/u below 13% 9 times since 1995 Mar/May highs > fall highs 8 times Fall high $4.39 = Min rally: $ November Soybeans May s/u below 15% 14 times since 1995 Jun/Nov highs > fall highs 14 times Fall high $ = Min rally $10.85 BUSINESS AND MARKETING TOOLS FOR PROFITABLE FARMING
4 Key Trends From Drought to Floods Acreage Questions/Yield Uncertainty El Nino Is Back Large Global Supplies Competition Strong Chinese Bubble Wither Wall Street?
5 Prospects Improve $300 Average U.S. Profit/Loss Per Acre Assumes average cash prices and costs with current yield for 2015 $250 $200 $150 $100 $50 $0 $50 $100 Corn Soybeans Wheat $150 Source: USDA, *Farm Futures Projections

6 Wet Month

7 Remnants of Bill
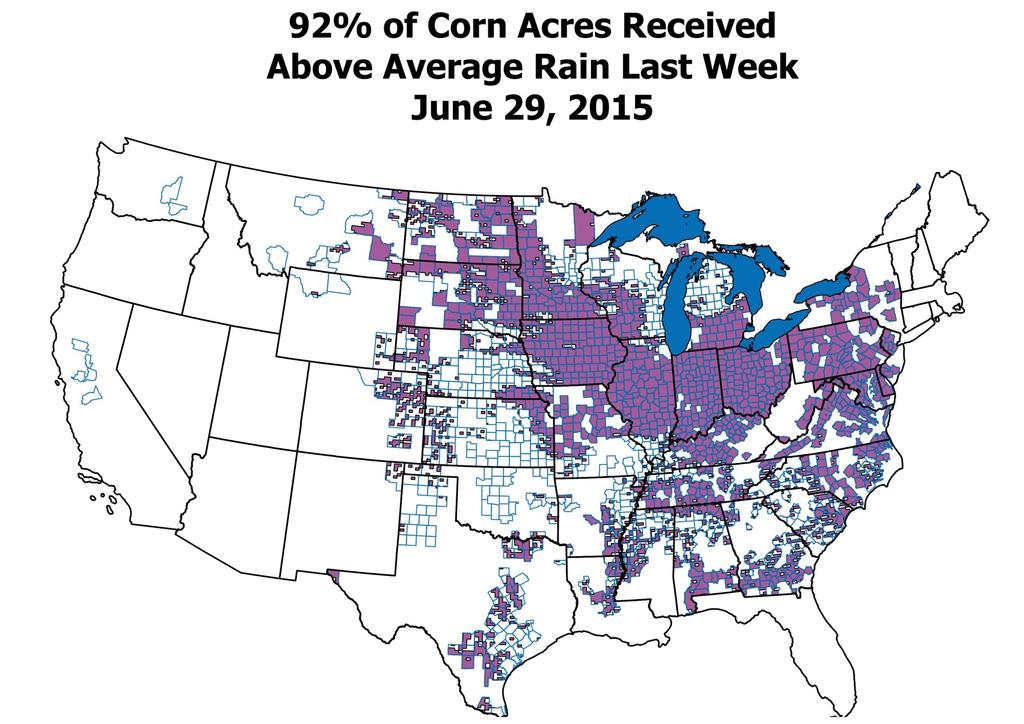
8 Widespread Last Week

9 Rain Shifts South

10 Cool, Wet July

11 Cool In Western Midwest

12 World Weather - Europe

13 Former Soviet Union

14 China

15 Long-Term Worries

16 El Nino?
17 Australia
18 Corn Questions How many acres? Potential for yields Large old crop leftover stocks Bird flu impact Ethanol s future Export competition
19 Average: Range: to Projected U.S. Corn Yields /20 6/3 6/17 7/1 7/15 7/29 8/12 8/26 9/9 9/23 10/7 10/21 11/4 National Model Last year State Model

20 Big Drop

21 Good Potential
22 Production Outpaces Demand Corn Supply Vs. Demand million bushels TOTAL USE TOTAL PRODUCTION
23 Feed Slowly Improves U.S. Corn Feed Usage million bushels

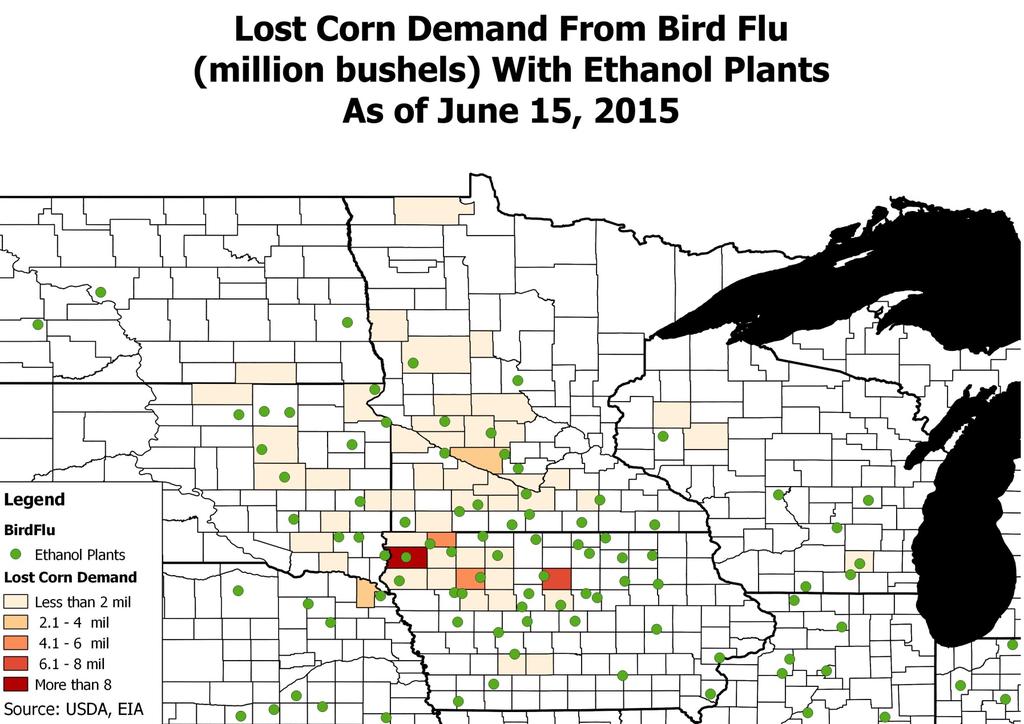
24 Bird Flu Impact
25 Ethanol Production Levels Off thousand barrels Monthly U.S. ethanol production and stocks 35,000 30,000 25,000 20,000 15,000 10,000 5, Source: USEIA Production Stocks
26 But RFS Isn t Dead Yet thousand barrels Stocks Weekly Ethanol Production and Stocks Production /4/10 6/4/11 6/4/12 6/4/13 6/4/14 6/4/15 Ending stocks Daily Production thousand barrels
27 Too Good Ethanol plants achieve record efficiency gallons produced from each bushel of corn, crop year Source: USDA, EIA
28 Prices Try To Recover
29 DDGSs Should Bounce Back
30 Margins Ease $6.50 $6.00 $5.50 $5.00 $4.50 $4.00 $3.50 $3.00 $2.50 $2.00 $1.50 $1.00 $0.50 $0.00 $0.50 Illinois Ethanol Margins
31 Slow Start Total Next Year's Corn Sales (Year to Date)
32 Long-Term Trend Loses Market Share U.S. Share Of World Corn Exports 90% 80% 70% 60% 50% 40% 30% 20% 10% 0%
33 Plenty Of Competition Spot Corn Delivered To Japan Gulf Brazil Argentina Ukraine $8.00 $7.50 $7.00 $6.50 $6.00 $5.50 $5.00 $4.50 $4.00 9/1/ /1/ /1/ /1/2013 1/1/2014 2/1/2014 3/1/2014 4/1/2014 5/1/2014 6/1/2014 7/1/2014 8/1/2014 9/1/ /1/ /1/ /1/2014 1/1/2015 2/1/2015 3/1/2015 4/1/2015 5/1/2015 6/1/2015
34 China Buys Total Sorghum Sales & Shipments (Year to Date) % 90% 80% 70% 60% 50% 40% 30% 20% 10% 0% Total Commitments % of USDA Forecast
35 Good Start 90 New Crop Sorghum Sales (Year to Date)
36 Corn Supply & Demand USDA Bearish Bullish Area Case Case Bearish Bullish Planted 95,365 90,597 89,199 89,434 89,434 88,449 88,449 Harvested 87,668 83,136 81,699 82,057 82,057 80,755 80,755 Yield Beginning stocks 821 1,234 1,876 1,234 1,234 1,831 1,778 Production 13,829 14,216 13,630 14,216 14,216 13,605 13,220 Imports Supply, total 14,687 15,475 15,531 15,477 15,469 15,453 15,015 Feed and residual 5,034 5,250 5,300 5,303 5,303 5,416 5,186 Food, seed and ind. 6,501 6,522 6,560 6,522 6,522 6,560 6,522 Domestic, total 11,535 11,772 11,860 11,825 11,825 11,976 11,708 Exports 1,917 1,825 1,900 1,825 1,878 1,854 1,830 Use, total 13,452 13,597 13,760 13,650 13,703 13,830 13,538 Ending stocks 1,234 1,876 1,771 1,831 1,778 1,581 1,487 Ave. cash price $4.46 $3.65 $3.50 $3.76 $3.91 $3.74 $3.69 to $4.45 to $4.61 Stocks to use 9.2% 13.8% 12.9% 13.4% 13.0% 11.4% 11.0% Ave. nearby futures $4.45 $3.71 $4.16 $4.24 $4.16 $4.11 to $4.94 to $5.01 Top Third of Price Range* *Achieved Bryce's Forecast $4.36 to $4.75* $4.44 to $4.84* $4.98 to $5.41 $4.99 to $5.42 Tighter 2014 Stocks, Less 2015 Corn = Rally Potential
37 Investors Back?
38 Money Flow Bearish total contracts Tracking the funds net position, ag contracts 1,600,000 1,400,000 1,200,000 1,000, , , , ,000 - (200,000) (400,000) Source: CFTC Hedge Funds Index Funds
39 Top Of Corn Range Net open interest in corn (futures and options) 3,000,000 2,500,000 net contracts 2,000,000 1,500,000 1,000, ,000 - Source: CFTC
40 Fuel For Fire Commitment of Traders - Corn net position in contracts /06 1/07 1/08 1/09 1/10 1/11 1/12 1/13 1/14 1/15 Source: CFTC $9.00 $8.00 $7.00 $6.00 $5.00 $4.00 $3.00 $2.00 $1.00 $0.00 nearby futures Index funds Hedge funds Futures
41 Need Move Above $4.40 December Corn Bull vs Bear Years /1 1/1 3/1 5/1 7/1 9/1 11/1 200 Bull Market Dec-15 Year-after bull Normal Year
42 Breakout

43 Look Familiar? Summer Rally: 6/16-7/6
44 June 93 Was Wet

45 July 93 Even Wetter
46 Midway Through Average Rally December Corn Futures Seasonal Trend Start Date +1 Week +2 Weeks +3 Weeks +4 Weeks +5 Weeks +6 Weeks 6/29 7/6 7/13 7/20 7/27 8/3 8/10 Ave. Gain/Loss (2.5) (2.8) (8.1) (6.6) (7.2) (6.9) % Up 16/41 15/41 12/41 12/41 13/41 14/41 % Down 25/41 26/41 28/41 29/41 28/41 27/41 Ave. Gain - Up year Ave Loss - Down Year (13.2) (20.0) (26.5) (27.9) (32.4) (35.1) Biggest Gain Biggest Loss (76.3) (130.5) (188.5) (159.3) (252.8) (222.0) This table shows the typical seasonal pattern at weekly intervals from the start date, based on average daily futures prices from Gains and losses are based on the difference between the closing price on the start date and the closing price on the weekly date shown.
47 Soybean Questions How big was 2014 crop? How much prevent plant? Wet feet? When will China buy? Time for vegetable oil? More South American expansion?

48 5.1 Million Acres Left
49 Kansas/Missouri Slow
50 Average: 46 bpa Range 45.6 to 46.4 Projected U.S. Soybean Yields /1 6/15 6/29 7/13 7/27 8/10 8/24 9/7 9/21 10/5 10/19 State Model State model -- last year U.S. Model
51 Yield Potential Iowa/Nebraska Good
52 More Slippage
53 New Crop Stocks Build Soybean Supply Vs. Demand 4,500 4,000 million bushels 3,500 3,000 2,500 2, Production Demand
54 Crush Strong $3.00 CBOT Crush Margin $2.50 $2.00 $1.50 $1.00 $0.50 $- 1/3/2012 1/3/2013 1/3/2014 1/3/2015
55 Record Exports 1,000 MT Soymeal Export Commitments 12,000,000 10,000,000 8,000,000 6,000,000 4,000,000 2,000, Year Average
56 Weak Peso Bullish
57 Oil Gains Percentage Of Crush Margin From Soybean Oil 55% 50% 45% 40% 35% 30% 25% 20%
58 Palm Oil Led
59 U.S. Exports At Record Pace Million Bushels Total Soybean Sales & Shipments (Year to Date) 104% 102% 100% 98% 96% 94% 92% 90% 88% Total Commitments % of USDA Forecast
60 New Crop Demand Million Bushels Next Year's Soybean Sales (Year to Date)
61 But Market Share Falls Percentage of World Export Market 1000s metric tons 100% 90% 80% 70% 60% 50% 40% 30% 20% 10% 0% U.S. Agentina Brazil
62 Expansion Continues Total Production 300, s metric tons 250, , , ,000 50, U.S. Agentina Brazil
63 Real Still Weak
64 Best Of Both Worlds
65 World Demand Grows MMT 350,000 World soybean demand 300, , , , ,000 50,000 -
66 China Controls 2/3 s Of World Soybean Trade MMT 90,000 Chinese soybean imports 80,000 70,000 60,000 50,000 40,000 30,000 20,000 10,000 -
67 Economy Fuels Imports MMT 90,000 80,000 70,000 60,000 50,000 40,000 30,000 20,000 10,000 - Chinese soybean imports vs GDP GDP $25,000 $20,000 $15,000 $10,000 $5,000 $0 Imports GDP

68 When Growth Sputters MMT 90,000 80,000 70,000 60,000 50,000 40,000 30,000 20,000 10,000 Chinese soybean imports vs GDP Growth GDP % Imports GDP
69 Chinese Bubble?
70 Crush Margins Weak China Crush Margin Chinese Soybeans Imported U.S. Soybeans 1, , , , , /16/2012 3/16/2013 3/16/2014 3/16/2015
71 30% White Knight U.S. Soybeans Stocks/Use 25% 20% stocks/use 15% 10% 5% 0%

72 World Supplies Still Relatively Big World soybean stocks to use 35% 30% 25% e s u20% to s k c 15% to s 10% 5% 0%
73 Crucial Time November Soybean Futures Seasonal Trends 850 1,050 Averages , /6 1/6 2/6 3/6 4/6 5/6 6/6 7/6 8/6 9/6 10/6 11/6 800 Non-Bull Years Year-after bull Bull Years Nov. 2015
74 Better Soybean Odds November Soybean Futures Seasonal Trends Start Date +1 Week +2 Weeks +3 Weeks +4 Weeks +5 Weeks 6/29 7/7 7/14 7/21 7/25 8/1 Ave. Gain/Loss (1.9) (0.5) (4.8) (13.2) (8.3) % Up 51% 46% 44% 41% 44% % Down 49% 54% 56% 59% 56% Ave. Gain - Up year Ave Loss - Down Year (36.9) (44.9) (58.6) (67.7) (73.5) Biggest Gain Biggest Loss (102.5) (141.8) (156.5) (221.0) (194.5) This table shows the typical seasonal pattern at weekly intervals from the start date, based on average daily futures prices from Gains and losses are based on the difference between the closing price on the start date and the closing price on the weekly date shown.
75 Funds Flip Long Commitment of Traders - Soybeans net position in contracts /06 1/07 1/08 1/09 1/10 1/11 1/12 1/13 1/14 1/15 Source: CFTC $20.00 $18.00 $16.00 $14.00 $12.00 $10.00 $8.00 $6.00 $4.00 $2.00 $0.00 nearby futures Index funds Hedge funds Futures
76 Upside Potential

77 Rally: 6/4 7/19 26% = $11.35 Now
78 Soybean Supply & Demand USDA Bryce Bullish Area Current Case Bullish Bearish Planted 76,840 83,701 84,635 83,701 83,236 83,760 84,635 Harvested 76,253 83,061 83,700 83,061 82,126 82,613 83,610 Yield Beginning stocks Production 3,359 3,969 3,850 3,969 3,869 3,771 3,880 Imports Supplies, total 3,570 4,091 4,211 4,093 3,993 4,035 4,256 Crushings 1,734 1,815 1,830 1,817 1,810 1,805 1,805 Exports 1,647 1,810 1,775 1,823 1,852 1,759 1,798 Seed Residual (0) Use, total 3,478 3,761 3,736 3,749 3,759 3,744 3,787 Ending stocks Ave. cash price $13.00 $10.05 $9.00 $9.90 $11.13 $10.52 $8.76 Ave. nearby fut. $13.33 $10.66 $11.89 $11.27 $9.37 (To-Date) $9.86 Stocks to use 2.6% 8.8% 12.7% 9.2% 6.2% 7.8% 12.4% Bean Stocks Estimates Vary Top Third of Price Range* * fulfilled $10.66 to $11.56* $11.89 to $12.89* $12.22 to $13.17 $10.17 to $10.97*
79 Wheat Holds Up 52 U.S. Winter Wheat Yields /19 11/19 12/19 1/19 2/19 3/19 4/19 5/19 6/19 Last Year State-by-State yields National Yield Model

80 Soft Red/White Wheat Slump
81 Above Average Projected U.S. Spring Wheat Yields /18 6/1 6/15 6/29 7/13 7/27 8/10 8/24 9/7 U.S. Model Previous year State Model
82 Too Much Wheat World Wheat Supply and Demand 750, , s metric tons 650, , , , , , Production Consumption
83 World Wheat Stocks Adequate Total World Wheat Ending Stocks 250, , , ,000 50,
84 Market Changed 30% 25% Dramatic change in U.S. wheat exports since record year of 1992 percentage of total exports % 15% 10% 5% 0% Source: USDA
85 Bullish Shift But Below Fall Highs Chicago December Futures /6 3/6 5/6 7/6 9/6 11/ Bull Non-Bull Year-After Bull Dec. 2015
86 Losses Will Be Needed Around World To Make A Difference Wheat Supply & Demand Table USDA Bryce Area Current Small Big Planted 56,156 56,822 56,079 56,822 56,079 56,079 Harvested 45,157 46,476 48,000 46,476 47,502 47,502 Yield Beginning stocks Production 2,135 2,026 2,121 2,024 2,112 2,203 Imports Supply, total 3,022 2,764 2,973 2,759 2,994 3,085 Food Seed Feed and residual Domestic, total 1,254 1,197 1,234 1,158 1,211 1,223 Exports 1, Use, total 2,431 2,052 2,159 2,009 2,199 2,211 Ending stocks Average price $6.87 $6.00 $4.90 $5.66 $5.17 $4.87 Stocks to use ratio 24.3% 34.7% 37.7% 37.5% 36.2% 39.5% Ave. Nearby Futures Chicago $5.66 $5.12 $4.86 Kansas City Hard Red $4.67 $5.33 $5.10 Minneapolis $6.14 $5.35 $5.08 Top Third of Price Range Small 2015 Big Chicago* $5.66 to $6.30* $5.63 to $6.15* $5.30 to $5.74* Kansas City Hard Red* $4.67 to $5.33* $5.85 to $6.38* $5.48 to $5.96* Minneapolis* $6.14 to $6.86* $5.93 to $6.51* $5.99 to $6.44* *Achived

87 Wheat Could Follow Corn
88 Recommendations Corn 95% sold $4.60 futures 30% sold $4.46 futures Soybeans 95% sold futures 20% sold futures Wheat 100% sold 2014 $6.32 futures 50% sold 2015 $5.99 futures


89 Weekly Reviews Farm Futures Daily
Soybeans face make or break moment Futures need a two-fer to avoid losses By Bryce Knorr, senior grain market analyst
 Soybeans face make or break moment Futures need a two-fer to avoid losses By Bryce Knorr, senior grain market analyst A year ago USDA shocked the market by cutting its forecast of soybean production, helping
Wheat market may take patience Exports, seasonal weakness weigh on prices for now. By Bryce Knorr, Senior Grain Market Analyst
 Wheat market may take patience Exports, seasonal weakness weigh on prices for now By Bryce Knorr, Senior Grain Market Analyst The best days of the wheat rally may still be ahead. But first the market may
Soybeans face long road End to tariffs wouldn t help 2018 exports much By Bryce Knorr, senior grain market analyst
 Soybeans face long road End to tariffs wouldn t help 2018 exports much By Bryce Knorr, senior grain market analyst Forecasting grain prices is relatively easy in normal times. Most models assume the future
THE HIGHTOWER REPORT
 Futures Analysis & Forecasting HightowerReport.com March 21, 214 Strategies for March 31st Report: Non-standard Options New, non-standard options at the CME can be great tools for commodity traders, especially
SOYBEAN COMPLEX SPRING OUTLOOK
 30 141 W. Jackson Boulevard THE HIGHTOWER REPORT FUTURES ANALYSIS & FORECASTING Suite 4002 Chicago, Illinois 60604 312-786-4450 / 800-662-9346 www.futures-research.com Special Report SOYBEAN COMPLEX SPRING
Saturday, January 5, Notes from Al
 Get This Newsletter Every Saturday from Al Kluis Commodities..."Your Markets, Right Now"...AlKluis.com Saturday, January 5, 2013 Notes from Al Happy New Year and welcome to a volatile 2013. It has been
Market Outlook for Corn, Wheat, and Soybeans
 Market Outlook for Corn, Wheat, and Soybeans Identifying Risks - Protecting Profits Can you go wrong with $5 Corn, $12 Beans and $8 Wheat? Progressive Farmer Meeting St. Johns, Michigan Jim Hilker Agriculture,
Advance Trading, Inc. Supply/Demand Summary
 Corn Advance Trading, Inc. Supply/Demand Summary Planted Acres 88.0 94.0 90.2 90.2 0.0 89.1 89.1 0.0 % Harvested 91.8% 92.2% 91.7% 91.7% 91.8% 91.8% Harvested Acres 80.8 86.7 82.7 82.7 0.0 81.8 81.8 0.0
Influences on the Market. Common Marketing Terms. Types of Contracts. Terms of Contracts
 Jackie Reichter DeBruce Grain, Nebraska City Grain Marketing Commodity od Exchanges/Futures Symbols Influences on the Market Common Marketing Terms Types of Contracts Terms of Contracts Commodity Exchanges
BESTER DERIVATIVE TRADING TECHNICAL BRIEF
 9 November 2018 US DOLLAR INDEX BESTER DERIVATIVE TRADING TECHNICAL BRIEF The US Dollar Index is developing the third upward leg inside an upward sloping channel which started in September. Resistance
Crops Marketing and Management Update
 Crops Marketing and Management Update Grains and Forage Center of Excellence Dr. Todd D. Davis Assistant Extension Professor Department of Agricultural Economics Vol. 2018 (2) February 14, 2018 Topics
Crops Marketing and Management Update
 Crops Marketing and Management Update Grains and Forage Center of Excellence Dr. Todd D. Davis Assistant Extension Professor Department of Agricultural Economics Vol. 2018 (3) March 11, 2018 Topics in
UK Grain Marketing Series January 19, Todd D. Davis Assistant Extension Professor. Economics
 Introduction to Basis, Cash Forward Contracts, HTA Contracts and Basis Contracts UK Grain Marketing Series January 19, 2016 Todd D. Davis Assistant Extension Professor Outline What is basis and how can
Fundamental Factors Affecting Agricultural and Other Commodities. Research & Product Development Updated July 11, 2008
 Fundamental Factors Affecting Agricultural and Other Commodities Research & Product Development Updated July 11, 2008 Outline Review of key supply and demand factors affecting commodity markets World stocks-to-use
Winter fertilizer bargains could be rare Global market shows signs of stability By Bryce Knorr, grain market analyst
 Winter fertilizer bargains could be rare Global market shows signs of stability By Bryce Knorr, grain market analyst While fertilizer costs continued to edge mostly higher this week, the strong summer
Fertilizer market starts to crack India nabs lower prices in latest urea tender By Bryce Knorr, grain market analyst
 Fertilizer market starts to crack India nabs lower prices in latest urea tender By Bryce Knorr, grain market analyst When India talks in the fertilizer market, the world listens. The large importer of
Wheat Outlook August 19, 2013 Volume 22, Number 45
 Market Situation Today s Newsletter Market Situation Crop Progress 1 Weather 1 Crop Progress. The winter wheat harvest is 96% complete as of August 18th, just ahead of the normal pace of 94%. The spring
Top Producer Conference Chicago, Illinois January 21, 2009
 Top Producer Conference Chicago, Illinois January 21, 2009 A Primer on Risk Management 2009 Jeff Beal JERRY GULKE S STRATEGIC MARKETING SERVICES, INC. PO BOX 6222, ROCKFORD, IL, 61125 Phone: 602-795-5893
AGRICULTURAL COMMODITY FUNDAMENTALS AND OUTLOOK
 AGRICULTURAL COMMODITY FUNDAMENTALS AND OUTLOOK Lewis Hagedorn Agricultural Commodity Strategist, J.P. Morgan Chase Bank NA lewis.a.hagedorn@jpmorgan.com 212.834.846 A L L Y P R I V A T E A N D CONFIDENTIA
Fall fertilizer costs pinch budgets Three-year high in urea leads market gains By Bryce Knorr, grain market analyst
 Fall fertilizer costs pinch budgets Three-year high in urea leads market gains By Bryce Knorr, grain market analyst Fertilizer costs start September at their highest levels in a couple years, putting further
Weather targets fertilizer market too Heavy rains stall shipments, delay fall applications By Bryce Knorr, grain market analyst
 Weather targets fertilizer market too Heavy rains stall shipments, delay fall applications By Bryce Knorr, grain market analyst The Midwest is finally starting to dry out from heavy rains in the first
Turner s Take WASDE Expectations vs. Sept WASDE report:
 Published by: Craig Turner 11/4/2013 4:02:09 PM In this issue 1) CORN: USDA Friday exected to be bearish. Looking to short Corn ahead of WASDE 2) SOYBEANS: Short Bean Ideas with Long Call Protection 3)
Hedge Strategies Using Options Ahead of USDA June 30 th Reports
 Hedge Strategies Using Options Ahead of USDA June 30 th Reports David Hightower June 23, 2014 2014 CME Group. All rights reserved. Options of Options A diverse set of tools to trade around short-term events
CHS Pro Advantage Update- February Corn
 CHS Pro Advantage Update- February 2018 Corn Recap and Outlook- The most important thing that happened in corn since our last update is the breakout of the 2 ½ month trading range that had existed prior
Fall 2017 Crop Outlook Webinar
 Fall 2017 Crop Outlook Webinar Chris Hurt, Professor & Extension Ag. Economist James Mintert, Professor & Director, Center for Commercial Agriculture Fall 2017 Crop Outlook Webinar October 13, 2017 50%
It s time to book 2018 fertilizer Focus on nitrogen first, using right tool for each market By Bryce Knorr, grain market analyst
 It s time to book 2018 fertilizer Focus on nitrogen first, using right tool for each market By Bryce Knorr, grain market analyst A slump in nitrogen costs this summer gives growers a chance to lock in
MARKETLINE. Soybeans: South American Pressure. Cash Only. Future Hedgers. What to Sell. Future Hedgers. Only
 MARKETLINE www.progressiveag.com 701-277-9210 1-800-450-1404 February 26, 2016 What to Sell Cash Only Cash Only Future Hedgers Future Hedgers Week s Rank 2015 2016 2015 2016 1. HRS Wheat 30% 0% 30% 0%
Purdue Outlook Update 2011
 Percent Purdue Outlook Update 211 211 Indiana Agricultural Outlook Corinne Alexander & Chris Hurt hurtc@purdue.edu Ethanol World Economic Growth Dollar Value Surprises and Uncertainty! Change Wheat Production
10/06/2013. USA: Planting Progress Corn. XXVI FEFAC Congress
 XXVI FEFAC Congress Outlook on the EU and global oilseeds and cereals markets / campaign 2013 1014. COCERAL view on the impacts of the EU financial markets reform Stefan Vogel Vice President COCERAL Price
Crop and Price Outlook Illinois Soybean Association Soybean Summit March 4, 2013
 Crop and Price Outlook Illinois Soybean Association Soybean Summit March 4, 2013 Darin Newsom DTN Senior Analyst Putting Together an Outlook Structure of the market Investment activity Market s view of
Crops Marketing and Management Update
 Crops Marketing and Management Update Grains and Forage Center of Excellence Dr. Todd D. Davis Assistant Extension Professor Department of Agricultural Economics Vol. 2017 (2) February 16, 2017 Topics
Cattle: Dollar: Energies:
 j 3/11/2015 CONTACTS: Chuck Shelby O: (866) 837-9027 C: (765) 426-7535 Bryan Shelby O: (866) 837-9027 Bill Gentry O: (877) 433-4348 or O: (866) 837-9027 C: (219) 863-0055 Sherman Newlin O: (866) 314-5765
Marketing Strategies for Robert Anwender Grain Merchandiser
 Marketing Strategies for 2015 Robert Anwender Grain Merchandiser Marketing Tips for 2015 and Forward! Build a Knowledge Base: Stay in tune with market fundamentals Understand how a volatile dollar affects
Key Commodity Report Weekly
 Key Commodity Report Weekly CME Group Corn Soybean Soy Meal Soybean Oil Rough Rice Wheat Cheddar Barrel Cheddar Block Milk Class III Butter AA Source: CME Group USDA Weekly Prices Live Cattle Course Ground
October 12, Corn
 October 12, 2018 Corn The only program currently open in Corn is the 2-year 2019 expiration contract. The daily chart covers the timeframe that the 2-year contract has been open. The relevant point here
Crops Marketing and Management Update
 Crops Marketing and Management Update Department of Agricultural Economics Princeton REC Dr. Todd D. Davis Assistant Extension Professor -- Crop Economics Marketing & Management Vol. 2016 (2) February
BUYERS, BUBBLES, AND BUTTERFLIES Senior Analyst Darin Newsom. DTN/The Progressive Farmer 2010 Ag Summit December 10, 2010
 BUYERS, BUBBLES, AND BUTTERFLIES Senior Analyst Darin Newsom DTN/The Progressive Farmer 2010 Ag Summit December 10, 2010 Buyers -! "In other words, demand driven markets! "Demand driven markets: Increased
2015 Market Outlook. DTN/The Progressive Farmer 2014 Ag Summit December 9, Darin Newsom DTN Senior Analyst
 2015 Market Outlook DTN/The Progressive Farmer 2014 Ag Summit December 9, 2014 Darin Newsom DTN Senior Analyst Here Comes The Sun 2015 Corn Outlook We ve Seen This Show Before Outlook: December 10, 2013
May 26, 2017 CORN. Planting Progress
 May 26, 2017 CORN ENCOURAGING WEEK July corn was strong right out of the gate Monday as the market responded to some weather complications across the Corn Belt. Soybeans came under pressure late in the
Urea makes new push higher Supply problems crop up just as demand for fertilizer rises By Bryce Knorr, grain market analyst
 Urea makes new push higher Supply problems crop up just as demand for fertilizer rises By Bryce Knorr, grain market analyst What passes for calm in the fertilizer market never seems to last long. Just
MARKETLINE. Soybeans: Bullish Acreage Report. Cash Only. Future Hedgers. What to Sell. Future Hedgers. Only
 MARKETLINE www.progressiveag.com 701-277-9210 1-800-450-1404 April 1, 2016 What to Sell Cash Only Cash Only Future Hedgers Future Hedgers Week s Rank 2015 2016 2015 2016 1. HRS Wheat 30% 0% 30% 0% 2. Soybeans
Top Producer Intercontinental Hotel Chicago, IL
 Top Producer Intercontinental Hotel Chicago, IL January 22, 2009 Risk Management with Crop Insurance JAMIE WASEMILLER & CHRIS McCRAY STRATEGIC MARKETING SERVICES, INC. SILVEUS INSURANCE GROUP www.jerrygulke.com
India urea tender doesn t rattle U.S. market much Ammonia Urea UAN Phosphates Potash
 India urea tender doesn t rattle U.S. market much Retail fertilizer prices continue to have firm tone despite slow start to spring By Bryce Knorr, grain market analyst India stepped in to buy more urea
Market Outlook. David Reinbott.
 Market Outlook David Reinbott Agriculture Business Specialist P.O. Box 187 Benton, MO 63736 (573) 545-3516 http://extension.missouri.edu/scott/agriculture.aspx reinbottd@missouri.edu Cotton Fundamentals
A BULLISH CASE FOR CORN AND SOYBEANS IN 2016
 A BULLISH CASE FOR CORN AND SOYBEANS IN 2016 Probabilities for higher prices, and the factors that could spur price rallies. Commodity markets tend to move on three variables: perception, momentum and
MARKETLINE. Soybeans: Flat Week. What to Sell. Cash Only. Future Hedgers. Future Hedgers. Only
 MARKETLINE www.progressiveag.com 701-277-9210 1-800-450-1404 March 18, 2016 What to Sell Cash Only Cash Only Future Hedgers Future Hedgers Week s Rank 2015 2016 2015 2016 1. HRS Wheat 30% 0% 30% 0% 2.
Market Summary. Commitment of. Traders. Managed Money. Fund Positions
 October 26, 2018 Market Summary The grain markets saw an increase in volatility to end the week with December corn declining 7 1/4 cents on Thursday before rebounding 6 3/4 cents on Friday. This follows
Cotton Market Outlook
 Cotton Market Outlook John Robinson Department of Agricultural Economics Texas A&M University College Station, Texas TWITTER: @aggie_prof FACEBOOK: https://www.facebook.com/agrilifemastermarketer NEWSLETTER:
IMPROVED WHEAT CONDITIONS IN USA. RAIN IN FORECAST. POSSIBLE DOWN 10% YIELD IN BRAZILIAN CORN CROP.
 Page 1 of 6 RICK ALEXANDER, MARKET STRATEGIST ZANER GROUP IMPROVED WHEAT CONDITIONS IN USA. RAIN IN FORECAST. POSSIBLE DOWN 10% YIELD IN BRAZILIAN CORN CROP. Higher closes for corn, Minneapolis and Chicago
Closing Grain & Soybean Comments
 SRW and HRW futures finished 7-10 cents lower and were down 10-12 at their lowest point. HRS futures finished just 3-7 cents lower. The continued US shutout on major export business, stronger US dollar
Daily Commentary. Corn (888) Monday, July 22, Today s Trade Action. Today s Closing Prices. Recommendations.
 Monday, July 22, Today s Trade Action. Today s Closing Prices. Recommendations.") Corn The market finished lower but off it earlier lows as soybeans supplied support for the corn market today. The USDA cut the good to excellent rating by 3 points in crop condition report released after
Corn The market finished lower but off it earlier lows as soybeans supplied support for the corn market today. The USDA cut the good to excellent rating by 3 points in crop condition report released after
Tortilla Association
 Tortilla Association Commodity Session Robert D. Bresnahan May 18, 2016 Late Imperial China The Ultimate Principle 221 B.C. to 206 B.C. When goods become extremely expensive, then they must become inexpensive
DAILY GRAINS COMMENTARY Tuesday June 12, 2018
 DAILY GRAINS COMMENTARY Tuesday June 12, 2018 DAILY SOY COMPLEX COMMENTARY 06/12/18 No sign of low but North Korea news long term supportive OVERNIGHT CHANGES THROUGH 6:05 AM (CT): SOY BEANS +7.0, BEAN
07 August, Monthly Report On. Oilseeds. August 2017
 Monthly Report On Oilseeds August 2017 07 August, 2017 Domestic : Soybean (NCDEX) Forward Curve of Soybean Futures (NCDEX) Historic return of Soybean futures (NCDEX) in the month of August 3300.00 3250.00
Econ 337 Spring 2015 Due 10am 100 points possible
 Econ 337 Spring 2015 Final Due 5/4/2015 @ 10am 100 points possible Fill in the blanks (2 points each) 1. Basis = price price 2. A bear thinks prices will. 3. A bull thinks prices will. 4. are willing to
Grain Marketing. Swenson Investments & Commodities
 Trading futures and options involves substantial risk of loss and is not suitable for all investors or producers. Grain Marketing Swenson Investments & Commodities 608 N West Ave Sioux Falls, SD 57104
Key Commodity Report Weekly
 Key Commodity Report Weekly CME Group Corn Soybean Soy Meal Soybean Oil Rough Rice Wheat Cheddar Barrel Cheddar Block Milk Class III Butter AA Source: CME Group *Euro *British Pound Canadian Dollar Chinese
Risk Management & Profitability
 Risk Management & Profitability The challenge to making money and being profitable in any industry is 2 fold First you have to maximize production and minimize cost. Second, you have to know how to manage
Chart Pattern Secrets
 Chart Pattern Secrets April 09, 2019 Next Alert: 04/11/19 The Trading System: Application of Trading Chart Patterns with Futures and Option Contracts Copyright 1997 All rights reserved. 1 The dollar made
ALWAYS BEWARE OF DRY WEATHER FORECASTS
 Page 1 of 6 RICK ALEXANDER, MARKET STRATEGIST ZANER GROUP ALWAYS BEWARE OF DRY WEATHER FORECASTS Higher to sharply higher closes for oats, rough rice,corn, soybeans, soymeal and soybean oil along with
Basis: The price difference between the cash price at a specific location and the price of a specific futures contract.
 Section I Chapter 8: Basis Learning objectives The relationship between cash and futures prices Basis patterns Basis in different regions Speculators trade price, hedgers trade basis Key terms Basis: The
Chart Pattern Secrets
 Chart Pattern Secrets April 02, 2019 Next Alert: 04/04/19 The Trading System: Application of Trading Chart Patterns with Futures and Option Contracts Copyright 1997 All rights reserved. 1 The dollar made
SHAKEN AND NOT STIRRED POSSIBILILITIES AND POTENTIALS
 SHAKEN AND NOT STIRRED POSSIBILILITIES AND POTENTIALS Presentation for Iowa Soybean Research Conference February 6, 2018 Introduction: As we rolled the year over to 2018, there seemed to be negativity
AGRICULTURAL RISK MANAGEMENT. Global Grain Geneva November 12, 2013
 AGRICULTURAL RISK MANAGEMENT Global Grain Geneva November 12, 2013 Managing Price Risk is Easier to Swallow Than THE ALTERNATIVE Is Your Business Protected Is Your Business Protected Is Your Business Protected
The Outlook for Wheat
 The Outlook for Wheat By Dan Manternach Advisory Services A Division of Vance Media Corporation For North Dakota Wheat Commission Nov 10, 2009 s Data Dashboard Reducing WASDE supply/demand stats to five
Brian Grossman (312) ZANER Ag. Burn It All Down Monday Markets
 ZANER Ag. Burn It All Down Monday Markets") Brian Grossman (312) 277-0119 @AgHedgeBrian bgrossman@zaner.com Ag Burn It All Down Monday Markets USDA report day, Friday did little to entice much of any market direction and ultimately left much market
Brian Grossman (312) 277-0119 @AgHedgeBrian bgrossman@zaner.com Ag Burn It All Down Monday Markets USDA report day, Friday did little to entice much of any market direction and ultimately left much market
HEDGING WITH FUTURES. Understanding Price Risk
 HEDGING WITH FUTURES Think about a sport you enjoy playing. In many sports, such as football, volleyball, or basketball, there are two general components to the game: offense and defense. What would happen
Post Harvest Marketing Tips
 Post Harvest Marketing Tips (from my best friends) Edward Usset Grain Marketing Economist, University of Minnesota usset001@umn.edu Corn & Soybean Digest columnist Center for Farm Financial Management
Trading Commodities. An introduction to understanding commodities
 Trading Commodities An introduction to understanding commodities Brainteaser Problem: A casino offers a card game using a deck of 52 cards. The rule is that you turn over two cards each time. For each
Adam Pukalo Commodity Futures Advisor TECHNICALS & TRENDS. February 2017 Edition. Highlighted: Canola, Canadian Dollar, Wheat, Corn, Cattle
 TECHNICALS & TRENDS February 2017 Edition Highlighted: Canola, Canadian Dollar, Wheat, Corn, Cattle Before I start this months review and look ahead I want to mention some significant market moves we saw
DAILY GRAINS COMMENTARY Friday June 29, 2018
 DAILY GRAINS COMMENTARY Friday June 29, 2018 DAILY SOY COMPLEX COMMENTARY 06/29/18 Without help from Weather or China; supply news bearish OVERNIGHT CHANGES THROUGH 6:05 AM (CT): SOY BEANS +2.0, BEAN OIL
Macroeconomic Outlook for U.S. Agriculture
 Macroeconomic Outlook for U.S. Agriculture Nathan Kauffman Omaha Branch Executive and Economist Federal Reserve Bank of Kansas City May 18, 216 The views expressed are those of the author and do not necessarily
ACE 427 Spring Lecture 5. by Professor Scott H. Irwin
 ACE 427 Spring 2013 Lecture 5 Forecasting Crop Prices Using Fundamental Analysis: Ending Stock Models by Professor Scott H. Irwin Required Reading: Westcott, P.C. and L.A. Hoffman. Price Determination
Kansas State University Department Of Agricultural Economics Extension Publication 08/30/2017
 Margin Protection Crop Insurance Coverage Comes to Kansas Monte Vandeveer (montev@ksu.edu) Kansas State University Department of Agricultural Economics August 2017 A new form of crop insurance coverage
Daily Grain and Livestock Commentary Friday November 02, 2018
 Daily Grain and Livestock Commentary Friday November 02, 2018 DAILY SOY COMPLEX COMMENTARY Enough positive news to spark short-covering bounce into USDA OVERNIGHT CHANGES THROUGH 6:06 AM (CT): SOY BEANS
Evaluation and Outlook of the US Inland Barge Industry. June 2003
 Prepared for: US Inland Barge Multi- Client Study Participants Evaluation and Outlook of the US Inland Barge Industry June 2003 Prepared by: TABLE OF CONTENTS LIST OF FIGURES... 3 BACKGROUND... 7 METHODOLOGY...
CASH SOYBEANS AT 10 YEAR LOWS.
 Page 1 of 6 RICK ALEXANDER, MARKET STRATEGIST ZANER GROUP CASH SOYBEANS AT 10 YEAR LOWS. Higher close for oats while lower closes for oats, rough rice, corn, soybeans, soybean meal and soybean oil along
June 2018 Monthly Commodity Market Overview Newsletter. Stock Index Futures. By the ADMIS Research Team
 June 2018 Monthly Commodity Market Overview Newsletter By the ADMIS Research Team Stock Index Futures Stock index futures performed well in spite of increased global trade tensions. In fact NASDAQ and
US - CHINA TRADE DEAL LINGERS. BRAZIL MODERATE RAIN FOR 6-10 DAY FORECAST. ARGENTINA LIGHT RAIN COMING
 Page 1 of 6 RICK ALEXANDER, MARKET STRATEGIST ZANER GROUP US - CHINA TRADE DEAL LINGERS. BRAZIL MODERATE RAIN FOR 6-10 DAY FORECAST. ARGENTINA LIGHT RAIN COMING KEEP TRADING THE RANGES MENTIONED BELOW
1. A put option contains the right to a futures contract. 2. A call option contains the right to a futures contract.
 Econ 337 Name Midterm Spring 2017 100 points possible 3/28/2017 Fill in the blanks (2 points each) 1. A put option contains the right to a futures contract. 2. A call option contains the right to a futures
Commodity Risk Through the Eyes of an Ag Lender
 Commodity Risk Through the Eyes of an Ag Lender Wisconsin Banker s Association April 5 th, 2017 Michael Irgang, Executive Vice President 1 Michael Irgang: Bio Michael Irgang is currently Executive Vice
04th April Monthly Report On. Oilseeds. April 2017
 Monthly Report On Oilseeds April 2017 04th April 2017 Domestic : Soybean (NCDEX) Forward Curve of Soybean Futures (NCDEX) Historic return of Soybean futures (NCDEX) in the month of April 3300.00 2 17.47%
Storing Unpriced Grain: Strategies & Tools
 Storing Unpriced Grain: Strategies & Tools December 2013 Steven D. Johnson Farm & Ag Business Management Specialist (515) 957-5790 sdjohns@iastate.edu www.extension.iastate.edu/polk/farm-management Crop
Crop Risk Management
 Crop Risk Management January 28 th, 2010 Steven D. Johnson Farm & Ag Business Management Specialist (515) 957 5790 sdjohns@iastate.edu www.extension.iastate.edu/polk/farmmanagement.htm Source: Johnson,
December 6-7, Steven D. Johnson. Farm & Ag Business Management Specialist
 December 6-7, 2018 Steven D. Johnson Farm & Ag Business Management Specialist (515) 957-5790 sdjohns@iastate.edu www.extension.iastate.edu/polk/farm-management 1 Learning Objectives Highlight Current Corn
ACE 427 Spring Lecture 6. by Professor Scott H. Irwin
 ACE 427 Spring 2013 Lecture 6 Forecasting Crop Prices with Futures Prices by Professor Scott H. Irwin Required Reading: Schwager, J.D. Ch. 2: For Beginners Only. Schwager on Futures: Fundamental Analysis,
September futures traded to a new low for the move of 3.46 ¾ probing under the June 19 th low. Resistance is at the winter lows of 3.70, the 50% retra
 Technical Overview Corn prices have continued to drop and are testing the lows on the nearby contracts from last winter near 3.35, completely retracing the winter/spring rally. The next support is the
Basis for Grains. Why is basis predictable?
 Basis for Grains Why is basis predictable? Average basis levels (expectations) are determined by transportation and storage costs associated with the commodity. Variations in basis levels (outcomes) are
Non-Convergence of CME Hard Red Winter Wheat Futures and the Impact of Excessive Grain Inventories in Kansas
 Non-Convergence of CME Hard Red Winter Wheat Futures and the Impact of Excessive Grain Inventories in Kansas Daniel O Brien, Extension Agricultural Economist Kansas State University August 10, 2016 Summary
Commodity Price Outlook & Risks
 Commodity Outlook & Risks Research Department, Commodities Team March, 2 www.imf.org/commodities commodities@imf.org This monthly report presents a price outlook and risk assessment for selected commodities
MARKET OUTLOOK FOR UNITED STATES & SOUTH AMERICA
 MARKET OUTLOOK FOR UNITED STATES & SOUTH AMERICA Grain Market Outlook for the United States and South America by Steve Freed, Vice President of Grain Research, ADM Investor Services The following report
PRETTY MUCH NO CHANGES. GRAIN STOCKS AND SMALL GRAIN REPORTS ON FRIDAY
 Page 1 of 6 RICK ALEXANDER, MARKET STRATEGIST ZANER GROUP PRETTY MUCH NO CHANGES. GRAIN STOCKS AND SMALL GRAIN REPORTS ON FRIDAY Higher closes for Minneapolis, Kansas City and Chicago wheat along with
STRAINED BETWEEN US & CHINA AT ECONOMIC CONFERENCE LAST WEEKEND, G20 SUMMIT AT END OF MONTH
 Page 1 of 6 RICK ALEXANDER, MARKET STRATEGIST ZANER GROUP STRAINED BETWEEN US & CHINA AT ECONOMIC CONFERENCE LAST WEEKEND, G20 SUMMIT AT END OF MONTH Higher closes for oats, Minneapolis and Chicago wheat
Managing Margins in 2017
 Managing Margins in 2017 12 th Farming for the Future Conference Coalition to Support Iowa s Farmers Ames, Iowa Jan. 19, 2017 Alejandro Plastina Assistant Professor plastina@iastate.edu 515-294-6160 Chad
DAILY GRAINS COMMENTARY Monday January 04, 2016
 DAILY GRAINS COMMENTARY Monday January 04, 2016 DAILY SOY COMPLEX COMMENTARY Nice widespread rains for central/northern Brazil plus selling? SOY BEANS -4.4, BEAN OIL -0.4, SOYMEAL -0.4 OVERNIGHT DEVELOPMENTS:
Econ 338c. April 12, 2007
 60 Econ 338c April 12, 2007 10 Traits of a Successful Grain Marketer Starts Early (before planting) Knows production, storage costs & risk bearing ability Understands basis & mkt. carry Follows several
WASDE REPORT: GLOBAL ENDING STOCKS INCREASED. US STOCKS UNCHANGED
 Page 1 of 6 RICK ALEXANDER, MARKET STRATEGIST ZANER GROUP WASDE REPORT: GLOBAL ENDING STOCKS INCREASED. US STOCKS UNCHANGED Higher closes for oats and corn while lower closes for rough rice, soybeans,
Retailers slash ammonia prices but urea shoots higher Weekly Fertilizer Review for February 22, 2016
 Retailers slash ammonia prices but urea shoots higher Weekly Fertilizer Review for February 22, 216 A fairly quiet start to retail fertilizer trade in 216 came to very abrupt halt this week, with big changes
GRAIN MARKETS SENSITIVE TO EXPORTS, SOUTH AMERICAN WEATHER
 December 15, 1999 Ames, Iowa Econ. Info. 1779 GRAIN MARKETS SENSITIVE TO EXPORTS, SOUTH AMERICAN WEATHER October, November, and the first 10 days of December were unusually dry over a large part of southern
Soybean Monthly Report
 Soybean Monthly Report 27 March 2010 The soybean prices in the spot and futures were on a bearish trend since beginning of December 2009 due to selling pressure from the traders and investors following