Beyond Markowitz Portfolio Optimization
|
|
|
- Gloria Warren
- 6 years ago
- Views:
Transcription


1 Beyond Markowitz Portfolio Optimization 22 th September, 2017 Haksun Li
Adjunct Professors, Industry Fellow, Advisor, Consultant with the National University of Singapore, Nanyang")
2 Speaker Profile Dr. Haksun Li CEO, NM LTD. Vice Dean, Fudan University ZhongZhi Big Data Finance and Investment Institute (Ex-)Adjunct Professors, Industry Fellow, Advisor, Consultant with the National University of Singapore, Nanyang Technological University, Fudan University, the Hong Kong University of Science and Technology Quantitative Trader/Analyst, BNPP, UBS Ph.D., Artificial Intelligence, University of Michigan, Ann Arbor M.S., Financial Mathematics, University of Chicago B.S., Mathematics, University of Chicago 2
3 3 Alpha Strategy in China
4 A Sample Alpha Strategy in China Make clusters from 1000 factors Compute IR for each factor Weight for each factor in a cluster = IR_i / IR_total Score the stocks by sum of cluster values Sort stocks in each industry by scores Select top 20% in each industry Assign weight for each industry = weight in the market Assign weight for each stock = weight in the industry Hedge beta using CSI800 4
5 Problems with Chinese Alpha Strategies Reasons for failure of alpha strategies Market characteristics change, e.g., big/small firm factor no longer effective Futures backwardation, difference unpredictable Most alpha strategies are more or less the same Similar pools of factors Similar ways of assigning weights Factors used mainly as a way to do filtering No prediction No mathematical models Only sets of ad hoc heuristics 5


6 Solutions Optimize Capital Allocation Given the same set of stocks to long, different weightings give different P&Ls 6
7 Solutions Predictive Factor Model We can build mathematical predictive models using factors The model predicts expected returns of stocks No longer used just as a filter Can scientifically evaluate the usefulness, robustness and the time-dependent characteristics of factors 7
8 8 Problems with Markowitz Portfolio Optimization
9 Why Portfolio Optimization FoF asset allocation How much capital to assign to each fund? Portfolio asset allocation How much capital to assign to each strategy? Alpha strategy asset allocation How much capital to assign to each stock? 9
10 Harry Markowitz It all starts with Markowitz in 1952 Standard textbook model Widely taught in universities MBA courses Won the Nobel Memorial Prize in Economic Sciences in
11 Modern Portfolio Theory Insights An asset's risk and return should be assessed by how it contributes to a portfolio's overall risk and return, but not by itself. Mean-Variance (MV) optimization Investors are risk averse, meaning that given two portfolios that offer the same expected return, investors will prefer the less risky one. An investor who wants higher expected returns must accept more risk. An investor can have individual risk aversion characteristics in terms of the risk (tolerance) parameter. 11
12 Modern Portfolio Theory Math max ω E r t+1 λω Σ t ω ω where ω is the optimal portfolio weights E r t+1 is the expected return for the next period Σ t is the covariance matrix for the assets Constraints: Aω b No short selling: Iω 0 Alternatively, we have min ω ω Σ t ω λλ E r t+1 Solution: Quadratic Programming NM: y/svnalgoquant/show/core/src/main/java/com/numericalmethod/alg oquant/model/portfoliooptimization/markowitz 12
13 Efficient Frontier Given ω E r t+1 Find ω s.t., = μ ω eee = argmin ω λω Σ t ω 13
14 Markowitz s Theory 的问题 Require the knowledge of means and covariances. Too many parameters to estimate: N + N2 +N 2. For N = 300, we have 45,450 parameters to estimate. For N = 3000, we have 4,504,500 parameters to estimate. Chopra & Ziemba (1993) shows that errors in means are about 10x as important as errors in variances, and errors in variances are about 2x important as errors in covariances. Time varying. Tied to business cycles. 14
15 Problems with Sample Covariance Matrix A sample covariance matrix is often ill-conditioned, nearly singular, sometimes not even invertible and sometimes not even positive semidefinite. dimension: p, number of samples: n > 1, matrix not invertible p n p n < 1 but not negligible, matrix ill-conditioned Linear dependency among stocks. Asynchronous data incomplete data artificial changes due to stress-tests Error Maximization: Largest sample eigenvalues are systematically biased upwards. Smallest sample eigenvalues are systematically biased downwards. Inverting a sample covariance matrix increases significantly the estimation error. Capital allocated to the extreme eigenvalues where they are most unreliable. 15
16 Problems with Sample Mean Sample mean is only an estimation using TWO data points, namely the TWO end points, regardless of how big the sample size is. Given a set of historical returns r 1,, r t, the sample mean is t r = r i t i=1 i=1 log 1 + r i = i=1 log p i log p i 1 t = log p t log p 0 Assume returns follow Gaussian distribution. Nassim Nicholas Taleb: After the stock market crash (in 1987), they rewarded two theoreticians, Harry Markowitz and William Sharpe, who built beautifully Platonic models on a Gaussian base, contributing to what is called Modern Portfolio Theory. Simply, if you remove their Gaussian assumptions and treat prices as scalable, you are left with hot air. The Nobel Committee could have tested the Sharpe and Markowitz models they work like quack remedies sold on the Internet but nobody in Stockholm seems to have thought about it. 16

17 Problems with Diversification Litterman & et al. (1992, 1999, 2003): When unconstrained, portfolios will have large long and short positions. When subject to long only constraint, capital is allocated only to a few assets. Best & Grauer (1991): a small increase in expected return can consume half of the capital. 17
18 Problems with Constraints Minimizing variance max ω ω E r t+1, s.t., ω Σ t ω σ MMM 1 ω = 1 ω 0 Market impact max ω ω E r t+1 λ P ω 3 n Σ t ω λ M m j ω 2 j + c j ω j j=1 Diversification constraints (sector exposure) j Si ω j 0 + ω j Tax, transaction costs, etc. u i for sector i = 1,, S 18
.")
19 Problem with Performance P&L often worse than the 1/N strategy (equal weighting). 19
20 Comments on Markowitz Wesley Gray: Although Markowitz did win a Nobel Prize, and this was partly based on his elegant mathematical solution to identifying mean-variance efficient portfolios, a funny thing happened when his ideas were applied in the real world: mean-variance performed poorly. The fact that a Nobel-Prize winning idea translated into a no-value-add-situation for investors is something to keep in mind when considering any optimization method for asset allocation...complexity does not equal value! 20
21 21 Solutions for Practical Portfolio Optimization
22 Solutions to Estimating Covariance Dimension Reduction Dimension reduction via multifactor models Relate the i-th asset returns r i to k factors f 1,, f k by r i = α i + f 1,, f k β i + ε i α i, β i are unknown regression parameters; ε i unobserved random noise with mean 0 and are uncorrelated. Cov r ii, r jt = β ii V f β jt + Cov ε ii, ε jj E.g., alpha strategy, Fama-French model, CAPM, APT NM: /svnalgoquant/show/core/src/main/java/com/numericalmethod/algo quant/model/factormodel 22
23 Solutions to Estimating Covariance Shrinkage Estimators Pull the extreme eigenvalues back to the mean. Ledoit and Wolf (2003, 2004): Σ = δ F + 1 δ S δ is an estimator of the optimal shrinkage constant F is given by mean of the prior distribution or a structured covariance matrix, which has much fewer parameters than N + N2 +N. 2 S the sample covariance NM: method/suanshu/stats/descriptive/covariance/ledoitwolf2004.html method/suanshu/model/returns/moments/momentsestimatorledoi twolf.html Ledoit and Wolf (2012): nonlinear shrinkage 23
24 Inverse Covariance Matrix vs Covariance Matrix 24
25 Solutions to Estimating Covariance Covariance Selection Dempster (1972): the covariance structure of a multivariate normal population can be simplified by setting elements of the inverse of the covariance matrix to zero. Awoye, OA; (2016): Graphical LASSO NM: numericalmethod/suanshu/model/covarianceselection/las so/covarianceselectionglassofast.html numericalmethod/suanshu/model/covarianceselection/las so/covarianceselectionlasso.html 25
26 Solutions to Estimating Covariance Nearest Positive Definite Matrix Matrix made Positive Definite Goldfeld, Quandt and Trotter Matthews and Davies Positive diagonal NM: icalmethod/suanshu/algebra/linear/matrix/doubles/operation/po sitivedefinite/package-summary.html Nearest Covariance/Correlation Matrix Nicholas J. Higham (1988, 2013) Defeng, Sun (2011, 2006) 26
27 Solutions to Estimating Mean Statistical Methods Trading signals NM: /svnalgoquant/show/core/src/main/java/com/numericalmethod/algo quant/model Multifactor models: r i = α i + f 1,, f k β i + ε i Shrinkage 27
28 Solutions to Estimating Mean Black-Litterman Combined Return Vector E R = τσ 1 + P Ω 1 P 1 τσ 1 Π + P Ω 1 Q P: a matrix that identifies the assets involved in the views (K N) Ω: a diagonal covariance matrix of error terms from the expressed views representing the uncertainties in each view (K K) П: the implied equilibrium return vector (N 1) Q: the view vector (K 1) 28
29 Solutions to Diversification Using Constraints Black-Litterman Diversification constraints, e.g., lower and upper bounds sector exposure 29
30 Solutions to Diversification Almost Efficient Portfolios MVO intends to give an optimized portfolio in terms of risk-reward MVO does not intend to give a diversified portfolio Many portfolios on the efficient frontier are indeed concentrated However, there are many well diversified portfolios within a small neighborhood of the efficient frontier Almost Efficient Portfolios: max D ω s.t., (D is the diversification criterion.) ω ω Σω σ eff + σ, relaxation of portfolio variance R eff ΔR ω r, relaxation of portfolio expected return 1 ω = 1 NM: d/suanshu/model/corvalan2005/diversification/package-summary.html 30
31 Second Order Conic Programming min x f x, s.t., A i x + b i 2 c i x + d i, i = 1,, m FF = g LP, QP Solution: interior point method 31
 j Si ω 0 j + ω j u i for sector i = 1,, S Many other constraints can be modeled as SOCP constraints. NM has a collection of them.")
32 Solutions to Imposing Constraints Second Order Conic Programming Market impact 3 n m j ω 2 j=1 j t 2 Diversification constraints (sector exposure) j Si ω 0 j + ω j u i for sector i = 1,, S Many other constraints can be modeled as SOCP constraints. NM has a collection of them. 32


33 NM SOCP Optimizer 33


34 SOCP Optimizers Numerical Method Optimizers 25 times faster than free optimizers, e.g., R MOSEK Gurobi CPLEX XPRESS 34
35 Solution to Performance Better Estimations We combine all the NM modules and algorithms to create better MVO models. Better mean estimation Better covariance estimation Better constraint modeling Better diversification criterion NM MVO comparison framework: ository/svnalgoquant/show/core/src/main/java/com/numericalmetho d/algoquant/model/portfoliooptimization/simulation 35
36 Solution to Performance Unknown Mean and Unknown Covariance Incorporate uncertainties of estimations into the model. max E ω ω r t+1 λ Var ω r t+1 This is a stochastic optimization problem. Use bootstrapping to estimate μ n and V n from past return. Resample with replacements Model returns as AR Model returns as SR Model returns as SR+GARCH NM: d/suanshu/model/lai2010/package-summary.html del/portfoliooptimization/lai

37 Solution to Performance Unknown Mean and Unknown Covariance 37
38 Realized Cumulative Returns Over Time Unknown Mean and Unknown Covariance 38
39 Robust Optimization Estimation Errors With Bounds We assume that there are inherent uncertainties in the inputs, mean and covariance. While the true values of the model s parameters are not known with certainty, but the bounds are assumed to be known. The optimal solution represents the best choice when considering all possibilities from the uncertainty set. Robust formulation with uncertainty in expected returns. min max ω μ U ω Σω λμ ω It says: minimize the worst of risk among all possible values of the expected return. Robust formulation of the MVO problem. max ω min μ,σ U μ,σ μ ω λω Σω It says: maximize the worst of risk-adjusted reward among all possible values of mean and covariance. 39
40 Robust Optimization Performance 40
41 Multi-Stage Portfolio Optimization We can rebalance the portfolio periodically at times t = 1,, T 1. Our objective function should be with respect to the expiry time, T. max E U W T At stage t = 1, we can rebalance the portfolio by specifying the weights. At stage t = 2, we know the realized returns in the last period so we can use this information to rebalance the portfolio. Thus, the weights in stage 2 are functions of the (random) realization in the last stage. Solution: stochastic programming, dynamic programming 41

42 AI Genetic Programming (1) Non-parametric, non-analytical, no estimation algorithm Grid search, no math needed But impractical for large number of stocks E.g., 10 levels, 3000 stocks, search space = 10^
43 AI Genetic Programming (2) Use AI to improve performance of known portfolios. HUGE search space crossover search crossover search known good portfolio crossover search known good portfolio known good portfolio crossover search crossover search crossover search known good portfolio known good portfolio known good portfolio 43

44 Comparisons of Optimization Algorithms 44
45 45 Sharpe-Omega, a Better Measure of Risk
46 Better Risk Measures Variance, hence Sharpe ratio, is not a good measure of risks. Sharpe ratio does not differentiate between winning and losing trades, essentially ignoring their likelihoods (odds). Sharpe ratio does not consider, essentially ignoring, all higher moments of a return distribution except the first two, the mean and variance. Other risk measures: Sortino ratio, S = R T DD Calmar ratio, C = r 36 MM 46
47 Sharpe s Choice Both A and B have the same mean. A has a smaller variance. Sharpe will always chooses a portfolio of the smallest variance among all those having the same mean. Hence A is preferred to B by Sharpe.
48 Avoid Downsides and Upsides Sharpe chooses the smallest variance portfolio to reduce the chance of having extreme losses. Yet, for a Normally distributed return, the extreme gains are as likely as the extreme losses. Ignoring the downsides will inevitably ignore the potential for upsides as well.
49 Potential for Gains Suppose we rank A and B by their potential for gains, we would choose B over A. Shall we choose the portfolio with the biggest variance then? It is very counter intuitive.
50 Example 1: A or B?
51 Example 1: L = 3 Suppose the loss threshold is 3. Pictorially, we see that B has more mass to the right of 3 than that of A. B: 43% of mass; A: 37%. We compare the likelihood of winning to losing. B: 0.77; A: We therefore prefer B to A.
52 Example 1: L = 1 Suppose the loss threshold is 1. A has more mass to the right of L than that of B. We compare the likelihood of winning to losing. A: 1.71; B: We therefore prefer A to B.
53 Example 2
54 Example 2: Winning Ratio It is evident from the example(s) that, when choosing a portfolio, the likelihoods/odds/chances/potentials for upside and downside are important. Winning ratio W A W B : 2σ gain: 1.8 3σ gain: σ gain: 35
55 Example 2: Losing Ratio Losing ratio L A L B : 1σ loss: 1.4 2σ loss: 0.7 3σ loss : 80 4σ loss : 100,000!!!
56 Higher Moments Are Important Both large gains and losses in example 2 are produced by moments of order 5 and higher. They even shadow the effects of skew and kurtosis. Example 2 has the same mean and variance for both distributions. Because Sharpe Ratio ignores all moments from order 3 and bigger, it treats all these very different distributions the same.
57 How Many Moments Are Needed?
58 Distribution A Combining 3 Normal distributions N(-5, 0.5) N(0, 6.5) N(5, 0.5) Weights: 25% 50% 25%
59 Moments of A Same mean and variance as distribution B. Symmetric distribution implies all odd moments (3 rd, 5 th, etc.) are 0. Kurtosis = 2.65 (smaller than the 3 of Normal) Does smaller Kurtosis imply smaller risk? 6 th moment: 0.2% different from Normal 8 th moment: 24% different from Normal 10 th moment: 55% bigger than Normal
60 Performance Measure Requirements Take into account the odds of winning and losing. Take into account the sizes of winning and losing. Take into account of (all) the moments of a return distribution.
61 Loss Threshold Clearly, the definition, hence likelihoods, of winning and losing depends on how we define loss. Suppose L = Loss Threshold, for return < L, we consider it a loss for return > L, we consider it a gain
62 An Attempt To account for the odds of wining and losing the sizes of wining and losing We consider Ω = E r r>l P r>l E r r L P r L Ω = E r r>l 1 F L E r r L F L

63 First Attempt
64 First Attempt Inadequacy Why F(L)? Not using the information from the entire distribution. hence ignoring higher moments
65 Another Attempt B C A D
66 Omega Definition Ω takes the concept to the limit. Ω uses the whole distribution. Ω definition: Ω = AAA Ω = AAA b=max r L L a=min r 1 F r dd F r dd
67 Intuitions Omega is a ratio of winning size weighted by probabilities to losing size weighted by probabilities. Omega considers size and odds of winning and losing trades. Omega considers all moments because the definition incorporates the whole distribution.
68 Omega Advantages There is no parameter (estimation). There is no need to estimate (higher) moments. Work with all kinds of distributions. Use a function (of Loss Threshold) to measure performance rather than a single number (as in Sharpe Ratio). It is as smooth as the return distribution. It is monotonic decreasing.
69 Omega Example
70 Numerator Integral (1) b d x 1 F x L = x 1 F x L = b 1 F b L 1 F L = L 1 F L b
71 Numerator Integral (2) b d x 1 F x L b L b L = 1 F x dx = 1 F x dd b + xd 1 F x L b L xxx x
72 Numerator Integral (3) b L 1 F L = 1 F x dd b 1 F x dd L = b L b a L x L f x dd = max x L, 0 f x dd = E max x L, 0 b xxx x L b L = L 1 F L + xxx x undiscounted call option price
73 Denominator Integral (1) L d xf x a = xx x L a = LF L a F a = LF L
74 Denominator Integral (2) L d xf x a L a = F x dx + xdd x L a
75 Denominator Integral (3) L LL L = F x dd L a F x dd = L a b a a L + xxx x a L a = LL L xxx x L x f x dx = max L x, 0 f x dd = E max L x, 0 undiscounted put option price
76 Another Look at Omega Ω = = b=max r 1 F r dd L L a=min r E max x L,0 E max L x,0 F r dd = e rf E max x L,0 e rf E max L x,0 = C L P L
77 Options Intuition Numerator: the cost of acquiring the return above L Denominator: the cost of protecting the return below L Risk measure: the put option price as the cost of protection is a much more general measure than variance
78 Can We Do Better? Excess return in Sharpe Ratio is more intuitive than C L in Omega. Put options price as a risk measure in Omega is better than variance in Sharpe Ratio.
79 Sharpe-Omega Ω S = r L P L In this definition, we combine the advantages in both Sharpe Ratio and Omega. meaning of excess return is clear risk is bettered measured Sharpe-Omega is more intuitive. Ω S ranks the portfolios in exactly the same way as Ω.
80 Sharpe-Omega and Moments It is important to note that the numerator relates only to the first moment (the mean) of the returns distribution. It is the denominator that take into account the variance and all the higher moments, hence the whole distribution.
81 Sharpe-Omega and Variance Suppose r > L. Ω S > 0. The bigger the volatility, the higher the put price, the bigger the risk, the smaller the Ω S, the less attractive the investment. We want smaller volatility to be more certain about the gains. Suppose r < L. Ω S < 0. The bigger the volatility, the higher the put price, the bigger the Ω S, the more attractive the investment. Bigger volatility increases the odd of earning a return above L.
82 Non-Linear, Non-Convex Portfolio Optimization In general, a Sharpe optimized portfolio is different from an Omega optimized portfolio.
83 83 Beyond Mean Variance Optimization
84 Optimizing for Omega max Ω S x n x i x i E r i ρ n i x i = 1 x l i x i 1 Minimum holding: x l = x 1 l,, x n l
85 Optimization Methods Nonlinear Programming Penalty Method Global Optimization Tabu search (Glover 2005) Threshold Accepting algorithm (Avouyi-Dovi et al.) MCS algorithm (Huyer and Neumaier 1999) Simulated Annealing Genetic Algorithm Integer Programming (Mausser et al.)
86 3 Assets Example x 1 + x 2 + x 3 = 1 R i = x 1 r 1i + x 2 r 2i + x 3 r 3i = x 1 r 1i + x 2 r 2i + 1 x 1 x 2 r 3i
87 Penalty Method F x 1, x 2 = Ω R i + ρ min 0, x min 0, x min 0,1 x 1 x 2 2 Can apply Nelder-Mead, a Simplex algorithm that takes initial guesses. F needs not be differentiable. Can do random-restart to search for global optimum.
88 Threshold Accepting Algorithm It is a local search algorithm. It explores the potential candidates around the current best solution. It escapes the local minimum by allowing choosing a lower than current best solution. This is in very sharp contrast to a hilling climbing algorithm.
89 Objective Objective function h: X R, X R n Optimum hopt = max x X h x
90 Initialization Initialize n (number of iterations) and ssss. Initialize sequence of thresholds tt k, k = 1,, ssss Starting point: x 0 X
91 Thresholds Simulate a set of portfolios. Compute the distances between the portfolios. Order the distances from smallest to biggest. Choose the first ssss number of them as thresholds.
92 Search x i+1 N xi (neighbour of x i ) Threshold: h = h x i+1 h x i Accepting: If h > tt k set x i+1 = x i Continue until we finish the last (smallest) threshold. h x i h ooo Evaluating h by Monte Carlo simulation.
93 AI Genetic Programming Those arbitrary, non-convex, non-differentiable, noncontinuous, noisy, objective functions are difficult to be optimized using traditional methods. We resort to Artificial Intelligence, heuristics and simulations. In a genetic algorithm, a population of candidate solutions (called individuals, creatures, or phenotypes) to an optimization problem is evolved toward better solutions. Each candidate solution has a set of properties (its chromosomes or genotype) which can be mutated and altered; traditionally, solutions are represented in binary as strings of 0s and 1s, but other encodings are also possible. NM Genetic Programming Framework: ricalmethod/suanshu/optimization/multivariate/geneticalgorith m/package-summary.html 93
94 Differential Evolution DE is used for multidimensional real-valued functions but does not use the gradient of the problem being optimized, which means DE does not require for the optimization problem to be differentiable as is required by classic optimization methods such as gradient descent and quasi-newton methods. DE can therefore also be used on optimization problems that are not even continuous, are noisy, change over time, etc. DE optimizes a problem by maintaining a population of candidate solutions and creating new candidate solutions by combining existing ones according to its simple formulae, and then keeping whichever candidate solution has the best score or fitness on the optimization problem at hand. In this way the optimization problem is treated as a black box that merely provides a measure of quality given a candidate solution and the gradient is therefore not needed. NM: d/suanshu/optimization/multivariate/geneticalgorithm/minimizer/deopti m/deoptim.html 94
95 95 Multi Factor Model
96 Fundamental Theorem in Quantitative Trading The average return of a stock = payoff for taking risk = factor exposure * factor premium Factor exposure: the exposure of a stock to some kind of risk (or factor) Factor premium: the payoff to an investor per one unit of exposure 96
97 Fundamental Factor Model Fundamental factors = stock characteristics. size, P/E, current ratio, advertising-expenditure-to-sales ratio, analyst rating, M12M, Factor exposure is known. The exposure to the risk or factor size is simply size/capitalization. The exposure to the risk or factor P/E is simply P/E. Factor premium needs to be estimated. The premium or payoff to one unit of exposure to size is unknown. r i = α i + β ii f 1 + β i2 f β ik f K + ε i K: number of factors β ij : the exposure of each stock i to the j-th factor is different f j : the factor premium is a property of the factor and is independent of stocks α i : time invariant individual stock effect The uncertainty of r i comes from the uncertainty of f j, which are themselves random variable. 97
98 Economic Factor Models Economic factors: factor premiums/effects same for all stocks, e.g., inflation, but different stocks have different exposures to them. Factor exposures need to be estimated: how much is a stock exposed (sensitive/affected by) to inflation? Assumption: the unknown true premium of a factor is a linear combination of the observed factor value and a constant (which takes care of the expected part of the factor value). We are only rewarded for the unexpected part of the factor (value). 98
99 Quintiles Method To test whether a factor (or a strategy) is significant in generating alpha Rank/sort the stocks in a universe by the factor by standardized factor exposures, e.g., z-scores. z i = β i μ σ Divide them into 5 groups (20% each). Portfolio formed each quarter over the test period. Each portfolio is hold for 12 months. Number of portfolios in each quintile for the test period = test period (in years)*4*(size of universe/5). Compute average returns for each quintile. Factor significant if top first quintile significantly outperformed the universe the bottom fifth quintile significantly underperformed the outperformance/underperformance was consistent over time
100 Economic Factor Models Math r i = α i + β ii f 1 + β ii f β ii f K + ε i = α i, β ii,, β ii f 1 1 f K = β i f + ε i E r i = β i E f + ε i 100
101 Variance Risk r i = β i f + ε i Total risk = diversifiable risk + non-diversifiable risk Var r i = Var β i f + Var ε i = β i Var f β i + Var ε i Var f is the variance-covariance matrix of the factor premiums. 101
102 Economic Factor Model Factor Premiums Economic/Behavior/Market: usually expressed as rates, e.g., change % Fundamental/Technical/Analyst: zero investment portfolio method For each time t, for each factor k, set the upper and lower cutoff points, x k and x k. Divide the stocks into three groups. High group: x iii > x k Low group: x iii < x k Others Factor premium is the expected return to the zero-investment position that put $1 into the high group and short $1 in the low group. f kk = E r t x kk > x k E r t x kk < x k The expectation is taken across stocks. The weights and returns are both decided on time t. Statistical factors: PCA on returns Each of the most significant factor premium is a linear combination of the stock returns at time t. Pick the K eigenvectors q 1,, q K that correspond to the largest K eigenvalues. Statistical factors are: f i,t = q i r t. Note: all of them, by construction, change over time. 102
103 Economic Factor Model Factor Exposures For each of the N stocks, run an OLS to compute the factor exposures/factor sensitivities/factor loadings. Report betas and their standard errors. Merger: β AA = s A β s A +s A + s B β B s A +s B B s A : pre-merger market capitalization of firm A s B : pre-merger market capitalization of firm B IPO by Characteristic Matching: We use the factor exposures of M similar firms. To identify the M similar firms, We choose L company characteristics; Compute the z-score of those L characteristics for a group of firms z i = z ii,, z ii as well as those of the new company, z = z 1,, z L. Set a threshold, ε. The similar firms are those with smaller distances. That is, z z i < ε. β = 1 M β β M 103
104 Economic Factor Model Algorithm 1. Set the time interval, e.g. monthly or rebalacing period, and time period of data, e.g. 3 to 5 years. 2. Set the investment universe. 3. Choose the factors for the model. 4. Set the risk-free rate. 5. Collect stock returns for the time period at each interval. If benchmarking, 1. Better use risk-free rate adjusted return: r ii = r ii r ff 2. If for benchmarking, we use residual stock returns in lieu of stock returns. 3. r i α i + ε i = r i β i r B 6. Collect factor premium data for the time period at each interval. 1. Economic/behavior/market factors: readily available 2. Fundamental/technical/analyst factors: zero investment portfolio method 3. Statistical factors: PCA 7. Estimate the factor exposures from time series regression of stock returns on premium. 1. If not enough factor-premium data, do characteristic matching before regression. 8. Check robustness by splitting the data into subsets and compare the estimates for each subset. Highlight major differences. 1. Split by time periods. 2. Split by sectors. 9. If the estimation is not robust (subset estimates are not similar), try a different estimation method. 10. Compute the expected stock returns. 11. Compute the risks of the stocks for both non-diversifiable and diversifiable risks. 12. Compute the correlation matrix of stocks returns. 104
105 105 NM Technologies
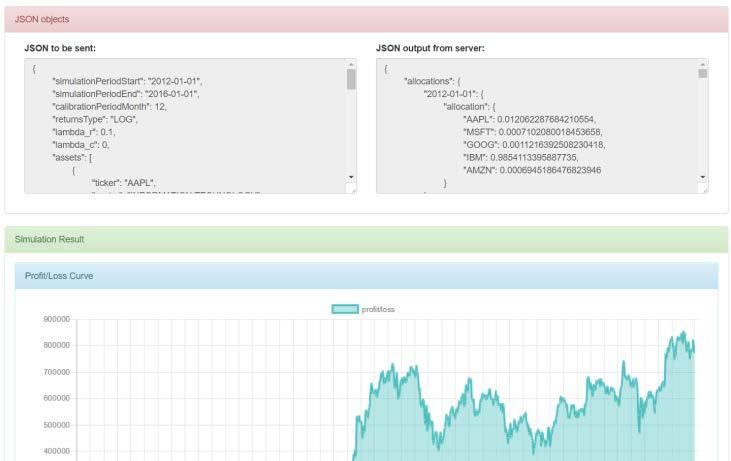
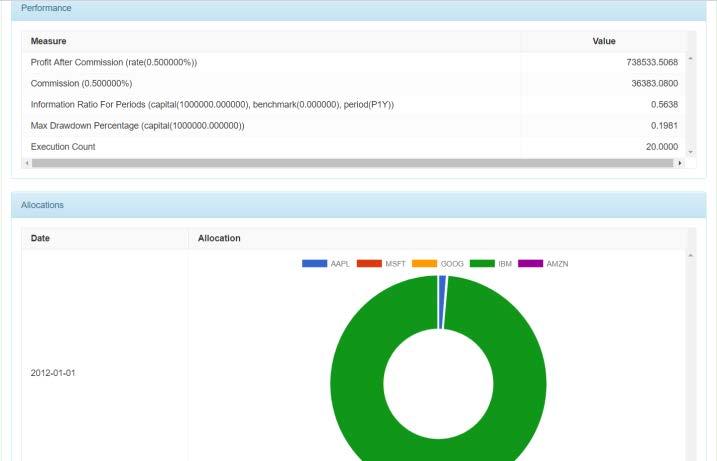
106 SaaS Tools for Modeling and Constructing "Alpha Strategy" Mutual fund and private equity fund managers, quantitative investment teams, etc. In China, the majority of the quantitative trading strategies are alpha strategies. They recently have poor performance. Funds are extremely desperate to look for a new direction NM s research library provides two tools that can immediately improve the performance of existing alpha strategies multi-factor model asset allocation, portfolio optimization Provide users with an intuitive and easy to use interface to complete complicated tasks such as financial modeling, strategy optimization, return performance and risk control, all without programming - With our system, traders only need to do the first step, factor selection, and leave the rest of the complex process to system automation, hence great efficiency in strategy research and time to production Factor selection/definit ion α factors sorting, grouping factor exposures factor premiums Model construction OLS regression panel regression α β computation Portfolio optimization Markowitz Black-Litterman Second Order Conic Programming uncertain mean and covariance customized objective functions corner portfolios Backtesting historical backtesting Monte Carlo backtesting bootstrapping backtesting scenario and stress testing Reporting VaR computation p&l attribution risk assessment easy to understand, professional and standardized report

107 NM FinTech Alpha Strategy Framework 107
108 NM FinTech Factor Premiums 108

109 NM FinTech Factor Exposures 109

110 NM FinTech Stock Selection 110
111 NM FinTech Capital Allocation 111
112 NM FinTech Performance Statistics 112
113 NM FinTech By-Period Performance 113
Portfolio Optimization & Risk Management. Haksun Li
 Portfolio Optimization & Risk Management Haksun Li haksun.li@numericalmethod.com www.numericalmethod.com Speaker Profile Dr. Haksun Li CEO, Numerical Method Inc. (Ex-)Adjunct Professors, Industry Fellow,
Introduction to Algorithmic Trading Strategies Lecture 9
 Introduction to Algorithmic Trading Strategies Lecture 9 Quantitative Equity Portfolio Management Haksun Li haksun.li@numericalmethod.com www.numericalmethod.com Outline Alpha Factor Models References
Portfolio Risk Management and Linear Factor Models
 Chapter 9 Portfolio Risk Management and Linear Factor Models 9.1 Portfolio Risk Measures There are many quantities introduced over the years to measure the level of risk that a portfolio carries, and each
Tuomo Lampinen Silicon Cloud Technologies LLC
 Tuomo Lampinen Silicon Cloud Technologies LLC www.portfoliovisualizer.com Background and Motivation Portfolio Visualizer Tools for Investors Overview of tools and related theoretical background Investment
ECONOMIA DEGLI INTERMEDIARI FINANZIARI AVANZATA MODULO ASSET MANAGEMENT LECTURE 6
 ECONOMIA DEGLI INTERMEDIARI FINANZIARI AVANZATA MODULO ASSET MANAGEMENT LECTURE 6 MVO IN TWO STAGES Calculate the forecasts Calculate forecasts for returns, standard deviations and correlations for the
Market Risk Analysis Volume I
 Market Risk Analysis Volume I Quantitative Methods in Finance Carol Alexander John Wiley & Sons, Ltd List of Figures List of Tables List of Examples Foreword Preface to Volume I xiii xvi xvii xix xxiii
Quantitative Risk Management
 Quantitative Risk Management Asset Allocation and Risk Management Martin B. Haugh Department of Industrial Engineering and Operations Research Columbia University Outline Review of Mean-Variance Analysis
Mathematics in Finance
 Mathematics in Finance Steven E. Shreve Department of Mathematical Sciences Carnegie Mellon University Pittsburgh, PA 15213 USA shreve@andrew.cmu.edu A Talk in the Series Probability in Science and Industry
Financial Mathematics III Theory summary
 Financial Mathematics III Theory summary Table of Contents Lecture 1... 7 1. State the objective of modern portfolio theory... 7 2. Define the return of an asset... 7 3. How is expected return defined?...
CSCI 1951-G Optimization Methods in Finance Part 00: Course Logistics Introduction to Finance Optimization Problems
 CSCI 1951-G Optimization Methods in Finance Part 00: Course Logistics Introduction to Finance Optimization Problems January 26, 2018 1 / 24 Basic information All information is available in the syllabus
Optimization 101. Dan dibartolomeo Webinar (from Boston) October 22, 2013
 October 22, 2013") Optimization 101 Dan dibartolomeo Webinar (from Boston) October 22, 2013 Outline of Today s Presentation The Mean-Variance Objective Function Optimization Methods, Strengths and Weaknesses Estimation Error
Optimization 101 Dan dibartolomeo Webinar (from Boston) October 22, 2013 Outline of Today s Presentation The Mean-Variance Objective Function Optimization Methods, Strengths and Weaknesses Estimation Error
Black-Litterman Model
 Institute of Financial and Actuarial Mathematics at Vienna University of Technology Seminar paper Black-Litterman Model by: Tetyana Polovenko Supervisor: Associate Prof. Dipl.-Ing. Dr.techn. Stefan Gerhold
Quantitative Portfolio Theory & Performance Analysis
 550.447 Quantitative ortfolio Theory & erformance Analysis Week February 18, 2013 Basic Elements of Modern ortfolio Theory Assignment For Week of February 18 th (This Week) Read: A&L, Chapter 3 (Basic
Optimal Portfolio Selection Under the Estimation Risk in Mean Return
 Optimal Portfolio Selection Under the Estimation Risk in Mean Return by Lei Zhu A thesis presented to the University of Waterloo in fulfillment of the thesis requirement for the degree of Master of Mathematics
Portfolio Optimization with Alternative Risk Measures
 Portfolio Optimization with Alternative Risk Measures Prof. Daniel P. Palomar The Hong Kong University of Science and Technology (HKUST) MAFS6010R- Portfolio Optimization with R MSc in Financial Mathematics
Motif Capital Horizon Models: A robust asset allocation framework
 Motif Capital Horizon Models: A robust asset allocation framework Executive Summary By some estimates, over 93% of the variation in a portfolio s returns can be attributed to the allocation to broad asset
Asset Allocation and Risk Assessment with Gross Exposure Constraints
 Asset Allocation and Risk Assessment with Gross Exposure Constraints Forrest Zhang Bendheim Center for Finance Princeton University A joint work with Jianqing Fan and Ke Yu, Princeton Princeton University
Chapter 8: CAPM. 1. Single Index Model. 2. Adding a Riskless Asset. 3. The Capital Market Line 4. CAPM. 5. The One-Fund Theorem
 Chapter 8: CAPM 1. Single Index Model 2. Adding a Riskless Asset 3. The Capital Market Line 4. CAPM 5. The One-Fund Theorem 6. The Characteristic Line 7. The Pricing Model Single Index Model 1 1. Covariance
Statistical Models and Methods for Financial Markets
 Tze Leung Lai/ Haipeng Xing Statistical Models and Methods for Financial Markets B 374756 4Q Springer Preface \ vii Part I Basic Statistical Methods and Financial Applications 1 Linear Regression Models
Mean Variance Portfolio Theory
 Chapter 1 Mean Variance Portfolio Theory This book is about portfolio construction and risk analysis in the real-world context where optimization is done with constraints and penalties specified by the
FE670 Algorithmic Trading Strategies. Stevens Institute of Technology
 FE670 Algorithmic Trading Strategies Lecture 4. Cross-Sectional Models and Trading Strategies Steve Yang Stevens Institute of Technology 09/26/2013 Outline 1 Cross-Sectional Methods for Evaluation of Factor
Lecture 3: Factor models in modern portfolio choice
 Lecture 3: Factor models in modern portfolio choice Prof. Massimo Guidolin Portfolio Management Spring 2016 Overview The inputs of portfolio problems Using the single index model Multi-index models Portfolio
Next Generation Fund of Funds Optimization
 Next Generation Fund of Funds Optimization Tom Idzorek, CFA Global Chief Investment Officer March 16, 2012 2012 Morningstar Associates, LLC. All rights reserved. Morningstar Associates is a registered
Portfolio Optimization. Prof. Daniel P. Palomar
 Portfolio Optimization Prof. Daniel P. Palomar The Hong Kong University of Science and Technology (HKUST) MAFS6010R- Portfolio Optimization with R MSc in Financial Mathematics Fall 2018-19, HKUST, Hong
Calculating VaR. There are several approaches for calculating the Value at Risk figure. The most popular are the
 VaR Pro and Contra Pro: Easy to calculate and to understand. It is a common language of communication within the organizations as well as outside (e.g. regulators, auditors, shareholders). It is not really
Log-Robust Portfolio Management
 Log-Robust Portfolio Management Dr. Aurélie Thiele Lehigh University Joint work with Elcin Cetinkaya and Ban Kawas Research partially supported by the National Science Foundation Grant CMMI-0757983 Dr.
Optimal Portfolio Inputs: Various Methods
 Optimal Portfolio Inputs: Various Methods Prepared by Kevin Pei for The Fund @ Sprott Abstract: In this document, I will model and back test our portfolio with various proposed models. It goes without
Lecture 17: More on Markov Decision Processes. Reinforcement learning
 Lecture 17: More on Markov Decision Processes. Reinforcement learning Learning a model: maximum likelihood Learning a value function directly Monte Carlo Temporal-difference (TD) learning COMP-424, Lecture
PORTFOLIO OPTIMIZATION: ANALYTICAL TECHNIQUES
 PORTFOLIO OPTIMIZATION: ANALYTICAL TECHNIQUES Keith Brown, Ph.D., CFA November 22 nd, 2007 Overview of the Portfolio Optimization Process The preceding analysis demonstrates that it is possible for investors
bitarisk. BITA Vision a product from corfinancial. london boston new york BETTER INTELLIGENCE THROUGH ANALYSIS better intelligence through analysis
 bitarisk. BETTER INTELLIGENCE THROUGH ANALYSIS better intelligence through analysis BITA Vision a product from corfinancial. london boston new york Expertise and experience deliver efficiency and value
Mean Variance Analysis and CAPM
 Mean Variance Analysis and CAPM Yan Zeng Version 1.0.2, last revised on 2012-05-30. Abstract A summary of mean variance analysis in portfolio management and capital asset pricing model. 1. Mean-Variance
Robust Portfolio Optimization SOCP Formulations
 1 Robust Portfolio Optimization SOCP Formulations There has been a wealth of literature published in the last 1 years explaining and elaborating on what has become known as Robust portfolio optimization.
Markowitz portfolio theory
 Markowitz portfolio theory Farhad Amu, Marcus Millegård February 9, 2009 1 Introduction Optimizing a portfolio is a major area in nance. The objective is to maximize the yield and simultaneously minimize
Master s in Financial Engineering Foundations of Buy-Side Finance: Quantitative Risk and Portfolio Management. > Teaching > Courses
 Master s in Financial Engineering Foundations of Buy-Side Finance: Quantitative Risk and Portfolio Management www.symmys.com > Teaching > Courses Spring 2008, Monday 7:10 pm 9:30 pm, Room 303 Attilio Meucci
Robust Portfolio Construction
 Robust Portfolio Construction Presentation to Workshop on Mixed Integer Programming University of Miami June 5-8, 2006 Sebastian Ceria Chief Executive Officer Axioma, Inc sceria@axiomainc.com Copyright
Portfolios that Contain Risky Assets 3: Markowitz Portfolios
 Portfolios that Contain Risky Assets 3: Markowitz Portfolios C. David Levermore University of Maryland, College Park, MD Math 42: Mathematical Modeling March 21, 218 version c 218 Charles David Levermore
(High Dividend) Maximum Upside Volatility Indices. Financial Index Engineering for Structured Products
 Maximum Upside Volatility Indices. Financial Index Engineering for Structured Products") (High Dividend) Maximum Upside Volatility Indices Financial Index Engineering for Structured Products White Paper April 2018 Introduction This report provides a detailed and technical look under the hood
(High Dividend) Maximum Upside Volatility Indices Financial Index Engineering for Structured Products White Paper April 2018 Introduction This report provides a detailed and technical look under the hood
Catastrophe Reinsurance Risk A Unique Asset Class
 Catastrophe Reinsurance Risk A Unique Asset Class Columbia University FinancialEngineering Seminar Feb 15 th, 2010 Lixin Zeng Validus Holdings, Ltd. Outline The natural catastrophe reinsurance market Characteristics
Asset Selection Model Based on the VaR Adjusted High-Frequency Sharp Index
 Management Science and Engineering Vol. 11, No. 1, 2017, pp. 67-75 DOI:10.3968/9412 ISSN 1913-0341 [Print] ISSN 1913-035X [Online] www.cscanada.net www.cscanada.org Asset Selection Model Based on the VaR
Risk Measurement in Credit Portfolio Models
 9 th DGVFM Scientific Day 30 April 2010 1 Risk Measurement in Credit Portfolio Models 9 th DGVFM Scientific Day 30 April 2010 9 th DGVFM Scientific Day 30 April 2010 2 Quantitative Risk Management Profit
FIN 6160 Investment Theory. Lecture 7-10
 FIN 6160 Investment Theory Lecture 7-10 Optimal Asset Allocation Minimum Variance Portfolio is the portfolio with lowest possible variance. To find the optimal asset allocation for the efficient frontier
Optimal Portfolios and Random Matrices
 Optimal Portfolios and Random Matrices Javier Acosta Nai Li Andres Soto Shen Wang Ziran Yang University of Minnesota, Twin Cities Mentor: Chris Bemis, Whitebox Advisors January 17, 2015 Javier Acosta Nai
LECTURE NOTES 3 ARIEL M. VIALE
 LECTURE NOTES 3 ARIEL M VIALE I Markowitz-Tobin Mean-Variance Portfolio Analysis Assumption Mean-Variance preferences Markowitz 95 Quadratic utility function E [ w b w ] { = E [ w] b V ar w + E [ w] }
Multi-Period Trading via Convex Optimization
 Multi-Period Trading via Convex Optimization Stephen Boyd Enzo Busseti Steven Diamond Ronald Kahn Kwangmoo Koh Peter Nystrup Jan Speth Stanford University & Blackrock City University of Hong Kong September
Portfolio Management and Optimal Execution via Convex Optimization
 Portfolio Management and Optimal Execution via Convex Optimization Enzo Busseti Stanford University April 9th, 2018 Problems portfolio management choose trades with optimization minimize risk, maximize
The Markowitz framework
 IGIDR, Bombay 4 May, 2011 Goals What is a portfolio? Asset classes that define an Indian portfolio, and their markets. Inputs to portfolio optimisation: measuring returns and risk of a portfolio Optimisation
IEOR E4602: Quantitative Risk Management
 IEOR E4602: Quantitative Risk Management Basic Concepts and Techniques of Risk Management Martin Haugh Department of Industrial Engineering and Operations Research Columbia University Email: martin.b.haugh@gmail.com
Is Greedy Coordinate Descent a Terrible Algorithm?
 Is Greedy Coordinate Descent a Terrible Algorithm? Julie Nutini, Mark Schmidt, Issam Laradji, Michael Friedlander, Hoyt Koepke University of British Columbia Optimization and Big Data, 2015 Context: Random
Risk Reward Optimisation for Long-Run Investors: an Empirical Analysis
 GoBack Risk Reward Optimisation for Long-Run Investors: an Empirical Analysis M. Gilli University of Geneva and Swiss Finance Institute E. Schumann University of Geneva AFIR / LIFE Colloquium 2009 München,
Market Risk Analysis Volume II. Practical Financial Econometrics
 Market Risk Analysis Volume II Practical Financial Econometrics Carol Alexander John Wiley & Sons, Ltd List of Figures List of Tables List of Examples Foreword Preface to Volume II xiii xvii xx xxii xxvi
Extend the ideas of Kan and Zhou paper on Optimal Portfolio Construction under parameter uncertainty
 Extend the ideas of Kan and Zhou paper on Optimal Portfolio Construction under parameter uncertainty George Photiou Lincoln College University of Oxford A dissertation submitted in partial fulfilment for
AIRCURRENTS: PORTFOLIO OPTIMIZATION FOR REINSURERS
 MARCH 12 AIRCURRENTS: PORTFOLIO OPTIMIZATION FOR REINSURERS EDITOR S NOTE: A previous AIRCurrent explored portfolio optimization techniques for primary insurance companies. In this article, Dr. SiewMun
Equity correlations implied by index options: estimation and model uncertainty analysis
 1/18 : estimation and model analysis, EDHEC Business School (joint work with Rama COT) Modeling and managing financial risks Paris, 10 13 January 2011 2/18 Outline 1 2 of multi-asset models Solution to
MAKING OPTIMISATION TECHNIQUES ROBUST WITH AGNOSTIC RISK PARITY
 Technical Note May 2017 MAKING OPTIMISATION TECHNIQUES ROBUST WITH AGNOSTIC RISK PARITY Introduction The alternative investment industry is becoming ever more accessible to those wishing to diversify away
Applied Macro Finance
 Master in Money and Finance Goethe University Frankfurt Week 8: An Investment Process for Stock Selection Fall 2011/2012 Please note the disclaimer on the last page Announcements December, 20 th, 17h-20h:
Journal of Computational and Applied Mathematics. The mean-absolute deviation portfolio selection problem with interval-valued returns
 Journal of Computational and Applied Mathematics 235 (2011) 4149 4157 Contents lists available at ScienceDirect Journal of Computational and Applied Mathematics journal homepage: www.elsevier.com/locate/cam
OMEGA. A New Tool for Financial Analysis
 OMEGA A New Tool for Financial Analysis 2 1 0-1 -2-1 0 1 2 3 4 Fund C Sharpe Optimal allocation Fund C and Fund D Fund C is a better bet than the Sharpe optimal combination of Fund C and Fund D for more
Week 2 Quantitative Analysis of Financial Markets Hypothesis Testing and Confidence Intervals
 Week 2 Quantitative Analysis of Financial Markets Hypothesis Testing and Confidence Intervals Christopher Ting http://www.mysmu.edu/faculty/christophert/ Christopher Ting : christopherting@smu.edu.sg :
Portfolio selection with multiple risk measures
 Portfolio selection with multiple risk measures Garud Iyengar Columbia University Industrial Engineering and Operations Research Joint work with Carlos Abad Outline Portfolio selection and risk measures
INTERTEMPORAL ASSET ALLOCATION: THEORY
 INTERTEMPORAL ASSET ALLOCATION: THEORY Multi-Period Model The agent acts as a price-taker in asset markets and then chooses today s consumption and asset shares to maximise lifetime utility. This multi-period
Asset Allocation in the 21 st Century
 Asset Allocation in the 21 st Century Paul D. Kaplan, Ph.D., CFA Quantitative Research Director, Morningstar Europe, Ltd. 2012 Morningstar Europe, Inc. All rights reserved. Harry Markowitz and Mean-Variance
Predictability of Stock Returns
 Predictability of Stock Returns Ahmet Sekreter 1 1 Faculty of Administrative Sciences and Economics, Ishik University, Iraq Correspondence: Ahmet Sekreter, Ishik University, Iraq. Email: ahmet.sekreter@ishik.edu.iq
Portfolios that Contain Risky Assets Portfolio Models 3. Markowitz Portfolios
 Portfolios that Contain Risky Assets Portfolio Models 3. Markowitz Portfolios C. David Levermore University of Maryland, College Park Math 42: Mathematical Modeling March 2, 26 version c 26 Charles David
Option-Implied Information in Asset Allocation Decisions
 Option-Implied Information in Asset Allocation Decisions Grigory Vilkov Goethe University Frankfurt 12 December 2012 Grigory Vilkov Option-Implied Information in Asset Allocation 12 December 2012 1 / 32
Chapter 5 Univariate time-series analysis. () Chapter 5 Univariate time-series analysis 1 / 29
 Chapter 5 Univariate time-series analysis 1 / 29") Chapter 5 Univariate time-series analysis () Chapter 5 Univariate time-series analysis 1 / 29 Time-Series Time-series is a sequence fx 1, x 2,..., x T g or fx t g, t = 1,..., T, where t is an index denoting
Chapter 5 Univariate time-series analysis () Chapter 5 Univariate time-series analysis 1 / 29 Time-Series Time-series is a sequence fx 1, x 2,..., x T g or fx t g, t = 1,..., T, where t is an index denoting
The Fundamental Law of Mismanagement
 The Fundamental Law of Mismanagement Richard Michaud, Robert Michaud, David Esch New Frontier Advisors Boston, MA 02110 Presented to: INSIGHTS 2016 fi360 National Conference April 6-8, 2016 San Diego,
Heuristic Methods in Finance
 Heuristic Methods in Finance Enrico Schumann and David Ardia 1 Heuristic optimization methods and their application to finance are discussed. Two illustrations of these methods are presented: the selection
OPTIMAL RISKY PORTFOLIOS- ASSET ALLOCATIONS. BKM Ch 7
 OPTIMAL RISKY PORTFOLIOS- ASSET ALLOCATIONS BKM Ch 7 ASSET ALLOCATION Idea from bank account to diversified portfolio Discussion principles are the same for any number of stocks A. bonds and stocks B.
A Portfolio s Risk - Return Analysis
 A Portfolio s Risk - Return Analysis 1 Table of Contents I. INTRODUCTION... 4 II. BENCHMARK STATISTICS... 5 Capture Indicators... 5 Up Capture Indicator... 5 Down Capture Indicator... 5 Up Number ratio...
Stock Portfolio Selection using Genetic Algorithm
 Chapter 5. Stock Portfolio Selection using Genetic Algorithm In this study, a genetic algorithm is used for Stock Portfolio Selection. The shares of the companies are considered as stock in this work.
Chapter 8. Markowitz Portfolio Theory. 8.1 Expected Returns and Covariance
 Chapter 8 Markowitz Portfolio Theory 8.1 Expected Returns and Covariance The main question in portfolio theory is the following: Given an initial capital V (0), and opportunities (buy or sell) in N securities
9.1 Principal Component Analysis for Portfolios
 Chapter 9 Alpha Trading By the name of the strategies, an alpha trading strategy is to select and trade portfolios so the alpha is maximized. Two important mathematical objects are factor analysis and
The mean-variance portfolio choice framework and its generalizations
 The mean-variance portfolio choice framework and its generalizations Prof. Massimo Guidolin 20135 Theory of Finance, Part I (Sept. October) Fall 2014 Outline and objectives The backward, three-step solution
Optimization in Finance
 Research Reports on Mathematical and Computing Sciences Series B : Operations Research Department of Mathematical and Computing Sciences Tokyo Institute of Technology 2-12-1 Oh-Okayama, Meguro-ku, Tokyo
Introduction to Algorithmic Trading Strategies Lecture 8
 Introduction to Algorithmic Trading Strategies Lecture 8 Risk Management Haksun Li haksun.li@numericalmethod.com www.numericalmethod.com Outline Value at Risk (VaR) Extreme Value Theory (EVT) References
The Journal of Risk (1 31) Volume 11/Number 3, Spring 2009
 Volume 11/Number 3, Spring 2009") The Journal of Risk (1 ) Volume /Number 3, Spring Min-max robust and CVaR robust mean-variance portfolios Lei Zhu David R Cheriton School of Computer Science, University of Waterloo, 0 University Avenue
The Journal of Risk (1 ) Volume /Number 3, Spring Min-max robust and CVaR robust mean-variance portfolios Lei Zhu David R Cheriton School of Computer Science, University of Waterloo, 0 University Avenue
Modelling the Sharpe ratio for investment strategies
 Modelling the Sharpe ratio for investment strategies Group 6 Sako Arts 0776148 Rik Coenders 0777004 Stefan Luijten 0783116 Ivo van Heck 0775551 Rik Hagelaars 0789883 Stephan van Driel 0858182 Ellen Cardinaels
Part 3: Trust-region methods for unconstrained optimization. Nick Gould (RAL)
") Part 3: Trust-region methods for unconstrained optimization Nick Gould (RAL) minimize x IR n f(x) MSc course on nonlinear optimization UNCONSTRAINED MINIMIZATION minimize x IR n f(x) where the objective
Part 3: Trust-region methods for unconstrained optimization Nick Gould (RAL) minimize x IR n f(x) MSc course on nonlinear optimization UNCONSTRAINED MINIMIZATION minimize x IR n f(x) where the objective
Are Smart Beta indexes valid for hedge fund portfolio allocation?
 Are Smart Beta indexes valid for hedge fund portfolio allocation? Asmerilda Hitaj Giovanni Zambruno University of Milano Bicocca Second Young researchers meeting on BSDEs, Numerics and Finance July 2014
Value-at-Risk Based Portfolio Management in Electric Power Sector
 Value-at-Risk Based Portfolio Management in Electric Power Sector Ran SHI, Jin ZHONG Department of Electrical and Electronic Engineering University of Hong Kong, HKSAR, China ABSTRACT In the deregulated
CSCI 1951-G Optimization Methods in Finance Part 07: Portfolio Optimization
 CSCI 1951-G Optimization Methods in Finance Part 07: Portfolio Optimization March 9 16, 2018 1 / 19 The portfolio optimization problem How to best allocate our money to n risky assets S 1,..., S n with
APPEND I X NOTATION. The product of the values produced by a function f by inputting all n from n=o to n=n
 APPEND I X NOTATION In order to be able to clearly present the contents of this book, we have attempted to be as consistent as possible in the use of notation. The notation below applies to all chapters
VaR vs CVaR in Risk Management and Optimization
 VaR vs CVaR in Risk Management and Optimization Stan Uryasev Joint presentation with Sergey Sarykalin, Gaia Serraino and Konstantin Kalinchenko Risk Management and Financial Engineering Lab, University
A Simple Utility Approach to Private Equity Sales
 The Journal of Entrepreneurial Finance Volume 8 Issue 1 Spring 2003 Article 7 12-2003 A Simple Utility Approach to Private Equity Sales Robert Dubil San Jose State University Follow this and additional
ATTILIO MEUCCI Advanced Risk and Portfolio Management The Only Heavily Quantitative, Omni-Comprehensive, Intensive Buy-Side Bootcamp
 ATTILIO MEUCCI Advanced Risk and Portfolio Management The Only Heavily Quantitative, Omni-Comprehensive, Intensive Buy-Side Bootcamp August 16-21, 2010, Baruch College, 55 Lexington Avenue, New York www.baruch.cuny.edu/arpm
Worst-Case Value-at-Risk of Derivative Portfolios
 Worst-Case Value-at-Risk of Derivative Portfolios Steve Zymler Berç Rustem Daniel Kuhn Department of Computing Imperial College London Thalesians Seminar Series, November 2009 Risk Management is a Hot
SDMR Finance (2) Olivier Brandouy. University of Paris 1, Panthéon-Sorbonne, IAE (Sorbonne Graduate Business School)
 Olivier Brandouy. University of Paris 1, Panthéon-Sorbonne, IAE (Sorbonne Graduate Business School)") SDMR Finance (2) Olivier Brandouy University of Paris 1, Panthéon-Sorbonne, IAE (Sorbonne Graduate Business School) Outline 1 Formal Approach to QAM : concepts and notations 2 3 Portfolio risk and return
SDMR Finance (2) Olivier Brandouy University of Paris 1, Panthéon-Sorbonne, IAE (Sorbonne Graduate Business School) Outline 1 Formal Approach to QAM : concepts and notations 2 3 Portfolio risk and return
EC316a: Advanced Scientific Computation, Fall Discrete time, continuous state dynamic models: solution methods
 EC316a: Advanced Scientific Computation, Fall 2003 Notes Section 4 Discrete time, continuous state dynamic models: solution methods We consider now solution methods for discrete time models in which decisions
2.1 Mathematical Basis: Risk-Neutral Pricing
 Chapter Monte-Carlo Simulation.1 Mathematical Basis: Risk-Neutral Pricing Suppose that F T is the payoff at T for a European-type derivative f. Then the price at times t before T is given by f t = e r(t
Lecture 2: Fundamentals of meanvariance
 Lecture 2: Fundamentals of meanvariance analysis Prof. Massimo Guidolin Portfolio Management Second Term 2018 Outline and objectives Mean-variance and efficient frontiers: logical meaning o Guidolin-Pedio,
The Case for TD Low Volatility Equities
 The Case for TD Low Volatility Equities By: Jean Masson, Ph.D., Managing Director April 05 Most investors like generating returns but dislike taking risks, which leads to a natural assumption that competition
Robust Portfolio Optimization Using a Simple Factor Model
 Robust Portfolio Optimization Using a Simple Factor Model Chris Bemis, Xueying Hu, Weihua Lin, Somayes Moazeni, Li Wang, Ting Wang, Jingyan Zhang Abstract In this paper we examine the performance of a
Executive Summary: A CVaR Scenario-based Framework For Minimizing Downside Risk In Multi-Asset Class Portfolios
 Executive Summary: A CVaR Scenario-based Framework For Minimizing Downside Risk In Multi-Asset Class Portfolios Axioma, Inc. by Kartik Sivaramakrishnan, PhD, and Robert Stamicar, PhD August 2016 In this
Algorithmic Trading Session 12 Performance Analysis III Trade Frequency and Optimal Leverage. Oliver Steinki, CFA, FRM
 Algorithmic Trading Session 12 Performance Analysis III Trade Frequency and Optimal Leverage Oliver Steinki, CFA, FRM Outline Introduction Trade Frequency Optimal Leverage Summary and Questions Sources
Introduction to Risk Parity and Budgeting
 Chapman & Hall/CRC FINANCIAL MATHEMATICS SERIES Introduction to Risk Parity and Budgeting Thierry Roncalli CRC Press Taylor &. Francis Group Boca Raton London New York CRC Press is an imprint of the Taylor
Modelling Returns: the CER and the CAPM
 Modelling Returns: the CER and the CAPM Carlo Favero Favero () Modelling Returns: the CER and the CAPM 1 / 20 Econometric Modelling of Financial Returns Financial data are mostly observational data: they
1.1 Interest rates Time value of money
 Lecture 1 Pre- Derivatives Basics Stocks and bonds are referred to as underlying basic assets in financial markets. Nowadays, more and more derivatives are constructed and traded whose payoffs depend on
Modeling Portfolios that Contain Risky Assets Risk and Reward II: Markowitz Portfolios
 Modeling Portfolios that Contain Risky Assets Risk and Reward II: Markowitz Portfolios C. David Levermore University of Maryland, College Park Math 420: Mathematical Modeling February 4, 2013 version c
Comparison of Estimation For Conditional Value at Risk
 -1- University of Piraeus Department of Banking and Financial Management Postgraduate Program in Banking and Financial Management Comparison of Estimation For Conditional Value at Risk Georgantza Georgia
MS-E2114 Investment Science Lecture 5: Mean-variance portfolio theory
 MS-E2114 Investment Science Lecture 5: Mean-variance portfolio theory A. Salo, T. Seeve Systems Analysis Laboratory Department of System Analysis and Mathematics Aalto University, School of Science Overview