Track n Trade Indicator Cheat Sheet
|
|
|
- Maude Watkins
- 6 years ago
- Views:
Transcription

1 Track n Trade Indicator Cheat Sheet
2

3 Percent Bollinger Bands (%B) Bollinger Bands are calculated as a simple moving average shifted up and down by a number of standard deviations. Percent Bollinger Bands relate the underlying price of an instrument to the range of these Bollinger Bands. This gives the user an adaptive measure of volatility which can be used in the same way as other momentum indicators. Buy when the indicator bottoms below 0.00 and turns up, and sell when the indicator peaks above and turns down. You can also use the indicator by looking for divergence between the indicator and the charts. Sharp price advances and declines usually accompany market tops and bottoms, and as a market climbs or falls toward a bottom, the indicator will tend to initially follow the price trend and then fall off, leading to bullish or bearish divergences with the chart. Buy Sell Signals A buy signal occurs when %B value crosses from below the 0 line to above the 0 line. A sell signal occurs when %B value crosses from above the 0 line to below the 0 line. Example of the %B:

4 Bollinger Bandwidth (BW) Bollinger Bands measure volatility by placing bands on either side of a moving average. These bands are charted two standard deviations away from the average. As the average changes, the values of the two standard deviations also change. The Bollinger Bandwidth, developed by John Bollinger, represents the expanding and contracting of the bands based on recent volatility. During a period of rising price volatility, the distance between the two bands will widen (BB Width will increase). Conversely, during a period of low market volatility, the distance between the two bands will contract (BW will decrease). The tendency is for the bands to alternate between expansion and contraction. When the bands are unusually far apart, it is often a sign that the current trend may be ending. When the distance between the two bands has narrowed, it is often a sign that a market may be about to begin a new trend. The BW gives an indication of how wide the Bollinger Bands are as a function of the middle band. It is used to identify the squeeze at low values and the end of trends at high values. Calculation The calculation of the BW is here: Bollinger Bandwidth = [Top Bollinger Band (x periods)] - [Bottom Bollinger Band (x periods)] / Simple Moving Average Close (x periods) Example of the BW:

5 Chaikin Money Flow (CMF) The Chaikin Money Flow Indicator is an oscillator developed by Marc Chaikin. An oscillator is an indicator that is used as a counter trend showing when the market is overbought or oversold. These indicators are momentum based. The CMF is based largely on the Accumulation Distribution Line; it compares the close value with the high and the low for that same day. By comparing the close to the high and low, the CMF is determining if the market has pressure to sell or buy. In doing this, the CMF is giving an indication of overbought and oversold by using these comparisons. If the market is consistently closing in the top region of the price bar and there is an increase in volume (showing an increase in the number of trades) then CMF exhibits a positive value. If the market is consistently closing in the bottom region of the price bar and there s an increase in volume, CMF exhibits a negative value. When the CMF indicator crosses the zero line either up or down, this is an indication of a change in trend. Traders use this indicator to help confirm breakout signals from either support or resistance trend lines. Calculation The calculation of the CMF is here: CMF = SUM(AD, n) / SUM(VOL, n) where n = Period AD = VOL x (CL - OP) / (HI - LO) AD stands for Accumulation Distribution Buy/Sell Signals A buy signal occurs when the CMF value crosses from below the 0 line to above the 0 line. A sell signal occurs when the CMF value crosses from above the 0 line to below the 0 line. Example of the CMF:

6 Know Sure Thing (KST) The Know Sure Thing (KST) Indicator is an oscillator developed by Martin J. Ping that gives bullish and bearish momentum signals. The difference between this indicator and other oscillators is that it takes into consideration four time periods instead of only one. Each time period is smoothed using a moving average. Also, each time period is weighted differently depending on length, so a longer time period would have greater weight. Because of the consideration of the various time periods, the KST is able to react quicker to price moves. Watch for bullish and bearish momentum signals in the KST indicator. When the KST turns upward, this is a bullish signal, and when the KST turns down, this is a bearish signal. More confirmation is given when the trigger line crosses the KST line as a result of the change in direction. There are two lines: the trigger line and the KST line. The KST line is a result of the four moving averages smoothed as well as the Rate of Change or ROC. The trigger line is a moving average of the KST. Buy/Sell Signals A buy signal occurs when the KST line is below the 0 line and crosses from below the trigger line to above the trigger line. A sell signal occurs when the KST line above the 0 line and crosses from above the trigger line to below the trigger line. Example of the KST:

7 Money Flow Index (MFI) The MFI is a momentum based indicator, similar to the RSI, %R, and CCI. The MFI incorporates a more rigid calculation, giving the tell tale signs of a more rigid line and a better indication of money flowing in or out of any given security. The theory says that as money flows into the equity, or volume increases, the MFI will increase its rate of climb. As money flows out of the equity, volume decreases, and the MFI will decrease its rate of climb. The MFI is a classic overbought/oversold indicator based on a scale. When the MFI reaches up above the top threshold, which is traditionally set at 75-80%, the equity is considered overbought and a retracement is anticipated. When the MFI line reaches below the 20-25% threshold, the underlying equity is considered oversold and a reversal is anticipated once again. Calculation The calculation of MFI is here: Money Flow = (Typical Price) x (Volume) Buy/Sell Signals A buy signal occurs when the MFI line crosses from below the lower threshold to above the lower threshold. A sell signal occurs when the MFI line crosses from above the upper threshold to below the upper threshold. Example of the MFI: 2 Period: Specify the number of days to be used in calculating the MFI.

8 On Balance Volume (OBV) The OBV indicator adds a period volume when the close is up and then subtracts the period s volume when the indicator closes down. An accumulated volume total forms the OBV line. When comparing this calculated price line, with the underlying security, we look for areas of convergence and divergence to confirm our market s directional movement. The concept behind the OBV is that changes will be reflected in the OBV prior to the markets change. A rise in volume is meant to indicate a rise in money inflows to the security. Once the public continues to add money, the price of the equity should continue to rise. Directional movement in the indicator gives foresight into the market direction. A rise in the OBV indicator gives the trader the indication that markets are on the rise; a dropping OBV is an indication of a weakening market and lower prices are soon to follow. When market divergence is seen within the OBV indicator, one must take heed that the market is either weakening in a bullish trend, or strengthening in a bearish trend, and a market reversal is about to occur. The actual calculated value of the line itself is of little use, but the visual movement of the line is what s important to the trader. An inclining line is the indication of a strengthening market, and a declining line is representative of declining market strength. Example of the OBV:

9 Percent Price Oscillator (PPO) The PPO indicator shows the relationship between two moving averages. The PPO indicator is a modification of the highly regarded and effective MACD indicator. This enhancement provides us the ability to receive the differences between the two moving averages as a percentage. This allows the trader to easily compare stocks with different prices. For example, a PPO result of 20 means that the short term average is 20% above the long term average. Calculation To calculate the PPO, subtract the 26-day exponential moving average (EMA) from the nine-day EMA and divide this difference by the 26-day EMA. The end result is a percentage that tells the trader where the short-term average is relative to the longer-term average. PPO = (Fast_EMA - Slow_EMA) / Fast_EMA Additionally, the PPO histogram can be calculated by using the MA of a PPO itself: PPO_Histogram = PPO - EMA_PPO Buy/Sell Signals A buy signal occurs when the PPO line crosses from below the trigger line to above the trigger line. A sell signal occurs when the PPO line crosses from above the trigger line to below the trigger line.
10 Price Volume Oscillator (PVO) The PVO is primarily used to identify periods of expanding or contracting volume. Centerline Crossovers: The PVO oscillates above and below the zero line. A PVO above zero indicates that volume levels are generally above average and relatively heavy. When the PVO is below zero, volume levels are generally below average and light. When PVO is positive, the shorter EMA of volume is greater than the longer EMA of volume. When PVO is negative, the shorter EMA of volume is less than the longer EMA of volume. Directional Movement: The general overall direction of the PVO gives the trader a visual of market momentum and direction. A rising PVO signals volume levels are increasing, and a falling PVO signals volume levels are decreasing. Moving Average Crossovers: The last variable in the PVO forms the signal line. For example, PVO (12,26,9) would include a 9-day EMA of PVO as well as a histogram representing the difference between the PVO and its 9-day EMA. When PVO moves above its signal line, volume levels are generally increasing. When PVO moves below its signal line, volume levels are generally decreasing. Movements in the PVO are completely separate from price movements. Movements in PVO can correlate with price movements to assess the degree of buying or selling pressure. Calculation The calculation of PVO is here: Volume Oscillator (%) - PVO = [(Vol 12-day EMA - Vol 26-day EMA)/Vol 12-day EMA] x 100 Increasing and decreasing the exponential moving average variables changes the PVO to reflect a longer or shorter trading time period. The absolute values of the PVO indicator are not as important as the crossovers of the moving averages as well as a crossover above or below the zero line. There are three additional methods on the next page of acquiring market strength and weakness information from the PVO. When the PVO crosses above the zero line, volume is increasing and an increase in price is anticipated. When the PVO crosses below the zero line, volume is decreasing and a decrease in price and a weakening market are anticipated. Simple directional movement can be one of the greatest strengths of the PVO indicator. When the line is ascending, volume is increasing, so therefore markets should increase. When the line is descending, volume is decreasing, therefore the market should weaken and decrease.

11 Buy/Sell Signals A buy signal occurs when the PVO line crosses from below the trigger line to above the trigger line. A sell signal occurs when the PVO line crosses from above the trigger line to below the trigger line. Example of the PVO: 1

12 Rate of Change (ROC) The ROC indicator is used to help a trader determine the rate at which a market is either increasing or decreasing in strength or weakness. A rising rate of change indicates an advancing market, while a decreasing rate of change indicates a declining market. As the rate of change line approaches the centerline, the rate of change is considered to be in equilibrium. This is somewhat of a misnomer, since the ROC is on a relative scale and scales against historical rates. What is equilibrium today will not be the equilibrium line down the road, and what is not equilibrium today will appear to be so from a historical point of view. Comparing the ROC s of different time-spans improves the accuracy of the analysis. A 12 month period is usually the most reliable for long-term trends, and a 3 or 6 month period works well for intermediate trends. A 10 or 12-day ROC is a good short-term indicator, oscillating in a fairly regular cycle. The lower the ROC, the more undersold the market and the more likely a recovery. Although the opposite may hold true in that the higher the ROC, the more overbought the market, both extremes can indicate the formation of a sideways channel. Calculations The calculation for the ROC is here: ROC = 100 x (Today s close - Close 10 periods ago) / (Close 10 periods ago)

13 Stochastic Relative Strength Index (SRSI) The Stochastics indicator is an oscillator that compares a securities closing price in relationship to its price range over a given period of time. The RSI indicator is also an oscillator which represents the internal strength of the equities price. Both these indicators work on an overbought and oversold formula. The Stochastics RSI is a combination of these two indicators, where the %K within the Stochastics formula is replaced by the RSI. The formula is then set on a 0 to 100 scale for both the Stochastics indicator as well as the RSI is read in much the same manner as the traditional RSI. When the SRSI reaches up into the upper region above the upper threshold line, the market is considered overbought and anticipate a reversal of the trend. When the SRSI reaches down into the lower region below the lower threshold, the market is considered oversold and a reversal is anticipated. Traditionally, the upper threshold marker is set at 70% and the lower marker is set at 30%. Calculation The calculation for the SRSI is here: StochRSI = (RSI - LowRSIn) / (HighRSIn - LowRSIn) RSI: The current level of the RSI indicator. LowRSIn: The lowest level the RSI reached over the last n periods. HighRSIn: The highest level the RSI reached over the last n periods. Buy/Sell Signals A buy signal occurs when the SRSI line crosses from below the lower threshold to above the lower threshold into the channel. A sell signal occurs when the SRSI line crosses from above the upper threshold to below the upper threshold into the channel. Example of the SRSI:

14 Triple Exponential Average (TRIX) The TRIX indicator is a momentum indicator designed to calculate the percent rate of change of a triple exponentially smoothed moving average. It is very similar in the way the MACD indicator works. Both indicators provide basically the same methodology behind generating market momentum and directional movement. TRIX was designed to filter out the minor, less significant moves within a market trend. This is done, just as other traditional indicators have done in the past, by utilizing multiple moving averages. Convergence and Divergence are common uses of the TRIX indicator. Adding the trigger line crossover provides the trader with a Buy/Sell Signal generated from the crossing of the two moving averages. Calculation To calculate TRIX, first pick a period with which to create an exponential moving average of the closing prices. For a 15-day period the calculations would look like this: Calculate the 15-day exponential moving average of the closing price. Calculate the 15-day exponential moving average of the moving average calculated in step #1. Calculate the 15-day exponential moving average of the moving average calculated in step #2. The result is triple exponentially smoothing the moving average of closing prices, greatly reducing volatility. Finally, calculate the 1-day percent change of the moving average calculated in step #3. Buy/Sell Signals A buy signal occurs when the TRIX value crosses from below the trigger line to above the trigger line. A sell signal occurs when the TRIX value crosses from above the trigger line to below the trigger line. Example of the TRIX:
15 Ultimate Oscillator (ULT) This is another indicator introduced by Mr. Larry Williams. It seems to be another modification of the RSI indicator, as is his %R indicator. If you lay the three indicators on your chart, you ll see many similarities. The advantage of the ULT indicator is that the trader is given two additional variables in the formula to modify and finetune the action and reaction to the market price. This indicator, as with the RSI indicator, works on an overbought and oversold region. Mr. Williams states that the upper threshold should start at 70% and the lower threshold at 30%, but depending on the market, the volatility, and the settings, you may need to adjust the thresholds to either higher or lower settings to obtain signals. Once the ULT line crosses above the upper threshold into the overbought region, it is time to anticipate a reversal in price and lower prices to ensue. When the ULT line crosses below the lower threshold, it is time to anticipate a reversal in price and anticipate prices to rise once again. Many traders like to use a 50% line to reconfirm price action. Crossing the 50% line is a confirmation of the overall trend. Calculation The True Low (TL) is the lower of today s low or yesterday s close. Calculate today s Buying Pressure (BP) like this: BP = Today s close - Today s TL Calculate today s True Range (TR) by finding the largest outcome of one of the following equations: TR = Today s High - Today s Low Today s High - Yesterday s Close Today s Close - Today s Low Calculate BPSum1, BPSum2, and BPSum3 by adding up all of the BPs for each of the three specified time frames. Calculate TRSum1, TRSum2, and TRSum3 the same way with the TR s. The Raw Ultimate Oscillator (RawUO) is calculated here: RawUO = 4 x (BPSum1 / TRSum1) + 2 x (BPSum2 / TRSum2) + (BPSum3 / TRSum3) The Final Ultimate Oscillator is calculated here: FUO = [ RawUO / ( ) ] x 100

16 Buy/Sell Signals A buy signal occurs when the ULT line crosses from below the lower threshold to above the lower threshold. A sell signal occurs when the ULT line crosses from above the upper threshold to below the upper threshold. Example of the ULT:
17 Alligator A unique use of fractal geometry and nonlinear dynamics is used to create the method of calculations for the Alligator Indicator. Used in combination with the Gator Indicator, the Alligator has proved to be effective at pinpointing large market trends. Components Alligator s Jaw (blue line): The Balance Line for the timeframe that was used to build the chart (13 period Smoothed Moving Average, moved into the future by 8 bars). Alligator s Teeth (red line): The Balance Line for the value timeframe of one level lower (8 period Smoothed Moving Average, moved by 5 bars into the future). Alligator s Lips (green line): The Balance Line for the value timeframe, one more level lower (5 period Smoothed Moving Average, moved by 3 bars into the future). The Lips, Teeth, and Jaw of the Alligator show the interaction of different time periods. As clear trends can be seen only 15 to 30 percent of the time, it is essential to follow them and refrain from working on markets that fluctuate only within certain price periods. When the Jaw, Teeth and Lips are closed or intertwined, the Alligator is going to sleep or is asleep already. As it sleeps, it gets hungrier and hungrier: the longer it sleeps, the hungrier it will be when it wakes up. The first thing it does after it wakes up is to open its mouth and yawn. Then the smell of food comes to its nostrils: flesh of a bull or flesh of a bear, and the Alligator starts to hunt it. Having eaten enough to feel quite full, the Alligator starts to lose interest in the food/price (Balance Lines join together), and this is the time to fix the profit.
18 Donchian Channels (DON) Donchian Channels were created by Richard Donchian, an expert in trends. The DON is a simple trend breakout system. The channel works well in trending markets, but not as well in sideways moving markets. Donchian Channels measure volatility by placing bands at a specified period deviation. These bands are charted two standard deviations from the market price. As the market price changes, the value of two standard deviations also changes. This value is what comprises the Donchian Channel s band width, representing the expanding and contracting of the bands based on recent price volatility. Calculation The calculation of the DON is here: Donchian Channel High = MAX (HI, n) Donchian Channel Low = MAX (LO, n) Example of Donchian Channels:

19 Keltner Bands Kelter Bands were developed by Chester Keltner and Modified by Linda Raschke. They are traditional moving average envelopes based on Exponential Moving Averages. The probability is that prices will remain within the channel, as with all band-type indicators. A break above the channel is an anticipation of higher prices. When prices close below the lower band, we anticipate lower prices. The middle line (20 period EMA) in a rising market should provide support. In a falling market, the middle line should provide resistance. Keltner Bands, as with any moving average indicator, seem to work great in strongly tending markets, but not so well in sideways markets. Just like all trend-following systems, the Keltner Bands are not meant to spot tops or bottoms. Use the Keltner Bands in conjunction with other indicators such as RSI or MACD. Using it in combination with either of these will help provide verification of the strength of a market. Example of Keltner Bands:
20 Calculation The calculation for the top, or Plus Band, is here: 2 (ATR over 10 periods) + (20 period exponential moving average) The calculation for the bottom, or Minus Band, is here: 2 (ATR over 10 periods) - (20 period exponential moving average)
21 Parabolic Stop and Reversal (PSAR) The Parabolic SAR, developed by Welles Wilder, creator of RSI and DMI, sets trailing price stops for either long or short positions. Also referred to as the stop-and-reversal indicator, Parabolic SAR is more popular for setting stops than for establishing direction or trend. Wilder recommended establishing the trend first, and then trading with Parabolic SAR in the direction of the trend. If the trend is up, but the underlying price drops back below the trailing PSAR indicator, then sell or liquidate your long position. If the trend is down, and the underlying price rises above the trailing PSAR indicator then buy or liquidate your short position. Calculation Once the market establishes a direction, the initial SAR becomes the extreme price for the two intervals. The extreme price is either the lowest price or highest price for the two trading intervals. The short position uses the high, and the long position uses the low. The calculation for the PSAR is here: SARt = SARt-1 + [ a x ( EPtrade - SARt-1) ] SARt: The stop and reverse price for the current interval. SARt-1: The stop and reverse price for the previous interval. a: The acceleration factor. EPtrade: The extreme price for the trade. The SAR is always the stop and reverse price point. This is the point you would want to liquidate your current position and establish the opposite position. The acceleration factor, a, is a weighting factor. In Wilder s work, the initial value for the acceleration factor is.02. The acceleration factor increases by a value of.02 each time the extreme price changes for the trade. You do not increment the acceleration factor if the extreme price fails to change. The value for a, the acceleration factor, never exceeds.20 in Wilder s methodology. The extreme price (EP) for the trade is the highest or lowest price achieved during the trade. If you have a long position, use the new highs as the extreme price. When you have a short position, use the new lows as the extreme price. The extreme price concept allows for normal market corrections without immediately triggering the SAR price. It keeps the SAR price moving in the direction of the market.
22 Example of PSAR:
23 Pivot Points Pivot points used to be referred to as traders numbers because of the popularity of these points amongst floor traders. The theory behind them is that markets tend to have overlap from one period to another. On most days, the daily high or low is within the previous day s range, as with the previous week s extremes, and previous month s extremes. In this sense, pivot points are a counter trend indicator. However, many traders believe that once one point is violated, the next point will be tested, making a violation of these support and resistance levels a clue in trend following. Though we cannot vouch for the truth of this statement, the popularity of pivot points amongst floor traders tends to make these points worth watching. The popularity of these numbers can be seen on any day when the exchanges are cleaned-up. The trading floor is literally piled high with folded pieces of paper that contain pivot points calculated on them. The uses of pivot points varies greatly by trader. The most common function of the daily pivot is as a guide. If prices are trading above the pivot point, then the trend is considered up. Traders may wish to take short-term positions on a violation of the daily pivot to the upside with an initial upside objective of the first resistance level. If prices stall or slow at the first resistance level, then aggressive traders may wish to take profits. However, if the first Resistance level is violated to the upside, then the market should go on to test the second resistance level. If prices have violated the 1st resistance level, then this level should act as support on future pullbacks, as should the pivot point. The opposite is true for support levels. A violation of the daily pivot to the downside indicates that the daily trend is down, with a downside target being the first support level. If the market stalls, then traders may wish to take profits on short positions, or initiate long positions in anticipation of a retracement to the daily pivot. However, if the first support level is violated, the day is said to be a strongly down trending day, and as such should move down further to test the second support level. As with the resistance numbers, the support numbers, once violated, become resistance lines to trade with in the trend. Though originally used as a means for floor trading, longer-term traders can use pivot points for longer periods. Try plotting the weekly pivot points on the daily chart and using it for shorter term positioning on the daily charts. Pivot points can also be calculated using the monthly pivot points on the daily chart, and used for longer-term positions.
24 Example of Pivot Points:
25 Calculation There are several methods used to determine the Pivot Point. We have included the three different formulas in Track n Trade Live. Traditional formulas: Pivot Point = (H + L + C)/3 First Support Line = (2 x Pivot Point) - H First Resistance Line = (2 x Pivot Point) - L Second Support Line = Pivot Point - (H - L) Second Resistance Line = Pivot + (H - L) Variation 1: This method changes the formula used to derive the Pivot Point. The changes include adding the trading day s open and calculating the average of the four values. With this variation, one takes into account both opening gaps and overnight trading. The calculation is here: Pivot Point = (H* + L* + C* + O**) / 4 *=Yesterday **=Today Variation 2: This method changes the formula used to derive the Pivot Point as well. In this method you substitute yesterday s close with today s open. Variation 2 also takes into account opening gaps and overnight trading. The calculation is here: Pivot Point = (H* + L* + O**) / 3

26 10x8 Moving Average Calculation Just as it is easier to ride a bike downhill than uphill, it seems prices fall faster than they rise. Due to this perceived quirk in pricing, the legendary market analyst, author, and seminar speaker, Jake Bernstein, developed the 10x8 moving average system. This system uses two simple moving averages, but they are calculated in a slightly different manner than those traditionally used. The first moving average is a moving average of the daily highs, as opposed to that of the daily settlement. The second moving average is calculated using the daily lows. Though Mr. Bernstein recommends using a 10 period moving average of the daily highs and an 8 period moving average of the daily lows based on his observation that prices tend to fall about 20% faster than they rise, any combination would do the trick. Generally, accepting market lore that prices fall faster than they rise, the moving average of the lows should be of shorter term duration than that of the highs. The most basic use of the 10x8 Moving Average is to look for a breakout above the upper moving average to initiate a buy signal. When the daily settlement price exceeds the average high of the last 10 days, this indicator flashes a buy signal indicating that the trend of the market should be up. Example of a 10x8 MAC:

27 Zig Zag The Zig Zag Indicator acknowledges minimum price changes and ignores those that do not fit the criteria. Calculation A Zig Zag set at 10% with OHLC bars would yield a line that only reverses after a change from high to low of 10% or greater. All movements less than 10% would be ignored. If a commodity traded from a low of 100 to a high of 109, the Zig Zag would not draw a line because the move was less than 10%. If the stock advanced from a low of 100 to a high of 110, then the Zig Zag would draw a line from 100 to 110. If the commodity continued on to a high of 112, this line would be extended to 112 (100 to 112). The Zig Zag would not reverse until the commodity declined 10% or more from its high. From a high of 112, a commodity would have to decline 11.2 points (or to a low of 100.8) for the Zig Zag to reverse and display another line. Example of Zig Zag:


28 Using Indicators Introduction Track n Trade Live includes a total of thirteen indicators in the base application. Eleven of them are displayed in a window below the Chart Window, referred to as the Indicator Window. The other two Overlay Indicators are displayed directly on the chart in the Chart Window. Chart Right-Click Menu Displaying Indicators To display an Indicator, right-click in the Chart Window or Indicator Window then choose the indicator from the menu. Mouse over Add Indicator Window and a list of indicators will appear, as you see in the screenshot above. Select the indicator you want opened. You can open six Indicator Windows at once on one chart, and you can have up to four indicators in each window. When you open a fifth indicator the first indicator opened will automatically be closed. When you open an indicator, an overlay indicator or an indicator in the indicator window, you will see text appear on your chart in the upper left corner. You can choose whether to show this text, and choose where it appears by right-clicking on your chart. The screenshot above will appear. Mouse over On Screen Text to view your options. Indicator QuickLinks Once you have deselected an indicator, to select it again click on the Indicator QuickLink located on the bottom right side of the Indicator Window or Chart Window, as shown in the screenshot below. Once the indicator is selected, you can change settings for that indicator in the Preferences Tab of the Control Panel.

29 Using Indicators Indicator Window Quick Link Right-click on the Indicator QuickLink in the Indicator Window to view the menu seen in the screenshot below. Indicators that are already selected will have a dot by them. To switch to another indicator simply click on it. Select Remove to delete that indicator Window. To add an additional indicator to your Indicator Window, right-click inside the Indicator Window and select another indicator. Chart Window QuickLink Right-click on the Indicator QuickLink in the Chart Window to view the menu seen in the screenshot below. To open an additional indicator, right-click and choose the indicator from the menu. The indicators that are currently open will have a check mark by them. To remove an indicator from your chart, simply click on the indicator again. (A list of all indicators and their abbreviations are available at the end of this section). Indicator Window QuickLink Right-Click Menu Chart Window QuickLink Right-Click Menu Using Indicators Williams Percent R (%R) Larry Williams originally used a ten-day period and plotted where the current price was compared to that period. He used it to measure conditions of overbought and oversold; the overbought region is the area below 20% and the oversold region is the area above 80%. With the ability to invert the values it can be looked at in the same manner as other overbought/ oversold indicators. (Note: We will use the traditional method, not the inverted, in our Track n Trade Live
30 discussions.) Choosing the time period which the indicator looks at the interval is crucial to finding the optimal sensitivity. Interpretation Williams s basic rule is simple. When the %R is initally lower than 20% and then becomes greater than 20% it is interpreted as a buy signal. Conversely, when the %R is initally higher than 80% and then becomes lower than 80% a sell signal is activated. Changing the sensitivity of the indicator to work for you is essential to making the study a better tool. The longer the period for the %R, the less sensitive it will be. The indicator will move less but will be more smoothed. A number of technical traders use a value that is less volatile, or in other words, a larger value. Many traders find it better to use a strategy where the market leaves the areas of overbought/oversold before entering a trade position. In either case, using solid exit strategies is important with this indicator. Calculation Parameters Period (10) - The number of price bars, or the interval, used to calculate the study. Formula: You must first determine the highest high and lowest low for the length of the interval. This is the trading range for the specified interval. The general formula for the %R is as follows: %Rt = ( (Highn - Closet) / (Highn - Lown) ) * -100 %Rt: The percent of the range for the current period. Highn: The highest price during the past n trading periods. Closet: The closing price for the current period. Lown: The lowest price during the past n trading periods. n: The length of the interval. Example: Assume the market is Treasury Bills. The high for the past ten trading intervals is 9275, and the low is The closing price in the current period is If you substitute those values in the equation, this is what you get: %R = ( ( ) / ( ) ) * 100 = (8 / 150) * 100 = 5.33 Updated Formula: %Rt = ( (Closet - Lown) / (Highn - Lown) ) * -100

31 Buy/Sell Signal Buy Signal happens when: %R value today is greater than the Threshold 2 and yesterdays %R value is less than or equal to Threshold 2. Sell Signal happens when: %R value today is less than the Threshold 1 and yesterdays %R value is greater than or equal to Threshold 1. Example of the %R:.
32 William Accumulation/Distribution (AD) Larry Williams created this indicator in an attempt to measure market pressures. It specifically looks for a difference in price and then measures that difference. It is a tool used to measure market sentiment and strength. The key is to look for strong differences in what the market does as opposed to what the indicator does. Looking for substantial divergence from the AD index versus the underlying chart is the key to future price direction. Interpretation The indicator is computed by taking the previous day s close and comparing it to the current day s close. If the close of today was higher, then the low for the period is subtracted from the current day s close and added to the current AD. A pattern of higher highs would show a consistently increasing AD. If the close of today is the same as yesterday then there is no change in the AD. If the close of today is lower than yesterday s low, the close of today is subtracted from the high for the current period and that difference is subtracted from the AD. The main thing to look for is a difference in the AD and the market trend. If a market were to make a matching or lower low, or a matching or higher high, and the AD fails to follow the market trend then this is divergence. Divergence implies that a reversal in the dominant trend may be near. A series of lower lows would read as a decreasing AD. The pattern created by the AD and the differences in the chart are what the trader looks for. Divergence, or a difference from the pattern, is what you want to see. For example, if the market continues to march to higher territory and the AD follows by doing the same, then there is no divergence. However, if the market makes several new highs but the AD fails to make new highs, it is a warning signal of a market about to reverse direction. Calculation Formula: The AD index is computed several different ways. Some computations normalize the index, while others add extra smoothing factors through the use of moving averages The first comparison checks for accumulation (i.e. Is the current close higher than the previous close?). If the market is accumulating, then compute the difference between current close and low. Next, add that arithmetic difference to the Accumulation/Distribution Index. Traders perceive an undervalued market and they buy. The procedure is: If Closet > Closet-1 then ADt = ADt-1 + (Closet - Lowt)

33 The second comparison checks for no change in price. If correct, the AD index does not change. It states: If Closet = Closet-1 then ADt = ADt-1 The last and final comparison checks for a down market. It checks for the current close below previous close. If that s correct, the market is distributing. The software first computes the difference between current high and close. It then subtracts that difference from the AD index, which measures market distribution. Traders perceive an overvalued market and are selling. The final computation is: If Closet < Closet-1 then ADt = ADt-1 - (Hight - Closet) ADt: The accumulation/distribution index for the current period. ADt-1: The accumulation/distribution index for the previous period. Closet: The closing price for the current interval. Closet-1: The closing price for the previous interval. Hight: The true high price for the current interval. Lowt: The true low price for the current interval. Note: The true high is the higher value of the current high or the previous close. The true low is the lower value of the current low or the previous close. Buy/Sell Signals Buy Signal happens when: AD value today is greater than today s ADMA and yesterdays AD value is less than or equal to yesterdays ADMA. Sell Signal happens when: AD value today is less than today s ADMA and yesterdays AD value is greater than or equal to yesterdays ADMA. Example of the Williams AD:
34 Commodity Channel Index (CCI) The Commodity Channel Index (CCI) is designed to detect beginning and ending market trends. The formula standardizes market prices so that the trader can spot deviations from the market s trend more easily. Proponents of this indicator say that 70% to 80% of all price fluctuations fall within +100 and -100 as measured by the index. This is akin to technical lore that most of the time, markets trade in a sideways trend, or channels. However, when the indicator moves out of this range, it is said that a trend is underway. The calculation for CCI measures the average daily price s distance from a moving average of average daily prices. The trading rules for the CCI are as follows: Establish a long position when the CCI exceeds Liquidate when the index drops below For a short position, you use the -100 value as your reference point. Any value less than -100 suggests a short position, while a rise above -100 tells you to liquidate your short position. Interpretation Generally, followers of the CCI look to establish long positions when the CCI exceeds the +100 level, indicating that prices are in a strong up trend. Generally, most users of this indicator also try to look for patterns within the indicator, such as higher highs, and also look for CCI movements to be confirmed by general price readings as well. Standard interpretation calls for long positions, once initiated on the upward exceeding of the +100 level, to be held until the CCI falls back below +85, at which time positions are exited as the market has stopped trending upward. Short positions are generally established when the CCI goes lower than -100, indicating that prices are in a strong down trend. Like long positions, most users of this indicator try to watch out for patterns within the CCI itself to confirm the downward trend, and also look for confirmation from lower prices on the chart itself. Once a short position is established, the original interpretation of this indicator calls for holding the position until the index climbs above -85 to the upside, at which time short positions should be covered. The purpose of the CCI index is to try to keep you out of the market during consolidation, or weak trending periods. By measuring the difference average prices versus the mean average prices, this indicator attempts to isolate only strongly trending markets, similar to momentum and MACD. In the Track n Trade Live CCI preferences you can set up thresholds at -100 and +100 or -85 and +85, depending on your desired trading.
35 Calculation Parameters: Period (20) - the number of bars, or period, used to calculate the study. Formula: The proper calculation of the CCI requires several steps. They are listed in the proper sequence below. You must first compute the typical price, using the high, low and close for the interval. It is the simple arithmetic average of the three values: TP = (Hight + Lowt + Closet) / 3 TPt: Represents the typical price. Hight: The highest price for this interval. Lowt: The lowest price for this interval. Closet: The closing price for this interval. Next, you calculate a simple moving average of the typical price for the number of periods specified: TPAVGt = (TP1 + TP TPn) / n TPAVGt: The moving average of the typical price. TPn: The typical price for the nth interval. N: Number of intervals for the average. The next step is rather complex; it computes the mean deviation. The formula is: MDt = ( TPAVG1 - TP TPAVG1 - TPn ) / n MDT: The mean deviation for this interval. TPn: The typical price for the nth interval. N: Number of intervals. Note: The symbol designates absolute value. In mathematical terms, negative differences are treated as positive values. Now, the computation for the final CCI value is: CCIt = (TPt - TPAVGt) / (.015 * MDT)

36 CCIt: The Commodity Channel Index for the current period. TPt: The typical price for the current period. TPAVGt: The moving average of the typical price..015: A constant. MDT: The mean deviation for this period. Buy/Sell Signals Buy Signal happens when: If we draw the CCI as a histogram: CCI value today is greater than 0 and yesterday s CCI value is less than or equal to 0. If we draw the CCI as a line: CCI value today is greater than the threshold 2 and the CCI value yesterday is less than or equal to the threshold 2. Sell Signal happens when: If we draw the CCI as a histogram: CCI value today is less than 0 and yesterday s CCI value is greater than or equal to 0. If we draw the CCI as a line: CCI value today is less than the threshold 1 and the CCI value yesterday is greater than or equal to the threshold 1. Example of the CCI:
37 Directional Movement Index (DMI) Wilder s DMI is similar to the historic volatility indicator in that it shows the market tendencies. The main use of this tool is to show the strength of a trend. This could direct the trader to use a trend following system or a counter trend system in their trading. It also indicates possible price reversals. The Directional Moving Index is plotted as three lines on a scale of 0 to 100. This scale is a measure of market trend. The two lines of DMI show the amount of positive and negative movement. The positive line is called D+ and the negative D-. The direction of these lines and the use of crossovers can show the changes in the current market. The key to this indicator is the ADX, or average of the difference of these two lines. The ADX is the main factor in using this indicator. During periods of extreme price variation the two lines can become very volatile; the ADX is used to compensate for this. Interpretation The best application of DMI is present when used with another indicator. DMI should either confirm or contradict the indicator being used. It is also best to use DMI in long-term trade situations. Because the study is not as sensitive as other indicators, it is appropriate to use it as a confirmation tool. When the DMI is advancing, the average is higher on the 0 to 100 scale, and trend following systems are best employed. Likewise, with a decreasing DMI average, the line is lower on the scale closer to 0, so a counter trend system might be best. These traits represent the fact that as the average line goes higher in the scale, the strength of the trend is gaining, and as the ADX goes lower the trend is losing strength. It is also important to look at the individual lines for changes in price movement. The other application for DMI is to look at the D+ and D- lines themselves. When the D+ line crosses above the D- line a buy signal is initiated. This indicates that the positive price direction is greater than the negative. Conversely, once the D+ line crosses below the D- line, a sell trigger is present. The negative price movement is overtaking the positive. Welles Wilder was not comfortable using these two lines by themselves. So, when looking at reversals the ADX should be above both lines, and once it turns lower we should see a change in market direction. You should also look to ADX for confirmation. This application is much the same as momentum, showing a change in the market sentiment. Wilder also said that a trend following system should not be used when the ADX line is below both D lines, as this means that the market has no discernible direction. When using the D+ and D- crossover method, Wilder stressed the use of an extreme point. On the day the crossover occurs, the extreme point is the high or low of the day (high for a buy, and low for a sell). The market should be able to take out that price and stay beyond it for several days before the trade is initiated or exited. This use of extreme points should keep the trader from getting into whipsaws or false breakouts.
38 Calculation Parameters: Period (14) - the number of bars, or interval, used to calculate the study. Show/Hide +DI (1) - this parameter is used to show or hide the +DI line. 0=hide, 1=show. Show/Hide -DI (1) - this parameter is used to show or hide the -DI line. 0=hide, 1=show. Show/Hide ADX (1) - this parameter is used to show or hide the ADX line. 0=hide, 1=show. Computations: The computations needed to generate the final figures for the DMI are not complex but are numerous and lengthy. The following discussion attempts to unravel the computational mysteries of the DMI. If you need further explanation, please refer to the author s original work. The book titled New Concepts in Technical Trading Systems by J. Welles Wilder, Jr. explains this indicator and several others. You must first compute the directional movement, DM, for the current trading interval. Directional movement can be up, down, or zero. If directional movement is up, it is labeled as +DM. The expression -DM refers to downward directional movement. Wilder defines directional movement as the largest part of the current trading range that is outside the previous trading range. From a mathematical view, it is the largest value of the following differences: Hight - Hight-1 or Lowt - Lowt-1 This is only true when the current low is less than the previous low, or the current high exceeds the previous high. Please note that both of these conditions do not have to be met, only one. It is the largest portion of the trading range outside of the previous trading range. It is possible for the directional movement to be zero. This occurs when the current trading range is inside the previous trading range, or the trading ranges, current versus previous, are equal. Directional movement is up, or positive, when the difference between the highs is the greatest. It is down, or negative, when the difference between the lows is the largest value. Thus, the up directional movement is +DM, and down directional movement is -DM. Do not let the plus and minus sign designation mislead you. They only indicate upward or downward movement, not values. The directional movement value is always a positive number, or absolute value, regardless of upward or downward movement. This concept is crucial to understanding the computations for the indicator. If you are confused or do not understand, draw some illustrations or work with actual price data to determine the directional movement values.
39 The next step in determining the DMI is to compute the true range. According to the Wilder, the true range is the largest value of the following equations: Hight - Lowt Hight - Closet-1 Lowt - Closet-1 The true range is always a positive number. From this point forward, all references to the true range are designated as TR. Continue this process for the specified trading interval. In this example, use a value of 14. This is the same value Wilder used on daily data. His logic for using this value is that it represents an average half-cycle period. When this task is accomplished for the specified interval, you compute the average value of the +DM, -DM and TR. Wilder prefers to use an accumulation technique rather than computing a pure moving average. It was actually a short cut designed to save computational time and effort. That technique is as follows: Averaget = (Averaget-1 - (Averaget-1 / n)) + Valuet Thus, when you substitute the above symbols, you have: +DMt = (+DMt-1 - (+DMt-1 / n)) + (+DMt) -DMt = (-DMt-1 - (-DMt-1 / n)) + (-DMt) TRt = (TRt-1 - (TRt-1 / n)) + (TRt) If you think about it, it really is a timesaving convention. Remember, this indicator was developed before microcomputers were invented. The only tool available was the desktop calculator or adding machine. You could spend a great deal of time and effort calculating averages. You now have the average values. The next step is to compute the directional indicator. Again, it can be either up or down, depending upon the directional movement. On up intervals, the formula is: +DI = (+DM / TR) * 100 On a down interval, the formula is: -DI = (-DM / TR) * 100
40 The plus and minus directional indicator values are computed as percentage figures. You are expressing the percentage of the average true range for both up and down trading intervals. If you have followed this process so far, the last few steps are relatively simple. Then you compute the difference between the +DI and the -DI. Again, you use the absolute value of this difference. Simply, convert any negative value into a positive number. The formula is: DIdiff = ((+DI) - (-DI)) Next, compute the sum of the directional indicator values. The formula reads as follows: DIsum = ((+DI) + (-DI)) Once you compute the DIdiff and the DIsum, you calculate the DX or directional movement index. This value is always a percentage. The formula is: DX = (DIdiff / DIsum) * 100 The DX is always a value between 0 and 100. If your calculations exceed this range, you made an error. Wilder was not comfortable using just the directional movement index. It could become very volatile during periods of extreme price movement, especially markets that rise and fall quickly. Again, he implements his accumulated moving average technique to smooth the DX. The result is the ADX or average directional movement index. The computational procedure is as follows: ADXt = ( (ADXt-1 * (n - 1) ) + DXt) / n Buy/Sell Signals Buy Signal happens when: DMI+ yesterday is less than or equal to DMI- Yesterday AND DMI+ today is greater than DMI- today. Sell Signal happens when: DMI+ yesterday is greater than or equal to DMI- Yesterday AND DMI+ today is less than DMI- today. * More informaiton on Buy/Sell Signals for the DMI can be found in 8, 9, and 10 in the Preferences for the DMI on the next page.
 and if it is below 20 there is practically no trend. Values above 40 indicate a strong trend.")
41 1 2 3 Use Trend Strength: The DX or ADX line must be above the target number before a DM+/- cross will give a buy/sell arrow. The theory is the DX/ADX lines indicate trend strength (not direction) and if it is below 20 there is practically no trend. Values above 40 indicate a strong trend. Different articles would use values between 20 and 40 as targets to look for. This box must be selected for this rule to be available. Use Extreme Point Validation: This filter delays the buy/sell arrows at least a day by requiring that the market move higher or lower than the high or low on the day the DM+/ DM- crossover happened. If a new high or lower low is not obtained before the next DM+/- crossover, the buy/sell arrow is suppressed completely for that previous period. The filter does not require the use of DX/ADX, although it does stack with the other filters if they are used. Use Turning Point Validation: The directional index line (DX or ADX) must be above the point where DM+/- crossed. This is like a variable trend strength filter. The directional index can indicate any trend strengths as long as the trend strength is greater than the value of the DM+/- crossing point. This indicator also requires that the directional index line be on. Example of the DMI:
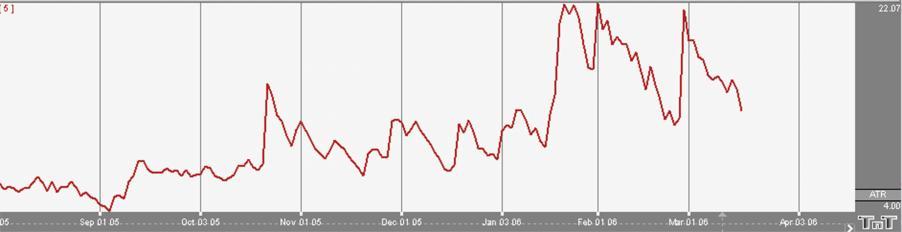
42 Historic Volatility (HVOL) The Historic Volatility indicator is used mainly as an option evaluation tool. It does not give trading signals like those given with other technical indicators. What it does do is give the trader an idea of how volatile the market has been for a previous period of time. Changing the period of time the study observes allows the trader to fine-tune options prices. If a market has been extremely volatile for the past 3 months, for example, then near term options should be more expensive. If the market has been calm for an extended period of time, longer term options should be reasonable. Its use in trading is for observation, telling the trader if prices are calming down or becoming more erratic. Interpretation The key to using historic volatility is determining the correct period of time for each market. The market you are looking at may show a history of volatility years ago, but may have been relatively calm the last few months. Getting an idea of the markets behavior recently may be of no use to the trader that is looking at distant options and vice versa for the trader looking at near term options. For the futures trader this tool is useful as a guide for order placement. Seeing that market volatility is changing may indicate that it is time to move stops closer or farther away. If the trader is profitable with the trend and volatility is changing, it might be a time to move stops closer to protect profits. If a trader is trading against the trend, they might want to move stops further away to avoid getting bumped out prematurely. Options traders could use this study to help them purchase profitable options. The basic idea is to buy options when volatility is decreasing to take advantage of a change in that volatility. Any rise in volatility will translate to an increase in option values. Look at options strategies that take advantage of low volatility, such as straddles or ratio spreads. When volatility is high, selling options would be better because any decrease in volatility will translate to a loss of option value. Option strategies that take advantage of a decrease in volatility are strangles and regular short option positions. Obviously, historic volatility is only one component of option pricing. Any changes in the underlying futures market could negate the changes in option prices due to volatility. For example, if you were to buy a low volatility Put option and prices go higher, that option will lose value but not as quickly as a higher volatility option.
43 For the futures trader the basic concept is to expect market changes during periods of increased volatility. George Soros, the trading legend, said Short term volatility is greatest at a turn around and diminishes as a trend becomes established. This indicator is commonly viewed as very mean regressive. What this term means is that the historic volatility indicator tends to return to the opposite end of the spectrum and therefore return to an average. If volatility is great it will eventually cool off and return to that place. If volatility is low it will not stay quiet forever. What this means to traders is that a market that is erratic will sooner or later calm down and a market that is quiet will eventually get loud again. Calculation Parameters: Period (20) - the number of bars, or period, used to calculate the study. You may alter this to use any number greater than 1 for the close. The indicator displays simple percentage values. Formula: The calculation for the historical volatility is rather involved. The number of periods per year varies depending on the type of price chart used for the study. The following table lists the number of periods for each type of chart: Chart Type Perpetual 262 Daily 262 Weekly 52 Monthly 12 Variable Price Bar Trading Periods per Year Based on chart period (see below) Not available for this study When using variable charts, you must first calculate the number of trading periods per year. To do this, you must determine the trading time of the selected commodity. The formula is as follows: TP = (Tt / Pn) * 262 TP: The total number of trading periods per year. Tt: The total trading time in a day. Pn: The length of the period. 262: The number of weekdays per year.
44 Example: The S&P 500 trades from 8:30 a.m. to 3:15 p.m. That is a total trading time of 6 hours and 45 minutes. On a variable chart using 5 minute bars, the number of periods for the day is 81 as demonstrated: 6 60 minutes = 360 minutes 45 minutes +45 minutes Total minutes of trading = 405 minutes 405 / 5 minute bars = 81 trading periods per day Now that you have calculated the trading periods per day, you now must calculate the number of periods for the year. Since historical volatility considers every weekday of the year when calculating total periods for the year, the multiplier is 262: TP = (405)/5) * 262 TP = 81* 262 TP = 21,222 Note: This formula applies only to historical volatility on a variable chart. It does not apply to other chart types. Now that you have the total number of periods per year, continue with the calculation of the historical volatility. Next calculate the logarithm of the price change for each price in the specified time span of n periods. The formula is: LOGSi = LOG(Pi / Pi-1) LOG: The logarithm function. Pi: The current price. Pi-1: The previous price. Now that you have the logarithms of the price changes, calculate the total logarithms for the time span you are reviewing. To calculate the total of the logarithms, use the following formula:
45 Tlogs: The total of the logarithm price ratio for the time span. S: Indicates to sum all n logarithms. LOGSi: The logarithm of the price change for period i. N: The number of periods for the specified time span. The next step is to calculate the average of the logs by dividing the total logarithm by the number of periods as shown below: ALOGS = Tlogs / n ALOGS: The average of the logarithms. Tlogs: The total of the logarithm for the time span. N: The number of periods for the specified time span. The last calculation is to sum the squares of the difference between the individual logarithms for each period and the average logarithm. This is accomplished in the following formula: SSD: The sum of the squared differences. S: Indicates to total the squares of all n differences. LOGSi: The logarithm of the price change for period i. ALOGS: The average of the logarithms. Now that the elements of the final formula are complete, the following formula calculates the historical volatility for a given period over a specified time span. SSD: The sum of the squared differences. n: The number of periods for the specified time span. TP: The total number of trading periods for the year.

46 Example of the HVOL: Moving Average Convergence/Divergence (MACD) MACD was created in an attempt to determine the strength of a trend along with the direction of that trend. Gerald Appel created a system that looked at two exponential moving averages and the difference between those two averages. Looking at these moving averages of the market we are able to see clear buy and sell signals. We are also able to get a more accurate signal by looking at an average of the difference in the two moving averages. Interpretation Computing this indicator requires the use of exponential moving averages. Exponential moving averages are different than simple moving averages because instead of looking at only the last few days and averaging them, the exponential averages look at all the prices, and then put more weight on the most recent data. This type of weighted average gives a smoother average price that reacts more quickly to market moves. The two averages of MACD move above and below a base line, which gives indication of the strength of the current move. This placement of the two averages in relationship to the base line is calculated by looking at the exponential moving average of the difference between the two averages. So, even though the two averages may cross, the divergence, or true indication of the signal, is not shown until both averages cross the base line. Keeping this in mind, an ideal buy signal is seen on a move where the shorter-term average moves above the other average and both averages cross above the base line of zero. Inversely, a sell signal would be the opposite of this. The histogram method of MACD is read as a straight line above or below the zero base line. This line represents the difference between the moving averages. Therefore, when the moving averages move above the base line they are indicating a buy, and as the difference between the averages increases the lines will get taller.
47 The opposite is true of a sell signal. Track n Trade Live s ability to display MACD in this fashion is vital because it allows you to read the strength of the current trend along with the signal to buy or sell. When MACD is plotted as a histogram, the values used to plot the histogram are the differences between the two moving averages on each day. The trigger line that appears on this chart is an average of the histogram data, or a smoothed view of the histogram. Using the MACD as a histogram will allow the trader to spot divergences between the indicator and the market price. A divergence is present when the market makes a higher high than the previous high, but the MACD histogram fails to make a corresponding higher high. This is considered - in technical lore - to be a sign of weakness and a sell signal when the MACD breaks below the lowest point in between the divergent highs. Bullish divergence is seen in an exact opposite fashion. Assume a market has been trending downward. The market has been consistently making lower lows, as has been the MACD histogram indicator. However, eventually the MACD fails to make a lower low, corresponding to the lower low in price. If the MACD histogram line crosses above the highest high in between the divergent lows, then technical lore holds that higher prices should follow. You also have the choice to view the MACD indicator in a simple line style, instead of the histogram. In this view there is no trigger line. The line style MACD gives buy and sell signals are based off of the crossing of the two moving averages. Calculation Parameters: First (12) - the number of bars, or interval, used to calculate the first Exponential Moving Average. Second (26) - the number of bars, or interval, used to calculate the second Exponential Moving Average. Difference (9) - the number of bars, or interval, used to calculate an additional Exponential Moving Average.
48 Formula: In this study, the oscillator is the simple difference between the first two exponential moving averages. The formula is as follows: OSCt = (EMA1 - EMA2) OSCt: The oscillator for the current period. EMA1: The first exponential moving average. EMA2: The second exponential moving average. The second part of the study computes an exponential moving average of the oscillator. You have: EMAosct = EMAosct-1+ (k * (OSCt - EMAosct-1)) EMAosct: The exponential moving average of the oscillator. OSCt: The oscillator for the current interval. EMAosct-1: The exponential moving average of the oscillator for the previous interval. k: The exponential smoothing constant. Since the second value, EMAosct, is an exponential moving average, it rises and falls slower than the oscillator. Hence, the two lines generate crossover points. These crossover points are the buy/sell signals. Review Reading Moving Average Convergence/Divergence Trading Signals for other possible trading signals. If the study is displayed as a histogram, each value for the lines is calculated as: DIFFt = OSCt - EMAosct DIFFt: The difference between the oscillator for the current interval and the exponential moving average of the oscillator. OSCt: The oscillator for the current interval. EMAosct: The exponential moving average of the oscillator. Buy/Sell Signals Buy Signal happens when: - If we draw the MACD with the Trigger line: MACD value today is greater than Trigger value today AND MACD value yesterday is less than or equal to yesterdays Trigger value AND today s Trigger is less than 0. - If we draw the MACD without the Trigger line: MACD value today is greater than 0 AND yesterdays MACD value is less than 0 AND MACD today is greater than or equal to Yesterdays MACD value.

49 Sell Signal happens when: - If we draw the MACD with the Trigger line: MACD value today is less than Trigger value today AND MACD value yesterday is greater than or equal to yesterdays Trigger value AND today s Trigger is greater than 0. - If we draw the MACD without the Trigger line: MACD value today is less than 0 AND yesterdays MACD value is greater than 0 AND MACD today is less than or equal to Yesterdays MACD value.
50 Momentum (MOM) The momentum indicator describes how price changes occur. It is a measure of the price change. It lets you know if prices are increasing at a continuous rate or decreasing at a continuous rate. Momentum can help gauge the current market trend. This indicator will sometimes shift ahead of a price change. It is both an indicator of trend as well as an indicator of a changing trend. The main thing to look for when using it is a divergence or difference between price behavior and the indicator s behavior. Interpretation Momentum measures the rate of change in prices rather than actual price levels themselves. By measuring this rate of incline or decline, momentum tells whether the current trend is strengthening or weakening. If prices are rising and the momentum indicator is above the zero line, then the trend is gaining strength. If prices were rising but the indicator was sagging or went below the zero line, then we would interpret this as a sign of a coming change in trend. This is true because although prices were still increasing, they were doing so at a decreasing rate. The reverse would be true during a declining market. For example, think of a race car gaining 20 miles an hour each lap, until it starts to only gain 15 miles an hour, then 10 mph, then 5 mph until eventually it reaches its top speed. Like a race car, a market can not sustain growing momentum forever, and in many occurrences momentum slows before prices change direction. Typically, the trade signals are to buy when the momentum indicator crosses from below the zero line to above it. This indicates that a new upward trend has begun, as the market is able to violate resistance levels and continue higher with increasing speed. The sell signal would be to sell when the line crosses from above the zero line to below it. This indicates that the market is picking up speed to the downside and should be able to violate support areas. It is in this way that this unique indicator is a trend following tool. Another way to use momentum is to establish regions of overbought or oversold. For example, when, in a declining market, the prices continue downward and the momentum indicator moves toward more negative but begins to level out, we would be looking for a buy signal when the indicator turned upward and out of that oversold region. It is in this way that momentum can sometimes shift ahead of the price movement. This use of the momentum indicator is a counter trend usage. In either implementation of this indicator the key is divergence: seeing momentum make lower highs while prices are making higher highs, or momentum making higher lows while prices are making lower lows. Being aware of a difference in price movement and the momentum level can help the trader make informed trading decisions.
51 Calculation Parameters: Period (20) - the number of bars, or period, used to calculate the study. You must determine a value suitable to your trading needs and methods. Some technicians argue that the length of the momentum indicator should equal the normal price cycle. The best method is to experiment with different lengths until you find the length that works best for that particular commodity you are trading. Formula: The general formula to calculate momentum is as follows: MOMt = Pi - Pi-n MOMt: The momentum indicator for the current period. Pi: The price of the i interval. Pin: The price n intervals ago. n: The number of intervals or length specified. Example: Assume the current price is This example examines a momentum study using a length of ten trading intervals. The price ten intervals ago is The calculation is: MOM = = +70 The momentum value can have a very broad range. It is a function of the length you select for the momentum and the volatility of the underlying futures contract. Thus, it could swing very widely and wildly about the zero line. Buy/Sell Signals Buy Signal happens when: - If we draw the MOM with the MOMMA Line: MOM value today is greater than Trigger value today AND MOM value yesterday is less than or equal to yesterdays Trigger value AND today s Trigger is less than 0. - If we draw the MOM without the MOMMA Line: MOM value today is greater than 0 AND yesterdays MOM value is less than 0 AND MOM today is greater than or equal to Yesterdays MOM value. Sell Signal happens when: - If we draw the MOM with the MOMMA Line: MOM value today is less than Trigger value today AND MOM value yesterday is greater than or equal to yesterdays Trigger

52 Example of the MOM:
53 Relative Strength Index (RSI) The RSI was developed by J. Welles Wilder, Jr. as a measure of the market s strength or weakness. The principle idea of this study is that it will indicate a general zone that the market is in, either the buy zone or the sell zone. This indicator is similar to Stochastics in that it shows regions of overbought and oversold. This indicator should be incorporated into a system rather than using it by itself. Wilder s popular indicator is known for its accuracy and its ability to compensate for erratic price movement. Interpretation RSI computes the difference in recent prices as a solid line and plots this line on a scale similar to the scale used by Stochastics. The area above 70 is generally considered to be the overbought region, and the region below 30 is referred to as the oversold region. Simply selling in the overbought region and buying when the RSI is in the oversold region is not a consistent method of trade. Trade signals are not generated until the RSI leaves these regions. So a sell signal would not be present until the RSI has begun sloping down and leaves the 70 region. A buy signal, in the simple methodology associated with this pattern, is derived when RSI leaves the oversold region, crossing from below 30 to above it. Just like sell signals, RSI buy signals are present when the market begins to turn and the indicator leaves the oversold region. Another use of the RSI is to look for a divergence in prices; for instance, when a market makes higher highs or lower lows and the RSI fails to follow suit. This difference in the indicator and the market could be a signal that the market lacks the momentum to continue its current price direction. So, you may be able to take a position sooner using this strategy than you would with the previous way. Wilder says that this divergence is the single most indicative characteristic of the RSI. In its calculation, the RSI indicator uses a moving average of price changes over the period. You can select which type of moving average is used to produce the desired amount of smoothing on the RSI indicator. Calculation Parameters: Period (14) - the number of bars, or period, used to calculate the study. Formula: The RSI computations are not difficult, but they are tedious. You first calculate the difference between the current closing price and the previous closing price. The general formula is: DIFt = Closet - Closet-1
54 If that difference is a positive value, it is an up period, which means the current close is higher than the previous close. If the difference is negative, it is a down period, which means the current close is below the previous close. The DOWN value is always a positive number for all computations. It is the absolute value of a negative DIF. The worksheet below shows the calculations needed to create a 9 period RSI. Day Current Close Previous Close Dif Up Down Totals You now compute the up and down averages, which are calculated as follows: Ut = (UP UPn) / n Dt = (DOWN DOWNn) / n UT: The up average for the current period. DT: The down average for the current period. UPn: The UP value for the nth period. DOWNn: The DOWN value for the nth period. n: The number of periods for the RSI.
55 Now, use the values from the worksheet. The up average is: U = 60 / 9 = 6.67 and the down average is: D = 35 / 9 = 3.89 The general formula for the RSI is: RSIt = ( UT / (UT + DT) ) * 100 If you use the above values and place them in the formula, it appears as follows: RSI = ( 6.67 / ( )) * 100 = Assume the market continues the downward trend. The next DIF value is -15, which sets the UP value to 0, and the DOWN value to 15. Calculate the next up and down average by using Wilder s accumulative moving average technique. The formulas are: UT = ( (UT-1 * (n-1) ) + UPt) / n = ( (6.67 * (9-1) ) + 0) / 9 = 5.93 DT = ( ( DT-1 * (n-1) ) + DOWNt) / n = ( ( 3.89 * (9-1) ) + 15) / 9 = 5.12 The value for the new RSI equals the following: RSI = ( (5.93) / ( )) * 100 = Buy/Sell Signals Buy Signal happens when: RSI value today is greater than the Threshold 2 and yesterdays RSI value is less than or equal to Threshold 2. Sell Signal happens when: RSI value today is less than the Threshold 1 and yesterdays RSI value is greater than or equal to Threshold 1.
56 Fast Stochastics (FSTO) The Stochastic Process was invented by Dr. George C. Lane many years ago under this basic premise: During periods of decrease, daily closes tend to accumulate near the extreme low of the day and conversely, during periods of increase, daily closes tend to accumulate near the extreme highs of the day. This indicator is designed to show conditions of overbought and oversold markets. Stochastics are divided into two types: Regular Stochastics, often referred to as Fast Stochastics, and Slow Stochastics. Fast Stochastics are said to be more sensitive to price changes and can give very greatly in the short-term, hence the need for Slow Stochastics. Interpretation Stochastics display two lines that move in a vertical scale between 0 and representing percentiles from 0% to 100%. Think of the level of Stochastics as where the most current close is within a specific range. For example, if Stochastics are reading 50%, the current close is in the middle of the price range for a specified period of time. If Stochastics are reading 100%, the close is at the high of the range, and 0% represents the current close price being at the low of the range. Because Stochastics are smoothed, this is not exactly true, but should help you visualize the information being shown. This will also help you to understand why Stochastics are a counter trend indicator, in that the underlying principle behind Stochastics is that prices will move back to the center of the trading range, or the opposite extreme. When both lines move to an area below 20 on this scale they are said to be in an oversold zone. Conversely, when both %K and %D move to above 80 on this same scale they are indicating an overbought zone. It is this indication of market sentiment that makes this counter trend indicator useful. George Lane emphasized that the most important signal generated by this method was the difference or divergence between %D and the underlying market price. He said that the divergence is where %D line makes a group of lower highs while the market makes a series of higher highs. This would indicate an overbought condition. The reverse would be true of an oversold market, with %D making higher lows and prices making lower lows. Trade triggers to buy are created when, during an oversold condition (Stochastics below 20) the slow line, %D is crossed by the faster moving line, %K. The opposite would occur with a sell signal. The faster %K line crosses above the slower %D line, when both are at a reading above 80. As with a dual moving average system, when the faster reacting indicator crosses the slower moving indicator, a buy or sell is signaled. Because Stochastics give an indication of either overbought or oversold, you would first want to see both lines in the above 80 or below 20
57 range, and sloping out of that range back to the middle before looking for these trade triggers. Calculation Parameters: Overall Period (3) - the number of periods used to determine the highest high and lowest low. %D MA Period (14) - the number of periods used to determine the moving average for the %D value. Formula: The first step in computing the stochastic indicator is to determine the n period high and low. For example, suppose you specified twenty periods for the stochastic. Determine the highest high and lowest low during the last twenty trading intervals. It determines the trading range for that time period. The trading range changes on a continuous basis. The calculations for the %K are as follows: %Kt = ( (Closet - Lown) / (Highn - Lown) ) * 100 %Kt: The value for the first %K for the current time period. Closet: The closing price for the current period. Lown: The lowest low during the n periods. Highn: The highest high during the n time periods. n: The value you specify. Once you obtain the %K value, you start computing the %D value which is an accumulative moving average. Since the %D is a moving average of a moving average, it requires several trading intervals before the values are calculated properly. For example, if you specify a 20 period stochastic, the software system requires 26 trading intervals before it can calculate valid %K and %D values. The formula for the %D is: %DT = ( (%DT-1 * 2) + %Kt) / 3 %DT: The value for %D in the current period. %DT-1: The value for %D in the previous period. %Kt: The value for %K in the current period. The values 2 and 3 are constants. You specify the constants and the length of the time period to examine for the trading range. Buy/Sell Signals Buy Signal happens when: %K value today is greater than the %D today AND yesterdays %K value is less than or equal to yesterdays %D AND Both %K and %D are less than Threshold 2.

58 Sell Signal happens when: %K value today is less than the %D today AND yesterdays %K value is greater than or equal to yesterdays %D AND Both %K and %D are greater than Threshold 1. Preferences 1. Buy/Sell Restore Arrows: Settings: Select TNT to display Default: the Restores buy/sell original arrows. software Click the settings. arrow to My view Default: Return Displayed to your or personalized Not Displayed. default You settings. also have Apply the option To All to Charts: change View the color your of selected the buy/sell settings arrows. on Save As My Default: Save your current personal settings. All charts opened all from charts. the time you save your settings will have those specific settings applied to Example of FSTO: them. 2. FSTO Period: To specify the number of days used in calculating the Fast Stochastics indicator, click in the box, highlight the number, and type in a new value FSTO Smoothing: To specify the number of days used in calculating smoothing, click in the box, highlight the number, then type in a new value. %K/%D: Change the color, line style and line thickness of the %K and %D lines. Calculation: Choose from Exponential, Simple, and Wilder s Smoothing for the type of formula used to calculate the indicator. Thresholds: You are given the option to view four threshold lines in the Indicator Window. The crossing of the %D line above the %K line is a sell signal and only confirmed if this crossing occurred above the Upper Threshold line. The crossing of the %D line below the %K line is a buy signal and only confirmed if this crossing occurred below the Lower Threshold line. You can also change the color of the threshold lines.
59 Slow Stochastics (SSTO) The slower version of Stochastics is commonly believed to be a more reliable indicator. In this version of Stochastics the more sensitive %K line is dropped. The original %D now becomes the slower line %K. The new %D is a 3-day moving average of the %K. This basically gives you a smoothed version of the original indictor. This modified counter trend indicator is less reactive but considered to be more accurate. Interpretation Slow Stochastics are interpreted the same as Fast Stochastics. Quite often the faster of the two indicators moves into and out of the overbought/oversold regions quickly. Calculation Parameters: Overall Period (14) - the number of periods used to determine the highest high and lowest low. %K MA Period (3) - the number of periods used to determine the moving average for the %K value. %D MA Period (3) - the number of periods used to determine the moving average for the %D value. AdditionalLinePeriod (3) - the number of periods used to determine an additional moving average on the stochastic. Formula: The calculations for the slow stochastic are similar to the normal stochastic. The first step in computing the stochastic indicator is to determine the n period high and low. For example, suppose you specified twenty periods for the stochastic. Determine the highest high and lowest low during the last twenty trading intervals. It determines the trading range for that time period. The trading range changes on a continuous basis. The calculations for the %K are as follows: %Kt = ( (Closet - Lown) / (Highn - Lown) ) * 100 %Kt: The value for the first %K for the current time period. Closet: The closing price for the current period. Lown: The lowest low during the n periods. Highn: The highest high during the n time periods. n: The value you specify. Once you obtain the %K value, you start computing the %D value, which is an accumulative moving average. Since the %D is a moving average of a moving average, it requires several trading intervals before the values are calculated properly. For example, if you specify a 20 period stochastic, the software system requires 26 trading intervals before it can calculate valid

60 %K and %D values. The formula for the %D is: %DT = ( (%DT-1 * 2) + %Kt) / 3 %DT: The value for %D in the current period. %DT-1: The value for %D in the previous time period. %Kt: The value for %K in the current period. The values 2 and 3 are constants. You specify the constants and the length of the time period to examine for the trading range. Once the %K and %D values for the normal stochastic are derived, the slow stochastic can be computed. The formula for the slow stochastic is below: %KSLOW = %DNORMAL %DSLOWt = ( ( %D SLOWt-1 * 2 ) + %K SLOWt-1 ) ) / 3 %KSLOW: The %D for the normal stochastic. %DSLOWt: Slow %D value for the current period. %DSLOWt-1: The slow %D for the previous period. %KSLOWt-1: The slow %K for the previous period. The values 2 and 3 are the smoothing constants. You may select different values. Buy/Sell Signals Buy Signal happens when: %K value today is greater than the %D today AND yesterdays %K value is less than or equal to yesterdays %D AND Both %K and %D are less than Threshold 2. Sell Signal happens when: %K value today is less than the %D today AND yesterdays %K value is greater than or equal to yesterdays %D AND Both %K and %D are greater than Threshold 1. Example of SSTO:

61 Volume/Open Interest (VOL/OI) (Stocks only) Volume is a measurement of the number of contracts traded in a day. It is a sign of market activity. In liquid markets these numbers will be consistently higher than in a thin or illiquid market. These numbers are always a day behind, because it takes the exchange that long to tabulate these figures. When displayed, Track n Trade Live offsets these values to put them beneath their respective data in the chart, consequently there is not a value for the most recent day of any contract. Volume indicates participation and urgency. This tells the trader which market is the correct one to be in based on its participation. Interpretation Volume measures the number of contracts that changed hands during that trading session. This indicator of market activity can show whether trade was heavy or light. That will give you an idea of the possible volatility present in that market. Contracts that have not been settled at the end of the day are represented by open interest. New buyers and sellers entering or exiting the market change open interest. The key to this indicator is to look at volume as a percentage of open interest. VOL does not give straight buy or sell signals or have set trading rules. Rather it shows the cyclical tendencies of the market. The flow of the underlying market can be represented. Looking at VOL shows whether new buyers or sellers are entering the market or if they are liquidating positions. There are basic common sense rules for this indicator. If the prices are up and VOL is increasing, the market is strong. If the prices are up and VOL is declining, the market is getting weaker. If the prices are down and VOL is rising, the market is getting stronger. If the prices are down and VOL is declining, the market is getting weaker. In bull markets, volume tends to increase during rallies, and tends to decrease on reactions. In bear markets, volume tends to increase on declines and decrease during rallies. Trading volume usually increases dramatically at tops and bottoms. Looking at the volume and open interest can help you determine the liquidity of the market. Calculation This study has no computations. The values for the volume and open interest are transmitted from the exchanges. However, the actual volume and open interest figures are always one day behind price information. You will not know Monday s volume and open interest until Tuesday at approximately noon (for U.S. markets - central time). That is due to the exchanges and their reporting requirements.
OSCILLATORS. TradeSmart Education Center
 OSCILLATORS TradeSmart Education Center TABLE OF CONTENTS Oscillators Bollinger Bands... Commodity Channel Index.. Fast Stochastic... KST (Short term, Intermediate term, Long term) MACD... Momentum Relative
Chapter 2.3. Technical Indicators
 1 Chapter 2.3 Technical Indicators 0 TECHNICAL ANALYSIS: TECHNICAL INDICATORS Charts always have a story to tell. However, sometimes those charts may be speaking a language you do not understand and you
The Technical Edge Page 1. The Technical Edge. Part 1. Indicator types: price, volume, and moving averages and momentum
 The Technical Edge Page 1 The Technical Edge INDICATORS Technical analysis relies on the study of a range of indicators. These come in many specific types, based on calculations or price patterns. For
1. Accumulation Swing Index
 1. Accumulation Swing Index The Accumulation Swing Index (Wilder) is a cumulative total of the Swing Index. The Accumulation Swing Index may be analyzed using technical indicators, line studies, and chart
INTERMEDIATE EDUCATION GUIDE
 INTERMEDIATE EDUCATION GUIDE CONTENTS Key Chart Patterns That Every Trader Needs To Know Continution Patterns Reversal Patterns Statistical Indicators Support And Resistance Fibonacci Retracement Moving
Technical Indicators versiunea
 Technical Indicators versiunea 2.0 03.10.2008 Contents 1 Price... 1 2 Charts... 1 2.1 Line, Step, Scatter, Histogram/Mountain charts 1 2.2 Open/High/Low/Close charts (Bar Charts)... 2 2.3 Candle charts...
Chapter 2.3. Technical Analysis: Technical Indicators
 Chapter 2.3 Technical Analysis: Technical Indicators 0 TECHNICAL ANALYSIS: TECHNICAL INDICATORS Charts always have a story to tell. However, from time to time those charts may be speaking a language you
Charting Glossary. September 2008 Version 1
 Charting Glossary September 2008 Version 1 i Contents 1 Price... 1 2 Charts... 1 2.1 Line, Step, Scatter, Histogram/Mountain charts...1 2.2 Open/High/Low/Close charts (Bar Charts)...1 2.3 Candle charts...2
Table of Contents. Risk Disclosure. Things we will be going over. 2 Most Common Chart Layouts Anatomy of a candlestick.
 Table of Contents Risk Disclosure Things we will be going over 2 Most Common Chart Layouts Anatomy of a candlestick Candlestick chart Anatomy of a BAR PLOT Indicators Trend-Lines Volume MACD RSI The Stochastic
Technical Analysis and Charting Part II Having an education is one thing, being educated is another.
 Chapter 7 Technical Analysis and Charting Part II Having an education is one thing, being educated is another. Technical analysis is a very broad topic in trading. There are many methods, indicators, and
IVGraph Live Service Contents
 IVGraph Live Service Contents Introduction... 2 Getting Started... 2 User Interface... 3 Main menu... 3 Toolbar... 4 Application settings... 5 Working with layouts... 5 Working with tabs and viewports...
IronFX. technical indicators
 IronFX technical indicators Average Directional Index (ADX) The Average Directional Index (ADX) helps traders see if a trend is developing in the charts and whether the trend is strengthening or weakening.
CHAPTER V TIME SERIES IN DATA MINING
 CHAPTER V TIME SERIES IN DATA MINING 5.1 INTRODUCTION The Time series data mining (TSDM) framework is fundamental contribution to the fields of time series analysis and data mining in the recent past.
Moving Average Convergence Divergence (MACD) by
 by") Moving Average Convergence Divergence (MACD) by www.surefire-trading.com Ty Young Hi, this is Ty Young with Surefiretrading.com and today we will be discussing the Moving Average Convergence/Divergence
Moving Average Convergence Divergence (MACD) by www.surefire-trading.com Ty Young Hi, this is Ty Young with Surefiretrading.com and today we will be discussing the Moving Average Convergence/Divergence
IVolatility.com E G A R O N E S e r v i c e
 IVolatility.com E G A R O N E S e r v i c e Stock Sentiment Service User Guide The Stock Sentiment service is a tool equally useful for both stock and options traders as it provides you stock trend analysis
TD AMERITRADE Technical Analysis Night School Week 2
 TD AMERITRADE Technical Analysis Night School Week 2 Hosted By Derek Moore Director, National Education For the audio portion of today s webcast, please enable your computer speakers. Past performance
Real-time Analytics Methodology
 New High/Low New High/Low alerts are generated once daily when a stock hits a new 13 Week, 26 Week or 52 Week High/Low. Each second of the trading day, the stock price is compared to its previous 13 Week,
Understanding Oscillators & Indicators March 4, Clarify, Simplify & Multiply
 Understanding Oscillators & Indicators March 4, 2015 Clarify, Simplify & Multiply Disclaimer U.S. Government Required Disclaimer Commodity Futures Trading Commission Futures and Options trading has large
BUY SELL PRO. Improve Profitability & Reduce Risk with BUY SELL Pro. Ultimate BUY SELL Indicator for All Time Frames
 BUY SELL PRO Improve Profitability & Reduce Risk with BUY SELL Pro Ultimate BUY SELL Indicator for All Time Frames Risk Disclosure DISCLAIMER: Crypto, futures, stocks and options trading involves substantial
TECHNICAL INDICATORS
 TECHNICAL INDICATORS WHY USE INDICATORS? Technical analysis is concerned only with price Technical analysis is grounded in the use and analysis of graphs/charts Based on several key assumptions: Price
CFD Marketmaker v5.0 New Charting User Guide. 7 th June 2005 v1.2
 CFD Marketmaker v5.0 New Charting User Guide 7 th June 2005 v1.2 Contents Page Introduction...3 Charting...4 How to View a Chart... 4 Main Chart Window... 6 Date/Time & Value where the mouse is... 6 Value
Maybank IB. Understanding technical analysis. by Lee Cheng Hooi. 24 September Slide 1 of Maybank-IB
 Maybank IB Understanding technical analysis 24 September 2011 by Lee Cheng Hooi Slide 1 of 40 Why technical analysis? 1) Market action discounts everything 2) Prices move in trends 3) History repeats itself
The goal for Part One is to develop a common language that you and I
 PART ONE Basic Training The goal for Part One is to develop a common language that you and I can use. The rest of the book will discuss how the technical indicators highlighted in the first two chapters
Profiting. with Indicators. By Jeff Drake with Ed Downs
 Profiting with Indicators By Jeff Drake with Ed Downs Profiting with Indicators By Jeff Drake with Ed Downs Copyright 2018 Nirvana Systems Inc. All Rights Reserved The charts and indicators used in this
THE CYCLE TRADING PATTERN MANUAL
 TIMING IS EVERYTHING And the use of time cycles can greatly improve the accuracy and success of your trading and/or system. THE CYCLE TRADING PATTERN MANUAL By Walter Bressert There is no magic oscillator
The very first calculations for average gain and average loss are simple 14- period averages.
 Introduction Developed by J. Welles Wilder, the Relative Strength Index (RSI) is a momentum oscillator that measures the speed and change of price movements. RSI oscillates between zero and 100. Traditionally,
 1 www.candlecharts.com 2 BONUS www. candlecharts.com/special/swing-trading-2/ 3 www. candlecharts.com/special/swing-trading-2/ 4 www. candlecharts.com/special/swing-trading-2/ 5 www. candlecharts.com/special/swing-trading-2/
Technical Analysis Workshop Series. Session Eight Commodity Channel Index
 Technical Analysis Workshop Series Session Eight DISCLOSURES & DISCLAIMERS This research material has been prepared by NUS Invest. NUS Invest specifically prohibits the redistribution of this material
The Schaff Trend Cycle
 The Schaff Trend Cycle by Brian Twomey This indicator can be used with great reliability to catch moves in the currency markets. Doug Schaff, president and founder of FX Strategy, created the Schaff trend
Schwab Investing Insights Trading Edition Text Close Window Size: November 15, 2007
 Schwab Investing Insights Trading Edition Text Close Window Size: from TheStreet.com November 15, 2007 ON TECHNIQUES Two Indicators Are Better Than One The Relative Strength Index works well but it s better
GUIDE TO STOCK trading tools
 P age 1 GUIDE TO STOCK trading tools VI. TECHNICAL INDICATORS AND OSCILLATORS I. Introduction to Indicators and Oscillators Technical indicators, to start, are data points derived from a specific formula.
Notices and Disclaimer
 Part 2 March 14, 2013 Saul Seinberg Notices and Disclaimer } This is a copyrighted presentation. It may not be copied or used in whole or in part for any purpose without prior written consent from the
Using Oscillators & Indicators Properly May 7, Clarify, Simplify & Multiply
 Using Oscillators & Indicators Properly May 7, 2016 Clarify, Simplify & Multiply Disclaimer U.S. Government Required Disclaimer Commodity Futures Trading Commission Futures and Options trading has large
How I Trade Profitably Every Single Month without Fail
 How I Trade Profitably Every Single Month without Fail First of all, let me take some time to introduce myself to you. I am Koon Hwee (KH Lee) and I am a full time currency trader. I have a passion for
Introduction. Technicians (also known as quantitative analysts or chartists) usually look at price, volume and psychological indicators over time.
 usually look at price, volume and psychological indicators over time.") Technical Analysis Introduction Technical Analysis is the study of market action, primarily through the use of charts, for the purpose of forecasting future price trends. Technicians (also known as quantitative
Technical Analysis Introduction Technical Analysis is the study of market action, primarily through the use of charts, for the purpose of forecasting future price trends. Technicians (also known as quantitative
Technical Analysis Workshop Series. Session Ten Semester 2 Week 4 Oscillators Part 1
 Technical Analysis Workshop Series Session Ten Semester 2 Week 4 Oscillators Part 1 DISCLOSURES & DISCLAIMERS This research material has been prepared by NUS Invest. NUS Invest specifically prohibits the
Compiled by Timon Rossolimos
 Compiled by Timon Rossolimos - 2 - The Seven Best Forex Indicators -All yours! Dear new Forex trader, Everything we do in life, we do for a reason. Why have you taken time out of your day to read this
StockFinder Workbook. Fast and flexible sorting and rule-based scanning. Charting with the largest selection of indicators available
 StockFinder Workbook revised Apr 23, 2009 Charting with the largest selection of indicators available Fast and flexible sorting and rule-based scanning Everything you need to make your own decisions StockFinder
The Trifecta Guide to Technical Analysis 1
 The Trifecta Guide to Technical Analysis 1 No trading system is bullet-proof. The list of factors that can impact a stock s share price is long and growing from investor sentiment to economic growth to
Figure 3.6 Swing High
 Swing Highs and Lows A swing high is simply any turning point where rising price changes to falling price. I define a swing high (SH) as a price bar high, preceded by two lower highs (LH) and followed
BONUS. www. candlecharts.com/special/swing-trading-2/
 BONUS www. candlecharts.com/special/swing-trading-2/ 1 www. candlecharts.com/special/swing-trading-2/ www. candlecharts.com/special/swing-trading-2/ www. candlecharts.com/special/swing-trading-2/ 2 www.
1. Introduction 2. Chart Basics 3. Trend Lines 4. Indicators 5. Putting It All Together
 Technical Analysis: A Beginners Guide 1. Introduction 2. Chart Basics 3. Trend Lines 4. Indicators 5. Putting It All Together Disclaimer: Neither these presentations, nor anything on Twitter, Cryptoscores.org,
Williams Percent Range
 Williams Percent Range (Williams %R or %R) By Marcille Grapa www.surefiretradingchallenge.com RISK DISCLOSURE STATEMENT / DISCLAIMER AGREEMENT Trading any financial market involves risk. This report and
Subject: Daily report explanatory notes, page 2 Version: 0.9 Date: Dec 29, 2013 Author: Ken Long
 Subject: Daily report explanatory notes, page 2 Version: 0.9 Date: Dec 29, 2013 Author: Ken Long Description Example from Dec 23, 2013 1. Market Classification: o Shows market condition in one of 9 conditions,
Popular Exit Strategies The Good, the Bad, and the Ugly
 Popular Exit Strategies The Good, the Bad, and the Ugly A webcast presentation for the Market Technicians Association Presented by Chuck LeBeau Director of Analytics www.smartstops.net What we intend to
Class 7: Moving Averages & Indicators. Quick Review
 Today s Class Moving Averages Class 7: Moving Averages & Indicators 3 Key Ways to use Moving Averages Intro To Indicators 2 Indicators Strength of Lines Quick Review Great for establishing point of Support
Bollinger Trading Methods. Play 1 - The Squeeze
 Overview: Play 1 - The Squeeze Play 2 - The Trend Trade Play 3 - Reversals Wrap up Bollinger Trading Methods Play 1 - The Squeeze The Squeeze The most popular strategy Looks to enter a trend early on Anticipates
Fast Track Stochastic:
 Fast Track Stochastic: For discussion, the nuts and bolts of trading the Stochastic Indicator in any market and any timeframe are presented herein at the request of Beth Shapiro, organizer of the Day Traders
THE BALANCE LINE TRADES THE FIFTH DIMENSION
 THE BALANCE LINE TRADES THE FIFTH DIMENSION We have now arrived at our fifth and final trading dimension. At first, this dimension may seem a bit more complicated, but it really isn't. In our earlier book,
What is Technical Analysis
 Reg. office: International School of Financial Market, Plot no. 152 - P (LGF), Sec - 38, Medicity Road, Gurgaon - 122002 Contact no. : 0124-2200689,+919540008689, 9654446629 Web : www.isfm.co.in, Email
FOREX PROFITABILITY CODE
 FOREX PROFITABILITY CODE Forex Secret Protocol Published by Old Tree Publishing CC Suite 509, Private Bag X503 Northway, 4065, KZN, ZA www.oldtreepublishing.com Copyright 2013 by Old Tree Publishing CC,
Relative Strength Index (RSI) by Ty Young
 by Ty Young") Relative Strength Index (RSI) by www.surefire-trading.com Ty Young Hi, this is Ty Young with Surefire-trading.com and today I will be discussing the Relative Strength Index (RSI). History J. Welles Wilder,
Relative Strength Index (RSI) by www.surefire-trading.com Ty Young Hi, this is Ty Young with Surefire-trading.com and today I will be discussing the Relative Strength Index (RSI). History J. Welles Wilder,
Technical Indicators
 Taken From: Technical Analysis of the Financial Markets A Comprehensive Guide to Trading Methods & Applications John Murphy, New York Institute of Finance, Published 1999 Technical Indicators Technical
Technical Analysis Workshop Series. Session 11 Semester 2 Week 5 Oscillators Part 2
 Technical Analysis Workshop Series Session 11 Semester 2 Week 5 Oscillators Part 2 DISCLOSURES & DISCLAIMERS This research material has been prepared by NUS Invest. NUS Invest specifically prohibits the
Introduction. Technical analysis is the attempt to forecast stock prices on the basis of market-derived data.
 Technical Analysis Introduction Technical analysis is the attempt to forecast stock prices on the basis of market-derived data. Technicians (also known as quantitative analysts or chartists) usually look
Test Your Chapter 1 Knowledge
 Self-Test Answers Test Your Chapter 1 Knowledge 1. Which is the preferred chart type in LOCKIT? The preferred chart type in LOCKIT is the candle chart because candle patterns are part of the decision-making
Martin J. Pring President of Pring.com
 Martin J. Pring President of Pring.com How to Manage Risk Using Technical Analysis The first trading objective is to preserve capital #1 Trading rule Cut losses quickly, let profits run. First trade 50%
Stay on the Right Side & Finishing the Year Strong! From the Active Trend Trader
 Stay on the Right Side & Finishing the Year Strong! From the Active Trend Trader Disclaimer U.S. GOVERNMENT REQUIRED DISCLAIMER COMMODITY FUTURES TRADING COMMISSION FUTURES AND OPTIONS TRADING HAS LARGE
Convergence and Divergence
 Convergence and Divergence Momentum: The Verge of Success Momentum plays a key role in trend analysis. Trends are composed of a series of price swings. It is a trader s edge to know when a trend is slowing
.. /-!"::- '..- ( \.- - '-/../ '
 ....'-/ -!"::- ' ( \.-../ ' /- Triple Shot Forex Trading System The term "Day Trading" usually refers to the act of buying and selling a financial instrument within the same day. In the Forex market, a
Stock Market Basics Series
 Stock Market Basics Series HOW DO I TRADE STOCKS.COM Copyright 2012 Stock Market Basics Series THE STOCHASTIC OSCILLATOR A Little Background The Stochastic Oscillator was developed by the late George Lane
Divergence and Momentum Trading
 presented by Thomas Wood MicroQuant SM Divergence Trading Workshop Day One Divergence and Momentum Trading Risk Disclaimer Trading or investing carries a high level of risk, and is not suitable for all
Technical Analysis for Options Trading. Fidelity Brokerage Services LLC, Member NYSE, SIPC, 900 Salem Street, Smithfield, RI
 Technical Analysis for Options Trading Fidelity Brokerage Services LLC, Member NYSE, SIPC, 900 Salem Street, Smithfield, RI 02917 747561.2.0 Disclosures Options trading entails significant risk and is
Using Acceleration Bands, CCI & Williams %R
 Price Headley s Simple Trading System for Stock, ETF & Option Traders Using Acceleration Bands, CCI & Williams %R How Technical Indicators Can Help You Find the Big Trends For any type of trader, correctly
An informative reference for John Carter's commonly used trading indicators.
 An informative reference for John Carter's commonly used trading indicators. At Simpler Options Stocks you will see a handful of proprietary indicators on John Carter s charts. This purpose of this guide
PART 3 - CHART PATTERNS & TECHNICAL INDICATORS
 Tyler Chianelli s EASYOPTIONTRADING by OPTION TRADING COACH PART 3 - CHART PATTERNS & TECHNICAL INDICATORS A SIMPLE SYSTEM FOR TRADING OPTIONS WORKS IN UP, DOWN, AND SIDEWAYS MARKETS PART 3.1 - PRIMARY
Analysis and Trading with Bill Williams Indicators (Bill Williams Indicators) Bill M. Williams, a leader in the self-education of investors first
 Bill M. Williams, a leader in the self-education of investors first") Analysis and Trading with Bill Williams Indicators (Bill Williams Indicators) Bill M. Williams, a leader in the self-education of investors first began trading in 1959. His background in engineering,physics,
Analysis and Trading with Bill Williams Indicators (Bill Williams Indicators) Bill M. Williams, a leader in the self-education of investors first began trading in 1959. His background in engineering,physics,
Exit Strategies for Stocks and Futures
 Exit Strategies for Stocks and Futures Presented by Charles LeBeau E-mail clebeau2@cox.net or visit the LeBeau web site at www.traderclub.com Disclaimer Each speaker at the TradeStationWorld Conference
MULTI-TIMEFRAME TREND TRADING
 1. SYNOPSIS The system described is a trend-following system on a slow timeframe that uses optimized (that is, contrarian) entries and exits on a fast timeframe at the tops and bottoms of retraces against
4 Keys to Trend Trading Tech Analysis. There is no Holy Grail of Trading Only Tools & Rules
 4 Keys to Trend Trading Tech Analysis There is no Holy Grail of Trading Only Tools & Rules Disclaimer U.S. GOVERNMENT REQUIRED DISCLAIMER COMMODITY FUTURES TRADING COMMISSION FUTURES AND OPTIONS TRADING
GuruFocus User Manual: Interactive Charts version
 GuruFocus User Manual: Interactive Charts 2018 version 1 Contents: 0. Introduction and Overview a. Accessing Interactive Charts b. Interactive Chart Layout 1. Adding Stocks to the Chart 2. Graphing Financial
END OF DAY DATA CORPORATION. Scanning the Market. using Stock Filter. Randal Harisch 2/27/2011
 END OF DAY DATA CORPORATION Scanning the Market using Stock Filter Randal Harisch 2/27/2011 EOD's Stock Filter tool quickly searches your database, identifying stocks meeting your criteria. The results
TOP 3 INDICATOR BOOT CAMP: PERCENT R
 BIGTRENDS.COM TOP 3 INDICATOR BOOT CAMP: PERCENT R PRICE HEADLEY, CFA, CMT Let s Get Started! Educate Understand the tools you have for trading. Learn what this indicator is and how you can profit from
Technical Indicators that Really Work
 Technical Indicators that Really Work TECHNICAL INDICATORS Technical indicators have become more important than Fundamentals. With the proper use of technical indicators investors are able to determine
SWITCHBACK (FOREX) V1.4
 V1.4") SWITCHBACK (FOREX) V1.4 User Manual This manual describes all the parameters in the ctrader cbot. Please read the Switchback Strategy Document for an explanation on how it all works. Last Updated 11/11/2017
SWITCHBACK (FOREX) V1.4 User Manual This manual describes all the parameters in the ctrader cbot. Please read the Switchback Strategy Document for an explanation on how it all works. Last Updated 11/11/2017
Presents FOREX ALPHA CODE
 Presents FOREX ALPHA CODE Forex Alpha Code Published by Alaziac Trading CC Suite 509, Private Bag X503 Northway, 4065, KZN, ZA www.tradeology.com Copyright 2014 by Alaziac Trading CC, KZN, ZA Reproduction
Indicators Manual. Genesis Financial Technologies Inc. Finally Strategy Development and Back Testing Just Got Easier!
 s Manual Genesis Financial Technologies Inc. Finally Strategy Development and Back Testing Just Got Easier! KEY : 5 TRADE NAVIGATOR INDICATORS: 6 ACCUMULATION/DISTRIBUTION 6 ADOSC 7 ADX 8 ADXMOD 9 ADXR
Technical Analysis Indicators
 Technical Analysis Indicators William s Percent R Rules, Scans, Adding Filters, Breakout, Retest, and Application across MTFs Course Instructor: Price Headley, CFA, CMT BigTrends Coaching Access to BigTrends
Tommy s Revenge 2.0 Module 2 Part 2
 1 Mark Deaton here with your follow-up to Module 2. Going to cover a few things in this video and try to keep it short and sweet. We re going to look at Stock Fetcher and how we can use Stock Fetcher to
Chapter 24 DIVERGENCE DECISIONS
 Chapter 24 DIVERGENCE DECISIONS The subject of divergence is one that we will approach with the utmost caution. We hope we have made ourselves clear in the other volumes of this course that we have little
Introduction. Leading and Lagging Indicators
 1/12/2013 Introduction to Technical Indicators By Stephen, Research Analyst NUS Students Investment Society NATIONAL UNIVERSITY OF SINGAPORE Introduction Technical analysis comprises two main categories:
SYMBOL INFO INDICATOR
 fxbluelabs.com 1. Overview... 2 2. Using the Symbol Info indicator... 3 2.1 Adding the indicator to a chart... 3 2.2 Choosing the symbol... 3 2.3 % change... 3 2.3.1 Change in pips... 4 2.4 High-low range...
20.2 Charting the Market
 NPTEL Course Course Title: Security Analysis and Portfolio Management Course Coordinator: Dr. Jitendra Mahakud Module-10 Session-20 Technical Analysis-II 20.1. Other Instruments of Technical Analysis Several
MetaStock XV Featuring Offline Mode
 MetaStock XV Featuring Offline Mode Disclaimer This demonstration is designed to instruct you on using MetaStock and accompanying software plug-ins and is not a recommendation to buy or sell, but rather
Icoachtrader Consulting Service WELCOME TO. Trading Boot Camp. Day 5
 Icoachtrader Consulting Service www.icoachtrader.weebly.com WELCOME TO Trading Boot Camp Day 5 David Ha Ngo Trading Coach Phone: 1.650.899.1088 Email: icoachtrader@gmail.com The information presented is
Combining Rsi With Rsi
 Working Two Stop Levels Combining Rsi With Rsi Optimization and stop-losses can help you minimize risks and give you better returns. channels, and so forth should be kept to a minimum. DAVID GOLDIN ou
Sunny s Dynamic Moving Average
 20120510 Sunny s Dynamic Moving Average SunnyBands Today We Will Compare and Contrast Simple Moving Averages Exponential Moving Averages Bollinger Bands Keltner Channels SunnyBands Introduction After 30
Software user manual for all our indicators including. Floor Traders Tools & TrendPro
 Software user manual for all our indicators including Floor Traders Tools & TrendPro All the software was designed and developed by Roy Kelly ARC Systems, Inc. 1712 Pioneer Ave Ste 1637 Cheyenne, WY 82001
Binary Options Trading Strategies How to Become a Successful Trader?
 Binary Options Trading Strategies or How to Become a Successful Trader? Brought to You by: 1. Successful Binary Options Trading Strategy Successful binary options traders approach the market with three
Level II Learning Objectives by chapter
 Level II Learning Objectives by chapter 1. Charting Explain the six basic tenets of Dow Theory Interpret a chart data using various chart types (line, bar, candle, etc) Classify a given trend as primary,
FOREX TRADING STRATEGIES.
 FOREX TRADING STRATEGIES www.ifcmarkets.com www.ifcmarkets.com 2 One of the most powerful means of winning a trade is the portfolio of Forex trading strategies applied by traders in different situations.
INDICATORS. The Insync Index
 INDICATORS The Insync Index Here's a method to graphically display the signal status for a group of indicators as well as an algorithm for generating a consensus indicator that shows when these indicators
CMT LEVEL I CURRICULUM Self-Evaluation
 CMT LEVEL I CURRICULUM Self-Evaluation DEAR CFA CHARTERHOLDER, As a CFA charterholder, the requirement that you sit for the CMT Level I exam is waived. However, the content in the CMT Level I Curriculum
Stocks & Commodities V. 11:9 ( ): Trading Options With Bollinger Bands And The Dual Cci by D.W. Davies
: Trading Options With Bollinger Bands And The Dual Cci by D.W. Davies") Trading Options With Bollinger Bands And The Dual CCI by D.W. Davies Combining two classic indicators, the commodity channel index (CCI) and Bollinger bands, can be a potent timing tool for options trading.
Trading Options With Bollinger Bands And The Dual CCI by D.W. Davies Combining two classic indicators, the commodity channel index (CCI) and Bollinger bands, can be a potent timing tool for options trading.
Those who cannot remember the past are condemned to repeat it.
 WITH THESE 4 EXPERT-LEVEL TECHNICAL INDICATORS Those who cannot remember the past are condemned to repeat it. This oft-quoted warning also forms the basis for technical analysis. Only I d tweak it to say,
Cycle Turn Indicator Direction and Swing Summary. of Select Markets as of the close on. January 4, Daily Swing
 Cycle Turn Indicator Direction and Swing Summary of Select Markets as of the close on January 4, 2018 Market Daily CTI Daily Swing Weekly CTI Weekly Swing Industrial Positive Low Positive Low Transports
Intelligent Stock Monitor
 Intelligent Stock Monitor (by SHK Financial Data Ltd.) - 1 - Content 1. Technical Analysis 4 1.1 Chart 1.1.1 Line Chart 1.1.2 Bar Chart 1.1.3 Candlestick Chart 1.2 Technical Drawing Skills 1.2.1 Golden
Technical analysis & Charting The Foundation of technical analysis is the Chart.
 Technical analysis & Charting The Foundation of technical analysis is the Chart. Charts Mainly there are 2 types of charts 1. Line Chart 2. Candlestick Chart Line charts A chart shown below is the Line
BY JIM PRINCE
 No part of this publication may be reproduced, stored in a retrieval system, or transmitted in any form or by any means electronic, mechanical, photocopying, recording, or otherwise without the prior permission
Options Mastery Day 1 System Training
 Options Mastery Day 1 System Training Day 1 Agenda 10:00-10:15 - Intro & Course Outline 10:15-11:00 Indicator Overview and Setup 11:00-11:15 - Break 11:15-12:15 - Active Swing Trader Training 12:15-12:30