Gautam Duggad Sreekanth P V S
|
|
|
- Moses Parker
- 6 years ago
- Views:
Transcription
 -10/-32/-20 Financials & Valuation (INR b) Y/E Dec 2012E* 2013E 2014E Sales 122.5 139.9 158.0 EBITDA 11.0 12.7 14.5 Adj. PAT 1.1 1.5 2.1 Adj. EPS (INR) 4.8 6.7 9.3 EPS Gr. (%) -45.2 39.9 39.")
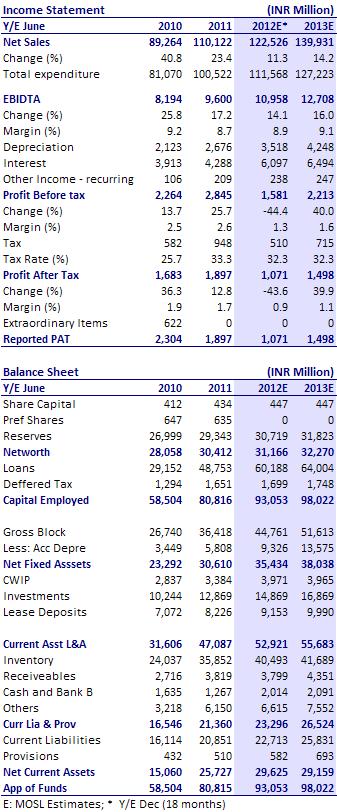
1 BSE Sensex S&P CNX 19,990 6,069 Bloomberg FRL IN Equity Shares (m) M.Cap. (INR b)/(usd b) 33.4/ Week Range (INR) 276/127 1,6,12 Rel. Perf. (%) -10/-32/-20 Financials & Valuation (INR b) Y/E Dec 2012E* 2013E 2014E Sales EBITDA Adj. PAT Adj. EPS (INR) EPS Gr. (%) BV/Sh.(INR) RoE (%) RoCE (%) Payout (%) Valuations P/E (x) P/BV (x) EV/EBITDA (x) Div. Yield (%) * 18 months CMP: INR154 9 May QCY13 Results Update Sector: Retail Future Retail Under review Future Retail's 1QCY13 results were below estimates. Core retail PAT was down 83% YoY to INR20m (est INR74m). Net sales declined 2% to INR29.1b (est INR32.4b), while EBITDA margin stood at 8.6% (est 8.7%) as EBITDA fell 10% to INR2.5b (est INR2.8b). However, performance is not comparable YoY due to demerger of Pantaloon format. Same store performance improved, as expected. SSS growth was 9.6% for Lifestyle division, 8.1% for Value and -4.1% for Home division. Like-to-like gross space contraction during the quarter stood at 0.26msf as it rationalized space in Food Bazaar. Management expects further improvement in same store growth due to ensuing wedding season. Highlight of the quarter was turnaround in its electronics format - e-zone. The chain reported 27% same store growth and revenue growth of 43% to INR1.5b. This, as per the management, was a result of host of strategic initiatives undertaken in the last 18 months. Company is planning similar strategy for its Home Town format. Core retail debt stood at ~INR45b. For the Lifestyle format demerger and listing of new entity, FLF, company will take court's approval this month. On completion of deleveraging transactions, Future Retail's debt would be ~INR30b (transfer of INR12b debt to FLF, inflow of INR7b from insurance venture divestment, new capex). We will revise estimates, target price and rating, post management interaction. Our rating and TP is under review. Slowdown in discretionary consumption and worsening of consumer sentiments are key risks. Our indicative SOTP, after adjusting for Pantaloon's demerger, works out to INR210/share - we value the core retail business at 8x EV/EBITDA, Future Lifestyle Fashion at 10x EV/EBITDA (with 25% holding company discount) and other investments (Future Logistics, Staples etc) at book value. Gautam Duggad (Gautam.Duggad@MotilalOswal.com); Sreekanth P V S (Sreekanth.P@MotilalOswal.com); Investors are advised to refer through disclosures made at the end of the Research Report. 1
2 1QCY13 PAT down 83%; Same store growth remains strong ; e-zone shows significant improvement Core retail (includes standalone plus Big Bazaar, Big Bazaar and Food Bazaar) sales decline 2% to INR29b (est. INR32.4b) however numbers are not comparable YoY due to de-merger of Pantaloon format. Same store performance improved, as expected. Same store sales (SSS) growth was 9.6% for Lifestyle division, 8.1% for Value and -4.1% for Home division. Gross margins declined 160bps to 27.3%. However decline in EBITDA margins was restricted to 60bps to 8.6% (est 8.7%) due to 70bps and 40bps savings in employee and other expenses. Core Retail EBITDA declined 10% to INR 2.49b. Despite 12% decline in interest costs and 84% increase in other income PBT and PATdeclined83% as depreciation expenses went up 10% YoY. Standalone (includes Central, Brand Factory, e-zone, Home Town): Stand-alone numbers are not comparable as base quarter had Pantaloon numbers. Standalone gross and EBITDA margins came in at 32.3% and 7.7%, respectively. Snapshot of standalone, core retail and derived value retail numbers (INR m) 1QFY11 2QFY11 3QFY11 4QFY11 1QFY12 2QFY12 3QFY12 4QFY12 5QFY12 6QFY12 1QCY13 Sales 25,814 27,586 28,119 28,604 29,106 28,933 30,264 29,627 30,600 31,708 29,070 EBITDA 2,127 2,383 2,479 2,585 2,523 2,612 2,776 2,763 2,647 2,779 2,490 EBITDA Margin (%) Interest Adjusted PAT PAT Margin (%) Standalone (INR m) 1QFY11 2QFY11 3QFY11 4QFY11 1QFY12 2QFY12 3QFY12 4QFY12 5QFY12 6QFY12 1QCY13 Sales 9,915 10,243 9,887 9,996 10,784 11,080 11,059 11,176 11,921 12,529 9,115 EBITDA 958 1, ,198 1, , , EBITDA Margin (%) Interest Adjusted PAT PAT Margin (%) Future Value Retail (INR m) 1QFY11 2QFY11 3QFY11 4QFY11 1QFY12 2QFY12 3QFY12 4QFY12 5QFY12 6QFY12 1QCY13 Sales 15,899 17,343 18,232 18,608 18,322 17,854 19,205 18,451 18,679 19,180 19,955 EBITDA 1,169 1,310 1,795 1,921 1,325 1,353 1,783 1,721 1,739 1,745 1,790 EBITDA Margin (%) Interest Adjusted PAT PAT Margin (%) Source: Company, MOSL 9 May
3 SSS improves; Lifestyle up 9.6%, value retailing up 8.1% SSS grew 8.1% in Value retailing (up 5.1% in 6QFY12). Home Retail SSS declined 4.1% (down 3.4% in 6QFY12). Renovation of Big Bazaar stores has resulted in the sustained pick up in same store growth. Lifestyle division reported 9.6% SSS (12.7% in 65QFY12), underscoring the spill-over of improved consumer sentiment from festive quarter. Management in the press release commented upon expected improvement in profitability post the store optimization and category revamps undertaken in the recently. It expects further improvement in same store growth due to ensuing wedding season and good response to its Public Holiday sale in May. Highlight of the quarter was turnaround in its electronics format - e-zone. The chain reported 27% same store growth, and revenue growth of 43% to INR1.5bn. This, as per management was a result of host of strategic initiatives undertaken in the last 18 months - store size optimization, re-designing merchandise, exit from certain cities and categories etc. Company is planning similar strategy for its Home Town format. SSS growth improves for Value format Home format still remains under pressure Source: Company, MOSL Like to like net area contraction of ~0.26msf On like to like basis after excluding Pantaloon format, Future Retail's space contracted 0.26msf QoQ. Gross space addition was 0.33mn sqft. Total area under operation stands at 14.12msf. During the quarter, it opened 4 Big Bazaar and 2 Brand Factory. 9 May
4 Key Retail Metrics 1QFY11 2QFY11 3QFY11 4QFY11 1QFY12 2QFY12 3QFY12 4QFY12 5QFY12 6QFY12 1CFY13 Retail Space (m sq ft) Big Bazaar Central Pantaloons Home Town E Zone Food Bazaar KB's Fair Price Others Total Store Count (x) Big Bazaar Central Pantaloons Home Town E Zone Food Bazaar Net Store Addition (x) Big Bazaar Central Pantaloons Home Town E Zone Food Bazaar Source: Company, MOSL De-leveraging transactions largely over Future group's strategic focus in the past months has been to deleverage the balance sheet via divestment of non-core assets. Given the limited cash generation from Core Retail business, investments in non-core retail assets were bleeding the balance sheet in a rising interest rate regime. Following are the five de-leveraging transactions done so far: 1) Sale of Pantaloon Retail Format to ABNL (Aditya Birla Nuvo) - demerger complete - debt of INR8bn transferred, INR8bn OFCD to be redeemed. 2) Partial stake Sale of Future Capital stake to Warburg Pincus - transaction complete - cash flow of INR 4bn received. 3) Re-alignment of lifestyle businesses in a separate entity, to be listed - INR12bn debt will be transferred to the new entity.. 4) Stake sale in life insurance JV to IITL and 5) Stake sale in general insurance JV to L&T. Once the regulatory approvals are in place (likely by 2HFY14), the aforementioned deals should result in debt reduction of ~INR19b, excluding the INR16bn debt transfer to AB Nuvo. Details of de-leveraging transactions Transaction Deleveraging potential Approvals Transaction status - closure timlines (tentative) Re-alignment of Fashion business INR 12 bn Court approval pending June-July'13 Life Insurance Stake Sale INR 3 bn CCI,IRDA, RBI September'13 General Insurance Stake Sale INR 4bn CCI,IRDA September'13 9 May
5 Valuation and view: Early signs of recovery; expect improvement in balance sheet ahead Same store performance has improved aided by various initiatives like store refurbishment, aggressive sales push around public holidays etc. However, profitability still remains under pressure. Post the de-leveraging deals, interest costs will come down further (down 11% for 1QCY13). Key investor concern around investments in non-core retail assets has been largely addressed, we believe. While we have not yet firmed our future projections pending clarity on financials - our indicative SOTP suggests good upside potential. We have adjusted the SOTP for de-merger of Pantaloon format. We value Core Retail business at 8x EV/EBITDA, Future Lifestyle Fashion at 10x EV/ EBITDA and other investments (Future Logistics, Staples etc) at book value. The benefits of recent restructuring will reflect going forward and result in improved balance sheet with lower leverage and higher interest coverage. However, we await more clarity on financials of different verticals post the recent business re-structuring initiatives before revisiting our investment thesis. We will be revising our estimates, target price and rating post detailed management interaction. Our rating and target price is under review. Slowdown in discretionary consumption and worsening of consumer sentiments are key risks. Indicative SOTP: adjusted for the Pantaloon demerger INR M EBITDA EV Debt Equity FRL's FRL's Per Share Remarks stake (%) share value Core Retail ,400 40,000 30, Future Lifestyle ,300 15,000 21, % share swap + 20% indirect holding through FRL, 25% holding company discount Support businesses Excluding investments in insurance and Value Retail sub Total May
6 Future Retail: an investment profile Company description Future Retail is the largest organized retailer in Indiawith a retail space of more than 2m square feet underits belt. It retails multiple categories throughdifferent format offerings like hypermarkets (Big Bazaar), seamless mall(central) and standalone stores. Key investment arguments Pantaloon is the best play in the fast growingorganized retail play with its presence acrosscategories and formats. Pantaloon has a high share of private labels in itssales mix (approximately 50-60%) which enables itto earn high operating margins even in traditionallylow margin business of food retailing. Divestment of non-core retail assets will provide earnings boost due to reduction in interest cost. Key investment risks Slow space addition and accelerating store closerposes a risk to revenue growth. Weak SSS growth across all formats and high interestcosts are a threat to profitability. Recent developments Divested partial stake in Life and General insurance ventures for a total consideration of INR7bn. Record date of Pantaloon format demerger announced. Valuation and view We withhold estimates beyond FY12 pending clarityon residual operations post Pantaloon format stakesale. Our rating and TP is under review. Sector view We are cautious on the sector. We expect the sectorto clock a revenue growth of 15-20% CAGR over thenext three years. Players like Pantaloon Retail with a stronghypermarket format and presence in larger numberof categories are likely to be bigger winners. Longer term prospects bright, given rising incomesand low penetration. Target price and recommendation Current Target Upside Reco. Price (INR) Price (INR) (%) 154 Under review NA Under Review Stock performance (1 year) Shareholding pattern (%) Mar-13 Dec-12 Mar-12 Promoter Domestic Inst Foreign Others May
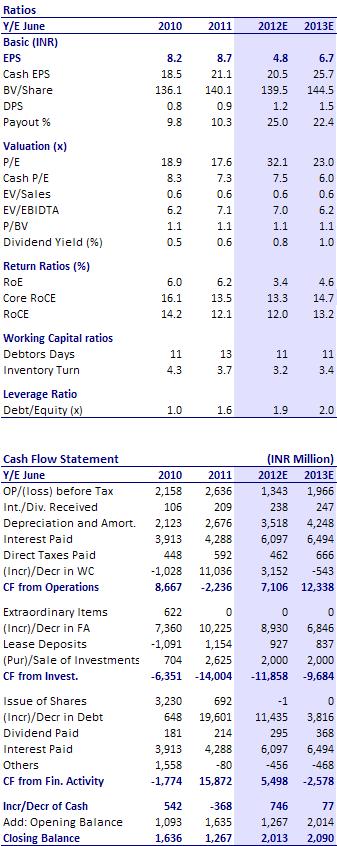
7 Financials and Valuation 9 May
8 Disclosures This report is for personal information of the authorized recipient and does not construe to be any investment, legal or taxation advice to you. This research report does not constitute an offer, invitation or inducement to invest in securities or other investments and Motilal Oswal Securities Limited (hereinafter referred as MOSt) is not soliciting any action based upon it. This report is not for public distribution and has been furnished to you solely for your information and should not be reproduced or redistributed to any other person in any form. Unauthorized disclosure, use, dissemination or copying (either whole or partial) of this information, is prohibited. The person accessing this information specifically agrees to exempt MOSt or any of its affiliates or employees from, any and all responsibility/liability arising from such misuse and agrees not to hold MOSt or any of its affiliates or employees responsible for any such misuse and further agrees to hold MOSt or any of its affiliates or employees free and harmless from all losses, costs, damages, expenses that may be suffered by the person accessing this information due to any errors and delays. The information contained herein is based on publicly available data or other sources believed to be reliable. While we would endeavour to update the information herein on reasonable basis, MOSt and/or its affiliates are under no obligation to update the information. Also there may be regulatory, compliance, or other reasons that may prevent MOSt and/or its affiliates from doing so. MOSt or any of its affiliates or employees shall not be in any way responsible and liable for any loss or damage that may arise to any person from any inadvertent error in the information contained in this report. MOSt or any of its affiliates or employees do not provide, at any time, any express or implied warranty of any kind, regarding any matter pertaining to this report, including without limitation the implied warranties of merchantability, fitness for a particular purpose, and non-infringement. The recipients of this report should rely on their own investigations. This report is intended for distribution to institutional investors. Recipients who are not institutional investors should seek advice of their independent financial advisor prior to taking any investment decision based on this report or for any necessary explanation of its contents. MOSt and/or its affiliates and/or employees may have interests/positions, financial or otherwise in the securities mentioned in this report. To enhance transparency, MOSt has incorporated a Disclosure of Interest Statement in this document. This should, however, not be treated as endorsement of the views expressed in the report. Disclosure of Interest Statement Future Retail 1. Analyst ownership of the stock No 2. Group/Directors ownership of the stock No 3. Broking relationship with company covered No 4. Investment Banking relationship with company covered No Analyst Certification The views expressed in this research report accurately reflect the personal views of the analyst(s) about the subject securities or issues, and no part of the compensation of the research analyst(s) was, is, or will be directly or indirectly related to the specific recommendations and views expressed by research analyst(s) in this report. The research analysts, strategists, or research associates principally responsible for preparation of MOSt research receive compensation based upon various factors, including quality of research, investor client feedback, stock picking, competitive factors and firm revenues. Regional Disclosures (outside India) This report is not directed or intended for distribution to or use by any person or entity resident in a state, country or any jurisdiction, where such distribution, publication, availability or use would be contrary to law, regulation or which would subject MOSt & its group companies to registration or licensing requirements within such jurisdictions. For U.K. This report is intended for distribution only to persons having professional experience in matters relating to investments as described in Article 19 of the Financial Services and Markets Act 2000 (Financial Promotion) Order 2005 (referred to as "investment professionals"). This document must not be acted on or relied on by persons who are not investment professionals. Any investment or investment activity to which this document relates is only available to investment professionals and will be engaged in only with such persons. For U.S. Motilal Oswal Securities Limited (MOSL) is not a registered broker - dealer under the U.S. Securities Exchange Act of 1934, as amended (the"1934 act") and under applicable state laws in the United States. In addition MOSL is not a registered investment adviser under the U.S. Investment Advisers Act of 1940, as amended (the "Advisers Act" and together with the 1934 Act, the "Acts), and under applicable state laws in the United States. Accordingly, in the absence of specific exemption under the Acts, any brokerage and investment services provided by MOSL, including the products and services described herein are not available to or intended for U.S. persons. This report is intended for distribution only to "Major Institutional Investors" as defined by Rule 15a-6(b)(4) of the Exchange Act and interpretations thereof by SEC (henceforth referred to as "major institutional investors"). This document must not be acted on or relied on by persons who are not major institutional investors. Any investment or investment activity to which this document relates is only available to major institutional investors and will be engaged in only with major institutional investors. In reliance on the exemption from registration provided by Rule 15a-6 of the U.S. Securities Exchange Act of 1934, as amended (the "Exchange Act") and interpretations thereof by the U.S. Securities and Exchange Commission ("SEC") in order to conduct business with Institutional Investors based in the U.S., MOSL has entered into a chaperoning agreement with a U.S. registered broker-dealer, Motilal Oswal Securities International Private Limited. ("MOSIPL"). Any business interaction pursuant to this report will have to be executed within the provisions of this chaperoning agreement. The Research Analysts contributing to the report may not be registered /qualified as research analyst with FINRA. Such research analyst may not be associated persons of the U.S. registered broker-dealer, MOSIPL, and therefore, may not be subject to NASD rule 2711 and NYSE Rule 472 restrictions on communication with a subject company, public appearances and trading securities held by a research analyst account. For Singapore Motilal Oswal Capital Markets Singapore Pte Limited is acting as an exempt financial advisor under section 23(1)(f) of the Financial Advisers Act(FAA) read with regulation 17(1)(d) of the Financial Advisors Regulations and is a subsidiary of Motilal Oswal Securities Limited in India. This research is distributed in Singapore by Motilal Oswal Capital Markets Singapore Pte Limited and it is only directed in Singapore to accredited investors, as defined in the Financial Advisers Regulations and the Securities and Futures Act (Chapter 289), as amended from time to time. In respect of any matter arising from or in connection with the research you could contact the following representatives of Motilal Oswal Capital Markets Singapore Pte Limited: Nihar Oza Kadambari Balachandran niharoza.sg@motilaloswal.com kadambari.balachandran@motilaloswal.com Contact: (+65) Contact: (+65) / Office address: 21 (Suite 31), 16 Collyer Quay, Singapore Motilal Oswal Securities Ltd Motilal Oswal Tower, Level 9, Sayani Road, Prabhadevi, Mumbai Phone: reports@motilaloswal.com
Hardick Bora
 BSE Sensex S&P CNX 19,990 6,069 Bloomberg JOL IN Equity Shares (m) 159.3 M.Cap. (INR b)/(usd b) 26.0/0.5 52-Week Range (INR) 248/154 1,6,12 Rel. Perf. (%) -18/-28/-34 Financials & Valuation (INR b) Y/E
Niket Shah
 BSE Sensex S&P CNX 20,213 6,147 Bloomberg VGRD IN Equity Shares (m) 29.8 M.Cap. (INR b)/(usd b) 14.6/0.3 52-Week Range (INR) 591/180 1,6,12 Rel. Perf. (%) -8/-6/138 Financial summary (INR b) Y/E March
Sanjay Jain Pavas Pethia
 BSE Sensex S&P CNX 19,561 5,923 Bloomberg SAIL IN Equity Shares (m) 4,130.4 M.Cap. (INR b)/(usd b) 334.6/6.2 52-Week Range (INR) 116/76 1,6,12 Rel. Perf. (%) -11/-17/-38 Financials & Valuation (INR b)
Jinesh Gandhi Chirag Jain
 BSE Sensex S&P CNX 19,561 5,923 Bloomberg EIM IN Equity Shares (m) 27.0 M.Cap. (INR b)/(usd b) 72.0/1.3 52-Week Range 3,240/1,620 1,6,12 Rel. Perf. (%) -4/17/40 Financials & Valuation (INR b) Y/E Dec 2013E
Sohail Halai Alpesh Mehta
 BSE Sensex S&P CNX 20,039 6,064 Bloomberg IDBI IN Equity Shares (m) 1,278.4 M.Cap. (INR b)/(usd b) 144.9/2.7 52-Week Range (INR) 122/82 1,6,12 Rel.Perf.(%) -1/6/2 Financials & Valuation (INR b) Y/E March
CMP: INR350 TP: INR375 Downgrade to Neutral
 BSE Sensex S&P CNX 19,497 5,897 Bloomberg COAL IN Equity Shares (m) 6,316.4 M.Cap. (INR b)/(usd b) 2,211/41 52-Week Range (INR) 386/301 1,6,12 Rel. Perf. (%) 1/-11/-5 Financials & Valuation (INR b) Y/E
Titan Industries. CMP: INR222 TP: INR220 Neutral
 BSE SENSEX S&P CNX 17,257 5,241 Bloomberg TTAN IN Equity Shares (m) 887.8 52-Week Range (INR) 255/154 1,6,12 Rel. Perf. (%) -1/13/3 M.Cap. (Rs b) 197.1 M.Cap. (US$ b) 3.6 2 August 2012 1QFY13 Results Update
Pidilite Industries. CMP: INR164 TP: INR186 Buy
 BSE SENSEX S&P CNX 16,640 5,043 Bloomberg PIDI IN Equity Shares (m) 506.1 52-Week Range (INR) 188/134 1,6,12 Rel. Perf. (%) 1/20/5 M.Cap. (INR b) 83.0 M.Cap. (USD b) 1.5 27 July 2012 1QFY13 Results Update
Jubilant Foodworks. CMP: INR1,189 TP: INR1,0541,054 Neutral
 BSE SENSEX S&P CNX 16,846 5,110 Bloomberg JUBI IN Equity Shares (m) 63.5 52-Week Range (INR) 1,189/633 1,6,12 Rel. Perf. (%) 4/38/47 M.Cap. (INR b) 75.5 M.Cap. (USD b) 1.3 26 July 2012 1QFY13 Results Update
Siddharth Bothra
 BSE Sensex S&P CNX 19,152 5,797 Bloomberg CSTRL IN Equity Shares (m) 494.6 M.Cap. (INR b)/(usd b) 158/2.9 52-Week Range (INR) 338/223 1,6,12 Rel. Perf. (%) 12/-3/26 Financials & Valuation (INR b) Y/E March
Shoppers Stop. CMP: INR339 TP: INR355 Neutral
 BSE SENSEX S&P CNX 20,684 6,145 Bloomberg SHOP IN Equity Shares (m) 83.1 M.Cap. (INR b) / (USD b) 28.1/0.5 52-Week Range (INR) 494/331 1, 6, 12 Rel. Per (%) -7/-16/-28 Financials & Valuation (INR b) Y/E
Hardick Bora 4QCY12 Results Update Sector: Healthcare Sanofi India CMP: INR2,307 TP: INR2,015 Neutral
 BSE Sensex S&P CNX 19,332 5,855 Bloomberg SANL IN Equity Shares (m) 23.0 M.Cap. (INR b)/(usd b) 53.1/1.0 52-Week Range (INR) 2,450/2,002 1,6,12 Rel. Perf. (%) 9/-1/-4 Financials & Valuation (INR b) Y/E
Jinesh Gandhi Sandipan Pal
 BSE Sensex S&P CNX 20,224 6,157 Bloomberg BCORP IN Equity Shares (m) 77.0 M.Cap. (INR b)/(usd b) 20.5/0.4 52-Week Range (INR) 342/202 1,6,12 Rel. Perf. (%) 6/-15/-23 Financials & Valuation (INR b) Y/E
Idea Cellular. CMP: INR159 TP: INR200 Buy
 BSE SENSEX S&P CNX 19,164 5,678 Bloomberg IDEA IN Equity Shares (m) 3,316.2 M.Cap. (INR b) / (USD b) 513.7/8.4 52-Week Range (INR) 176/72 1, 6, 12 Rel. Per (%) 12/45/83 Financials & Valuation (INR Billion)
Jinesh Gandhi Chirag Jain
 BSE Sensex S&P CNX 19,722 5,995 Bloomberg EIM IN Equity Shares (m) 27.0 M.Cap. (INR b)/(usd b) 88.1/1.6 52-Week Range (INR) 3,285/1,620 1,6,12 Rel. Perf. (%) 10/20/36 Financials & Valuation (INR b) Y/E
Godrej Consumer Products
 BSE SENSEX S&P CNX 17,602 5,337 Bloomberg GCPL IN Equity Shares (m) 340.3 52-Week Range (INR) 658/370 1,6,12 Rel. Perf. (%) 5/37/42 M.Cap. (INR b) 205.9 M.Cap. (USD b) 3.7 7 August 2012 1QFY13 Results
Sandipan Pal QFY13 Results Update Sector: Real Estate Unitech CMP: INR29 TP: INR44 Buy
 BSE Sensex S&P CNX 19,608 5,933 Bloomberg UT IN Equity Shares (m) 2,438.8 M.Cap. (INR b)/(usd b) 70/1.3 52-Week Range (INR) 41/18 1,6,12 Rel. Perf. (%) -27/24/-13 Financials & Valuation (INR b) Y/E March
Urban demand revives; Akzo gaining market share
 BSE Sensex S&P CNX 22,095 6,601 CMP: INR889 26 March 2014 Update Sector: Consumer Not Rated Urban demand revives; Akzo gaining market share Reiterates focus on Profitable growth Urban demand for Decorative
Pantaloon Retail. CMP: INR177 TP: INR192 Neutral
 BSE SENSEX S&P CNX 17,773 5,390 Bloomberg PF IN Equity Shares (m) 217.1 52-Week Range (INR) 364/125 1,6,12 Rel. Perf. (%) 9/-49/-29 M.Cap. (Rs b) 38.4 M.Cap. (US$ b) 0.8 14 February 2012 2QFY12 Results
NTPC CMP: INR169 TP: INR191 Buy
 BSE SENSEX S&P CNX 18,625 5,664 Bloomberg NTPC IN Equity Shares (m) 8,245.5 52-Week Range (INR) 190/139 1,6,12 Rel. Perf. (%) 3/-4/-11 M.Cap. (INR b) 1,393.5 M.Cap. (USD b) 26.0 26 October 2012 2QFY13
Asian Paints. CMP: INR2,722 TP: INR3,161 Buy
 BSE SENSEX S&P CNX 16,739 5,049 Bloomberg APNT IN Equity Shares (m) 95.9 52-Week Range (INR) 3,366/2,395 1,6,12 Rel. Perf. (%) -5/-3/14 M.Cap. (INR b) 261.1 M.Cap. (USD b) 4.9 23 January 2012 3QFY12 Results
Stress test: Weak capital servicing ratios to drive pricing discipline
 Stress test: Weak capital servicing ratios to drive pricing discipline Operating performance near trough; expect gradual improvement 20 Update Cement Our analysis of a cross-section of cement companies
Sanofi India. CMP: INR2,200 TP: INR1,848 Neutral
 BSE SENSEX S&P CNX 16,846 5,110 Bloomberg SANL IN Equity Shares (m) 23.0 52-Week Range (INR) 2,430/1,980 1,6,12 Rel. Perf. (%) 3/-3/15 M.Cap. (INR b) 50.7 M.Cap. (USD b) 0.9 26 July 2012 2QCY12 Results
BGR Energy. CMP: INR282 TP: INR253 Neutral
 BSE SENSEX S&P CNX 17,413 5,283 Bloomberg BGRL IN Equity Shares (m) 72.0 52-Week Range (INR) 378/173 1,6,12 Rel. Perf. (%) -9/17/-22 M.Cap. (INR b) 20.3 M.Cap. (USD b) 0.4 6 August 2012 1QFY13 Results
Larsen & Toubro. CMP: INR1,160 TP: INR1,417 Buy
 BSE SENSEX S&P CNX 16,216 4,908 Bloomberg LT IN Equity Shares (m) 608.9 52-Week Range (INR) 1,868/971 1,6,12 Rel. Perf. (%) -4/-7/12 M.Cap. (INR b) 706.3 M.Cap. (USD b) 13.1 * Consolidated; EPS is fully
BGR Energy. CMP: INR266 TP: INR230 Neutral
 BSE SENSEX S&P CNX 18,562 5,645 Bloomberg BGRL IN Equity Shares (m) 72.0 52-Week Range (INR) 374/173 1,6,12 Rel. Perf. (%) -3/27/-24 M.Cap. (INR b) 19.2 M.Cap. (USD b) 0.4 3 November 2012 2QFY13 Results
Idea Cellular. CMP: INR81 TP: INR Under Review
 BSE SENSEX S&P CNX 16,918 5,128 Bloomberg IDEA IN Equity Shares (m) 3,308.8 52-Week Range (INR) 104/71 1,6,12 Rel. Perf. (%) 6/-13/4 M.Cap. (INR b) 268.0 M.Cap. (USD b) 4.8 25 July 2012 1QFY13 Results
Jaypee Infratech. CMP: INR33 TP: INR45 Buy
 BSE SENSEX S&P CNX 2,550,318 Bloomberg JPIN IN Equity Shares (m) 1,388.9 M.Cap. (INR b) / (USD b) 51.3/0.9 52-Week Range (INR) 2/1 1,, 12 Rel. Per (%) 1/9/-3 Financials & Valuation (INR m) Y/E Mar 201
Reliance Infrastructure CMP: INR528
 BSE SENSEX S&P CNX 17,657 5,363 16 August 2012 1QFY13 Results Update Sector: Utilities Reliance Infrastructure CMP: INR528 Buy Bloomberg RELI IN Equity Shares (m) 267.5 52-Week Range (INR) 680/328 1,6,12
IndusInd Bank. CMP: INR345 TP: INR419 Buy
 BSE SENSEX S&P CNX 17,504 5,332 Bloomberg IIB IN Equity Shares (m) 467.7 52-Week Range (INR) 352/222 1,6,12 Rel.Perf.(%) 13/25/34 M.Cap. (INR b) 161.4 M.Cap. (USD b) 3.1 20 April 2012 4QFY12 Results Update
Canara Bank. CMP: INR419 TP: INR525 Buy
 BSE SENSEX S&P CNX 18,817 5,724 Bloomberg CBK IN Equity Shares (m) 443.0 52-Week Range (INR) 566/349 1,6, 12 Rel.Perf.(%) -7/-18/-17 M.Cap. (INR b) 170.3 M.Cap. (USD b) 3.0 7 November 2012 2QFY13 Results
Hardick Bora QFY13 Results Update Sector: Healthcare Lupin CMP: INR725 TP: INR851 Buy
 BSE Sensex S&P CNX 19,990 6,069 Bloomberg LPC IN Equity Shares (m) 447.6 M.Cap. (INR b)/(usd b) 324.5/6.0 52-Week Range (INR) 739/507 1,6,12 Rel. Perf. (%) 9/18/13 Financials & Valuation (INR b) Y/E March
Dabur India. CMP: INR130 TP: INR135 Neutral
 BSE SENSEX S&P CNX 18,625 5,664 29 October 2012 2QFY13 Results Update Sector: Consumer Dabur India CMP: INR130 TP: INR135 Neutral Bloomberg DABUR IN Equity Shares (m) 1,740.7 52-Week Range (Rs) 139/92
Cross service charges at INR m/quarter
 BSE SENSEX S&P CNX 19,636 5,940 Cummins India CMP: INR504 TP: INR585 Buy LHP products to be an important growth driver Cross service charges at INR100-200m/quarter 20 February 2013 Update Sector: Capital
Punjab National Bank. CMP: INR716 TP: INR950 Buy
 BSE SENSEX S&P CNX 16,839 5,100 Bloomberg PNB IN Equity Shares (m) 339.2 52-Week Range (INR) 1,144/703 1,6,12 Rel.Perf.(%) -8/-24/-28 M.Cap. (INR b) 242.8 M.Cap. (USD b) 4.4 30 July 2012 1QFY13 Results
Alpesh Mehta Sohail Halai
 BSE Sensex S&P CNX 19,664 5,969 Bloomberg IIB IN Equity Shares (m) 521.8 M. Cap. (INR b)/(usd b) 227/4.1 52-Week Range (INR) 441/242 1,6,12 Rel.Perf.(%) 3/15/52 Financials & Valuation (INR b) Y/E March
BGR Energy. CMP: INR284 TP: INR296 Neutral
 BSE SENSEX S&P CNX 16,312 4,951 Bloomberg BGRL IN Equity Shares (m) 72.0 52-Week Range (INR) 512/173 1,6,12 Rel. Perf. (%) -8/8/-31 M.Cap. (INR b) 20.5 M.Cap. (USD b) 0.4 31 May 2012 4QFY12 Results Update
Unitech. CMP: INR20 TP: INR30 Buy
 BSE SENSEX S&P CNX 16,328 4,943 Bloomberg UT IN Equity Shares (m) 2,438.8 52-Week Range (INR) 38/17 1,6,12 Rel. Perf. (%) -25/-14/-34 M.Cap. (INR b) 48.8 M.Cap. (USD b) 0.9 16 May 2012 4QFY12 Results Update
Hardick Bora 4QFY13 Results Update Sector: Healthcare Dr Reddy's Laboratories CMP: INR2,026 TP: INR2,375 Buy
 BSE Sensex S&P CNX 19,772 5,995 Bloomberg DRRD IN Equity Shares (m) 169.2 M.Cap. (INR b)/(usd b) 344/6.3 52-Week Range (INR) 2,151/1,528 1,6,12 Rel. Perf. (%) -2/9/0 Financials & Valuation (INR b) Y/E
Strides Arcolab. CMP: INR717 TP: INR829 Buy
 BSE SENSEX S&P CNX 17,144 5,200 Bloomberg STR IN Equity Shares (m) 57.7 52-Week Range (INR) 794/276 1,6,12 Rel. Perf. (%) -2/37/98 M.Cap. (INR b) 41.4 M.Cap. (USD b) 0.7 31 July 2012 2QCY12 Results Update
Coal India CMP: INR348 TP: INR408 Buy
 BSE SENSEX S&P CNX 17,633 5,348 Bloomberg COAL IN Equity Shares (m) 6,316.4 52-Week Range (INR) 404/294 1,6,12 Rel. Perf. (%) -4/4/-15 M.Cap. (INR b) 2,198.1 M.Cap. (USD b) 39.7 14 August 2012 1QFY13 Results
JSW Steel. CMP: INR670 TP: INR391 Sell Merger with JSW Ispat
 BSE SENSEX S&P CNX 17,384 5,254 Bloomberg JSTL IN Equity Shares (m) 223.1 52-Week Range (INR) 885/464 1,6,12 Rel. Perf. (%) -5/-12/-10 M.Cap. (INR b) 149.5 M.Cap. (USD b) 2.7 Valuation summary (INR b)
Punjab National Bank. CMP:INR1,103 TP:INR1,500 Buy
 BSE SENSEX S&P CNX 18,210 5,488 28 July 2011 1QFY12 Results Update Sector: Banking Punjab National Bank CMP:INR1,103 TP:INR1,500 Buy Bloomberg PNB IN Equity Shares (m) 316.8 52-Week Range (INR) 1,395/971
IDBI Bank. CMP: INR106 TP: INR121 Neutral
 BSE SENSEX S&P CNX 17,207 5,223 Bloomberg IDBI IN Equity Shares (m) 1,278.4 52-Week Range (INR) 154/77 1,6,12 Rel.Perf.(%) -1/0/-7 M.Cap. (INR b) 135.5 M.Cap. (USD b) 2.6 24 April 2012 4QFY12 Results Update
CMP: INR121 TP: INR193 Buy
 BSE SENSEX S&P CNX 17,085 5,139 20 October 2011 2QFY12 Results Update Sector: Metals Hindustan Zinc CMP: INR121 TP: INR193 Buy Bloomberg HZ IN Equity Shares (m) 4,225.3 52-Week Range (INR) 155/109 1,6,12
Market share recovery, price hike, content leverage to drive growth
 BSE Sensex S&P CNX 24,377 7,276 Stock Info Bloomberg DITV IN Equity Shares (m) 1,064.8 52-Week Range (INR) 71/40 1, 6, 12 Rel. Per (%) 6/-15/-41 M.Cap. (INR b) 58.2 M.Cap. (USD b) 1.0 Financial Snapshot
Amara Raja Batteries. CMP: INR517 TP: INR560 Buy
 BSE SENSEX S&P CNX 25,665 7,672 Bloomberg AMRJ IN Equity Shares (m) 170.8 M.Cap. (INR b) / (USD b) 88.2/1.4 52-Week Range (INR) 520/208 1, 6, 12 Rel. Per (%) 5/21/97 Financials & Valuation (INR Million)
Jaiprakash Associates
 BSE SENSEX S&P CNX 16,312 4,951 Bloomberg JPA IN Equity Shares (m) 2,126.5 52-Week Range (INR) 89/50 1,6,12 Rel. Perf. (%) -14/-4/-17 M.Cap. (INR b) 127.9 M.Cap. (USD b) 2.3 31 May 2012 4QFY12 Results
Jinesh Gandhi Sandipan Pal
 BSE Sensex S&P CNX 19,895 6,035 Bloomberg GRASIM IN Equity Shares (m) 91.7 M.Cap. (INR b)/(usd b) 275.8/5.2 52-Week Range (INR) 3,511/2,216 1,6,12 Rel. Perf. (%) -8/-12/-1 Financials & Valuation (INR b)
Jinesh Gandhi Sandipan Pal
 BSE Sensex S&P CNX 19,576 5,944 Bloomberg GRASIM IN Equity Shares (m) 91.7 M.Cap. (INR b)/(usd b) 270.6/5.0 52-Week Range (INR) 3,511/2,216 1,6,12 Rel. Perf. (%) 2/-17/5 Financials & Valuation (INR b)
Petronet LNG. CMP: INR146 TP: INR205 Buy
 BSE SENSEX S&P CNX 17,236 5,229 Bloomberg PLNG IN Equity Shares (m) 750.0 52-Week Range (INR) 186/122 1,6,12 Rel. Perf. (%) 3/-11/-10 M.Cap. (INR b) 109.7 M.Cap. (USD b) 2.0 1 August 2012 1QFY13 Results
Godrej Properties. CMP: INR368 TP: INR420 Neutral
 BSE SENSEX S&P CNX 21,034 6,252 Bloomberg GPL IN Equity Shares (m) 99.6 M.Cap. (INR b) / (USD b) 36.4/ 0.7 52-Week Range (INR) 641/340 1, 6, 12 Rel. Per (%) -1/-44/-47 Financials & Valuation (INR b) Y/E
Larsen & Toubro. CMP: INR1,278 TP: INR1,380 Buy
 BSE SENSEX S&P CNX 16,786 5,050 Bloomberg LT IN Equity Shares (m) 608.9 52-Week Range (INR) 1,933/971 1,6,12 Rel. Perf. (%) 20/-19/-11 M.Cap. (INR b) 778.1 M.Cap. (USD b) 15.5 * Consolidated; EPS is fully
CPCB-2: Important long-term driver
 BSE Sensex S&P CNX 20,860 6,217 19 December 2013 Update Sector: Capital Goods Cummins India CMP: INR461 TP: INR540 Buy Stock Info Bloomberg KKC IN Equity Shares (m) 277.2 52-Week Range (INR) 550/365 1,
CMP: INR415 TP: INR 471 BUY
 04 Mar 2013 Update Sector: Technology Wipro CMP: INR415 TP: INR 471 BUY Pipeline and deal signings suggest improvement in growth; Multiple levers and focus on productivity will cushion margin headwinds
Godrej Consumer Products
 BSE SENSEX S&P CNX 18,755 5,698 Bloomberg GCPL IN Equity Shares (m) 340.3 52-Week Range (INR) 745/370 1,6,12 Rel. Perf. (%) 4/17/67 M.Cap. (INR b) 246.4 M.Cap. (USD b) 4.6 5 November 2012 2QFY13 Results
Jubilant Foodworks. CMP: INR1,051 TP: INR1,054 Neutral
 BSE SENSEX S&P CNX 16,420 4,966 Bloomberg JUBI IN Equity Shares (m) 63.5 52-Week Range (INR) 1,144/536 1,6,12 Rel. Perf. (%) -6/37/53 M.Cap. (INR b) 66.7 M.Cap. (USD b) 1.3 11 May 2012 4QFY12 Results Update
Godawari Power & Ispat
 BSE SENSEX S&P CNX CMP: INR103 TP: INR185 Buy 17,077 5,158 Bloomberg GODPI IN Equity Shares (m) 31.8 52-Week Range (INR) 200/70 1,6,12 Rel. Perf. (%) 32/-31/-33 M.Cap. (INR b) 3.3 M.Cap. (USD m) 65.3 Consolidated
Kotak Mahindra Bank. CMP: INR495 TP: INR429 Neutral
 BSE SENSEX S&P CNX 16,739 5,049 Bloomberg KMB IN Equity Shares (m) 689.3 52-Week Range 515/333 1,6,12 Rel.Perf.(%) 0/12/31 M.Cap. (Rs b) 340.5 M.Cap. (US$ b) 6.7 25 January 2012 3QFY12 Results Update Sector:
Kotak Mahindra Bank. CMP: INR626 TP: INR500 Neutral
 BSE SENSEX S&P CNX 18,759 5,705 Bloomberg KMB IN Equity Shares (m) 740.7 52-Week Range (INR) 652/418 1,6,12 Rel.Perf.(%) -3/-2/18 M.Cap. (INR b) 463.4 M.Cap. (USD b) 8.6 26 October 2012 2QFY13 Results
Torrent Pharmaceuticals
 BSE SENSEX S&P CNX 21,338 6,339 Bloomberg TRP IN Equity Shares (m) 169.2 M.Cap. (INR b) / (USD b) 80.4/1.3 52-Week Range (INR) 535/324 1, 6, 12 Rel.Per (%) 4/12/32 Financials & Valuation (INR Million)
Raymond. Restructuring initiatives bearing fruit; Land bank base case value INR147/share; Reiterate Buy. CMP: INR385 TP: INR462 Buy
 14 June 2012 Update Raymond CMP: INR385 TP: INR462 Buy Restructuring initiatives bearing fruit; Land bank base case value INR147/share; Reiterate Buy We met the management of Raymond (RW IN, Mkt Cap USD0.4b,
Just Dial. CMP: INR1,129 TP: INR1,475 Buy
 BSE SENSEX S&P CNX 23,871 7,109 Bloomberg JUST IN Equity Shares (m) 70.2 M.Cap. (INR b) / (USD b) 79.2/1.3 52-Week Range (INR) 1,774/589 1, 6, 12 Rel. Per (%) -18/-7/- Financials & Valuation (INR m) Y/E
Hindalco. CMP: INR113 TP: INR151 Buy
 BSE SENSEX S&P CNX 18,817 5,724 Bloomberg HNDL IN Equity Shares (m) 1,990.0 52-Week Range (INR) 165/100 1,6,12 Rel. Perf. (%) -9/-18/-26 M.Cap. (INR b) 224.9 M.Cap. (USD b) 4.1 Consolidated 2QFY13 Results
Shree Renuka Sugars. CMP: INR26 TP: INR45 Buy
 BSE SENSEX S&P CNX 16,219 4,924 1 June 2012 6QSY12 Results Update Sector: Sugar CMP: INR26 TP: INR45 Buy Bloomberg SHRS IN Equity Shares (m) 671.0 52-Week Range (INR) 76/23 1,6,12 Rel. Perf. (%) -10/-16/-45
Steel Authority of India
 BSE SENSEX S&P CNX 16,439 4,990 4QFY12 Results Update Sector: Metals Steel Authority of India CMP: INR93 TP: INR99 Sell Bloomberg SAIL IN Equity Shares (m) 4,130.4 52-Week Range (INR) 151/73 1,6,12 Rel.
Canara Bank. CMP: INR464 TP: INR645 Buy
 BSE SENSEX S&P CNX 17,234 5,205 Bloomberg CBK IN Equity Shares (m) 443.0 52-Week Range (INR) 672/349 1,6, 12 Rel.Perf.(%) 22/2/-13 M.Cap. (INR b) 205.6 M.Cap. (USD b) 4.1 31 January 2012 3QFY12 Results
M&M Financial Services
 BSE SENSEX S&P CNX 18,793 5,717 Bloomberg MMFS IN Equity Shares (m) 102.7 52-Week Range (INR) 938/590 1,6,12 Rel.Perf.(%) 7/24/30 M.Cap. (INR b) 90.7 M.Cap. (USD b) 1.7 23 October 2012 2QFY13 Results Update
Dabur India. CMP: INR106 TP: INR94 Neutral
 28 July 2011 1QFY12 Results Update Sector: FMCG BSE SENSEX S&P CNX 18,210 5,488 Dabur India CMP: INR106 TP: INR94 Neutral Bloomberg DABUR IN Equity Shares (m) 1,740.0 52-Week Range (INR) 122/87 1,6,12
CMP: INR320 TP: INR164(-49%) Sell Intending to exit UK execution is key!
 Sell Intending to exit UK execution is key!") 31 March 2016 Update Sector: Metals Tata Steel BSE SENSEX S&P CNX 25,342 7,738 Stock Info Bloomberg TATA IN Equity Shares (m) 971.2 52-Week Range (INR) 384/200 1, 6, 12 Rel. Per (%) 18/54/10 M.Cap. (INR
31 March 2016 Update Sector: Metals Tata Steel BSE SENSEX S&P CNX 25,342 7,738 Stock Info Bloomberg TATA IN Equity Shares (m) 971.2 52-Week Range (INR) 384/200 1, 6, 12 Rel. Per (%) 18/54/10 M.Cap. (INR
Individual Housing Loans: Rationalization of Risk-Weights and LTV Ratios
 8 October 2015 Sector Update Financials Individual Housing Loans: Rationalization of Risk-Weights and LTV Ratios Significant capital release for HFCs; Limited benefits for banks Event: RBI reduces risk
Axis Bank. CMP: INR1,119 TP: INR1,330 Buy
 BSE SENSEX S&P CNX 18,714 5,687 Bloomberg AXSB IN Equity Shares (m) 413.2 52-Week Range (INR) 1,309/785 1,6,12 Rel.Perf.(%) 9/-16/-8 M.Cap. (INR b) 462.4 M.Cap. (USD b) 8.7 16 October 2012 2QFY13 Results
Cummins India. CMP: INR430 TP: INR462 Neutral
 BSE SENSEX S&P CNX 16,070 4,870 Bloomberg KKC IN Equity Shares (m) 277.2 52-Week Range (INR) 515/322 1,6,12 Rel. Perf. (%) -3/30/-4 M.Cap. (INR b) 119.2 M.Cap. (USD b) 2.2 17 May 2012 4QFY12 Results Update
Automobiles. HMSI s expansion could result in short-term pressure on HMCL and BJAUT
 Sector Update Automobiles HMSI s expansion could result in short-term pressure on HMCL and BJAUT Valuations reasonable, but demand recovery key for stock performance Honda Motorcycle and Scooter India
Maruti Suzuki. CMP: INR1,395 TP: INR1,730 Buy
 BSE SENSEX S&P CNX 18,431 5,598 Bloomberg MSIL IN Diluted Equity Shares (m) 302.1 52-Week Range (INR) 1,498/906 1,6,12 Rel.Perf.(%) 5/-5/20 M.Cap. (INR b) 421.3 M.Cap. (USD b) 7.8 31 October 2012 2QFY13
Monnet Ispat. CMP: INR449 TP: INR518 Neutral
 4QFY12 Results Update Sector: Metals Monnet Ispat BSE SENSEX S&P CNX 16,328 4,943 CMP: INR449 TP: INR518 Neutral Bloomberg MISP IN Equity Shares (m) 64.4 52-Week Range (INR) 561/305 1,6,12 Rel. Perf. (%)
Cement. Demand to grow 8%, with cost push to be passed on CCI probe to have limited impact
 15 May 2012 Update Cement Demand to grow 8%, with cost push to be passed on CCI probe to have limited impact We met with senior managements of the large cement companies in India, to get perspective on
Punjab National Bank. CMP: INR940 TP: INR1,275 Buy
 BSE SENSEX S&P CNX 17,194 5,199 Bloomberg PNB IN Equity Shares (m) 316.8 52-Week Range (INR) 1,234/751 1,6,12 Rel.Perf.(%) 9/-10/-9 M.Cap. (INR b) 297.7 M.Cap. (USD b) 6.0 1 February 2012 3QFY12 Results
Oberoi Realty. CMP: INR269 TP: INR320 Buy
 BSE SENSEX S&P CNX 18,682 5,684 Bloomberg OBER IN Equity Shares (m) 328.2 52-Week Range (INR) 323/205 1,6,12 Rel. Perf. (%) 13/-7/7 M.Cap. (INR b) 88.3 M.Cap. (USD b) 1.6 22 October 2012 2QFY13 Results
PVR Ltd. CMP: INR685 TP: INR750 Buy
 BSE SENSEX S&P CNX 27,860 8,324 Bloomberg PVRL IN Equity Shares (m) 41.3 M.Cap. (INR b) / (USD b) 28.3/0.5 52-Week Range (INR) 747/465 1, 6, 12 Rel. Per (%) -6/9/-19 Financials & Valuation (INR Million)
CMP: INR124 TP: INR172 Buy. Benefit of two major motorcycle launches not priced in. Improved industry outlook and recent launch success drive upgrades
 BSE Sensex S&P CNX 24,717 7,359 Stock Info Bloomberg TVSL IN Equity Shares (m) 475.1 52-Week Range (INR) 138/28 1, 6, 12 Rel. Per (%) 34/111/210 M.Cap. (INR b) 59.1 M.Cap. (USD b) 1.0 Financial Snapshot
Oberoi Realty. CMP: INR240 TP: INR297 Buy
 BSE SENSEX S&P CNX 25,642 7,664 Bloomberg OBER IN Equity Shares (m) 328.2 M.Cap. (INR b) / (USD b) 78.8/1.3 52-Week Range (INR) 276/154 1, 6, 12 Rel. Per (%) -8/-7/-6 Financials & Valuation (INR m) Y/E
Punjab National Bank. CMP: INR768 TP: INR963 Buy
 BSE SENSEX S&P CNX 16,480 4,975 Bloomberg PNB IN Equity Shares (m) 339.2 52-Week Range (INR) 1,200/751 1,6,12 Rel.Perf.(%) -12/-16/-18 M.Cap. (INR b) 260.5 M.Cap. (USD b) 4.8 10 May 2012 4QFY12 Results
Hindustan Unilever. CMP:INR324 TP:INR302 Neutral
 BSE SENSEX S&P CNX 18,197 5,482 29 July 2011 1QFY12 Results Update Sector: FMCG Hindustan Unilever CMP:INR324 TP:INR302 Neutral Bloomberg HUVR IN Equity Shares (m) 2,159.5 52-Week Range (INR) 347/250 1,6,12
Godrej Properties. CMP: INR595 TP: INR635 Neutral
 BSE SENSEX S&P CNX 16,913 5,114 Bloomberg GPL IN Equity Shares (m) 78.0 52-Week Range 845/570 1,6,12 Rel. Perf. (%) 0/-9/-2 M.Cap. (INR b) 46.4 M.Cap. (USD b) 0.9 4QFY12 Results Update Sector: Real Estate
BHEL. CMP: INR227 TP: INR233 Neutral
 BSE SENSEX S&P CNX 18,636 5,666 Bloomberg BHEL IN Equity Shares (m) 2,447.6 52-Week Range (INR) 368/198 1,6,12 Rel. Perf. (%) -7/-7/-35 M.Cap. (INR b) 556.2 M.Cap. (USD b) 10.3 30 October 2012 2QFY13 Results
To voluntarily stop supplies to US
 BSE Sensex S&P CNX 26,272 7,831 24 July 2014 Update Sector: Healthcare Ipca Laboratories CMP: INR728 TP: INR930 Buy Stock Info Bloomberg IPCA IN Equity Shares (m) 126.2 52-Week Range (INR) 907/609 1, 6,
Axis Bank. CMP: INR1,008 TP: INR1,240 Buy
 BSE SENSEX S&P CNX 16,739 5,049 Bloomberg AXSB IN Equity Shares (m) 410.5 52-Week Range 1,461/785 1,6,12 Rel.Perf.(%) 11/-9/-9 M.Cap. (INR b) 413.8 M.Cap. (USD b) 8.2 20 January 2012 Results Update Sector:
Castrol India. CMP: INR407 TP: INR474 (+16%) Neutral
 Neutral") BSE SENSEX S&P CNX 23,089 7,019 Bloomberg CSTRL IN Equity Shares (m) 494.6 M.Cap. (INR b) / (USD b) 201/2.9 52-Week Range (INR) 518 / 370 1, 6, 12 Rel. Per (%) 3/3/6 Avg Val (INR m) 128 Free float (%)
BSE SENSEX S&P CNX 23,089 7,019 Bloomberg CSTRL IN Equity Shares (m) 494.6 M.Cap. (INR b) / (USD b) 201/2.9 52-Week Range (INR) 518 / 370 1, 6, 12 Rel. Per (%) 3/3/6 Avg Val (INR m) 128 Free float (%)
ONGC. CMP: INR402 TP: INR485 Buy
 BSE SENSEX S&P CNX 25,919 7,740 Bloomberg ONGC IN Equity Shares (m) 8,555.5 M.Cap. (INR b) / (USD b) 3,437.6/56.1 52-Week Range (INR) 472/234 1, 6, 12 Rel. Per (%) -4/19/11 Financials & Valuation (INR
Tribhovandas Bhimji Zaveri
 24 April 2012 Update CMP INR TP INR TRIBHOVANDAS BHIMJI ZAVERI Pure jewellery retail play with strong brand; Execution risks priced in; Subscribe (TBZ) is a pure play on the fast-growing branded jewellery
Eicher Motors. CMP: INR9,281 TP: INR11,401 Buy
 BSE SENSEX S&P CNX 25,881 7,727 Bloomberg EIM IN Equity Shares (m) 27.1 M.Cap. (INR b) / (USD b) 251.5/4.1 52-Week Range (INR) 9,350/2,975 1, 6, 12 Rel. Per (%) 9/83/144 Financials & Valuation (INR Million)
CMP: INR1,044 TP: INR970 (-7%) Neutral Sale of Healthcare business margin accretive
 Neutral Sale of Healthcare business margin accretive") BSE SENSEX S&P CNX 24,646 7,485 4 March 2016 Update Sector: Capital Goods Siemens CMP: INR1,044 TP: INR970 (-7%) Neutral Sale of Healthcare business margin accretive Stock Info Bloomberg SIEM IN Equity
BSE SENSEX S&P CNX 24,646 7,485 4 March 2016 Update Sector: Capital Goods Siemens CMP: INR1,044 TP: INR970 (-7%) Neutral Sale of Healthcare business margin accretive Stock Info Bloomberg SIEM IN Equity
Tata Power. CMP: INR111 TP: INR92 Neutral
 BSE SENSEX S&P CNX 17,749 5,382 Bloomberg TPWR IN Equity Shares (m) 2,373.3 52-Week Range (INR) 135/81 1,6,12 Rel. Perf. (%) 10/-5/-10 M.Cap. (INR b) 263.9 M.Cap. (USD b) 5.3 13 February 2012 3QFY12 Results
Britannia Industries. CMP: INR546 TP: INR605 Upgrade to Neutral Volume growth bottoms out; Upgrade to Neutral
 BSE SENSEX S&P CNX 19,016 5,783 Bloomberg BRIT IN Equity Shares (m) 119.5 M.Cap. (INR b)/(usd b) 65.2/1.2 52-Week Range (INR) 595/400 1,6,12 Rel. Perf. (%) 3/10/-13 Financials & Valuation (INR b) Y/E March
ECOSCOPE. Real GDP growth eases on lower net indirect taxes. The Economy Observer. Real GVA growth exactly as expected
 31 August 2016 ECOSCOPE The Economy Observer Real GDP growth eases on lower net indirect taxes Real GVA growth exactly as expected India s real gross domestic product (GDP) grew at the slowest pace in
Sun Pharmaceuticals. CMP: INR554 TP: INR614 Neutral
 BSE SENSEX S&P CNX 17,849 5,416 Bloomberg SUNP IN Equity Shares (m) 1,035.6 52-Week Range (INR) 566/404 1,6,12 Rel. Perf. (%) -3/10/31 M.Cap. (INR b) 573.7 M.Cap. (USD b) 11.6 15 February 2012 3QFY12 Results
CMP: INR826 TP: INR810 (-2%) Neutral
 Neutral") 8 December 2015 Update Sector: Consumer Hindustan Unilever BSE SENSEX S&P CNX 25,310 7,702 CMP: INR826 TP: INR810 (-2%) Neutral Maneuvering pricing in a deflationary environment Delayed winter a risk for
8 December 2015 Update Sector: Consumer Hindustan Unilever BSE SENSEX S&P CNX 25,310 7,702 CMP: INR826 TP: INR810 (-2%) Neutral Maneuvering pricing in a deflationary environment Delayed winter a risk for
CMP: INR475 TP: INR609 (+28%) Buy
 Buy") 10 April 2017 Update Sector: Automobiles Tata Motors BSE SENSEX S&P CNX 29,576 9,181 Stock Info Bloomberg TTMT IN Equity Shares (m) 3,395.9 52-Week Range (INR) 599 / 373 1, 6, 12 Rel. Per (%) -1/-21/8
10 April 2017 Update Sector: Automobiles Tata Motors BSE SENSEX S&P CNX 29,576 9,181 Stock Info Bloomberg TTMT IN Equity Shares (m) 3,395.9 52-Week Range (INR) 599 / 373 1, 6, 12 Rel. Per (%) -1/-21/8
Jindal Steel & Power. CMP: INR274 TP: INR379 Buy
 BSE SENSEX S&P CNX 25,665 7,672 Bloomberg JSP IN Equity Shares (m) 914.9 M.Cap. (INR b) / (USD b) 250.9/4.1 52-Week Range (INR) 350/190 1, 6, 12 Rel. Per (%) -15/-14/3 Financials & Valuation (INR Billion)