Jinesh Gandhi Sandipan Pal
|
|
|
- Josephine Short
- 5 years ago
- Views:
Transcription
 2/-17/5 Financials & Valuation (INR b) Y/E March 2013 2014E 2015E Sales 276.4 285.3 331.2 EBITDA 56.6 60.2 74.8 Adj. PAT 35.6 36.0 49.1 Adj. EPS (INR) 278.7 290.3 400.9 EPS Gr. (%) -3.4 4.2 38.")
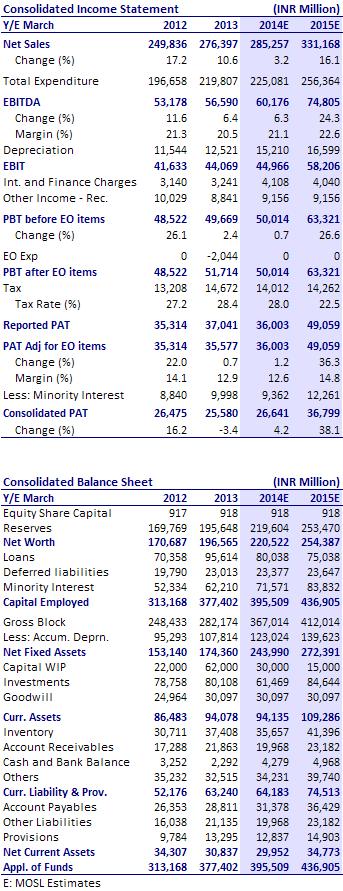
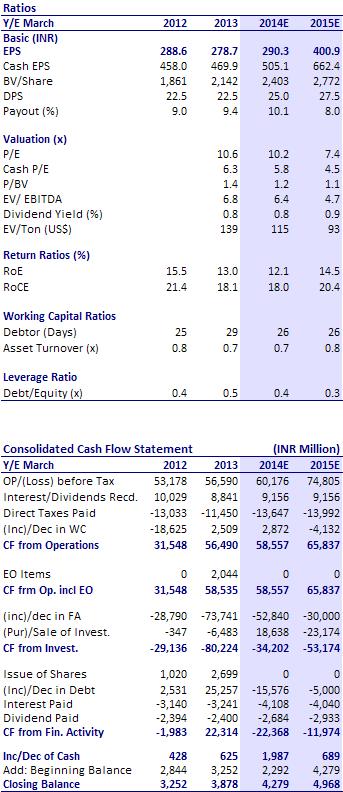
1 BSE Sensex S&P CNX 19,576 5,944 Bloomberg GRASIM IN Equity Shares (m) 91.7 M.Cap. (INR b)/(usd b) 270.6/ Week Range (INR) 3,511/2,216 1,6,12 Rel. Perf. (%) 2/-17/5 Financials & Valuation (INR b) Y/E March E 2015E Sales EBITDA Adj. PAT Adj. EPS (INR) EPS Gr. (%) BV/Sh. (INR) 2,142 2,403 2,772 RoE (%) RoCE (%) Payout (%) Valuations P/E (x) P/BV (x) EV/EBITDA (x) EV/Ton (x) May QFY13 Results Update Sector: Cement Grasim Industries CMP: INR2,950 TP: INR3,747 Buy Results below expectations: Grasim Industries posted lower than expected numbers for 4QFY13. Net sales declined 1% YoY (grew 13% QoQ) to INR13.8b (v/s our estimate of INR12.4b), EBITDA was flat YoY/QoQ at INR2.14b and PAT was down 13% YoY (~7.5% QoQ) to INR2.1b. EBITDA margin contracted 210bp QoQ (flat YoY) to 15.6% (v/s our estimate of 20.6%). Reported PAT of INR3.72b includes ~INR2.04b of profit on sale of its 15% stake in Alexandria Carbon Black and 2.75% stake in Thai Carbon Black to another AV Birla Group company. Terrace Bay losses impact consolidated performance: Consolidated net sales grew 5% YoY to INR75.5b. EBITDA declined 3.4% YoY to INR13.7b, with EBITDA margin contracting 170bp YoY to 19.3%. VSF PBIDT was INR2.04b (v/s INR1.62b in 3QFY12 and INR2.51b in 4QFY12), impacted by decline in realizations. Grasim's proportionate PBIDT losses at Terrace Bay (Canada) for 4QFY13/FY13 were INR273.1m/INR602.1m. Consolidated PAT grew 1% YoY to INR8.2b. VSF margins remain under pressure: VSF business volumes were in line, with 0.3% YoY growth to 95,161 tons (v/s estimate of 95,071 tons). Realizations declined 2% YoY/QoQ to INR119/kg (v/s estimate of INR120.5/kg). Weak realizations coupled with higher caustic soda prices impacted PBITDA margin, which declined 50bp QoQ and 110bp YoY to 17.8% (v/s estimate of 18.6%). Downgrading estimates; maintain Buy: We are downgrading our consolidated EPS estimates for FY14/FY15 by 14.3%/6.6% to INR290/INR401 to factor in weak realization trend in both VSF and Cement business. The stock trades at 7.4x FY15E consolidated EPS of INR401, 1x FY15E BV, and implied valuations of ~USD92/ton. The board has maintained dividend at INR22.5/share. Maintain Buy with a target price of INR3,747. Jinesh Gandhi (Jinesh@MotilalOswal.com) Sandipan Pal (Sandipan.Pal@MotilalOswal.com); Investors are advised to refer through disclosures made at the end of the Research Report.
2 Standalone EBITDA below estimates; non-core divestments boost PAT Net sales down 1% YoY (+13% QoQ) to INR13.8b (v/s est INR12.4b), EBITDA flat YoY/QoQ to INR2.14b and PAT down 13% YoY (~7.5% QoQ) to INR2.1b. EBITDA margin declined by 210bp QoQ (flat YoY) to 15.6% (v/s est 20.6%). It accounted for ~INR2.04b of profit on sale of its 15% stake in Alexandria Carbon Black Co and 2.75% stake in Thai Carbon Black to another A.V.Birla Group company. As a result, reported PAT was higher at INR3.72b. Consolidated net sales grew by 5% to INR75.5b, with EBITDA margin decline of 170bp YoY to 19.3%, EBITDA de-growth of 3.4% YoY to INR13.7b and PAT growth of 1% YoY to INR8.2b. Consolidated performance was impacted by ~INR240m PBIDT loss in Terrace Bay. Snapshot of consolidated performance (INR m) 4QFY13 4QFY12 % YoY 3QFY13 % QoQ Net Sales 75,525 72, , EBITDA 14,585 15, , EBIDT Margins (%) bp bp Adj.PAT 8,176 8, , Adj. EPS (INR) Source: Company, MOSL VSF business pressure on pricing continues VSF business volumes were in-line with 0.3% YoY growth to 95,161 tons (v/s est 95,071 tons). VSF realizations declined 2% YoY/QoQ to INR119/Kg (v/s est INR120.5/Kg). Weak realizations coupled with higher caustic prices impact PBITDA margins into 17.8% (-50bp QoQ v/s -110bp YoY v/s est 18.6%). On consolidated basis, PBIDT was at INR2.04b (v/s INR1.62b in 3QFY12 v/s INR2.51b in 4QFY12) was impacted YoY by decline in realizations. Grasim's proportionate losses at recently acquired pulp JV, AV Terrace Bay (Canada) for 4QFY13/FY13 were INR273.1m/INR602.1m. AV Terrace Bay, the pulp JV acquired in 2QFY13 with Grasim holding a 40%, commenced operations in Oct-12, as planned. Its losses are expected to reduce and converted into profit in a phased manner through mill up-gradation and cost optimization. VSF business performance 4QFY13 4QFY12 % YoY 3QFY13 % QoQ Production (ton) 85,992 83, , Sales volume (ton) 95,161 94, , Net Turnover (INR m) 12,164 12, , Avg Realizations (INR/ton) 119, , , PBIDT Margin (%) bp bp PBDIT (INR m) 2,160 2, , Source: Company, MOSL 6 May


3 Trend in VSF business volumes and realizations Trend in VSF business EBITDA Source: Company, MOSL Limited downside to pricing, upside dependent on cotton outlook and Chinese players rationality The management has indicated that amidst challenging near-term, it doesn't see any further downside to VSF pricing, as at current global VSF prices Chinese players would be making losses. The management indicated that current VSF pricing is slightly lower than 4QFY13 average pricing. Chinese players are operating at 65-68% utilizations. Hence it doesn't expect any further decline in VSF prices globally. While surplus capacity at China remains major overhang on margins, the outlook of cotton crop and rationality of Chinese players would be key to VSF pricing. Abnormally deficient rains in Karnataka, production at Harihar is likely to be impacted intermittently from February onwards till onset of monsoons, having impact of operating days between Feb-Jul'13. VSF worst is over; investing aggressively to consolidate leadership in both businesses; Capex plan on schedule; new capex of INR2.2b for Epoxy plant at Vilayat; VSF Outlook: Given the prevailing global economic conditions, coupled with the surplus capacity in China, the VSF industry is expected to remain under pressure in the short term. Despite recent improvement in cotton prices, VSF prices currently are subdued. Given the fragile global economy, recovery of textile sector is expected to be slow in near term. Present market conditions will require balancing between volumes and prices for expanded capacity. Its capex program to add ~156,500 ton is on track, with Harihar brownfield addition of 36,000 commissioning operations, whereas Vilayat Greenfield addition of 120,000 units by 2QFY14. Further, it is investing INR2.38b for setting up an Epoxy plant (51,500 TPA) at Vilayat, expected to be operational in 3QFY14. It plans to set-up Greenfield VSF capacity in Turkey through JV with other promoter owned companies (33% stake for INR567m). The JV has acquired requisite land and is in process of getting regulatory approvals including environment clearance. Also, it is capacity expansion of pulp capacity in Domsjo by 45,000 tons to 255,000 tons completed during 4QFY13 and is in under stabilization phase. Cement Outlook: In Cement, the demand is expected to grow by an average 8% in the long term with housing, infrastructure and allied spending being the key 6 May

4 value drivers. Industry capacity utilization is likely to improve to 80% in FY 2016 as the pace of capacity addition will slow down. Cost pressures are easing off with the decline in global commodity prices, particularly energy. It is setting-up 9.2MT capacity at Chhattisgarh and Karnataka, along with with split grinding units, split grinding units and packaging terminals. This capacity would be entirely operational by 1HFY14. It has already commenced Clinkerization unit of 3.3MT at Chhattisgarh, grinding units of 1.55MT and 0.6MT in Maharashtra and Gujarat, taking total cement capacity to 50.9MT. The board has approved fresh brownfield capacity addition of 2.9mt at Rajasthan (incl 2 split grinding units) with capex of INR20b and commissioning by Mar-15, taking total capacity in India to 61.45mt. Total cement capex for the above stood at INR114b (INR40.6b in FY14) Capex of ~INR53b in FY14 both cement and VSF business (INR Cr) Valuation and view We are downgrading FY14/15 EPS consol estimates by 14.3%/6.6% to INR290/INR401, to factor in weak realization trend in both VSF and Cement business (Ultratech EPS downgraded by 18%/10% for FY14/15). VSF business is expected to have bottomed-out on pricing and profitability; however recovery would be function of demand recovery and/or competing fibre pricing (which are at unsustainable levels). Cement business outlook is improving with expected improvement in demand and pricing. Further, its aggressive capex plan of investing INR86b over FY14-16 endorses our long term positive outlook for both the businesses. The stock trades at 7.4x FY15 Consol EPS of INR401, and 1.1x P/B and implied valuations of ~USD93/ton. Maintain Buy with target price of INR3,747 (SOTP based, valuing economic interest in cement business at 9x EV/EBITDA & 20% hold-co discount and VSF at 4x EV/ EBITDA). 6 May
5 Grasim (Consolidated): Revised forecast (INR b) FY14E FY15E Rev Old Chg (%) Rev Old Chg (%) Net Sales Net Profit EPS (INR) Source: MOSL Grasim: SOTP based fair value (INR m) Parameter Multiple FY14E FY15E Standalone VSF business EV/EBITDA (x) 4 41,340 49,859 UltraTech 60.3% EV/EBITDA (x) 9 207, ,406 (post 20% holdco discount) Total EV 248, ,265 Less: Gross Debt (incl pro-rata in subs) 60,551 57,536 Add: Cash & liquid invest 37,534 59,311 Add: Group 20% discount 30,590 30,590 Total Equity Value 256, ,630 Fair value (INR/sh) post demerger 2,792 3,747 Source: MOSL Implied Hold-co discount FY14E FY15E CMP 2,950 2,950 Market Cap 270, ,579 Add: Net Debt -7,573-32,365 EV 263, ,214 Less: EV of 4x EV/EBITDA 41,340 49,859 Implied EV of Cement 221, ,355 Implied EV/EBITDA (x) Implied EV/Ton (USD) Implied Discount to UltraTech on replacement cost (%) ACC/Ambuja on replacement cost (%) UltraTech on EV/EBITDA (%) ACC/Ambuja on EV/EBITDA (%) Source: MOSL 6 May
6 Grasim Industries: an investment profile Company description Grasim is a diversified company with cement and VSF being core business, accounting for 65% and 35% of revenues (post-restructuring). Its other business includes chemicals and textiles. The acquisition of UltraTech Cement, the cement division of L&T, by Grasim catapulted it to number one position in the Indian cement industry with total capacity under control of 51mt. Key investment argument Being largest player with total capacity of 51MT (existing capacity) under control and highest organic growth visibility, Grasim would be biggest beneficiary of any further increase in cement price. Global leader in VSF business, with backward integration in pulp, experiencing robust demand in both global and domestic markets. Key investment risks Cement sector is likely to add huge capacities in coming year which can result in significant volatility in cement prices. Declining competing fibre prices coupled with increasing cost would put pressure on VSF business profitability Recent development The board has maintained dividend at INR22.5/share. Valuation and view The stock trades at 7.4x FY15 Consol EPS of INR401, and 1.1x P/B and implied valuations of ~USD93/ton. Maintain Buy with target price of INR3,747 (SOTP based, valuing economic interest in cement business at 9x EV/EBITDA & 20% hold-co discount and VSF at 4x EV/EBITDA). Sector view We believe we have already witnessed bottom-ofthe-cycle utilization & profitability, and it should gradually improve hereon given sustainable demand drivers. Structural increase in cost base would necessitate higher cement prices. Continued revival in cement demand, witnessed in 2HFY12, would be key catalyst for the stock performance. Comparative valuations Grasim ACC ACEM P/E (x) FY14E FY15E P/BV (x) FY14E FY15E EV/Ton (USD) FY14E FY15E EV/EBITDA (x) FY14E FY15E EPS: MOSL forecast v/s consensus (INR) MOSL Consensus Variation Forecast Forecast (%) FY FY Target price and recommendation Current Target Upside Reco. Price (INR) Price (INR) (%) 2,950 3, Buy Stock performance (1 year) Shareholding pattern (%) Mar-13 Dec-12 Mar-12 Promoter Domestic Inst Foreign Others May
7 Financials and Valuation 6 May
8 Disclosures This report is for personal information of the authorized recipient and does not construe to be any investment, legal or taxation advice to you. This research report does not constitute an offer, invitation or inducement to invest in securities or other investments and Motilal Oswal Securities Limited (hereinafter referred as MOSt) is not soliciting any action based upon it. This report is not for public distribution and has been furnished to you solely for your information and should not be reproduced or redistributed to any other person in any form. Unauthorized disclosure, use, dissemination or copying (either whole or partial) of this information, is prohibited. The person accessing this information specifically agrees to exempt MOSt or any of its affiliates or employees from, any and all responsibility/liability arising from such misuse and agrees not to hold MOSt or any of its affiliates or employees responsible for any such misuse and further agrees to hold MOSt or any of its affiliates or employees free and harmless from all losses, costs, damages, expenses that may be suffered by the person accessing this information due to any errors and delays. The information contained herein is based on publicly available data or other sources believed to be reliable. While we would endeavour to update the information herein on reasonable basis, MOSt and/or its affiliates are under no obligation to update the information. Also there may be regulatory, compliance, or other reasons that may prevent MOSt and/or its affiliates from doing so. MOSt or any of its affiliates or employees shall not be in any way responsible and liable for any loss or damage that may arise to any person from any inadvertent error in the information contained in this report. MOSt or any of its affiliates or employees do not provide, at any time, any express or implied warranty of any kind, regarding any matter pertaining to this report, including without limitation the implied warranties of merchantability, fitness for a particular purpose, and non-infringement. The recipients of this report should rely on their own investigations. This report is intended for distribution to institutional investors. Recipients who are not institutional investors should seek advice of their independent financial advisor prior to taking any investment decision based on this report or for any necessary explanation of its contents. MOSt and/or its affiliates and/or employees may have interests/positions, financial or otherwise in the securities mentioned in this report. To enhance transparency, MOSt has incorporated a Disclosure of Interest Statement in this document. This should, however, not be treated as endorsement of the views expressed in the report. Disclosure of Interest Statement Grasim Industries 1. Analyst ownership of the stock No 2. Group/Directors ownership of the stock No 3. Broking relationship with company covered No 4. Investment Banking relationship with company covered No Analyst Certification The views expressed in this research report accurately reflect the personal views of the analyst(s) about the subject securities or issues, and no part of the compensation of the research analyst(s) was, is, or will be directly or indirectly related to the specific recommendations and views expressed by research analyst(s) in this report. The research analysts, strategists, or research associates principally responsible for preparation of MOSt research receive compensation based upon various factors, including quality of research, investor client feedback, stock picking, competitive factors and firm revenues. Regional Disclosures (outside India) This report is not directed or intended for distribution to or use by any person or entity resident in a state, country or any jurisdiction, where such distribution, publication, availability or use would be contrary to law, regulation or which would subject MOSt & its group companies to registration or licensing requirements within such jurisdictions. For U.K. This report is intended for distribution only to persons having professional experience in matters relating to investments as described in Article 19 of the Financial Services and Markets Act 2000 (Financial Promotion) Order 2005 (referred to as "investment professionals"). This document must not be acted on or relied on by persons who are not investment professionals. Any investment or investment activity to which this document relates is only available to investment professionals and will be engaged in only with such persons. For U.S. Motilal Oswal Securities Limited (MOSL) is not a registered broker - dealer under the U.S. Securities Exchange Act of 1934, as amended (the"1934 act") and under applicable state laws in the United States. In addition MOSL is not a registered investment adviser under the U.S. Investment Advisers Act of 1940, as amended (the "Advisers Act" and together with the 1934 Act, the "Acts), and under applicable state laws in the United States. Accordingly, in the absence of specific exemption under the Acts, any brokerage and investment services provided by MOSL, including the products and services described herein are not available to or intended for U.S. persons. This report is intended for distribution only to "Major Institutional Investors" as defined by Rule 15a-6(b)(4) of the Exchange Act and interpretations thereof by SEC (henceforth referred to as "major institutional investors"). This document must not be acted on or relied on by persons who are not major institutional investors. Any investment or investment activity to which this document relates is only available to major institutional investors and will be engaged in only with major institutional investors. In reliance on the exemption from registration provided by Rule 15a-6 of the U.S. Securities Exchange Act of 1934, as amended (the "Exchange Act") and interpretations thereof by the U.S. Securities and Exchange Commission ("SEC") in order to conduct business with Institutional Investors based in the U.S., MOSL has entered into a chaperoning agreement with a U.S. registered broker-dealer, Motilal Oswal Securities International Private Limited. ("MOSIPL"). Any business interaction pursuant to this report will have to be executed within the provisions of this chaperoning agreement. The Research Analysts contributing to the report may not be registered /qualified as research analyst with FINRA. Such research analyst may not be associated persons of the U.S. registered broker-dealer, MOSIPL, and therefore, may not be subject to NASD rule 2711 and NYSE Rule 472 restrictions on communication with a subject company, public appearances and trading securities held by a research analyst account. For Singapore Motilal Oswal Capital Markets Singapore Pte Limited is acting as an exempt financial advisor under section 23(1)(f) of the Financial Advisers Act(FAA) read with regulation 17(1)(d) of the Financial Advisors Regulations and is a subsidiary of Motilal Oswal Securities Limited in India. This research is distributed in Singapore by Motilal Oswal Capital Markets Singapore Pte Limited and it is only directed in Singapore to accredited investors, as defined in the Financial Advisers Regulations and the Securities and Futures Act (Chapter 289), as amended from time to time. In respect of any matter arising from or in connection with the research you could contact the following representatives of Motilal Oswal Capital Markets Singapore Pte Limited: Nihar Oza Kadambari Balachandran niharoza.sg@motilaloswal.com kadambari.balachandran@motilaloswal.com Contact: (+65) Contact: (+65) / Office address: 21 (Suite 31), 16 Collyer Quay, Singapore Motilal Oswal Securities Ltd Motilal Oswal Tower, Level 9, Sayani Road, Prabhadevi, Mumbai Phone: reports@motilaloswal.com
Jinesh Gandhi Sandipan Pal
 BSE Sensex S&P CNX 19,895 6,035 Bloomberg GRASIM IN Equity Shares (m) 91.7 M.Cap. (INR b)/(usd b) 275.8/5.2 52-Week Range (INR) 3,511/2,216 1,6,12 Rel. Perf. (%) -8/-12/-1 Financials & Valuation (INR b)
Jinesh Gandhi Sandipan Pal
 BSE Sensex S&P CNX 20,224 6,157 Bloomberg BCORP IN Equity Shares (m) 77.0 M.Cap. (INR b)/(usd b) 20.5/0.4 52-Week Range (INR) 342/202 1,6,12 Rel. Perf. (%) 6/-15/-23 Financials & Valuation (INR b) Y/E
Hardick Bora
 BSE Sensex S&P CNX 19,990 6,069 Bloomberg JOL IN Equity Shares (m) 159.3 M.Cap. (INR b)/(usd b) 26.0/0.5 52-Week Range (INR) 248/154 1,6,12 Rel. Perf. (%) -18/-28/-34 Financials & Valuation (INR b) Y/E
Sanjay Jain Pavas Pethia
 BSE Sensex S&P CNX 19,561 5,923 Bloomberg SAIL IN Equity Shares (m) 4,130.4 M.Cap. (INR b)/(usd b) 334.6/6.2 52-Week Range (INR) 116/76 1,6,12 Rel. Perf. (%) -11/-17/-38 Financials & Valuation (INR b)
Stress test: Weak capital servicing ratios to drive pricing discipline
 Stress test: Weak capital servicing ratios to drive pricing discipline Operating performance near trough; expect gradual improvement 20 Update Cement Our analysis of a cross-section of cement companies
Niket Shah
 BSE Sensex S&P CNX 20,213 6,147 Bloomberg VGRD IN Equity Shares (m) 29.8 M.Cap. (INR b)/(usd b) 14.6/0.3 52-Week Range (INR) 591/180 1,6,12 Rel. Perf. (%) -8/-6/138 Financial summary (INR b) Y/E March
CMP: INR350 TP: INR375 Downgrade to Neutral
 BSE Sensex S&P CNX 19,497 5,897 Bloomberg COAL IN Equity Shares (m) 6,316.4 M.Cap. (INR b)/(usd b) 2,211/41 52-Week Range (INR) 386/301 1,6,12 Rel. Perf. (%) 1/-11/-5 Financials & Valuation (INR b) Y/E
Sohail Halai Alpesh Mehta
 BSE Sensex S&P CNX 20,039 6,064 Bloomberg IDBI IN Equity Shares (m) 1,278.4 M.Cap. (INR b)/(usd b) 144.9/2.7 52-Week Range (INR) 122/82 1,6,12 Rel.Perf.(%) -1/6/2 Financials & Valuation (INR b) Y/E March
Jinesh Gandhi Chirag Jain
 BSE Sensex S&P CNX 19,561 5,923 Bloomberg EIM IN Equity Shares (m) 27.0 M.Cap. (INR b)/(usd b) 72.0/1.3 52-Week Range 3,240/1,620 1,6,12 Rel. Perf. (%) -4/17/40 Financials & Valuation (INR b) Y/E Dec 2013E
Sandipan Pal QFY13 Results Update Sector: Real Estate Unitech CMP: INR29 TP: INR44 Buy
 BSE Sensex S&P CNX 19,608 5,933 Bloomberg UT IN Equity Shares (m) 2,438.8 M.Cap. (INR b)/(usd b) 70/1.3 52-Week Range (INR) 41/18 1,6,12 Rel. Perf. (%) -27/24/-13 Financials & Valuation (INR b) Y/E March
Birla Corporation. CMP: INR216 TP: INR277 Buy
 BSE SENSEX S&P CNX 16,839 5,100 Bloomberg BCORP IN Equity Shares (m) 77.0 52-Week Range (INR) 348/211 1,6,12 Rel. Perf. (%) -5/-19/-25 M.Cap. (INR b) 16.6 M.Cap. (USD b) 0.3 30 July 2012 1QFY13 Results
Idea Cellular. CMP: INR159 TP: INR200 Buy
 BSE SENSEX S&P CNX 19,164 5,678 Bloomberg IDEA IN Equity Shares (m) 3,316.2 M.Cap. (INR b) / (USD b) 513.7/8.4 52-Week Range (INR) 176/72 1, 6, 12 Rel. Per (%) 12/45/83 Financials & Valuation (INR Billion)
NTPC CMP: INR169 TP: INR191 Buy
 BSE SENSEX S&P CNX 18,625 5,664 Bloomberg NTPC IN Equity Shares (m) 8,245.5 52-Week Range (INR) 190/139 1,6,12 Rel. Perf. (%) 3/-4/-11 M.Cap. (INR b) 1,393.5 M.Cap. (USD b) 26.0 26 October 2012 2QFY13
Pidilite Industries. CMP: INR164 TP: INR186 Buy
 BSE SENSEX S&P CNX 16,640 5,043 Bloomberg PIDI IN Equity Shares (m) 506.1 52-Week Range (INR) 188/134 1,6,12 Rel. Perf. (%) 1/20/5 M.Cap. (INR b) 83.0 M.Cap. (USD b) 1.5 27 July 2012 1QFY13 Results Update
Siddharth Bothra
 BSE Sensex S&P CNX 19,152 5,797 Bloomberg CSTRL IN Equity Shares (m) 494.6 M.Cap. (INR b)/(usd b) 158/2.9 52-Week Range (INR) 338/223 1,6,12 Rel. Perf. (%) 12/-3/26 Financials & Valuation (INR b) Y/E March
Larsen & Toubro. CMP: INR1,160 TP: INR1,417 Buy
 BSE SENSEX S&P CNX 16,216 4,908 Bloomberg LT IN Equity Shares (m) 608.9 52-Week Range (INR) 1,868/971 1,6,12 Rel. Perf. (%) -4/-7/12 M.Cap. (INR b) 706.3 M.Cap. (USD b) 13.1 * Consolidated; EPS is fully
Titan Industries. CMP: INR222 TP: INR220 Neutral
 BSE SENSEX S&P CNX 17,257 5,241 Bloomberg TTAN IN Equity Shares (m) 887.8 52-Week Range (INR) 255/154 1,6,12 Rel. Perf. (%) -1/13/3 M.Cap. (Rs b) 197.1 M.Cap. (US$ b) 3.6 2 August 2012 1QFY13 Results Update
BGR Energy. CMP: INR282 TP: INR253 Neutral
 BSE SENSEX S&P CNX 17,413 5,283 Bloomberg BGRL IN Equity Shares (m) 72.0 52-Week Range (INR) 378/173 1,6,12 Rel. Perf. (%) -9/17/-22 M.Cap. (INR b) 20.3 M.Cap. (USD b) 0.4 6 August 2012 1QFY13 Results
CMP: INR121 TP: INR193 Buy
 BSE SENSEX S&P CNX 17,085 5,139 20 October 2011 2QFY12 Results Update Sector: Metals Hindustan Zinc CMP: INR121 TP: INR193 Buy Bloomberg HZ IN Equity Shares (m) 4,225.3 52-Week Range (INR) 155/109 1,6,12
Hardick Bora 4QCY12 Results Update Sector: Healthcare Sanofi India CMP: INR2,307 TP: INR2,015 Neutral
 BSE Sensex S&P CNX 19,332 5,855 Bloomberg SANL IN Equity Shares (m) 23.0 M.Cap. (INR b)/(usd b) 53.1/1.0 52-Week Range (INR) 2,450/2,002 1,6,12 Rel. Perf. (%) 9/-1/-4 Financials & Valuation (INR b) Y/E
Reliance Infrastructure CMP: INR528
 BSE SENSEX S&P CNX 17,657 5,363 16 August 2012 1QFY13 Results Update Sector: Utilities Reliance Infrastructure CMP: INR528 Buy Bloomberg RELI IN Equity Shares (m) 267.5 52-Week Range (INR) 680/328 1,6,12
Jaypee Infratech. CMP: INR33 TP: INR45 Buy
 BSE SENSEX S&P CNX 2,550,318 Bloomberg JPIN IN Equity Shares (m) 1,388.9 M.Cap. (INR b) / (USD b) 51.3/0.9 52-Week Range (INR) 2/1 1,, 12 Rel. Per (%) 1/9/-3 Financials & Valuation (INR m) Y/E Mar 201
Asian Paints. CMP: INR2,722 TP: INR3,161 Buy
 BSE SENSEX S&P CNX 16,739 5,049 Bloomberg APNT IN Equity Shares (m) 95.9 52-Week Range (INR) 3,366/2,395 1,6,12 Rel. Perf. (%) -5/-3/14 M.Cap. (INR b) 261.1 M.Cap. (USD b) 4.9 23 January 2012 3QFY12 Results
Unitech. CMP: INR20 TP: INR30 Buy
 BSE SENSEX S&P CNX 16,328 4,943 Bloomberg UT IN Equity Shares (m) 2,438.8 52-Week Range (INR) 38/17 1,6,12 Rel. Perf. (%) -25/-14/-34 M.Cap. (INR b) 48.8 M.Cap. (USD b) 0.9 16 May 2012 4QFY12 Results Update
BGR Energy. CMP: INR266 TP: INR230 Neutral
 BSE SENSEX S&P CNX 18,562 5,645 Bloomberg BGRL IN Equity Shares (m) 72.0 52-Week Range (INR) 374/173 1,6,12 Rel. Perf. (%) -3/27/-24 M.Cap. (INR b) 19.2 M.Cap. (USD b) 0.4 3 November 2012 2QFY13 Results
Jinesh Gandhi Chirag Jain
 BSE Sensex S&P CNX 19,722 5,995 Bloomberg EIM IN Equity Shares (m) 27.0 M.Cap. (INR b)/(usd b) 88.1/1.6 52-Week Range (INR) 3,285/1,620 1,6,12 Rel. Perf. (%) 10/20/36 Financials & Valuation (INR b) Y/E
Jubilant Foodworks. CMP: INR1,189 TP: INR1,0541,054 Neutral
 BSE SENSEX S&P CNX 16,846 5,110 Bloomberg JUBI IN Equity Shares (m) 63.5 52-Week Range (INR) 1,189/633 1,6,12 Rel. Perf. (%) 4/38/47 M.Cap. (INR b) 75.5 M.Cap. (USD b) 1.3 26 July 2012 1QFY13 Results Update
Canara Bank. CMP: INR419 TP: INR525 Buy
 BSE SENSEX S&P CNX 18,817 5,724 Bloomberg CBK IN Equity Shares (m) 443.0 52-Week Range (INR) 566/349 1,6, 12 Rel.Perf.(%) -7/-18/-17 M.Cap. (INR b) 170.3 M.Cap. (USD b) 3.0 7 November 2012 2QFY13 Results
Coal India CMP: INR348 TP: INR408 Buy
 BSE SENSEX S&P CNX 17,633 5,348 Bloomberg COAL IN Equity Shares (m) 6,316.4 52-Week Range (INR) 404/294 1,6,12 Rel. Perf. (%) -4/4/-15 M.Cap. (INR b) 2,198.1 M.Cap. (USD b) 39.7 14 August 2012 1QFY13 Results
IndusInd Bank. CMP: INR345 TP: INR419 Buy
 BSE SENSEX S&P CNX 17,504 5,332 Bloomberg IIB IN Equity Shares (m) 467.7 52-Week Range (INR) 352/222 1,6,12 Rel.Perf.(%) 13/25/34 M.Cap. (INR b) 161.4 M.Cap. (USD b) 3.1 20 April 2012 4QFY12 Results Update
Godawari Power & Ispat
 BSE SENSEX S&P CNX CMP: INR103 TP: INR185 Buy 17,077 5,158 Bloomberg GODPI IN Equity Shares (m) 31.8 52-Week Range (INR) 200/70 1,6,12 Rel. Perf. (%) 32/-31/-33 M.Cap. (INR b) 3.3 M.Cap. (USD m) 65.3 Consolidated
BGR Energy. CMP: INR284 TP: INR296 Neutral
 BSE SENSEX S&P CNX 16,312 4,951 Bloomberg BGRL IN Equity Shares (m) 72.0 52-Week Range (INR) 512/173 1,6,12 Rel. Perf. (%) -8/8/-31 M.Cap. (INR b) 20.5 M.Cap. (USD b) 0.4 31 May 2012 4QFY12 Results Update
Jaiprakash Associates
 BSE SENSEX S&P CNX 16,312 4,951 Bloomberg JPA IN Equity Shares (m) 2,126.5 52-Week Range (INR) 89/50 1,6,12 Rel. Perf. (%) -14/-4/-17 M.Cap. (INR b) 127.9 M.Cap. (USD b) 2.3 31 May 2012 4QFY12 Results
Idea Cellular. CMP: INR81 TP: INR Under Review
 BSE SENSEX S&P CNX 16,918 5,128 Bloomberg IDEA IN Equity Shares (m) 3,308.8 52-Week Range (INR) 104/71 1,6,12 Rel. Perf. (%) 6/-13/4 M.Cap. (INR b) 268.0 M.Cap. (USD b) 4.8 25 July 2012 1QFY13 Results
Shree Renuka Sugars. CMP: INR26 TP: INR45 Buy
 BSE SENSEX S&P CNX 16,219 4,924 1 June 2012 6QSY12 Results Update Sector: Sugar CMP: INR26 TP: INR45 Buy Bloomberg SHRS IN Equity Shares (m) 671.0 52-Week Range (INR) 76/23 1,6,12 Rel. Perf. (%) -10/-16/-45
Godrej Consumer Products
 BSE SENSEX S&P CNX 17,602 5,337 Bloomberg GCPL IN Equity Shares (m) 340.3 52-Week Range (INR) 658/370 1,6,12 Rel. Perf. (%) 5/37/42 M.Cap. (INR b) 205.9 M.Cap. (USD b) 3.7 7 August 2012 1QFY13 Results
Sanofi India. CMP: INR2,200 TP: INR1,848 Neutral
 BSE SENSEX S&P CNX 16,846 5,110 Bloomberg SANL IN Equity Shares (m) 23.0 52-Week Range (INR) 2,430/1,980 1,6,12 Rel. Perf. (%) 3/-3/15 M.Cap. (INR b) 50.7 M.Cap. (USD b) 0.9 26 July 2012 2QCY12 Results
IDBI Bank. CMP: INR106 TP: INR121 Neutral
 BSE SENSEX S&P CNX 17,207 5,223 Bloomberg IDBI IN Equity Shares (m) 1,278.4 52-Week Range (INR) 154/77 1,6,12 Rel.Perf.(%) -1/0/-7 M.Cap. (INR b) 135.5 M.Cap. (USD b) 2.6 24 April 2012 4QFY12 Results Update
Larsen & Toubro. CMP: INR1,278 TP: INR1,380 Buy
 BSE SENSEX S&P CNX 16,786 5,050 Bloomberg LT IN Equity Shares (m) 608.9 52-Week Range (INR) 1,933/971 1,6,12 Rel. Perf. (%) 20/-19/-11 M.Cap. (INR b) 778.1 M.Cap. (USD b) 15.5 * Consolidated; EPS is fully
Amara Raja Batteries. CMP: INR517 TP: INR560 Buy
 BSE SENSEX S&P CNX 25,665 7,672 Bloomberg AMRJ IN Equity Shares (m) 170.8 M.Cap. (INR b) / (USD b) 88.2/1.4 52-Week Range (INR) 520/208 1, 6, 12 Rel. Per (%) 5/21/97 Financials & Valuation (INR Million)
Punjab National Bank. CMP: INR716 TP: INR950 Buy
 BSE SENSEX S&P CNX 16,839 5,100 Bloomberg PNB IN Equity Shares (m) 339.2 52-Week Range (INR) 1,144/703 1,6,12 Rel.Perf.(%) -8/-24/-28 M.Cap. (INR b) 242.8 M.Cap. (USD b) 4.4 30 July 2012 1QFY13 Results
Market share recovery, price hike, content leverage to drive growth
 BSE Sensex S&P CNX 24,377 7,276 Stock Info Bloomberg DITV IN Equity Shares (m) 1,064.8 52-Week Range (INR) 71/40 1, 6, 12 Rel. Per (%) 6/-15/-41 M.Cap. (INR b) 58.2 M.Cap. (USD b) 1.0 Financial Snapshot
Punjab National Bank. CMP:INR1,103 TP:INR1,500 Buy
 BSE SENSEX S&P CNX 18,210 5,488 28 July 2011 1QFY12 Results Update Sector: Banking Punjab National Bank CMP:INR1,103 TP:INR1,500 Buy Bloomberg PNB IN Equity Shares (m) 316.8 52-Week Range (INR) 1,395/971
Hindalco. CMP: INR113 TP: INR151 Buy
 BSE SENSEX S&P CNX 18,817 5,724 Bloomberg HNDL IN Equity Shares (m) 1,990.0 52-Week Range (INR) 165/100 1,6,12 Rel. Perf. (%) -9/-18/-26 M.Cap. (INR b) 224.9 M.Cap. (USD b) 4.1 Consolidated 2QFY13 Results
Cross service charges at INR m/quarter
 BSE SENSEX S&P CNX 19,636 5,940 Cummins India CMP: INR504 TP: INR585 Buy LHP products to be an important growth driver Cross service charges at INR100-200m/quarter 20 February 2013 Update Sector: Capital
Urban demand revives; Akzo gaining market share
 BSE Sensex S&P CNX 22,095 6,601 CMP: INR889 26 March 2014 Update Sector: Consumer Not Rated Urban demand revives; Akzo gaining market share Reiterates focus on Profitable growth Urban demand for Decorative
Hardick Bora QFY13 Results Update Sector: Healthcare Lupin CMP: INR725 TP: INR851 Buy
 BSE Sensex S&P CNX 19,990 6,069 Bloomberg LPC IN Equity Shares (m) 447.6 M.Cap. (INR b)/(usd b) 324.5/6.0 52-Week Range (INR) 739/507 1,6,12 Rel. Perf. (%) 9/18/13 Financials & Valuation (INR b) Y/E March
Petronet LNG. CMP: INR146 TP: INR205 Buy
 BSE SENSEX S&P CNX 17,236 5,229 Bloomberg PLNG IN Equity Shares (m) 750.0 52-Week Range (INR) 186/122 1,6,12 Rel. Perf. (%) 3/-11/-10 M.Cap. (INR b) 109.7 M.Cap. (USD b) 2.0 1 August 2012 1QFY13 Results
Canara Bank. CMP: INR464 TP: INR645 Buy
 BSE SENSEX S&P CNX 17,234 5,205 Bloomberg CBK IN Equity Shares (m) 443.0 52-Week Range (INR) 672/349 1,6, 12 Rel.Perf.(%) 22/2/-13 M.Cap. (INR b) 205.6 M.Cap. (USD b) 4.1 31 January 2012 3QFY12 Results
Godrej Properties. CMP: INR368 TP: INR420 Neutral
 BSE SENSEX S&P CNX 21,034 6,252 Bloomberg GPL IN Equity Shares (m) 99.6 M.Cap. (INR b) / (USD b) 36.4/ 0.7 52-Week Range (INR) 641/340 1, 6, 12 Rel. Per (%) -1/-44/-47 Financials & Valuation (INR b) Y/E
Shoppers Stop. CMP: INR339 TP: INR355 Neutral
 BSE SENSEX S&P CNX 20,684 6,145 Bloomberg SHOP IN Equity Shares (m) 83.1 M.Cap. (INR b) / (USD b) 28.1/0.5 52-Week Range (INR) 494/331 1, 6, 12 Rel. Per (%) -7/-16/-28 Financials & Valuation (INR b) Y/E
Hardick Bora 4QFY13 Results Update Sector: Healthcare Dr Reddy's Laboratories CMP: INR2,026 TP: INR2,375 Buy
 BSE Sensex S&P CNX 19,772 5,995 Bloomberg DRRD IN Equity Shares (m) 169.2 M.Cap. (INR b)/(usd b) 344/6.3 52-Week Range (INR) 2,151/1,528 1,6,12 Rel. Perf. (%) -2/9/0 Financials & Valuation (INR b) Y/E
Steel Authority of India
 BSE SENSEX S&P CNX 16,439 4,990 4QFY12 Results Update Sector: Metals Steel Authority of India CMP: INR93 TP: INR99 Sell Bloomberg SAIL IN Equity Shares (m) 4,130.4 52-Week Range (INR) 151/73 1,6,12 Rel.
Alpesh Mehta Sohail Halai
 BSE Sensex S&P CNX 19,664 5,969 Bloomberg IIB IN Equity Shares (m) 521.8 M. Cap. (INR b)/(usd b) 227/4.1 52-Week Range (INR) 441/242 1,6,12 Rel.Perf.(%) 3/15/52 Financials & Valuation (INR b) Y/E March
Maruti Suzuki. CMP: INR1,395 TP: INR1,730 Buy
 BSE SENSEX S&P CNX 18,431 5,598 Bloomberg MSIL IN Diluted Equity Shares (m) 302.1 52-Week Range (INR) 1,498/906 1,6,12 Rel.Perf.(%) 5/-5/20 M.Cap. (INR b) 421.3 M.Cap. (USD b) 7.8 31 October 2012 2QFY13
Strides Arcolab. CMP: INR717 TP: INR829 Buy
 BSE SENSEX S&P CNX 17,144 5,200 Bloomberg STR IN Equity Shares (m) 57.7 52-Week Range (INR) 794/276 1,6,12 Rel. Perf. (%) -2/37/98 M.Cap. (INR b) 41.4 M.Cap. (USD b) 0.7 31 July 2012 2QCY12 Results Update
CPCB-2: Important long-term driver
 BSE Sensex S&P CNX 20,860 6,217 19 December 2013 Update Sector: Capital Goods Cummins India CMP: INR461 TP: INR540 Buy Stock Info Bloomberg KKC IN Equity Shares (m) 277.2 52-Week Range (INR) 550/365 1,
Cement. Demand to grow 8%, with cost push to be passed on CCI probe to have limited impact
 15 May 2012 Update Cement Demand to grow 8%, with cost push to be passed on CCI probe to have limited impact We met with senior managements of the large cement companies in India, to get perspective on
M&M Financial Services
 BSE SENSEX S&P CNX 18,793 5,717 Bloomberg MMFS IN Equity Shares (m) 102.7 52-Week Range (INR) 938/590 1,6,12 Rel.Perf.(%) 7/24/30 M.Cap. (INR b) 90.7 M.Cap. (USD b) 1.7 23 October 2012 2QFY13 Results Update
Gautam Duggad Sreekanth P V S
 BSE Sensex S&P CNX 19,990 6,069 Bloomberg FRL IN Equity Shares (m) 217.1 M.Cap. (INR b)/(usd b) 33.4/0.6 52-Week Range (INR) 276/127 1,6,12 Rel. Perf. (%) -10/-32/-20 Financials & Valuation (INR b) Y/E
Kotak Mahindra Bank. CMP: INR495 TP: INR429 Neutral
 BSE SENSEX S&P CNX 16,739 5,049 Bloomberg KMB IN Equity Shares (m) 689.3 52-Week Range 515/333 1,6,12 Rel.Perf.(%) 0/12/31 M.Cap. (Rs b) 340.5 M.Cap. (US$ b) 6.7 25 January 2012 3QFY12 Results Update Sector:
Just Dial. CMP: INR1,129 TP: INR1,475 Buy
 BSE SENSEX S&P CNX 23,871 7,109 Bloomberg JUST IN Equity Shares (m) 70.2 M.Cap. (INR b) / (USD b) 79.2/1.3 52-Week Range (INR) 1,774/589 1, 6, 12 Rel. Per (%) -18/-7/- Financials & Valuation (INR m) Y/E
Kotak Mahindra Bank. CMP: INR626 TP: INR500 Neutral
 BSE SENSEX S&P CNX 18,759 5,705 Bloomberg KMB IN Equity Shares (m) 740.7 52-Week Range (INR) 652/418 1,6,12 Rel.Perf.(%) -3/-2/18 M.Cap. (INR b) 463.4 M.Cap. (USD b) 8.6 26 October 2012 2QFY13 Results
JSW Steel. CMP: INR670 TP: INR391 Sell Merger with JSW Ispat
 BSE SENSEX S&P CNX 17,384 5,254 Bloomberg JSTL IN Equity Shares (m) 223.1 52-Week Range (INR) 885/464 1,6,12 Rel. Perf. (%) -5/-12/-10 M.Cap. (INR b) 149.5 M.Cap. (USD b) 2.7 Valuation summary (INR b)
Monnet Ispat. CMP: INR449 TP: INR518 Neutral
 4QFY12 Results Update Sector: Metals Monnet Ispat BSE SENSEX S&P CNX 16,328 4,943 CMP: INR449 TP: INR518 Neutral Bloomberg MISP IN Equity Shares (m) 64.4 52-Week Range (INR) 561/305 1,6,12 Rel. Perf. (%)
Cummins India. CMP: INR430 TP: INR462 Neutral
 BSE SENSEX S&P CNX 16,070 4,870 Bloomberg KKC IN Equity Shares (m) 277.2 52-Week Range (INR) 515/322 1,6,12 Rel. Perf. (%) -3/30/-4 M.Cap. (INR b) 119.2 M.Cap. (USD b) 2.2 17 May 2012 4QFY12 Results Update
CMP: INR124 TP: INR172 Buy. Benefit of two major motorcycle launches not priced in. Improved industry outlook and recent launch success drive upgrades
 BSE Sensex S&P CNX 24,717 7,359 Stock Info Bloomberg TVSL IN Equity Shares (m) 475.1 52-Week Range (INR) 138/28 1, 6, 12 Rel. Per (%) 34/111/210 M.Cap. (INR b) 59.1 M.Cap. (USD b) 1.0 Financial Snapshot
Axis Bank. CMP: INR1,119 TP: INR1,330 Buy
 BSE SENSEX S&P CNX 18,714 5,687 Bloomberg AXSB IN Equity Shares (m) 413.2 52-Week Range (INR) 1,309/785 1,6,12 Rel.Perf.(%) 9/-16/-8 M.Cap. (INR b) 462.4 M.Cap. (USD b) 8.7 16 October 2012 2QFY13 Results
Oberoi Realty. CMP: INR269 TP: INR320 Buy
 BSE SENSEX S&P CNX 18,682 5,684 Bloomberg OBER IN Equity Shares (m) 328.2 52-Week Range (INR) 323/205 1,6,12 Rel. Perf. (%) 13/-7/7 M.Cap. (INR b) 88.3 M.Cap. (USD b) 1.6 22 October 2012 2QFY13 Results
CMP: INR320 TP: INR164(-49%) Sell Intending to exit UK execution is key!
 Sell Intending to exit UK execution is key!") 31 March 2016 Update Sector: Metals Tata Steel BSE SENSEX S&P CNX 25,342 7,738 Stock Info Bloomberg TATA IN Equity Shares (m) 971.2 52-Week Range (INR) 384/200 1, 6, 12 Rel. Per (%) 18/54/10 M.Cap. (INR
31 March 2016 Update Sector: Metals Tata Steel BSE SENSEX S&P CNX 25,342 7,738 Stock Info Bloomberg TATA IN Equity Shares (m) 971.2 52-Week Range (INR) 384/200 1, 6, 12 Rel. Per (%) 18/54/10 M.Cap. (INR
Automobiles. HMSI s expansion could result in short-term pressure on HMCL and BJAUT
 Sector Update Automobiles HMSI s expansion could result in short-term pressure on HMCL and BJAUT Valuations reasonable, but demand recovery key for stock performance Honda Motorcycle and Scooter India
Oberoi Realty. CMP: INR264 TP: INR315 Buy
 BSE SENSEX S&P CNX 17,151 5,202 Bloomberg OBER IN Equity Shares (m) 328.2 52-Week Range (INR) 323/205 1,6,12 Rel. Perf. (%) 4/15/16 M.Cap. (INR b) 87.0 M.Cap. (USD b) 1.7 26 April 2012 4QFY12 Results Update
Punjab National Bank. CMP: INR940 TP: INR1,275 Buy
 BSE SENSEX S&P CNX 17,194 5,199 Bloomberg PNB IN Equity Shares (m) 316.8 52-Week Range (INR) 1,234/751 1,6,12 Rel.Perf.(%) 9/-10/-9 M.Cap. (INR b) 297.7 M.Cap. (USD b) 6.0 1 February 2012 3QFY12 Results
Punjab National Bank. CMP: INR768 TP: INR963 Buy
 BSE SENSEX S&P CNX 16,480 4,975 Bloomberg PNB IN Equity Shares (m) 339.2 52-Week Range (INR) 1,200/751 1,6,12 Rel.Perf.(%) -12/-16/-18 M.Cap. (INR b) 260.5 M.Cap. (USD b) 4.8 10 May 2012 4QFY12 Results
CMP: INR415 TP: INR 471 BUY
 04 Mar 2013 Update Sector: Technology Wipro CMP: INR415 TP: INR 471 BUY Pipeline and deal signings suggest improvement in growth; Multiple levers and focus on productivity will cushion margin headwinds
Torrent Pharmaceuticals
 BSE SENSEX S&P CNX 21,338 6,339 Bloomberg TRP IN Equity Shares (m) 169.2 M.Cap. (INR b) / (USD b) 80.4/1.3 52-Week Range (INR) 535/324 1, 6, 12 Rel.Per (%) 4/12/32 Financials & Valuation (INR Million)
Tata Power. CMP: INR111 TP: INR92 Neutral
 BSE SENSEX S&P CNX 17,749 5,382 Bloomberg TPWR IN Equity Shares (m) 2,373.3 52-Week Range (INR) 135/81 1,6,12 Rel. Perf. (%) 10/-5/-10 M.Cap. (INR b) 263.9 M.Cap. (USD b) 5.3 13 February 2012 3QFY12 Results
Dabur India. CMP: INR106 TP: INR94 Neutral
 28 July 2011 1QFY12 Results Update Sector: FMCG BSE SENSEX S&P CNX 18,210 5,488 Dabur India CMP: INR106 TP: INR94 Neutral Bloomberg DABUR IN Equity Shares (m) 1,740.0 52-Week Range (INR) 122/87 1,6,12
Dabur India. CMP: INR130 TP: INR135 Neutral
 BSE SENSEX S&P CNX 18,625 5,664 29 October 2012 2QFY13 Results Update Sector: Consumer Dabur India CMP: INR130 TP: INR135 Neutral Bloomberg DABUR IN Equity Shares (m) 1,740.7 52-Week Range (Rs) 139/92
Jubilant Foodworks. CMP: INR1,051 TP: INR1,054 Neutral
 BSE SENSEX S&P CNX 16,420 4,966 Bloomberg JUBI IN Equity Shares (m) 63.5 52-Week Range (INR) 1,144/536 1,6,12 Rel. Perf. (%) -6/37/53 M.Cap. (INR b) 66.7 M.Cap. (USD b) 1.3 11 May 2012 4QFY12 Results Update
Previous Recommendation: Buy
 2QCY10 Results Update SECTOR: CEMENT ACC STOCK INFO. BSE Sensex: 18,113 S&P CNX: 5,442 BLOOMBERG ACC IN REUTERS CODE ACC.BO Previous Recommendation: Buy Buy Rs816 Equity Shares (m) 187.9 52-Week Range
Shree Renuka Sugars. CMP: INR41 TP: INR50 Buy
 BSE SENSEX S&P CNX 18,202 5,532 Bloomberg SHRS IN Equity Shares (m) 671.0 52-Week Range (INR) 87/23 1,6,12 Rel. Perf. (%) 14/-39/-51 M.Cap. (INR b) 27.3 M.Cap. (USD b) 0.6 16 February 2012 5QSY12 Results
Axis Bank. CMP: INR1,008 TP: INR1,240 Buy
 BSE SENSEX S&P CNX 16,739 5,049 Bloomberg AXSB IN Equity Shares (m) 410.5 52-Week Range 1,461/785 1,6,12 Rel.Perf.(%) 11/-9/-9 M.Cap. (INR b) 413.8 M.Cap. (USD b) 8.2 20 January 2012 Results Update Sector:
Expect capacity-led rerating; maintain Buy
 BSE SENSEX S&P CNX 27,238 8,400 Stock Info Bloomberg SRCM IN Equity Shares (m) 34.8 52-Week Range (INR) 18519/9350 1, 6, 12 Rel. Per (%) -2/-3/32 M.Cap. (INR b) 523.7 M.Cap. (USD b) 7.7 Avg Val, INRm 216.4
Godrej Consumer Products
 BSE SENSEX S&P CNX 18,755 5,698 Bloomberg GCPL IN Equity Shares (m) 340.3 52-Week Range (INR) 745/370 1,6,12 Rel. Perf. (%) 4/17/67 M.Cap. (INR b) 246.4 M.Cap. (USD b) 4.6 5 November 2012 2QFY13 Results
BHEL. CMP: INR227 TP: INR233 Neutral
 BSE SENSEX S&P CNX 18,636 5,666 Bloomberg BHEL IN Equity Shares (m) 2,447.6 52-Week Range (INR) 368/198 1,6,12 Rel. Perf. (%) -7/-7/-35 M.Cap. (INR b) 556.2 M.Cap. (USD b) 10.3 30 October 2012 2QFY13 Results
Birla Corporation. CMP: INR484 TP: INR590 (+22%) Buy
 Buy") BSE SENSEX S&P CNX 28,851 8,712 Bloomberg BCORP IN Equity Shares (m) 77.0 M.Cap. (INR b) / (USD b) 37.3/0.6 52-Week Range (INR) 615/226 1, 6, 12 Rel. Per (%) 1/5/64 Avg Val (INRm)/Vol 000 34/72 Free float
BSE SENSEX S&P CNX 28,851 8,712 Bloomberg BCORP IN Equity Shares (m) 77.0 M.Cap. (INR b) / (USD b) 37.3/0.6 52-Week Range (INR) 615/226 1, 6, 12 Rel. Per (%) 1/5/64 Avg Val (INRm)/Vol 000 34/72 Free float
Oberoi Realty. CMP: INR240 TP: INR297 Buy
 BSE SENSEX S&P CNX 25,642 7,664 Bloomberg OBER IN Equity Shares (m) 328.2 M.Cap. (INR b) / (USD b) 78.8/1.3 52-Week Range (INR) 276/154 1, 6, 12 Rel. Per (%) -8/-7/-6 Financials & Valuation (INR m) Y/E
Raymond. Restructuring initiatives bearing fruit; Land bank base case value INR147/share; Reiterate Buy. CMP: INR385 TP: INR462 Buy
 14 June 2012 Update Raymond CMP: INR385 TP: INR462 Buy Restructuring initiatives bearing fruit; Land bank base case value INR147/share; Reiterate Buy We met the management of Raymond (RW IN, Mkt Cap USD0.4b,
Pantaloon Retail. CMP: INR177 TP: INR192 Neutral
 BSE SENSEX S&P CNX 17,773 5,390 Bloomberg PF IN Equity Shares (m) 217.1 52-Week Range (INR) 364/125 1,6,12 Rel. Perf. (%) 9/-49/-29 M.Cap. (Rs b) 38.4 M.Cap. (US$ b) 0.8 14 February 2012 2QFY12 Results
CMP: INR475 TP: INR609 (+28%) Buy
 Buy") 10 April 2017 Update Sector: Automobiles Tata Motors BSE SENSEX S&P CNX 29,576 9,181 Stock Info Bloomberg TTMT IN Equity Shares (m) 3,395.9 52-Week Range (INR) 599 / 373 1, 6, 12 Rel. Per (%) -1/-21/8
10 April 2017 Update Sector: Automobiles Tata Motors BSE SENSEX S&P CNX 29,576 9,181 Stock Info Bloomberg TTMT IN Equity Shares (m) 3,395.9 52-Week Range (INR) 599 / 373 1, 6, 12 Rel. Per (%) -1/-21/8
India Cements. CMP: INR107 TP: INR113 (+6%) Neutral
 Neutral") BSE SENSEX S&P CNX 28,805 8,712 Bloomberg ICEM IN Equity Shares (m) 307.2 M.Cap. (INR b) / (USD b) 32.8/0.5 52-Week Range (INR) 134/48 1, 6, 12 Rel. Per (%) 19/-14/68 Avg Val,INRm/Vol 000 291/2988 Free
BSE SENSEX S&P CNX 28,805 8,712 Bloomberg ICEM IN Equity Shares (m) 307.2 M.Cap. (INR b) / (USD b) 32.8/0.5 52-Week Range (INR) 134/48 1, 6, 12 Rel. Per (%) 19/-14/68 Avg Val,INRm/Vol 000 291/2988 Free
Maruti Suzuki. CMP:Rs1,327 TP:Rs1,625 Buy
 25 April 2011 4QFY11 Results Update Sector: Automobiles Maruti Suzuki BSE SENSEX S&P CNX 19,584 5,875 Bloomberg MSIL IN Diluted Equity Shares (m) 289.0 52-Week Range (Rs) 1,600/1,126 1,6,12 Rel.Perf.(%)
Godrej Properties. CMP: INR595 TP: INR635 Neutral
 BSE SENSEX S&P CNX 16,913 5,114 Bloomberg GPL IN Equity Shares (m) 78.0 52-Week Range 845/570 1,6,12 Rel. Perf. (%) 0/-9/-2 M.Cap. (INR b) 46.4 M.Cap. (USD b) 0.9 4QFY12 Results Update Sector: Real Estate
CMP: INR1,044 TP: INR970 (-7%) Neutral Sale of Healthcare business margin accretive
 Neutral Sale of Healthcare business margin accretive") BSE SENSEX S&P CNX 24,646 7,485 4 March 2016 Update Sector: Capital Goods Siemens CMP: INR1,044 TP: INR970 (-7%) Neutral Sale of Healthcare business margin accretive Stock Info Bloomberg SIEM IN Equity
BSE SENSEX S&P CNX 24,646 7,485 4 March 2016 Update Sector: Capital Goods Siemens CMP: INR1,044 TP: INR970 (-7%) Neutral Sale of Healthcare business margin accretive Stock Info Bloomberg SIEM IN Equity
Hindustan Unilever. CMP:INR324 TP:INR302 Neutral
 BSE SENSEX S&P CNX 18,197 5,482 29 July 2011 1QFY12 Results Update Sector: FMCG Hindustan Unilever CMP:INR324 TP:INR302 Neutral Bloomberg HUVR IN Equity Shares (m) 2,159.5 52-Week Range (INR) 347/250 1,6,12
Sun Pharmaceuticals. CMP: INR554 TP: INR614 Neutral
 BSE SENSEX S&P CNX 17,849 5,416 Bloomberg SUNP IN Equity Shares (m) 1,035.6 52-Week Range (INR) 566/404 1,6,12 Rel. Perf. (%) -3/10/31 M.Cap. (INR b) 573.7 M.Cap. (USD b) 11.6 15 February 2012 3QFY12 Results
ONGC. CMP: INR402 TP: INR485 Buy
 BSE SENSEX S&P CNX 25,919 7,740 Bloomberg ONGC IN Equity Shares (m) 8,555.5 M.Cap. (INR b) / (USD b) 3,437.6/56.1 52-Week Range (INR) 472/234 1, 6, 12 Rel. Per (%) -4/19/11 Financials & Valuation (INR
ECOSCOPE. Real GDP growth eases on lower net indirect taxes. The Economy Observer. Real GVA growth exactly as expected
 31 August 2016 ECOSCOPE The Economy Observer Real GDP growth eases on lower net indirect taxes Real GVA growth exactly as expected India s real gross domestic product (GDP) grew at the slowest pace in
Synergy benefits can drive up to 14% EPS upgrade
 BSE Sensex S&P CNX 19,380 5,735 30 September 2013 Update Sector: Cement CMP: INR184 TP: INR188 Neutral Synergy benefits can drive up to 14% EPS upgrade Structure reduces equity dilution, increases EPS