Strides Arcolab. CMP: INR717 TP: INR829 Buy
|
|
|
- Hector Byrd
- 5 years ago
- Views:
Transcription
 2QCY12 performance was below our expectations.")

1 BSE SENSEX S&P CNX 17,144 5,200 Bloomberg STR IN Equity Shares (m) Week Range (INR) 794/276 1,6,12 Rel. Perf. (%) -2/37/98 M.Cap. (INR b) 41.4 M.Cap. (USD b) July QCY12 Results Update Sector: Healthcare Strides Arcolab CMP: INR717 TP: INR829 Buy Strides Arcolab's (STR) 2QCY12 performance was below our expectations. Key highlights: Net revenue declined 12.6% YoY to INR5.1b v/s our estimate of INR5.7b. EBITDA grew 4.5% YoY to INR1.13b v/s our estimate of INR1.41b. Recurring PAT declined 83% YoY to INR117m v/s our estimate of INR801m, impacted by worse than anticipated operational performance, higher interest cost and forex loss of INR734m. Excluding the sale of Ascent Pharma, topline grew ~30% YoY, led by 39% YoY growth in sterile business revenue to INR3.1b v/s our estimate of INR4.1b. Pharma segment revenue grew 18% YoY to INR2.46b even on a high base, boosted by one-off sales in the tender business. EBITDA grew 4% YoY to INR1.13b v/s our estimate of INR1.41b, led by higher gross margin. EBITDA margin expanded 360bp YoY to 22.2% v/s our estimate of 24.7%. Margins were driven by improved product mix, YoY decline in manpower expense due to divestment of Ascent Pharma and reduced other expenditure. Adjusted PAT declined 83% YoY to INR117m (v/s our estimate of INR801m), impacted by by worse than anticipated operational performance, higher than estimated interest cost and forex loss of INR734m. However, reported PAT grew 31.3% YoY to INR905m, led by INR946m gain reported on the sale of Ascent Pharma. STR is set to emerge as a specialty products company, with revenue contribution from this segment increasing from 28% in CY09 to an estimated 67% in CY13. The company has an impressive specialty product pipeline. It has large manufacturing capacities in place to support revenue scale-up, coupled with best-in-class marketing partners like Pfizer and GSK. We expect STR to post 24% earnings CAGR over CY11-13, led by revenue ramp-up in the SI (sterile injectables) segment and substantial reduction in interest cost owing to debt repayment. Return ratios are set to improve over CY11-13 and debt-equity should decline from 1.9x in CY10 to 0.7x in CY13. The stock trades at 13.3x CY12E and 12.1x CY13E EPS. Buy with a revised target price of INR829 (14x CY13E EPS), an upside of 18.8%. Amit Shah (Amit.Shah@MotilalOswal.com) Nimish Desai (NimishDesai@MotilalOswal.com); Investors are advised to refer through disclosures made at the end of the Research Report.
2 Performance led by specialty business segments Strides' net revenues declined 12.6% YoY to INR5.1b (v/s est of INR5.7b), EBITDA grew 4.5% YoY to INR1.13b (v/s est of INR1.41b) while recurring PAT declined 83% YoY to INR117m (v/s est of INR801m) impacted by lower operational performance, higher than estimated interest cost and forex loss of INR734m. Excluding sale of Ascent Pharma, topline grew 30% YoY and the growth was led by a 39% YoY growth in sterile business revenue to INR3.1b (v/s estimates of INR4.1b). Specialty segment sales (excluding licensing income) grew by 71% YoY to INR2.5b on account of higher revenues from US market led by new product launches and shortages of sterile injectable products worldwide. However, Licensing income declined 23% YoY to INR570m Pharma business reported 38% YoY decline to INR2.46b primarily due to divestment of Ascent business. Adjusted for the same the growth was 18% led by day one launch of generic oral Vancomycin in US. STR gained ~30% market share in this product during the quarter on account of first entrant generic entrant in the product and limited competition. We expect the benefit from generic Vancomycin to continue for couple of quarters more. Revenue mix (INR m) 2QCY12 2QCY11 YoY (%) 1QCY12 QoQ (%) Specialty business 2,500 1, , % of Sales Pharma business 2,460 3, , % of Sales Licensing income % of Sales Revenues 5,530 6, , Source: Company EBITDA grew by 4% YoY to INR1.13b below our estimates EBITDA grew 4% YoY to INR1.13b (est of INR1.41b) led by improved Gross margins on the back of improved product mix, YoY decline in manpower expense due to divestment of Ascent Pharma and reduced other expenditure. EBITDA margins at 22.2% expanded 360bp YoY (v/s est of 24.7%). EBITDA was lower than estimate primarily due to lower than estimated revenue from specialty business and lower licensing income. Adjusted PAT declined 83% YoY to INR117m (est of INR801m) impacted by lower operational performance, higher than estimated interest cost and forex loss of INR734m. However, reported PAT grew 31.3% YoY to INR905m led by INR946m gain reported on sale of Ascent Pharma. 31 July
3 EBITDA trend (INR m) Source: Company/MOSL Key takeaways from conference call 2QCY12 Performance During 2QCY12, specialty revenues were stagnant QoQ because of lumpy nature of the contracts signed with the GPO. Since the injectables are not retail products, the off-take varies QoQ depending on product supplies to GPO under contractual obligations. However the company has indicated that 2HCY12 should see good ramp-up in sterile business as new product supplies will start under new contracts beginning 1st July and 1st October. The company has also started selling the products in Canada from its Poland facility as Canada is also facing shortages in sterile products. The company has indicated that its Brazilian operations will break-even by the year end and sees significant scale-up potential in Brazilian operations going forward led by supplies of penems to regulated markets. The company indicated that the oncology portfolio is ramping well as the company has 38 filings in this space out of which it has got approvals for 19 products out of which it has launched only 11 products so far. The remaining 6 products will be launched shortly in the market. Further the company successfully competed integration of acquired facility at Bengaluru and expects to start shipment from this facility in 4QCY12. The company reported net extraordinary gain during the quarter of INR946m related to profit on sale of Ascent Pharma. The company has debt of INR1.3b on the balance-sheet with D/E ratio of 0.65x as against 1.67x at the end of CY11. It has forward cover worth USD40m on books. CY12 guidance Management has declined to give any revenue guidance for CY12 as of now citing that many of its product launches for CY12E are linked to successful US FDA approvals and outcome of patent challenges. However, it has indicated that given the number of approvals expected in CY12 and healthy inflow of licensing income (USD50-60m), performance should be robust. We expect topline growth of 38.5% (excluding sales of Ascent Pharma) led by US specialty business. 31 July
4 The company has guided for EBITDA margin for sterile business at 23-30% for CY12. The company expects to improve profitability of Brazilian operations in CY12. Expect USD25m capex for CY12 while there will be reduction in the interest cost. The company expects to file 32 products in the US market in 2HCY12. Enters Canadian injectable market through JV; Will benefit from the drug shortages; No Significant upside in the short term STR's specialty business subsidiary, Agila, entered Canadian injectable market by setting up marketing joint venture with Jamp Pharma. Agila will be holding 70% stake in the subsidiary while the rest will be owned by Jamp Pharma. The JV will be launching 40 injectable products in the market over the next two years and some of these products have already been approved by the regulator, Health Canada. The approved products will be immediately launched in the market. The marketing of these products will be done by the sales force of Jamp Pharma. There won't be significant impact on the STR financials due to this JV over the next two years. There is no initial capex requirement for this JV since this is just a marketing partnership. All the product IPs are owned and registered by STR with Jamp Pharma being just a marketing partner. Though the company has not disclosed the revenue upside from this JV over next two years, it has indicated that, the upside won't be significant till the JV starts marketing all the 40 products. Also the management has indicated that the overall market size of injectable segment in Canada is not very large. In the long term STR will benefit from the injectable drug shortages in Canada Specialty business in US to see significant ramp-up led by new capacities, product approvals and low competition Specialty business in US will see significant ramp-up on the back of USFDA approval for company's new sterile injectable and oncology facilities at Bengaluru and Penems facility in Brazil. Strides is now in the process of shifting manufacturing of all the approved injectable products to new facility thereby eliminating the capacity constraints. The company has already shifted few key products to the new facility. Strides currently has 72 product approvals in sterile segment in US, of which it has launched 43 products versus only 33 products. STR plans to launch all approved products in CY12 which will boost revenues from the specialty business significantly. The company is expecting strong product approvals in this market even in CY12. Further, Strides also mentioned that currently 6 out of 8 major players in injectable segment have been facing production issues at its facility, which in turn is helping it to increase its revenue rapidly in the US market. STR is entering into long term contracts ranging from 2-5 years with GPOs to establish its strong credentials as reliable supplier of injectable products in the US market. Strides expects to garner 15-25% market share in the products it has launched in US over a period of time backed by strong marketing and distribution set-up of Pfizer and lower competition. Further, the management mentioned that for the first time it has started developing products for Para IV filings in the US market and plans to file 26 Para IV products in US over next couple of years. Further, it plans to file 14 products in ophthalmic segment in CY July
5 Downgrading CY12 and CY13 earnings estimates by 9.8% and 6% respectively Based on 2QCY12 performance, we are downgrading revenue estimates for CY12 and CY13 by 4% and 5.8% respectively given the below expected revenue in specialty segment and lower licensing income. Further, given the lower EBITDA and higher than estimated interest cost in 2QCY12, we are downgrading earnings estimate for CY12 and CY13 by 9.8% and 6% respectively. The downgrade in earnings is not substantial despite far below than estimated PAT in 2QCY12, due to forex gains expected in 2HCY12 and higher than estimated other operating income led by profit on oral Vancomycin in US. Valuation and view STR is set to emerge as a specialty products company with revenue contribution from this segment rising from 28% in CY09 to expected 75% in CY13. STR has an impressive specialty product pipeline. Large manufacturing capacities are in place to support revenue scale-up, coupled with best-in class marketing partners like Pfizer and GSK. We believe that the sale of Ascent Pharma at the attractive valuation will lead to significant improvement in financials for the company in the future. STR may unlock further value from the sale of remaining Pharma business in the future as the focus remains on specialty business. As per our revised estimates, we expect STR to post 24% earnings CAGR over CY11-13, led by revenue ramp-up from SI (sterile injectables) segment and substantial reduction in interest cost owning to repayment of debt. Core EBITDA margin will expand in line with changing product mix and higher capacity utilization. Return ratios are set to improve over CY11-13 and debt-equity will decline from 1.9x in CY10 to 0.7x in CY13. The stock trades at 13.3x CY12E and 12.1x CY13E EPS. Maintain Buy with revised target price of INR829 (14x CY13E EPS), an upside of 18.8%. 31 July
6 Strides Arcolab: an investment profile Company description Established in 1990, Strides is an integrated manufacturer and exporter of finished pharmaceutical dosage forms, both branded and generic with 14 manufacturing facilities in six countries. It has collaborations with five of the top 10 global pharmaceutical players and a presence in over 75 countries. Strides has reorganized its business into three divisions, specialties, pharmaceuticals and branded generics. Key investment arguments Strides is set to catapult into a specialty company with revenue contribution from this segment set to rise from 27% in CY09 to 75% by CY13. The company has an impressive product pipeline in the specialty segment with 73 product approvals. Besides, large manufacturing capacities are in place to support a revenue scale-up and strong marketing partners like Pfizer and GSK will lead to sustainable revenue growth. Key investment risks If Strides does not get timely approval for its large product pipeline, its revenue could be impacted. Strides does not have API manufacturing capacities and sources its API requirements from elsewhere. This leaves it exposed to risks like unavailability of raw material and price fluctuations. That is a reason for Strides' volatile margins. Recent developments Sold generic business in Australia & Southeast Asia to Watson for A$375m. Acquires new sterile manufacturing facility from STAR drugs and Research Ltd. Valuation and view We expect Strides to clock earnings CAGR of 24% over CY11-13, D/E will decline from 1.9x in CY11 to 0.7x in CY13. Based on our revised estimates, the stock trades at 13.3x CY12E and 12.1x CY13E EPS. We maintain Buy Sector view The Sterile injectable segment and branded generic segment are likely to enjoy better profitability and growth going forward. Comparative valuations Strides Arcolab Jubilant P/E (x) CY12E CY13E P/BV (x) CY12E CY13E EV/Sales (x) CY12E CY13E EV/EBITDA (x) CY12E CY13E EPS: MOSL forecast v/s consensus (INR) MOSL Consensus Variation Forecast Forecast (%) CY CY Target price and recommendation Current Target Upside Reco. Price (INR) Price (INR) (%) Buy Stock performance (1 year) Shareholding pattern (%) Jun-12 Mar-12 Jun-11 Promoter Domestic Inst Foreign Others July

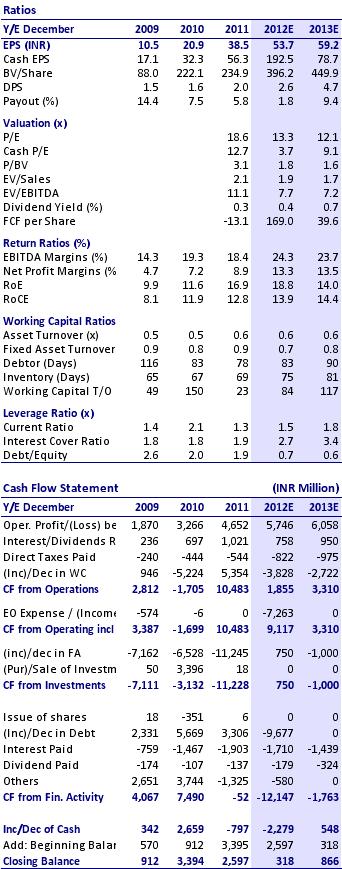
7 Financial and valuations 31 July
8 Disclosures This report is for personal information of the authorized recipient and does not construe to be any investment, legal or taxation advice to you. This research report does not constitute an offer, invitation or inducement to invest in securities or other investments and Motilal Oswal Securities Limited (hereinafter referred as MOSt) is not soliciting any action based upon it. This report is not for public distribution and has been furnished to you solely for your information and should not be reproduced or redistributed to any other person in any form. Unauthorized disclosure, use, dissemination or copying (either whole or partial) of this information, is prohibited. The person accessing this information specifically agrees to exempt MOSt or any of its affiliates or employees from, any and all responsibility/liability arising from such misuse and agrees not to hold MOSt or any of its affiliates or employees responsible for any such misuse and further agrees to hold MOSt or any of its affiliates or employees free and harmless from all losses, costs, damages, expenses that may be suffered by the person accessing this information due to any errors and delays. The information contained herein is based on publicly available data or other sources believed to be reliable. While we would endeavour to update the information herein on reasonable basis, MOSt and/or its affiliates are under no obligation to update the information. Also there may be regulatory, compliance, or other reasons that may prevent MOSt and/or its affiliates from doing so. MOSt or any of its affiliates or employees shall not be in any way responsible and liable for any loss or damage that may arise to any person from any inadvertent error in the information contained in this report. MOSt or any of its affiliates or employees do not provide, at any time, any express or implied warranty of any kind, regarding any matter pertaining to this report, including without limitation the implied warranties of merchantability, fitness for a particular purpose, and non-infringement. The recipients of this report should rely on their own investigations. This report is intended for distribution to institutional investors. Recipients who are not institutional investors should seek advice of their independent financial advisor prior to taking any investment decision based on this report or for any necessary explanation of its contents. MOSt and/or its affiliates and/or employees may have interests/positions, financial or otherwise in the securities mentioned in this report. To enhance transparency, MOSt has incorporated a Disclosure of Interest Statement in this document. This should, however, not be treated as endorsement of the views expressed in the report. Disclosure of Interest Statement Strides Arcolab 1. Analyst ownership of the stock No 2. Group/Directors ownership of the stock No 3. Broking relationship with company covered No 4. Investment Banking relationship with company covered No Analyst Certification The views expressed in this research report accurately reflect the personal views of the analyst(s) about the subject securities or issues, and no part of the compensation of the research analyst(s) was, is, or will be directly or indirectly related to the specific recommendations and views expressed by research analyst(s) in this report. The research analysts, strategists, or research associates principally responsible for preparation of MOSt research receive compensation based upon various factors, including quality of research, investor client feedback, stock picking, competitive factors and firm revenues. Regional Disclosures (outside India) This report is not directed or intended for distribution to or use by any person or entity resident in a state, country or any jurisdiction, where such distribution, publication, availability or use would be contrary to law, regulation or which would subject MOSt & its group companies to registration or licensing requirements within such jurisdictions. For U.K. This report is intended for distribution only to persons having professional experience in matters relating to investments as described in Article 19 of the Financial Services and Markets Act 2000 (Financial Promotion) Order 2005 (referred to as "investment professionals"). This document must not be acted on or relied on by persons who are not investment professionals. Any investment or investment activity to which this document relates is only available to investment professionals and will be engaged in only with such persons. For U.S. MOSt is not a registered broker-dealer in the United States (U.S.) and, therefore, is not subject to U.S. rules. In reliance on the exemption from registration provided by Rule 15a-6 of the U.S. Securities Exchange Act of 1934, as amended (the "Exchange Act") and interpretations thereof by the U.S. Securities and Exchange Commission ("SEC") in order to conduct business with Institutional Investors based in the U.S., Motilal Oswal has entered into a chaperoning agreement with a U.S. registered broker-dealer, Marco Polo Securities Inc. ("Marco Polo"). Any business interaction pursuant to this report will have to be executed within the provisions of this Chaperoning agreement. This report is intended for distribution only to "Major Institutional Investors" as defined by Rule 15a-6(b)(4) of the Exchange Act and interpretations thereof by SEC (henceforth referred to as "major institutional investors"). This document must not be acted on or relied on by persons who are not major institutional investors. Any investment or investment activity to which this document relates is only available to major institutional investors and will be engaged in only with major institutional investors. The Research Analysts contributing to the report may not be registered /qualified as research analyst with FINRA. Such research analyst may not be associated persons of the U.S. registered broker-dealer, Marco Polo and therefore, may not be subject to NASD rule 2711 and NYSE Rule 472 restrictions on communication with a subject company, public appearances and trading securities held by a research analyst account. Motilal Oswal Securities Ltd Motilal Oswal Tower, Level 9, Sayani Road, Prabhadevi, Mumbai Phone: reports@motilaloswal.com
Sanofi India. CMP: INR2,200 TP: INR1,848 Neutral
 BSE SENSEX S&P CNX 16,846 5,110 Bloomberg SANL IN Equity Shares (m) 23.0 52-Week Range (INR) 2,430/1,980 1,6,12 Rel. Perf. (%) 3/-3/15 M.Cap. (INR b) 50.7 M.Cap. (USD b) 0.9 26 July 2012 2QCY12 Results
Hardick Bora
 BSE Sensex S&P CNX 19,990 6,069 Bloomberg JOL IN Equity Shares (m) 159.3 M.Cap. (INR b)/(usd b) 26.0/0.5 52-Week Range (INR) 248/154 1,6,12 Rel. Perf. (%) -18/-28/-34 Financials & Valuation (INR b) Y/E
Pidilite Industries. CMP: INR164 TP: INR186 Buy
 BSE SENSEX S&P CNX 16,640 5,043 Bloomberg PIDI IN Equity Shares (m) 506.1 52-Week Range (INR) 188/134 1,6,12 Rel. Perf. (%) 1/20/5 M.Cap. (INR b) 83.0 M.Cap. (USD b) 1.5 27 July 2012 1QFY13 Results Update
Jubilant Foodworks. CMP: INR1,189 TP: INR1,0541,054 Neutral
 BSE SENSEX S&P CNX 16,846 5,110 Bloomberg JUBI IN Equity Shares (m) 63.5 52-Week Range (INR) 1,189/633 1,6,12 Rel. Perf. (%) 4/38/47 M.Cap. (INR b) 75.5 M.Cap. (USD b) 1.3 26 July 2012 1QFY13 Results Update
Titan Industries. CMP: INR222 TP: INR220 Neutral
 BSE SENSEX S&P CNX 17,257 5,241 Bloomberg TTAN IN Equity Shares (m) 887.8 52-Week Range (INR) 255/154 1,6,12 Rel. Perf. (%) -1/13/3 M.Cap. (Rs b) 197.1 M.Cap. (US$ b) 3.6 2 August 2012 1QFY13 Results Update
NTPC CMP: INR169 TP: INR191 Buy
 BSE SENSEX S&P CNX 18,625 5,664 Bloomberg NTPC IN Equity Shares (m) 8,245.5 52-Week Range (INR) 190/139 1,6,12 Rel. Perf. (%) 3/-4/-11 M.Cap. (INR b) 1,393.5 M.Cap. (USD b) 26.0 26 October 2012 2QFY13
BGR Energy. CMP: INR282 TP: INR253 Neutral
 BSE SENSEX S&P CNX 17,413 5,283 Bloomberg BGRL IN Equity Shares (m) 72.0 52-Week Range (INR) 378/173 1,6,12 Rel. Perf. (%) -9/17/-22 M.Cap. (INR b) 20.3 M.Cap. (USD b) 0.4 6 August 2012 1QFY13 Results
Godrej Consumer Products
 BSE SENSEX S&P CNX 17,602 5,337 Bloomberg GCPL IN Equity Shares (m) 340.3 52-Week Range (INR) 658/370 1,6,12 Rel. Perf. (%) 5/37/42 M.Cap. (INR b) 205.9 M.Cap. (USD b) 3.7 7 August 2012 1QFY13 Results
BGR Energy. CMP: INR266 TP: INR230 Neutral
 BSE SENSEX S&P CNX 18,562 5,645 Bloomberg BGRL IN Equity Shares (m) 72.0 52-Week Range (INR) 374/173 1,6,12 Rel. Perf. (%) -3/27/-24 M.Cap. (INR b) 19.2 M.Cap. (USD b) 0.4 3 November 2012 2QFY13 Results
Asian Paints. CMP: INR2,722 TP: INR3,161 Buy
 BSE SENSEX S&P CNX 16,739 5,049 Bloomberg APNT IN Equity Shares (m) 95.9 52-Week Range (INR) 3,366/2,395 1,6,12 Rel. Perf. (%) -5/-3/14 M.Cap. (INR b) 261.1 M.Cap. (USD b) 4.9 23 January 2012 3QFY12 Results
Reliance Infrastructure CMP: INR528
 BSE SENSEX S&P CNX 17,657 5,363 16 August 2012 1QFY13 Results Update Sector: Utilities Reliance Infrastructure CMP: INR528 Buy Bloomberg RELI IN Equity Shares (m) 267.5 52-Week Range (INR) 680/328 1,6,12
Idea Cellular. CMP: INR81 TP: INR Under Review
 BSE SENSEX S&P CNX 16,918 5,128 Bloomberg IDEA IN Equity Shares (m) 3,308.8 52-Week Range (INR) 104/71 1,6,12 Rel. Perf. (%) 6/-13/4 M.Cap. (INR b) 268.0 M.Cap. (USD b) 4.8 25 July 2012 1QFY13 Results
Hardick Bora 4QCY12 Results Update Sector: Healthcare Sanofi India CMP: INR2,307 TP: INR2,015 Neutral
 BSE Sensex S&P CNX 19,332 5,855 Bloomberg SANL IN Equity Shares (m) 23.0 M.Cap. (INR b)/(usd b) 53.1/1.0 52-Week Range (INR) 2,450/2,002 1,6,12 Rel. Perf. (%) 9/-1/-4 Financials & Valuation (INR b) Y/E
Canara Bank. CMP: INR419 TP: INR525 Buy
 BSE SENSEX S&P CNX 18,817 5,724 Bloomberg CBK IN Equity Shares (m) 443.0 52-Week Range (INR) 566/349 1,6, 12 Rel.Perf.(%) -7/-18/-17 M.Cap. (INR b) 170.3 M.Cap. (USD b) 3.0 7 November 2012 2QFY13 Results
Larsen & Toubro. CMP: INR1,160 TP: INR1,417 Buy
 BSE SENSEX S&P CNX 16,216 4,908 Bloomberg LT IN Equity Shares (m) 608.9 52-Week Range (INR) 1,868/971 1,6,12 Rel. Perf. (%) -4/-7/12 M.Cap. (INR b) 706.3 M.Cap. (USD b) 13.1 * Consolidated; EPS is fully
BGR Energy. CMP: INR284 TP: INR296 Neutral
 BSE SENSEX S&P CNX 16,312 4,951 Bloomberg BGRL IN Equity Shares (m) 72.0 52-Week Range (INR) 512/173 1,6,12 Rel. Perf. (%) -8/8/-31 M.Cap. (INR b) 20.5 M.Cap. (USD b) 0.4 31 May 2012 4QFY12 Results Update
Unitech. CMP: INR20 TP: INR30 Buy
 BSE SENSEX S&P CNX 16,328 4,943 Bloomberg UT IN Equity Shares (m) 2,438.8 52-Week Range (INR) 38/17 1,6,12 Rel. Perf. (%) -25/-14/-34 M.Cap. (INR b) 48.8 M.Cap. (USD b) 0.9 16 May 2012 4QFY12 Results Update
Sun Pharmaceuticals. CMP: INR554 TP: INR614 Neutral
 BSE SENSEX S&P CNX 17,849 5,416 Bloomberg SUNP IN Equity Shares (m) 1,035.6 52-Week Range (INR) 566/404 1,6,12 Rel. Perf. (%) -3/10/31 M.Cap. (INR b) 573.7 M.Cap. (USD b) 11.6 15 February 2012 3QFY12 Results
CMP: INR121 TP: INR193 Buy
 BSE SENSEX S&P CNX 17,085 5,139 20 October 2011 2QFY12 Results Update Sector: Metals Hindustan Zinc CMP: INR121 TP: INR193 Buy Bloomberg HZ IN Equity Shares (m) 4,225.3 52-Week Range (INR) 155/109 1,6,12
Punjab National Bank. CMP:INR1,103 TP:INR1,500 Buy
 BSE SENSEX S&P CNX 18,210 5,488 28 July 2011 1QFY12 Results Update Sector: Banking Punjab National Bank CMP:INR1,103 TP:INR1,500 Buy Bloomberg PNB IN Equity Shares (m) 316.8 52-Week Range (INR) 1,395/971
IndusInd Bank. CMP: INR345 TP: INR419 Buy
 BSE SENSEX S&P CNX 17,504 5,332 Bloomberg IIB IN Equity Shares (m) 467.7 52-Week Range (INR) 352/222 1,6,12 Rel.Perf.(%) 13/25/34 M.Cap. (INR b) 161.4 M.Cap. (USD b) 3.1 20 April 2012 4QFY12 Results Update
Punjab National Bank. CMP: INR716 TP: INR950 Buy
 BSE SENSEX S&P CNX 16,839 5,100 Bloomberg PNB IN Equity Shares (m) 339.2 52-Week Range (INR) 1,144/703 1,6,12 Rel.Perf.(%) -8/-24/-28 M.Cap. (INR b) 242.8 M.Cap. (USD b) 4.4 30 July 2012 1QFY13 Results
Sanjay Jain Pavas Pethia
 BSE Sensex S&P CNX 19,561 5,923 Bloomberg SAIL IN Equity Shares (m) 4,130.4 M.Cap. (INR b)/(usd b) 334.6/6.2 52-Week Range (INR) 116/76 1,6,12 Rel. Perf. (%) -11/-17/-38 Financials & Valuation (INR b)
Niket Shah
 BSE Sensex S&P CNX 20,213 6,147 Bloomberg VGRD IN Equity Shares (m) 29.8 M.Cap. (INR b)/(usd b) 14.6/0.3 52-Week Range (INR) 591/180 1,6,12 Rel. Perf. (%) -8/-6/138 Financial summary (INR b) Y/E March
Jaiprakash Associates
 BSE SENSEX S&P CNX 16,312 4,951 Bloomberg JPA IN Equity Shares (m) 2,126.5 52-Week Range (INR) 89/50 1,6,12 Rel. Perf. (%) -14/-4/-17 M.Cap. (INR b) 127.9 M.Cap. (USD b) 2.3 31 May 2012 4QFY12 Results
Jubilant Foodworks. CMP: INR1,051 TP: INR1,054 Neutral
 BSE SENSEX S&P CNX 16,420 4,966 Bloomberg JUBI IN Equity Shares (m) 63.5 52-Week Range (INR) 1,144/536 1,6,12 Rel. Perf. (%) -6/37/53 M.Cap. (INR b) 66.7 M.Cap. (USD b) 1.3 11 May 2012 4QFY12 Results Update
Petronet LNG. CMP: INR146 TP: INR205 Buy
 BSE SENSEX S&P CNX 17,236 5,229 Bloomberg PLNG IN Equity Shares (m) 750.0 52-Week Range (INR) 186/122 1,6,12 Rel. Perf. (%) 3/-11/-10 M.Cap. (INR b) 109.7 M.Cap. (USD b) 2.0 1 August 2012 1QFY13 Results
Coal India CMP: INR348 TP: INR408 Buy
 BSE SENSEX S&P CNX 17,633 5,348 Bloomberg COAL IN Equity Shares (m) 6,316.4 52-Week Range (INR) 404/294 1,6,12 Rel. Perf. (%) -4/4/-15 M.Cap. (INR b) 2,198.1 M.Cap. (USD b) 39.7 14 August 2012 1QFY13 Results
Jinesh Gandhi Chirag Jain
 BSE Sensex S&P CNX 19,561 5,923 Bloomberg EIM IN Equity Shares (m) 27.0 M.Cap. (INR b)/(usd b) 72.0/1.3 52-Week Range 3,240/1,620 1,6,12 Rel. Perf. (%) -4/17/40 Financials & Valuation (INR b) Y/E Dec 2013E
IDBI Bank. CMP: INR106 TP: INR121 Neutral
 BSE SENSEX S&P CNX 17,207 5,223 Bloomberg IDBI IN Equity Shares (m) 1,278.4 52-Week Range (INR) 154/77 1,6,12 Rel.Perf.(%) -1/0/-7 M.Cap. (INR b) 135.5 M.Cap. (USD b) 2.6 24 April 2012 4QFY12 Results Update
Godawari Power & Ispat
 BSE SENSEX S&P CNX CMP: INR103 TP: INR185 Buy 17,077 5,158 Bloomberg GODPI IN Equity Shares (m) 31.8 52-Week Range (INR) 200/70 1,6,12 Rel. Perf. (%) 32/-31/-33 M.Cap. (INR b) 3.3 M.Cap. (USD m) 65.3 Consolidated
Larsen & Toubro. CMP: INR1,278 TP: INR1,380 Buy
 BSE SENSEX S&P CNX 16,786 5,050 Bloomberg LT IN Equity Shares (m) 608.9 52-Week Range (INR) 1,933/971 1,6,12 Rel. Perf. (%) 20/-19/-11 M.Cap. (INR b) 778.1 M.Cap. (USD b) 15.5 * Consolidated; EPS is fully
Siddharth Bothra
 BSE Sensex S&P CNX 19,152 5,797 Bloomberg CSTRL IN Equity Shares (m) 494.6 M.Cap. (INR b)/(usd b) 158/2.9 52-Week Range (INR) 338/223 1,6,12 Rel. Perf. (%) 12/-3/26 Financials & Valuation (INR b) Y/E March
Shree Renuka Sugars. CMP: INR26 TP: INR45 Buy
 BSE SENSEX S&P CNX 16,219 4,924 1 June 2012 6QSY12 Results Update Sector: Sugar CMP: INR26 TP: INR45 Buy Bloomberg SHRS IN Equity Shares (m) 671.0 52-Week Range (INR) 76/23 1,6,12 Rel. Perf. (%) -10/-16/-45
Canara Bank. CMP: INR464 TP: INR645 Buy
 BSE SENSEX S&P CNX 17,234 5,205 Bloomberg CBK IN Equity Shares (m) 443.0 52-Week Range (INR) 672/349 1,6, 12 Rel.Perf.(%) 22/2/-13 M.Cap. (INR b) 205.6 M.Cap. (USD b) 4.1 31 January 2012 3QFY12 Results
Kotak Mahindra Bank. CMP: INR495 TP: INR429 Neutral
 BSE SENSEX S&P CNX 16,739 5,049 Bloomberg KMB IN Equity Shares (m) 689.3 52-Week Range 515/333 1,6,12 Rel.Perf.(%) 0/12/31 M.Cap. (Rs b) 340.5 M.Cap. (US$ b) 6.7 25 January 2012 3QFY12 Results Update Sector:
Sohail Halai Alpesh Mehta
 BSE Sensex S&P CNX 20,039 6,064 Bloomberg IDBI IN Equity Shares (m) 1,278.4 M.Cap. (INR b)/(usd b) 144.9/2.7 52-Week Range (INR) 122/82 1,6,12 Rel.Perf.(%) -1/6/2 Financials & Valuation (INR b) Y/E March
Cummins India. CMP: INR430 TP: INR462 Neutral
 BSE SENSEX S&P CNX 16,070 4,870 Bloomberg KKC IN Equity Shares (m) 277.2 52-Week Range (INR) 515/322 1,6,12 Rel. Perf. (%) -3/30/-4 M.Cap. (INR b) 119.2 M.Cap. (USD b) 2.2 17 May 2012 4QFY12 Results Update
M&M Financial Services
 BSE SENSEX S&P CNX 18,793 5,717 Bloomberg MMFS IN Equity Shares (m) 102.7 52-Week Range (INR) 938/590 1,6,12 Rel.Perf.(%) 7/24/30 M.Cap. (INR b) 90.7 M.Cap. (USD b) 1.7 23 October 2012 2QFY13 Results Update
CMP: INR415 TP: INR 471 BUY
 04 Mar 2013 Update Sector: Technology Wipro CMP: INR415 TP: INR 471 BUY Pipeline and deal signings suggest improvement in growth; Multiple levers and focus on productivity will cushion margin headwinds
Idea Cellular. CMP: INR159 TP: INR200 Buy
 BSE SENSEX S&P CNX 19,164 5,678 Bloomberg IDEA IN Equity Shares (m) 3,316.2 M.Cap. (INR b) / (USD b) 513.7/8.4 52-Week Range (INR) 176/72 1, 6, 12 Rel. Per (%) 12/45/83 Financials & Valuation (INR Billion)
Hindalco. CMP: INR113 TP: INR151 Buy
 BSE SENSEX S&P CNX 18,817 5,724 Bloomberg HNDL IN Equity Shares (m) 1,990.0 52-Week Range (INR) 165/100 1,6,12 Rel. Perf. (%) -9/-18/-26 M.Cap. (INR b) 224.9 M.Cap. (USD b) 4.1 Consolidated 2QFY13 Results
JSW Steel. CMP: INR670 TP: INR391 Sell Merger with JSW Ispat
 BSE SENSEX S&P CNX 17,384 5,254 Bloomberg JSTL IN Equity Shares (m) 223.1 52-Week Range (INR) 885/464 1,6,12 Rel. Perf. (%) -5/-12/-10 M.Cap. (INR b) 149.5 M.Cap. (USD b) 2.7 Valuation summary (INR b)
Monnet Ispat. CMP: INR449 TP: INR518 Neutral
 4QFY12 Results Update Sector: Metals Monnet Ispat BSE SENSEX S&P CNX 16,328 4,943 CMP: INR449 TP: INR518 Neutral Bloomberg MISP IN Equity Shares (m) 64.4 52-Week Range (INR) 561/305 1,6,12 Rel. Perf. (%)
Axis Bank. CMP: INR1,119 TP: INR1,330 Buy
 BSE SENSEX S&P CNX 18,714 5,687 Bloomberg AXSB IN Equity Shares (m) 413.2 52-Week Range (INR) 1,309/785 1,6,12 Rel.Perf.(%) 9/-16/-8 M.Cap. (INR b) 462.4 M.Cap. (USD b) 8.7 16 October 2012 2QFY13 Results
Punjab National Bank. CMP: INR768 TP: INR963 Buy
 BSE SENSEX S&P CNX 16,480 4,975 Bloomberg PNB IN Equity Shares (m) 339.2 52-Week Range (INR) 1,200/751 1,6,12 Rel.Perf.(%) -12/-16/-18 M.Cap. (INR b) 260.5 M.Cap. (USD b) 4.8 10 May 2012 4QFY12 Results
CMP: INR350 TP: INR375 Downgrade to Neutral
 BSE Sensex S&P CNX 19,497 5,897 Bloomberg COAL IN Equity Shares (m) 6,316.4 M.Cap. (INR b)/(usd b) 2,211/41 52-Week Range (INR) 386/301 1,6,12 Rel. Perf. (%) 1/-11/-5 Financials & Valuation (INR b) Y/E
Dabur India. CMP: INR130 TP: INR135 Neutral
 BSE SENSEX S&P CNX 18,625 5,664 29 October 2012 2QFY13 Results Update Sector: Consumer Dabur India CMP: INR130 TP: INR135 Neutral Bloomberg DABUR IN Equity Shares (m) 1,740.7 52-Week Range (Rs) 139/92
Hardick Bora 4QFY13 Results Update Sector: Healthcare Dr Reddy's Laboratories CMP: INR2,026 TP: INR2,375 Buy
 BSE Sensex S&P CNX 19,772 5,995 Bloomberg DRRD IN Equity Shares (m) 169.2 M.Cap. (INR b)/(usd b) 344/6.3 52-Week Range (INR) 2,151/1,528 1,6,12 Rel. Perf. (%) -2/9/0 Financials & Valuation (INR b) Y/E
Dabur India. CMP: INR106 TP: INR94 Neutral
 28 July 2011 1QFY12 Results Update Sector: FMCG BSE SENSEX S&P CNX 18,210 5,488 Dabur India CMP: INR106 TP: INR94 Neutral Bloomberg DABUR IN Equity Shares (m) 1,740.0 52-Week Range (INR) 122/87 1,6,12
Jinesh Gandhi Chirag Jain
 BSE Sensex S&P CNX 19,722 5,995 Bloomberg EIM IN Equity Shares (m) 27.0 M.Cap. (INR b)/(usd b) 88.1/1.6 52-Week Range (INR) 3,285/1,620 1,6,12 Rel. Perf. (%) 10/20/36 Financials & Valuation (INR b) Y/E
Maruti Suzuki. CMP: INR1,395 TP: INR1,730 Buy
 BSE SENSEX S&P CNX 18,431 5,598 Bloomberg MSIL IN Diluted Equity Shares (m) 302.1 52-Week Range (INR) 1,498/906 1,6,12 Rel.Perf.(%) 5/-5/20 M.Cap. (INR b) 421.3 M.Cap. (USD b) 7.8 31 October 2012 2QFY13
Kotak Mahindra Bank. CMP: INR626 TP: INR500 Neutral
 BSE SENSEX S&P CNX 18,759 5,705 Bloomberg KMB IN Equity Shares (m) 740.7 52-Week Range (INR) 652/418 1,6,12 Rel.Perf.(%) -3/-2/18 M.Cap. (INR b) 463.4 M.Cap. (USD b) 8.6 26 October 2012 2QFY13 Results
Hindustan Unilever. CMP:INR324 TP:INR302 Neutral
 BSE SENSEX S&P CNX 18,197 5,482 29 July 2011 1QFY12 Results Update Sector: FMCG Hindustan Unilever CMP:INR324 TP:INR302 Neutral Bloomberg HUVR IN Equity Shares (m) 2,159.5 52-Week Range (INR) 347/250 1,6,12
Godrej Consumer Products
 BSE SENSEX S&P CNX 18,755 5,698 Bloomberg GCPL IN Equity Shares (m) 340.3 52-Week Range (INR) 745/370 1,6,12 Rel. Perf. (%) 4/17/67 M.Cap. (INR b) 246.4 M.Cap. (USD b) 4.6 5 November 2012 2QFY13 Results
Axis Bank. CMP: INR1,008 TP: INR1,240 Buy
 BSE SENSEX S&P CNX 16,739 5,049 Bloomberg AXSB IN Equity Shares (m) 410.5 52-Week Range 1,461/785 1,6,12 Rel.Perf.(%) 11/-9/-9 M.Cap. (INR b) 413.8 M.Cap. (USD b) 8.2 20 January 2012 Results Update Sector:
Steel Authority of India
 BSE SENSEX S&P CNX 16,439 4,990 4QFY12 Results Update Sector: Metals Steel Authority of India CMP: INR93 TP: INR99 Sell Bloomberg SAIL IN Equity Shares (m) 4,130.4 52-Week Range (INR) 151/73 1,6,12 Rel.
Urban demand revives; Akzo gaining market share
 BSE Sensex S&P CNX 22,095 6,601 CMP: INR889 26 March 2014 Update Sector: Consumer Not Rated Urban demand revives; Akzo gaining market share Reiterates focus on Profitable growth Urban demand for Decorative
Oberoi Realty. CMP: INR264 TP: INR315 Buy
 BSE SENSEX S&P CNX 17,151 5,202 Bloomberg OBER IN Equity Shares (m) 328.2 52-Week Range (INR) 323/205 1,6,12 Rel. Perf. (%) 4/15/16 M.Cap. (INR b) 87.0 M.Cap. (USD b) 1.7 26 April 2012 4QFY12 Results Update
Hardick Bora QFY13 Results Update Sector: Healthcare Lupin CMP: INR725 TP: INR851 Buy
 BSE Sensex S&P CNX 19,990 6,069 Bloomberg LPC IN Equity Shares (m) 447.6 M.Cap. (INR b)/(usd b) 324.5/6.0 52-Week Range (INR) 739/507 1,6,12 Rel. Perf. (%) 9/18/13 Financials & Valuation (INR b) Y/E March
Punjab National Bank. CMP: INR940 TP: INR1,275 Buy
 BSE SENSEX S&P CNX 17,194 5,199 Bloomberg PNB IN Equity Shares (m) 316.8 52-Week Range (INR) 1,234/751 1,6,12 Rel.Perf.(%) 9/-10/-9 M.Cap. (INR b) 297.7 M.Cap. (USD b) 6.0 1 February 2012 3QFY12 Results
Sandipan Pal QFY13 Results Update Sector: Real Estate Unitech CMP: INR29 TP: INR44 Buy
 BSE Sensex S&P CNX 19,608 5,933 Bloomberg UT IN Equity Shares (m) 2,438.8 M.Cap. (INR b)/(usd b) 70/1.3 52-Week Range (INR) 41/18 1,6,12 Rel. Perf. (%) -27/24/-13 Financials & Valuation (INR b) Y/E March
Jinesh Gandhi Sandipan Pal
 BSE Sensex S&P CNX 20,224 6,157 Bloomberg BCORP IN Equity Shares (m) 77.0 M.Cap. (INR b)/(usd b) 20.5/0.4 52-Week Range (INR) 342/202 1,6,12 Rel. Perf. (%) 6/-15/-23 Financials & Valuation (INR b) Y/E
Torrent Pharmaceuticals
 BSE SENSEX S&P CNX 21,338 6,339 Bloomberg TRP IN Equity Shares (m) 169.2 M.Cap. (INR b) / (USD b) 80.4/1.3 52-Week Range (INR) 535/324 1, 6, 12 Rel.Per (%) 4/12/32 Financials & Valuation (INR Million)
Godrej Properties. CMP: INR595 TP: INR635 Neutral
 BSE SENSEX S&P CNX 16,913 5,114 Bloomberg GPL IN Equity Shares (m) 78.0 52-Week Range 845/570 1,6,12 Rel. Perf. (%) 0/-9/-2 M.Cap. (INR b) 46.4 M.Cap. (USD b) 0.9 4QFY12 Results Update Sector: Real Estate
Tata Power. CMP: INR111 TP: INR92 Neutral
 BSE SENSEX S&P CNX 17,749 5,382 Bloomberg TPWR IN Equity Shares (m) 2,373.3 52-Week Range (INR) 135/81 1,6,12 Rel. Perf. (%) 10/-5/-10 M.Cap. (INR b) 263.9 M.Cap. (USD b) 5.3 13 February 2012 3QFY12 Results
BHEL. CMP: INR227 TP: INR233 Neutral
 BSE SENSEX S&P CNX 18,636 5,666 Bloomberg BHEL IN Equity Shares (m) 2,447.6 52-Week Range (INR) 368/198 1,6,12 Rel. Perf. (%) -7/-7/-35 M.Cap. (INR b) 556.2 M.Cap. (USD b) 10.3 30 October 2012 2QFY13 Results
Oberoi Realty. CMP: INR269 TP: INR320 Buy
 BSE SENSEX S&P CNX 18,682 5,684 Bloomberg OBER IN Equity Shares (m) 328.2 52-Week Range (INR) 323/205 1,6,12 Rel. Perf. (%) 13/-7/7 M.Cap. (INR b) 88.3 M.Cap. (USD b) 1.6 22 October 2012 2QFY13 Results
Pantaloon Retail. CMP: INR177 TP: INR192 Neutral
 BSE SENSEX S&P CNX 17,773 5,390 Bloomberg PF IN Equity Shares (m) 217.1 52-Week Range (INR) 364/125 1,6,12 Rel. Perf. (%) 9/-49/-29 M.Cap. (Rs b) 38.4 M.Cap. (US$ b) 0.8 14 February 2012 2QFY12 Results
Previous Recommendation: Neutral
 2QFY11 Results Update SECTOR: PHARMACEUTICALS STOCK INFO. BSE Sensex: 20,589 S&P CNX: 6,194 BLOOMBERG JOL IN REUTERS CODE JUBO.BO Equity Shares (m) 170.0 52-Week Range 413/255 1,6,12 Rel. Perf. (%) -4/-34/-8
Amara Raja Batteries. CMP: INR517 TP: INR560 Buy
 BSE SENSEX S&P CNX 25,665 7,672 Bloomberg AMRJ IN Equity Shares (m) 170.8 M.Cap. (INR b) / (USD b) 88.2/1.4 52-Week Range (INR) 520/208 1, 6, 12 Rel. Per (%) 5/21/97 Financials & Valuation (INR Million)
Raymond. Restructuring initiatives bearing fruit; Land bank base case value INR147/share; Reiterate Buy. CMP: INR385 TP: INR462 Buy
 14 June 2012 Update Raymond CMP: INR385 TP: INR462 Buy Restructuring initiatives bearing fruit; Land bank base case value INR147/share; Reiterate Buy We met the management of Raymond (RW IN, Mkt Cap USD0.4b,
Corner Office Interaction with the CEO
 At an inflection point IPR regime to benefit long term; 12-13% topline growth, 31-32% margins We met with Dr Hasit Joshipura (Managing Director) and Mr M B Kapadia (Sr Executive Director) of GlaxoSmithkline
Cement. Demand to grow 8%, with cost push to be passed on CCI probe to have limited impact
 15 May 2012 Update Cement Demand to grow 8%, with cost push to be passed on CCI probe to have limited impact We met with senior managements of the large cement companies in India, to get perspective on
Shoppers Stop. CMP: INR339 TP: INR355 Neutral
 BSE SENSEX S&P CNX 20,684 6,145 Bloomberg SHOP IN Equity Shares (m) 83.1 M.Cap. (INR b) / (USD b) 28.1/0.5 52-Week Range (INR) 494/331 1, 6, 12 Rel. Per (%) -7/-16/-28 Financials & Valuation (INR b) Y/E
Jaypee Infratech. CMP: INR33 TP: INR45 Buy
 BSE SENSEX S&P CNX 2,550,318 Bloomberg JPIN IN Equity Shares (m) 1,388.9 M.Cap. (INR b) / (USD b) 51.3/0.9 52-Week Range (INR) 2/1 1,, 12 Rel. Per (%) 1/9/-3 Financials & Valuation (INR m) Y/E Mar 201
Previous Recommendation: Buy
 2QCY10 Results Update SECTOR: CEMENT ACC STOCK INFO. BSE Sensex: 18,113 S&P CNX: 5,442 BLOOMBERG ACC IN REUTERS CODE ACC.BO Previous Recommendation: Buy Buy Rs816 Equity Shares (m) 187.9 52-Week Range
Thermax. CMP: INR522 TP: INR414 Neutral
 BSE SENSEX S&P CNX 17,605 5,326 Bloomberg TMX IN Equity Shares (m) 119.2 52-Week Range (INR) 720/388 1,6,12 Rel. Perf. (%) 14/1/-21 M.Cap. (INR b) 60.3 M.Cap. (USD b) 1.1 3 February 2012 3QFY12 Results
Stress test: Weak capital servicing ratios to drive pricing discipline
 Stress test: Weak capital servicing ratios to drive pricing discipline Operating performance near trough; expect gradual improvement 20 Update Cement Our analysis of a cross-section of cement companies
Tribhovandas Bhimji Zaveri
 24 April 2012 Update CMP INR TP INR TRIBHOVANDAS BHIMJI ZAVERI Pure jewellery retail play with strong brand; Execution risks priced in; Subscribe (TBZ) is a pure play on the fast-growing branded jewellery
Cross service charges at INR m/quarter
 BSE SENSEX S&P CNX 19,636 5,940 Cummins India CMP: INR504 TP: INR585 Buy LHP products to be an important growth driver Cross service charges at INR100-200m/quarter 20 February 2013 Update Sector: Capital
Market share recovery, price hike, content leverage to drive growth
 BSE Sensex S&P CNX 24,377 7,276 Stock Info Bloomberg DITV IN Equity Shares (m) 1,064.8 52-Week Range (INR) 71/40 1, 6, 12 Rel. Per (%) 6/-15/-41 M.Cap. (INR b) 58.2 M.Cap. (USD b) 1.0 Financial Snapshot
Alpesh Mehta Sohail Halai
 BSE Sensex S&P CNX 19,664 5,969 Bloomberg IIB IN Equity Shares (m) 521.8 M. Cap. (INR b)/(usd b) 227/4.1 52-Week Range (INR) 441/242 1,6,12 Rel.Perf.(%) 3/15/52 Financials & Valuation (INR b) Y/E March
Birla Corporation. CMP: INR216 TP: INR277 Buy
 BSE SENSEX S&P CNX 16,839 5,100 Bloomberg BCORP IN Equity Shares (m) 77.0 52-Week Range (INR) 348/211 1,6,12 Rel. Perf. (%) -5/-19/-25 M.Cap. (INR b) 16.6 M.Cap. (USD b) 0.3 30 July 2012 1QFY13 Results
Just Dial. CMP: INR1,129 TP: INR1,475 Buy
 BSE SENSEX S&P CNX 23,871 7,109 Bloomberg JUST IN Equity Shares (m) 70.2 M.Cap. (INR b) / (USD b) 79.2/1.3 52-Week Range (INR) 1,774/589 1, 6, 12 Rel. Per (%) -18/-7/- Financials & Valuation (INR m) Y/E
Godrej Consumer Products
 BSE SENSEX S&P CNX 16,739 5,049 Bloomberg GCPL IN Equity Shares (m) 323.6 52-Week Range (INR) 464/325 1,6,12 Rel. Perf. (%) 3/3/16 M.Cap. (INR b) 135.6 M.Cap. (USD b) 2.7 24 January 2012 3QFY12 Results
Phoenix Mills. CMP: INR184 TP: INR255 Buy
 BSE SENSEX S&P CNX 16,439 4,990 Bloomberg PHNX IN Equity Shares (m) 144.8 52-Week Range (INR) 229/149 1,6,12 Rel. Perf. (%) -8/-5/10 M.Cap. (INR b) 26.8 M.Cap. (USD b) 0.5 30 May 2012 4QFY12 Results Update
Shree Renuka Sugars. CMP: INR41 TP: INR50 Buy
 BSE SENSEX S&P CNX 18,202 5,532 Bloomberg SHRS IN Equity Shares (m) 671.0 52-Week Range (INR) 87/23 1,6,12 Rel. Perf. (%) 14/-39/-51 M.Cap. (INR b) 27.3 M.Cap. (USD b) 0.6 16 February 2012 5QSY12 Results
Godrej Properties. CMP: INR368 TP: INR420 Neutral
 BSE SENSEX S&P CNX 21,034 6,252 Bloomberg GPL IN Equity Shares (m) 99.6 M.Cap. (INR b) / (USD b) 36.4/ 0.7 52-Week Range (INR) 641/340 1, 6, 12 Rel. Per (%) -1/-44/-47 Financials & Valuation (INR b) Y/E
ITC. CMP: INR201 TP: INR230 Buy
 BSE SENSEX S&P CNX 16,739 5,049 Bloomberg ITC IN Equity Shares (m) 7,738.1 52-Week Range (INR) 211/149 1,6,12 Rel. Perf. (%) 3/23/38 M.Cap. (INR b) 1,601.0 M.Cap. (USD b) 32.1 21 January 2012 Results Update
CMP: INR401 TP: INR516 Buy. * After ESOP charges; # Axon consolidated in December 2008
 19 October 2011 1QFY12 Results Update Sector: Technology BSE SENSEX S&P CNX 16,748 5,038 Bloomberg HCLT IN Equity Shares (m) 700.9 52-Week Range (INR) 528/360 1,6,12 Rel. Perf. (%) 4/-1/7 M.Cap. (INR b)
Reliance Communications
 1QFY11 Results Update SECTOR: TELECOM Reliance Communications STOCK INFO. BSE Sensex: 18,167 S&P CNX: 5,452 BLOOMBERG RCOM IN REUTERS CODE RLCM.BO 13 August 2010 Previous Recommendation: Under Review Buy
Coal India. CMP: INR322 TP: INR370 Buy
 BSE SENSEX S&P CNX 16,439 4,990 Bloomberg COAL IN Equity Shares (m) 6,316.4 52-Week Range (INR) 422/294 1,6,12 Rel. Perf. (%) -4/-3/-7 M.Cap. (INR b) 2,033.9 M.Cap. (USD b) 36.4 30 May 2012 4QFY12 Results
Maruti Suzuki. CMP:Rs1,327 TP:Rs1,625 Buy
 25 April 2011 4QFY11 Results Update Sector: Automobiles Maruti Suzuki BSE SENSEX S&P CNX 19,584 5,875 Bloomberg MSIL IN Diluted Equity Shares (m) 289.0 52-Week Range (Rs) 1,600/1,126 1,6,12 Rel.Perf.(%)
Gautam Duggad Sreekanth P V S
 BSE Sensex S&P CNX 19,990 6,069 Bloomberg FRL IN Equity Shares (m) 217.1 M.Cap. (INR b)/(usd b) 33.4/0.6 52-Week Range (INR) 276/127 1,6,12 Rel. Perf. (%) -10/-32/-20 Financials & Valuation (INR b) Y/E
Punjab National Bank. CMP: INR760 TP: INR964 Buy Asset quality deteriorates; asset-liability well-matched Highlights of FY12 Annual Report
 BSE SENSEX S&P CNX 16,706 5,064 19 June 2012 Annual Report Update Sector: Financials Punjab National Bank CMP: INR760 TP: INR964 Buy Asset quality deteriorates; asset-liability well-matched Highlights
To voluntarily stop supplies to US
 BSE Sensex S&P CNX 26,272 7,831 24 July 2014 Update Sector: Healthcare Ipca Laboratories CMP: INR728 TP: INR930 Buy Stock Info Bloomberg IPCA IN Equity Shares (m) 126.2 52-Week Range (INR) 907/609 1, 6,
CPCB-2: Important long-term driver
 BSE Sensex S&P CNX 20,860 6,217 19 December 2013 Update Sector: Capital Goods Cummins India CMP: INR461 TP: INR540 Buy Stock Info Bloomberg KKC IN Equity Shares (m) 277.2 52-Week Range (INR) 550/365 1,
Eicher Motors. CMP: INR9,281 TP: INR11,401 Buy
 BSE SENSEX S&P CNX 25,881 7,727 Bloomberg EIM IN Equity Shares (m) 27.1 M.Cap. (INR b) / (USD b) 251.5/4.1 52-Week Range (INR) 9,350/2,975 1, 6, 12 Rel. Per (%) 9/83/144 Financials & Valuation (INR Million)
Jinesh Gandhi Sandipan Pal
 BSE Sensex S&P CNX 19,895 6,035 Bloomberg GRASIM IN Equity Shares (m) 91.7 M.Cap. (INR b)/(usd b) 275.8/5.2 52-Week Range (INR) 3,511/2,216 1,6,12 Rel. Perf. (%) -8/-12/-1 Financials & Valuation (INR b)