Hindustan Unilever. CMP:INR324 TP:INR302 Neutral
|
|
|
- Lisa Stevenson
- 6 years ago
- Views:
Transcription
 347/250 1,6,12 Rel. Perf. (%) 0/22/25 M.Cap. (INR b) 699.6 M.Cap. (USD b) 15.")
 management emphasized profitable volume growth, which we believe is a change from its earlier strategy of growing volumes and market share.")
1 BSE SENSEX S&P CNX 18,197 5, July QFY12 Results Update Sector: FMCG Hindustan Unilever CMP:INR324 TP:INR302 Neutral Bloomberg HUVR IN Equity Shares (m) 2, Week Range (INR) 347/250 1,6,12 Rel. Perf. (%) 0/22/25 M.Cap. (INR b) M.Cap. (USD b) 15.7 Key takeaways from the conference call FMCG sector maintained double-digit sales growth in 1QFY12 but volume traction was lower than 4QFY11 levels. The Hindustan Unilever (HUVR) management emphasized profitable volume growth, which we believe is a change from its earlier strategy of growing volumes and market share. It plans to achieve this by increasing cost savings and channelizing them into brand investments and market development. HUVR's 1QFY12 volume grew just 8.3% from 14% in 4QFY11. Personal care volumes grew by more than 15% and soaps and detergent volume growth suffered. Personal care growth was volume led and soap and detergent growth was a mix of volume and value. Detergent volumes increased 19% and soap volumes increased 8% in FY11, a 15- year high, 2-2.5x the industry volume growth. HUVR increased prices of soaps and detergents (7-8% the weighted average) over the past few months. The management indicated price increases had not sufficiently covered input cost inflation in PFAD and LAB. HUVR's ad spends declined 16% (420bp) mainly due to lower ad spends on commodity linked categories like soaps and detergents, which was in line with competitive spends in the category. However ad spends of personal care and processed foods increased. It's undertook new launches in the personal products and foods categories. Major launches include Fair and Lovely face wash, Ponds cream, Clear Nutrium shampoo, Bru Exotica coffee and Lipton ice tea. Cutting FY12 volume growth estimates; Neutral: We are reducing FY12 volume growth estimates from 11% to 8.5% due to a sharp decline in volume growth and increased pricing component in the mix. We increased FY12 EBITDA margin estimates from 13.6% to 13.9%. However our EPS estimates at INR11.2 for FY12 and INR12.6 for FY13 are unchanged. We believe a decline in volume growth and volatility in input costs are key risks to multiples. The stock trades at 29x FY12E EPS of INR11.2 and 25.6x FY13E EPS of INR12.6. Maintain Neutral. Amnish Aggarwal (AmnishAggarwal@MotilalOswal.com); Tel: Harit Kapoor (Harit.Kapoor@MotilalOswal.com); Tel:
2 Conference call takeaways: Soap, detergent volume growth falls, price increases inadequate We attended an HUVR conference call to understand the likely trend in volume growth, competitive intensity and input costs. Key takeaways are: The FMCG sector is maintaining double digit sales growth but volume traction is lower than 4QFY11 levels. Urban India is growing faster than rural India as per AC Nielsen, however as per HUVR's internal study the rural segment is growing ahead of the urban market. The HUVR management has emphasized profitable volume growth, which we believe is a change from its earlier strategy of growing volumes and market share. It plans to achieve this by increasing cost savings (15% overhead reduction and 60% increase in supply chain savings in two years) and channelizing them into increased brand investments and market development. HUVR's 1QFY12 volume growth softened to 8.3% from 14% in 4QFY11. Personal care volumes grew by more than 15% and soap and detergent volume growth suffered. Personal care growth is volume led and soap and detergent growth is a mix of volume and value. Detergent volumes increased 19% and soap volumes 8% in FY11, a 15-year high, which is 2-2.5x the industry volume growth. HUVR increased soap and detergent prices (7-8% weighted average) over the past few months. The management indicated that the price increases were not sufficient to cover the input cost inflation in PFAD and LAB. HUVR's ad spends declined 16% (420bp) mainly due to lower ad spends on commodity-linked categories like soaps and detergents, which was in line with competitive spends in the category. However personal care and processed foods ad-spends increased. HUVR undertook new launches in the personal products and foods segments. Major launches include FAL face wash, Ponds cream, Clear Nutrium shampoo, Bru exotica coffee and Lipton ice tea. 1QFY12 volumes up, gross margin falls; 16% cut in ad spend enables 11% PAT growth HUVR's 1QFY12 net revenue grew 14.4% to INR55.8b (against our estimate of INR55.3b), led by 8.3% volume growth (against our estimate of 12%). Gross margin contracted 490bp to 44.9% (against our estimate of 47%) due to a sharp increase in input costs and inadequate price increases. Ad-spend declined 16% YoY (420bp) to 11.3% to INR6.3b. Staff cost increased 14.2% YoY, after 2.7% YoY growth in FY11. EBITDA increased by 10.8% to INR7.5b (against our estimate of INR7.4b) as margin contraction was restricted to 50bp at 13.5% (against our estimate of 13.3%), mainly due to a sharp cut in ad-spends. Other income increased 20% YoY to INR506m (against our estimate of INR450m). The tax rate increased to 22.7% from 22.2% YoY. Adjusted PAT increased 11% to INR5.8b (against our estimate of INR5.6b). 29 July
3 Domestic FMCG sales grow to a new high, powered by higher prices volume grows (%) in single digits Sep-09 Mar-10 Sep-10 Mar-11 Sep-09 Mar-10 Sep-10 Mar-11 Gross margins fall 490bp YoY.410bp decline in ad-spends cushions margin decline, ad spends unsustainable Gross Margins (%) EBITDA Margins (%) Aug-09 Oct-09 Feb-10 Apr-10 Aug-10 Oct-10 Feb-11 Apr-11 1QFY10 2QFY10 3QFY10 4QFY10 1QFY11 2QFY11 3QFY11 4QFY11 1QFY12 Source: Company/MOSL Soap, detergent margins up QoQ; personal care EBIT up YoY Soaps and detergents: Sales grew 12.8% and margins increased 170bp QoQ to 9.2% (down 170bp YoY) and EBIT declined 5%. Volumes grew across detergent brands and Rin volumes increased by double digits. Lifebuoy delivered double digit growth and hand and body wash sales were up 200% over the past two years. Personal products: Sales grew 19.4% as all product segments sustained strong volumes. EBIT grew 22% as margins expanded 50bp YoY to 25.3%. Hair care and oral care delivered double digit growth. HUVR launched FAL multi-vitamin face wash and Clear with Nutrium 10 technology. Beverages: Sales grew 13.1%. EBIT increased 8.4% and margins fell 50bp YoY to 12.4%. Lipton ice tea was launched on the Lite refreshment platform and HUVR entered the premium coffee segment. Foods: Sales grew 17.8% (26% in 4QFY11) and margins fell 350bp YoY to 4.7%. EBIT declined 33% as HUVR promoted new launches like Kissan Creamy Spread, Juice and Soymilk drink, Nutri Smart malted food drink. 29 July
4 Segmental snapshot: Margin pressure in soaps, detergents, foods Segmental FY11 FY10 Chg. (%) 1QFY12 1QFY11 Chg. (%) Net Sales (INR m) Soaps and Detergents 87,916 82, ,550 22, Personal Products 58,441 50, ,307 13, Beverages 23,440 21, ,086 5, Processed Foods 9,026 7, ,721 3, Exports 10,997 10, ,063 2, EBIT (INR m) Soaps and Detergents 8,341 11, ,361 2, Personal Products 14,948 12, ,133 3, Beverages 3,578 3, Processed Foods Exports EBIT Margin (%) Soaps and Detergents Personal Products Beverages Processed Foods Exports Source: Company/MOSL Personal products EBIT grows 22% on 19% sales growth Sales Grow th (%) PBIT Margin (%) Soap, detergent margins bottom out; up 170bp QoQ EBIT Margin (%) Sales Grow th % (2.4) (1.9) Sep-09 Mar-10 Sep-10 Mar-11 Sep-09 Mar-10 Sep-10 Mar-11 Source: Company/MOSL PFAD prices down 20% from peak; LAB prices maintain uptrend PFAD prices declined 20% from their peak and the benefit of the decline will start accruing to HUVR from 2QFY12. However LAB prices are inching up as crude prices rise. LAB prices have climbed 27% YoY over the past six months. Besides, prices of other inputs like tea, coffee, vegetable oil and packaging are high on a YoY basis. HUVR undertook staggered price increases in soaps and detergents but heightened competitive activity will prevent a sharp margin rebound. Our estimates factor in a 40bp decline in gross margins for FY12 and a 30bp expansion in FY July
5 PFAD prices down 26% from their peak LAB prices up 27% YoY Source: Company/MOSL Cutting volume growth estimates, price increases to compensate; Neutral We expect gross margins to increase in the coming quarters led by (1) a 32% decline in PFAD prices from their peak, (2) calibrated increase in detergent prices (8-17%) and toilet soap prices (5-11%) over the past six months and (3) sustained growth above teens in the personal care category. We expect volume growth to decline further led by (1) the impact of high price increases in soaps and detergents in the current environment of high inflation and (2) a high base effect as FY11 volume grew 16% for detergents and 8% for toilet soaps (much above long-term industry growth) (3) the contribution of distribution expansion to growth. We are reducing volume growth estimates from 11% to 8.5% in FY12 due to a sharp decline in volume growth. We have reduced volume growth and increased the pricing component in the mix. Our EBITDA margin estimate is increased from 13.6% to 13.9%. However our EPS estimates of INR11.2 in FY12 and INR12.6 in FY13 are unchanged. Further decline in volume growth and volatility in input costs are a key risk to multiples. The stock trades at 29x FY12E EPS of INR11.2 and 25.6x FY13E EPS of INR12.6. Neutral. 29 July
6 Hindustan Unilever: an investment profile Company description Hindustan Unilever (HUVR) is India's largest company in the FMCG industry, with market leadership in soaps, detergents and personal care categories. It has a wide distribution network with direct reach of over 1m retail outlets. HUVR is a subsidiary of Anglo Dutch FMCG giant Unilever. Key investment arguments Market leader in most categories with strong brands; Wide product range across categories with a presence at all price points; Decline in raw material prices will improve margins. Key Investment risks Loss of market share forced HUVR to pass on significant benefits from reduction in raw material prices. Competitive pressure intensified with more companies entering the personal care, toilet soap and detergent markets, which account for 80% of HUVR's profits. Recent developments HUVR effected price increases in its key detergent and soap brands. In 1QFY12 HUVR's launches focused on skin, hair care and processed foods. Valuation and view We estimate EPS of INR11.2 in FY12 and INR12.6 in FY13. The stock trades 29x FY12E and 25.6xFY13E. Maintain Neutral. Sector view We have a cautious view on the sector due to inflationary pressure in the economy. Companies with a competitive position would be better placed to withstand a slowdown in a segment. Long term prospects bright, given rising incomes and low penetration. Comparative valuations HLL ITC Nestle P/E (x) FY12E FY13E EV/EBITDA (x) FY12E FY13E EV/Sales (x) FY12E FY13E P/BV (x) FY12E FY13E EPS: MOSL forecast v/s Consensus (INR) MOSL Consensus Variation Forecast Forecast (%) FY FY Target price and recommendation Current Target Upside Reco. Price (INR) Price (INR) (%) Neutral Stock performance Shareholding Pattern (%) Mar-11 Promoter Domestic Inst Foreign Others Hind. Unilever Sensex - Rebased Jul-10 Oct-10 Jan-11 Apr-11 Jul July
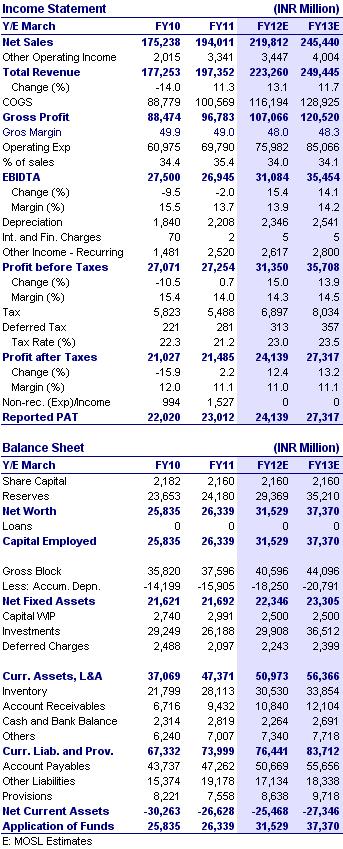
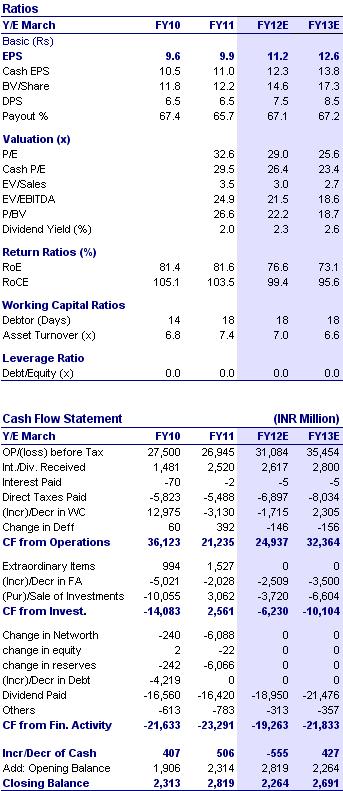
7 Financials and Valuations 29 July
8 Disclosures This report is for personal information of the authorized recipient and does not construe to be any investment, legal or taxation advice to you. This research report does not constitute an offer, invitation or inducement to invest in securities or other investments and Motilal Oswal Securities Limited (hereinafter referred as MOSt) is not soliciting any action based upon it. This report is not for public distribution and has been furnished to you solely for your information and should not be reproduced or redistributed to any other person in any form. Unauthorized disclosure, use, dissemination or copying (either whole or partial) of this information, is prohibited. The person accessing this information specifically agrees to exempt MOSt or any of its affiliates or employees from, any and all responsibility/liability arising from such misuse and agrees not to hold MOSt or any of its affiliates or employees responsible for any such misuse and further agrees to hold MOSt or any of its affiliates or employees free and harmless from all losses, costs, damages, expenses that may be suffered by the person accessing this information due to any errors and delays. The information contained herein is based on publicly available data or other sources believed to be reliable. While we would endeavour to update the information herein on reasonable basis, MOSt and/or its affiliates are under no obligation to update the information. Also there may be regulatory, compliance, or other reasons that may prevent MOSt and/or its affiliates from doing so. MOSt or any of its affiliates or employees shall not be in any way responsible and liable for any loss or damage that may arise to any person from any inadvertent error in the information contained in this report. MOSt or any of its affiliates or employees do not provide, at any time, any express or implied warranty of any kind, regarding any matter pertaining to this report, including without limitation the implied warranties of merchantability, fitness for a particular purpose, and non-infringement. The recipients of this report should rely on their own investigations. This report is intended for distribution to institutional investors. Recipients who are not institutional investors should seek advice of their independent financial advisor prior to taking any investment decision based on this report or for any necessary explanation of its contents. MOSt and/or its affiliates and/or employees may have interests/positions, financial or otherwise in the securities mentioned in this report. To enhance transparency, MOSt has incorporated a Disclosure of Interest Statement in this document. This should, however, not be treated as endorsement of the views expressed in the report. Disclosure of Interest Statement Hindustan Unilever 1. Analyst ownership of the stock No 2. Group/Directors ownership of the stock No 3. Broking relationship with company covered No 4. Investment Banking relationship with company covered No Analyst Certification The views expressed in this research report accurately reflect the personal views of the analyst(s) about the subject securities or issues, and no part of the compensation of the research analyst(s) was, is, or will be directly or indirectly related to the specific recommendations and views expressed by research analyst(s) in this report. The research analysts, strategists, or research associates principally responsible for preparation of MOSt research receive compensation based upon various factors, including quality of research, investor client feedback, stock picking, competitive factors and firm revenues. Regional Disclosures (outside India) This report is not directed or intended for distribution to or use by any person or entity resident in a state, country or any jurisdiction, where such distribution, publication, availability or use would be contrary to law, regulation or which would subject MOSt & its group companies to registration or licensing requirements within such jurisdictions. For U.K. This report is intended for distribution only to persons having professional experience in matters relating to investments as described in Article 19 of the Financial Services and Markets Act 2000 (Financial Promotion) Order 2005 (referred to as "investment professionals"). This document must not be acted on or relied on by persons who are not investment professionals. Any investment or investment activity to which this document relates is only available to investment professionals and will be engaged in only with such persons. For U.S. MOSt is not a registered broker-dealer in the United States (U.S.) and, therefore, is not subject to U.S. rules. In reliance on the exemption from registration provided by Rule 15a-6 of the U.S. Securities Exchange Act of 1934, as amended (the "Exchange Act") and interpretations thereof by the U.S. Securities and Exchange Commission ("SEC") in order to conduct business with Institutional Investors based in the U.S., Motilal Oswal has entered into a chaperoning agreement with a U.S. registered broker-dealer, Marco Polo Securities Inc. ("Marco Polo"). This report is intended for distribution only to "Major Institutional Investors" as defined by Rule 15a-6(b)(4) of the Exchange Act and interpretations thereof by SEC (henceforth referred to as "major institutional investors"). This document must not be acted on or relied on by persons who are not major institutional investors. Any investment or investment activity to which this document relates is only available to major institutional investors and will be engaged in only with major institutional investors. The Research Analysts contributing to the report may not be registered /qualified as research analyst with FINRA. Such research analyst may not be associated persons of the U.S. registered broker-dealer, Marco Polo and therefore, may not be subject to NASD rule 2711 and NYSE Rule 472 restrictions on communication with a subject company, public appearances and trading securities held by a research analyst account. Motilal Oswal Securities Ltd 3rd Floor, Hoechst House, Nariman Point, Mumbai Phone: (91-22) Fax: (91-22) reports@motilaloswal.com
Asian Paints. CMP: INR2,722 TP: INR3,161 Buy
 BSE SENSEX S&P CNX 16,739 5,049 Bloomberg APNT IN Equity Shares (m) 95.9 52-Week Range (INR) 3,366/2,395 1,6,12 Rel. Perf. (%) -5/-3/14 M.Cap. (INR b) 261.1 M.Cap. (USD b) 4.9 23 January 2012 3QFY12 Results
Dabur India. CMP: INR106 TP: INR94 Neutral
 28 July 2011 1QFY12 Results Update Sector: FMCG BSE SENSEX S&P CNX 18,210 5,488 Dabur India CMP: INR106 TP: INR94 Neutral Bloomberg DABUR IN Equity Shares (m) 1,740.0 52-Week Range (INR) 122/87 1,6,12
Pidilite Industries. CMP: INR164 TP: INR186 Buy
 BSE SENSEX S&P CNX 16,640 5,043 Bloomberg PIDI IN Equity Shares (m) 506.1 52-Week Range (INR) 188/134 1,6,12 Rel. Perf. (%) 1/20/5 M.Cap. (INR b) 83.0 M.Cap. (USD b) 1.5 27 July 2012 1QFY13 Results Update
Punjab National Bank. CMP:INR1,103 TP:INR1,500 Buy
 BSE SENSEX S&P CNX 18,210 5,488 28 July 2011 1QFY12 Results Update Sector: Banking Punjab National Bank CMP:INR1,103 TP:INR1,500 Buy Bloomberg PNB IN Equity Shares (m) 316.8 52-Week Range (INR) 1,395/971
Godrej Consumer Products
 BSE SENSEX S&P CNX 17,602 5,337 Bloomberg GCPL IN Equity Shares (m) 340.3 52-Week Range (INR) 658/370 1,6,12 Rel. Perf. (%) 5/37/42 M.Cap. (INR b) 205.9 M.Cap. (USD b) 3.7 7 August 2012 1QFY13 Results
Jubilant Foodworks. CMP: INR1,189 TP: INR1,0541,054 Neutral
 BSE SENSEX S&P CNX 16,846 5,110 Bloomberg JUBI IN Equity Shares (m) 63.5 52-Week Range (INR) 1,189/633 1,6,12 Rel. Perf. (%) 4/38/47 M.Cap. (INR b) 75.5 M.Cap. (USD b) 1.3 26 July 2012 1QFY13 Results Update
Titan Industries. CMP: INR222 TP: INR220 Neutral
 BSE SENSEX S&P CNX 17,257 5,241 Bloomberg TTAN IN Equity Shares (m) 887.8 52-Week Range (INR) 255/154 1,6,12 Rel. Perf. (%) -1/13/3 M.Cap. (Rs b) 197.1 M.Cap. (US$ b) 3.6 2 August 2012 1QFY13 Results Update
Jubilant Foodworks. CMP: INR1,051 TP: INR1,054 Neutral
 BSE SENSEX S&P CNX 16,420 4,966 Bloomberg JUBI IN Equity Shares (m) 63.5 52-Week Range (INR) 1,144/536 1,6,12 Rel. Perf. (%) -6/37/53 M.Cap. (INR b) 66.7 M.Cap. (USD b) 1.3 11 May 2012 4QFY12 Results Update
CMP: INR121 TP: INR193 Buy
 BSE SENSEX S&P CNX 17,085 5,139 20 October 2011 2QFY12 Results Update Sector: Metals Hindustan Zinc CMP: INR121 TP: INR193 Buy Bloomberg HZ IN Equity Shares (m) 4,225.3 52-Week Range (INR) 155/109 1,6,12
IDBI Bank. CMP: INR106 TP: INR121 Neutral
 BSE SENSEX S&P CNX 17,207 5,223 Bloomberg IDBI IN Equity Shares (m) 1,278.4 52-Week Range (INR) 154/77 1,6,12 Rel.Perf.(%) -1/0/-7 M.Cap. (INR b) 135.5 M.Cap. (USD b) 2.6 24 April 2012 4QFY12 Results Update
BGR Energy. CMP: INR284 TP: INR296 Neutral
 BSE SENSEX S&P CNX 16,312 4,951 Bloomberg BGRL IN Equity Shares (m) 72.0 52-Week Range (INR) 512/173 1,6,12 Rel. Perf. (%) -8/8/-31 M.Cap. (INR b) 20.5 M.Cap. (USD b) 0.4 31 May 2012 4QFY12 Results Update
Unitech. CMP: INR20 TP: INR30 Buy
 BSE SENSEX S&P CNX 16,328 4,943 Bloomberg UT IN Equity Shares (m) 2,438.8 52-Week Range (INR) 38/17 1,6,12 Rel. Perf. (%) -25/-14/-34 M.Cap. (INR b) 48.8 M.Cap. (USD b) 0.9 16 May 2012 4QFY12 Results Update
IndusInd Bank. CMP: INR345 TP: INR419 Buy
 BSE SENSEX S&P CNX 17,504 5,332 Bloomberg IIB IN Equity Shares (m) 467.7 52-Week Range (INR) 352/222 1,6,12 Rel.Perf.(%) 13/25/34 M.Cap. (INR b) 161.4 M.Cap. (USD b) 3.1 20 April 2012 4QFY12 Results Update
Larsen & Toubro. CMP: INR1,160 TP: INR1,417 Buy
 BSE SENSEX S&P CNX 16,216 4,908 Bloomberg LT IN Equity Shares (m) 608.9 52-Week Range (INR) 1,868/971 1,6,12 Rel. Perf. (%) -4/-7/12 M.Cap. (INR b) 706.3 M.Cap. (USD b) 13.1 * Consolidated; EPS is fully
BGR Energy. CMP: INR266 TP: INR230 Neutral
 BSE SENSEX S&P CNX 18,562 5,645 Bloomberg BGRL IN Equity Shares (m) 72.0 52-Week Range (INR) 374/173 1,6,12 Rel. Perf. (%) -3/27/-24 M.Cap. (INR b) 19.2 M.Cap. (USD b) 0.4 3 November 2012 2QFY13 Results
Godawari Power & Ispat
 BSE SENSEX S&P CNX CMP: INR103 TP: INR185 Buy 17,077 5,158 Bloomberg GODPI IN Equity Shares (m) 31.8 52-Week Range (INR) 200/70 1,6,12 Rel. Perf. (%) 32/-31/-33 M.Cap. (INR b) 3.3 M.Cap. (USD m) 65.3 Consolidated
Cummins India. CMP: INR430 TP: INR462 Neutral
 BSE SENSEX S&P CNX 16,070 4,870 Bloomberg KKC IN Equity Shares (m) 277.2 52-Week Range (INR) 515/322 1,6,12 Rel. Perf. (%) -3/30/-4 M.Cap. (INR b) 119.2 M.Cap. (USD b) 2.2 17 May 2012 4QFY12 Results Update
Reliance Infrastructure CMP: INR528
 BSE SENSEX S&P CNX 17,657 5,363 16 August 2012 1QFY13 Results Update Sector: Utilities Reliance Infrastructure CMP: INR528 Buy Bloomberg RELI IN Equity Shares (m) 267.5 52-Week Range (INR) 680/328 1,6,12
BGR Energy. CMP: INR282 TP: INR253 Neutral
 BSE SENSEX S&P CNX 17,413 5,283 Bloomberg BGRL IN Equity Shares (m) 72.0 52-Week Range (INR) 378/173 1,6,12 Rel. Perf. (%) -9/17/-22 M.Cap. (INR b) 20.3 M.Cap. (USD b) 0.4 6 August 2012 1QFY13 Results
Godrej Consumer Products
 3QFY11 Results Update SECTOR: FMCG BSE SENSEX S&P CNX 19,151 5,743 Rs400 Godrej Consumer Products Neutral Bloomberg GCPL IN Equity Shares (m) 323.6 52-Week Range (Rs) 480/225 1,6,12 Rel. Perf. (%) 7/6/46
Hardick Bora
 BSE Sensex S&P CNX 19,990 6,069 Bloomberg JOL IN Equity Shares (m) 159.3 M.Cap. (INR b)/(usd b) 26.0/0.5 52-Week Range (INR) 248/154 1,6,12 Rel. Perf. (%) -18/-28/-34 Financials & Valuation (INR b) Y/E
NTPC CMP: INR169 TP: INR191 Buy
 BSE SENSEX S&P CNX 18,625 5,664 Bloomberg NTPC IN Equity Shares (m) 8,245.5 52-Week Range (INR) 190/139 1,6,12 Rel. Perf. (%) 3/-4/-11 M.Cap. (INR b) 1,393.5 M.Cap. (USD b) 26.0 26 October 2012 2QFY13
Sanofi India. CMP: INR2,200 TP: INR1,848 Neutral
 BSE SENSEX S&P CNX 16,846 5,110 Bloomberg SANL IN Equity Shares (m) 23.0 52-Week Range (INR) 2,430/1,980 1,6,12 Rel. Perf. (%) 3/-3/15 M.Cap. (INR b) 50.7 M.Cap. (USD b) 0.9 26 July 2012 2QCY12 Results
Canara Bank. CMP: INR419 TP: INR525 Buy
 BSE SENSEX S&P CNX 18,817 5,724 Bloomberg CBK IN Equity Shares (m) 443.0 52-Week Range (INR) 566/349 1,6, 12 Rel.Perf.(%) -7/-18/-17 M.Cap. (INR b) 170.3 M.Cap. (USD b) 3.0 7 November 2012 2QFY13 Results
Larsen & Toubro. CMP: INR1,278 TP: INR1,380 Buy
 BSE SENSEX S&P CNX 16,786 5,050 Bloomberg LT IN Equity Shares (m) 608.9 52-Week Range (INR) 1,933/971 1,6,12 Rel. Perf. (%) 20/-19/-11 M.Cap. (INR b) 778.1 M.Cap. (USD b) 15.5 * Consolidated; EPS is fully
Canara Bank. CMP: INR464 TP: INR645 Buy
 BSE SENSEX S&P CNX 17,234 5,205 Bloomberg CBK IN Equity Shares (m) 443.0 52-Week Range (INR) 672/349 1,6, 12 Rel.Perf.(%) 22/2/-13 M.Cap. (INR b) 205.6 M.Cap. (USD b) 4.1 31 January 2012 3QFY12 Results
Idea Cellular. CMP: INR81 TP: INR Under Review
 BSE SENSEX S&P CNX 16,918 5,128 Bloomberg IDEA IN Equity Shares (m) 3,308.8 52-Week Range (INR) 104/71 1,6,12 Rel. Perf. (%) 6/-13/4 M.Cap. (INR b) 268.0 M.Cap. (USD b) 4.8 25 July 2012 1QFY13 Results
Dabur India. CMP: INR130 TP: INR135 Neutral
 BSE SENSEX S&P CNX 18,625 5,664 29 October 2012 2QFY13 Results Update Sector: Consumer Dabur India CMP: INR130 TP: INR135 Neutral Bloomberg DABUR IN Equity Shares (m) 1,740.7 52-Week Range (Rs) 139/92
Jaiprakash Associates
 BSE SENSEX S&P CNX 16,312 4,951 Bloomberg JPA IN Equity Shares (m) 2,126.5 52-Week Range (INR) 89/50 1,6,12 Rel. Perf. (%) -14/-4/-17 M.Cap. (INR b) 127.9 M.Cap. (USD b) 2.3 31 May 2012 4QFY12 Results
Dabur India. Neutral. Rs93
 3QFY11 Results Update SECTOR: FMCG BSE SENSEX S&P CNX 18,022 5,417 Bloomberg DABUR IN Equity Shares (m) 1,738.0 52-Week Range (Rs) 112/79 1,6,12 Rel. Perf. (%) 5/-5/2 M.Cap. (Rs b) 160.8 M.Cap. (US$ b)
Niket Shah
 BSE Sensex S&P CNX 20,213 6,147 Bloomberg VGRD IN Equity Shares (m) 29.8 M.Cap. (INR b)/(usd b) 14.6/0.3 52-Week Range (INR) 591/180 1,6,12 Rel. Perf. (%) -8/-6/138 Financial summary (INR b) Y/E March
Godrej Consumer Products
 BSE SENSEX S&P CNX 18,755 5,698 Bloomberg GCPL IN Equity Shares (m) 340.3 52-Week Range (INR) 745/370 1,6,12 Rel. Perf. (%) 4/17/67 M.Cap. (INR b) 246.4 M.Cap. (USD b) 4.6 5 November 2012 2QFY13 Results
Pantaloon Retail. CMP: INR177 TP: INR192 Neutral
 BSE SENSEX S&P CNX 17,773 5,390 Bloomberg PF IN Equity Shares (m) 217.1 52-Week Range (INR) 364/125 1,6,12 Rel. Perf. (%) 9/-49/-29 M.Cap. (Rs b) 38.4 M.Cap. (US$ b) 0.8 14 February 2012 2QFY12 Results
Shree Renuka Sugars. CMP: INR26 TP: INR45 Buy
 BSE SENSEX S&P CNX 16,219 4,924 1 June 2012 6QSY12 Results Update Sector: Sugar CMP: INR26 TP: INR45 Buy Bloomberg SHRS IN Equity Shares (m) 671.0 52-Week Range (INR) 76/23 1,6,12 Rel. Perf. (%) -10/-16/-45
Sanjay Jain Pavas Pethia
 BSE Sensex S&P CNX 19,561 5,923 Bloomberg SAIL IN Equity Shares (m) 4,130.4 M.Cap. (INR b)/(usd b) 334.6/6.2 52-Week Range (INR) 116/76 1,6,12 Rel. Perf. (%) -11/-17/-38 Financials & Valuation (INR b)
Kotak Mahindra Bank. CMP: INR495 TP: INR429 Neutral
 BSE SENSEX S&P CNX 16,739 5,049 Bloomberg KMB IN Equity Shares (m) 689.3 52-Week Range 515/333 1,6,12 Rel.Perf.(%) 0/12/31 M.Cap. (Rs b) 340.5 M.Cap. (US$ b) 6.7 25 January 2012 3QFY12 Results Update Sector:
Godrej Consumer Products
 BSE SENSEX S&P CNX 16,739 5,049 Bloomberg GCPL IN Equity Shares (m) 323.6 52-Week Range (INR) 464/325 1,6,12 Rel. Perf. (%) 3/3/16 M.Cap. (INR b) 135.6 M.Cap. (USD b) 2.7 24 January 2012 3QFY12 Results
ITC. CMP: INR201 TP: INR230 Buy
 BSE SENSEX S&P CNX 16,739 5,049 Bloomberg ITC IN Equity Shares (m) 7,738.1 52-Week Range (INR) 211/149 1,6,12 Rel. Perf. (%) 3/23/38 M.Cap. (INR b) 1,601.0 M.Cap. (USD b) 32.1 21 January 2012 Results Update
Monnet Ispat. CMP: INR449 TP: INR518 Neutral
 4QFY12 Results Update Sector: Metals Monnet Ispat BSE SENSEX S&P CNX 16,328 4,943 CMP: INR449 TP: INR518 Neutral Bloomberg MISP IN Equity Shares (m) 64.4 52-Week Range (INR) 561/305 1,6,12 Rel. Perf. (%)
Punjab National Bank. CMP: INR716 TP: INR950 Buy
 BSE SENSEX S&P CNX 16,839 5,100 Bloomberg PNB IN Equity Shares (m) 339.2 52-Week Range (INR) 1,144/703 1,6,12 Rel.Perf.(%) -8/-24/-28 M.Cap. (INR b) 242.8 M.Cap. (USD b) 4.4 30 July 2012 1QFY13 Results
ITC. Buy. Rs169. 3QFY11 Results Update 19,008 5,697
 Results Update SECTOR: FMCG BSE SENSEX S&P CNX 19,8 5,697 Bloomberg ITC IN Equity Shares (m) 7,75.9 52-Week Range (Rs) 185/112 1,6,12 Rel. Perf. (%) 6/9/3 M.Cap. (Rs b) 1,31.5 M.Cap. (US$ b) 29.3 Rs169
Petronet LNG. CMP: INR146 TP: INR205 Buy
 BSE SENSEX S&P CNX 17,236 5,229 Bloomberg PLNG IN Equity Shares (m) 750.0 52-Week Range (INR) 186/122 1,6,12 Rel. Perf. (%) 3/-11/-10 M.Cap. (INR b) 109.7 M.Cap. (USD b) 2.0 1 August 2012 1QFY13 Results
Sohail Halai Alpesh Mehta
 BSE Sensex S&P CNX 20,039 6,064 Bloomberg IDBI IN Equity Shares (m) 1,278.4 M.Cap. (INR b)/(usd b) 144.9/2.7 52-Week Range (INR) 122/82 1,6,12 Rel.Perf.(%) -1/6/2 Financials & Valuation (INR b) Y/E March
Coal India CMP: INR348 TP: INR408 Buy
 BSE SENSEX S&P CNX 17,633 5,348 Bloomberg COAL IN Equity Shares (m) 6,316.4 52-Week Range (INR) 404/294 1,6,12 Rel. Perf. (%) -4/4/-15 M.Cap. (INR b) 2,198.1 M.Cap. (USD b) 39.7 14 August 2012 1QFY13 Results
Strides Arcolab. CMP: INR717 TP: INR829 Buy
 BSE SENSEX S&P CNX 17,144 5,200 Bloomberg STR IN Equity Shares (m) 57.7 52-Week Range (INR) 794/276 1,6,12 Rel. Perf. (%) -2/37/98 M.Cap. (INR b) 41.4 M.Cap. (USD b) 0.7 31 July 2012 2QCY12 Results Update
Axis Bank. CMP: INR1,008 TP: INR1,240 Buy
 BSE SENSEX S&P CNX 16,739 5,049 Bloomberg AXSB IN Equity Shares (m) 410.5 52-Week Range 1,461/785 1,6,12 Rel.Perf.(%) 11/-9/-9 M.Cap. (INR b) 413.8 M.Cap. (USD b) 8.2 20 January 2012 Results Update Sector:
Punjab National Bank. CMP: INR940 TP: INR1,275 Buy
 BSE SENSEX S&P CNX 17,194 5,199 Bloomberg PNB IN Equity Shares (m) 316.8 52-Week Range (INR) 1,234/751 1,6,12 Rel.Perf.(%) 9/-10/-9 M.Cap. (INR b) 297.7 M.Cap. (USD b) 6.0 1 February 2012 3QFY12 Results
CMP: INR350 TP: INR375 Downgrade to Neutral
 BSE Sensex S&P CNX 19,497 5,897 Bloomberg COAL IN Equity Shares (m) 6,316.4 M.Cap. (INR b)/(usd b) 2,211/41 52-Week Range (INR) 386/301 1,6,12 Rel. Perf. (%) 1/-11/-5 Financials & Valuation (INR b) Y/E
M&M Financial Services
 BSE SENSEX S&P CNX 18,793 5,717 Bloomberg MMFS IN Equity Shares (m) 102.7 52-Week Range (INR) 938/590 1,6,12 Rel.Perf.(%) 7/24/30 M.Cap. (INR b) 90.7 M.Cap. (USD b) 1.7 23 October 2012 2QFY13 Results Update
Steel Authority of India
 BSE SENSEX S&P CNX 16,439 4,990 4QFY12 Results Update Sector: Metals Steel Authority of India CMP: INR93 TP: INR99 Sell Bloomberg SAIL IN Equity Shares (m) 4,130.4 52-Week Range (INR) 151/73 1,6,12 Rel.
Oberoi Realty. CMP: INR264 TP: INR315 Buy
 BSE SENSEX S&P CNX 17,151 5,202 Bloomberg OBER IN Equity Shares (m) 328.2 52-Week Range (INR) 323/205 1,6,12 Rel. Perf. (%) 4/15/16 M.Cap. (INR b) 87.0 M.Cap. (USD b) 1.7 26 April 2012 4QFY12 Results Update
Punjab National Bank. CMP: INR768 TP: INR963 Buy
 BSE SENSEX S&P CNX 16,480 4,975 Bloomberg PNB IN Equity Shares (m) 339.2 52-Week Range (INR) 1,200/751 1,6,12 Rel.Perf.(%) -12/-16/-18 M.Cap. (INR b) 260.5 M.Cap. (USD b) 4.8 10 May 2012 4QFY12 Results
Raymond. Restructuring initiatives bearing fruit; Land bank base case value INR147/share; Reiterate Buy. CMP: INR385 TP: INR462 Buy
 14 June 2012 Update Raymond CMP: INR385 TP: INR462 Buy Restructuring initiatives bearing fruit; Land bank base case value INR147/share; Reiterate Buy We met the management of Raymond (RW IN, Mkt Cap USD0.4b,
Kotak Mahindra Bank. CMP: INR626 TP: INR500 Neutral
 BSE SENSEX S&P CNX 18,759 5,705 Bloomberg KMB IN Equity Shares (m) 740.7 52-Week Range (INR) 652/418 1,6,12 Rel.Perf.(%) -3/-2/18 M.Cap. (INR b) 463.4 M.Cap. (USD b) 8.6 26 October 2012 2QFY13 Results
Tata Power. CMP: INR111 TP: INR92 Neutral
 BSE SENSEX S&P CNX 17,749 5,382 Bloomberg TPWR IN Equity Shares (m) 2,373.3 52-Week Range (INR) 135/81 1,6,12 Rel. Perf. (%) 10/-5/-10 M.Cap. (INR b) 263.9 M.Cap. (USD b) 5.3 13 February 2012 3QFY12 Results
Hindalco. CMP: INR113 TP: INR151 Buy
 BSE SENSEX S&P CNX 18,817 5,724 Bloomberg HNDL IN Equity Shares (m) 1,990.0 52-Week Range (INR) 165/100 1,6,12 Rel. Perf. (%) -9/-18/-26 M.Cap. (INR b) 224.9 M.Cap. (USD b) 4.1 Consolidated 2QFY13 Results
Siddharth Bothra
 BSE Sensex S&P CNX 19,152 5,797 Bloomberg CSTRL IN Equity Shares (m) 494.6 M.Cap. (INR b)/(usd b) 158/2.9 52-Week Range (INR) 338/223 1,6,12 Rel. Perf. (%) 12/-3/26 Financials & Valuation (INR b) Y/E March
Thermax. CMP: INR522 TP: INR414 Neutral
 BSE SENSEX S&P CNX 17,605 5,326 Bloomberg TMX IN Equity Shares (m) 119.2 52-Week Range (INR) 720/388 1,6,12 Rel. Perf. (%) 14/1/-21 M.Cap. (INR b) 60.3 M.Cap. (USD b) 1.1 3 February 2012 3QFY12 Results
Godrej Properties. CMP: INR595 TP: INR635 Neutral
 BSE SENSEX S&P CNX 16,913 5,114 Bloomberg GPL IN Equity Shares (m) 78.0 52-Week Range 845/570 1,6,12 Rel. Perf. (%) 0/-9/-2 M.Cap. (INR b) 46.4 M.Cap. (USD b) 0.9 4QFY12 Results Update Sector: Real Estate
Hardick Bora 4QCY12 Results Update Sector: Healthcare Sanofi India CMP: INR2,307 TP: INR2,015 Neutral
 BSE Sensex S&P CNX 19,332 5,855 Bloomberg SANL IN Equity Shares (m) 23.0 M.Cap. (INR b)/(usd b) 53.1/1.0 52-Week Range (INR) 2,450/2,002 1,6,12 Rel. Perf. (%) 9/-1/-4 Financials & Valuation (INR b) Y/E
Shree Renuka Sugars. CMP: INR41 TP: INR50 Buy
 BSE SENSEX S&P CNX 18,202 5,532 Bloomberg SHRS IN Equity Shares (m) 671.0 52-Week Range (INR) 87/23 1,6,12 Rel. Perf. (%) 14/-39/-51 M.Cap. (INR b) 27.3 M.Cap. (USD b) 0.6 16 February 2012 5QSY12 Results
Maruti Suzuki. CMP: INR1,395 TP: INR1,730 Buy
 BSE SENSEX S&P CNX 18,431 5,598 Bloomberg MSIL IN Diluted Equity Shares (m) 302.1 52-Week Range (INR) 1,498/906 1,6,12 Rel.Perf.(%) 5/-5/20 M.Cap. (INR b) 421.3 M.Cap. (USD b) 7.8 31 October 2012 2QFY13
Maruti Suzuki. CMP:Rs1,327 TP:Rs1,625 Buy
 25 April 2011 4QFY11 Results Update Sector: Automobiles Maruti Suzuki BSE SENSEX S&P CNX 19,584 5,875 Bloomberg MSIL IN Diluted Equity Shares (m) 289.0 52-Week Range (Rs) 1,600/1,126 1,6,12 Rel.Perf.(%)
Sun Pharmaceuticals. CMP: INR554 TP: INR614 Neutral
 BSE SENSEX S&P CNX 17,849 5,416 Bloomberg SUNP IN Equity Shares (m) 1,035.6 52-Week Range (INR) 566/404 1,6,12 Rel. Perf. (%) -3/10/31 M.Cap. (INR b) 573.7 M.Cap. (USD b) 11.6 15 February 2012 3QFY12 Results
Urban demand revives; Akzo gaining market share
 BSE Sensex S&P CNX 22,095 6,601 CMP: INR889 26 March 2014 Update Sector: Consumer Not Rated Urban demand revives; Akzo gaining market share Reiterates focus on Profitable growth Urban demand for Decorative
Jinesh Gandhi Chirag Jain
 BSE Sensex S&P CNX 19,561 5,923 Bloomberg EIM IN Equity Shares (m) 27.0 M.Cap. (INR b)/(usd b) 72.0/1.3 52-Week Range 3,240/1,620 1,6,12 Rel. Perf. (%) -4/17/40 Financials & Valuation (INR b) Y/E Dec 2013E
JSW Steel. CMP: INR670 TP: INR391 Sell Merger with JSW Ispat
 BSE SENSEX S&P CNX 17,384 5,254 Bloomberg JSTL IN Equity Shares (m) 223.1 52-Week Range (INR) 885/464 1,6,12 Rel. Perf. (%) -5/-12/-10 M.Cap. (INR b) 149.5 M.Cap. (USD b) 2.7 Valuation summary (INR b)
Idea Cellular. CMP: INR159 TP: INR200 Buy
 BSE SENSEX S&P CNX 19,164 5,678 Bloomberg IDEA IN Equity Shares (m) 3,316.2 M.Cap. (INR b) / (USD b) 513.7/8.4 52-Week Range (INR) 176/72 1, 6, 12 Rel. Per (%) 12/45/83 Financials & Valuation (INR Billion)
Cement. Demand to grow 8%, with cost push to be passed on CCI probe to have limited impact
 15 May 2012 Update Cement Demand to grow 8%, with cost push to be passed on CCI probe to have limited impact We met with senior managements of the large cement companies in India, to get perspective on
CMP: INR415 TP: INR 471 BUY
 04 Mar 2013 Update Sector: Technology Wipro CMP: INR415 TP: INR 471 BUY Pipeline and deal signings suggest improvement in growth; Multiple levers and focus on productivity will cushion margin headwinds
Tribhovandas Bhimji Zaveri
 24 April 2012 Update CMP INR TP INR TRIBHOVANDAS BHIMJI ZAVERI Pure jewellery retail play with strong brand; Execution risks priced in; Subscribe (TBZ) is a pure play on the fast-growing branded jewellery
Shriram Transport Finance
 Results Update SECTOR: BANKING STOCK INFO. BSE Sensex: 18,113 S&P CNX: 5,442 BLOOMBERG SHTF IN REUTERS CODE SRTR.BO Equity Shares (m) 225.5 52-Week Range 651/291 1,6,12 Rel.Perf.(%) -1/12/71 M.Cap. (Rs
Axis Bank. CMP: INR1,119 TP: INR1,330 Buy
 BSE SENSEX S&P CNX 18,714 5,687 Bloomberg AXSB IN Equity Shares (m) 413.2 52-Week Range (INR) 1,309/785 1,6,12 Rel.Perf.(%) 9/-16/-8 M.Cap. (INR b) 462.4 M.Cap. (USD b) 8.7 16 October 2012 2QFY13 Results
Jinesh Gandhi Sandipan Pal
 BSE Sensex S&P CNX 20,224 6,157 Bloomberg BCORP IN Equity Shares (m) 77.0 M.Cap. (INR b)/(usd b) 20.5/0.4 52-Week Range (INR) 342/202 1,6,12 Rel. Perf. (%) 6/-15/-23 Financials & Valuation (INR b) Y/E
Sandipan Pal QFY13 Results Update Sector: Real Estate Unitech CMP: INR29 TP: INR44 Buy
 BSE Sensex S&P CNX 19,608 5,933 Bloomberg UT IN Equity Shares (m) 2,438.8 M.Cap. (INR b)/(usd b) 70/1.3 52-Week Range (INR) 41/18 1,6,12 Rel. Perf. (%) -27/24/-13 Financials & Valuation (INR b) Y/E March
CMP: INR401 TP: INR516 Buy. * After ESOP charges; # Axon consolidated in December 2008
 19 October 2011 1QFY12 Results Update Sector: Technology BSE SENSEX S&P CNX 16,748 5,038 Bloomberg HCLT IN Equity Shares (m) 700.9 52-Week Range (INR) 528/360 1,6,12 Rel. Perf. (%) 4/-1/7 M.Cap. (INR b)
Amara Raja Batteries. CMP: INR517 TP: INR560 Buy
 BSE SENSEX S&P CNX 25,665 7,672 Bloomberg AMRJ IN Equity Shares (m) 170.8 M.Cap. (INR b) / (USD b) 88.2/1.4 52-Week Range (INR) 520/208 1, 6, 12 Rel. Per (%) 5/21/97 Financials & Valuation (INR Million)
Hindustan Unilever. Q1FY19 Result Update Maintaining strong volume trajectory on high base is the key. Sector: FMCG CMP: ` 1,644. Recommendation: HOLD
 Hindustan Unilever Q1FY19 Result Update Maintaining strong volume trajectory on high base is the key Sector: FMCG CMP: ` 1, Recommendation: HOLD Market Statistics Current stock price (`) 1, Shares O/S
Hindustan Unilever. Q4FY18 Result Update Strong volume growth on weak base and uptick in rural. Sector: FMCG CMP: ` 1,516. Recommendation: HOLD
 Hindustan Unilever QFY18 Result Update Strong volume growth on weak base and uptick in rural Sector: FMCG CMP: ` 1,1 Recommendation: HOLD Market Statistics Current stock price (`) 1,1 Shares O/S (cr.)
Phoenix Mills. CMP: INR184 TP: INR255 Buy
 BSE SENSEX S&P CNX 16,439 4,990 Bloomberg PHNX IN Equity Shares (m) 144.8 52-Week Range (INR) 229/149 1,6,12 Rel. Perf. (%) -8/-5/10 M.Cap. (INR b) 26.8 M.Cap. (USD b) 0.5 30 May 2012 4QFY12 Results Update
Cross service charges at INR m/quarter
 BSE SENSEX S&P CNX 19,636 5,940 Cummins India CMP: INR504 TP: INR585 Buy LHP products to be an important growth driver Cross service charges at INR100-200m/quarter 20 February 2013 Update Sector: Capital
Market share recovery, price hike, content leverage to drive growth
 BSE Sensex S&P CNX 24,377 7,276 Stock Info Bloomberg DITV IN Equity Shares (m) 1,064.8 52-Week Range (INR) 71/40 1, 6, 12 Rel. Per (%) 6/-15/-41 M.Cap. (INR b) 58.2 M.Cap. (USD b) 1.0 Financial Snapshot
BHEL. CMP: INR227 TP: INR233 Neutral
 BSE SENSEX S&P CNX 18,636 5,666 Bloomberg BHEL IN Equity Shares (m) 2,447.6 52-Week Range (INR) 368/198 1,6,12 Rel. Perf. (%) -7/-7/-35 M.Cap. (INR b) 556.2 M.Cap. (USD b) 10.3 30 October 2012 2QFY13 Results
Hardick Bora QFY13 Results Update Sector: Healthcare Lupin CMP: INR725 TP: INR851 Buy
 BSE Sensex S&P CNX 19,990 6,069 Bloomberg LPC IN Equity Shares (m) 447.6 M.Cap. (INR b)/(usd b) 324.5/6.0 52-Week Range (INR) 739/507 1,6,12 Rel. Perf. (%) 9/18/13 Financials & Valuation (INR b) Y/E March
Hardick Bora 4QFY13 Results Update Sector: Healthcare Dr Reddy's Laboratories CMP: INR2,026 TP: INR2,375 Buy
 BSE Sensex S&P CNX 19,772 5,995 Bloomberg DRRD IN Equity Shares (m) 169.2 M.Cap. (INR b)/(usd b) 344/6.3 52-Week Range (INR) 2,151/1,528 1,6,12 Rel. Perf. (%) -2/9/0 Financials & Valuation (INR b) Y/E
Oberoi Realty. CMP: INR269 TP: INR320 Buy
 BSE SENSEX S&P CNX 18,682 5,684 Bloomberg OBER IN Equity Shares (m) 328.2 52-Week Range (INR) 323/205 1,6,12 Rel. Perf. (%) 13/-7/7 M.Cap. (INR b) 88.3 M.Cap. (USD b) 1.6 22 October 2012 2QFY13 Results
Alpesh Mehta Sohail Halai
 BSE Sensex S&P CNX 19,664 5,969 Bloomberg IIB IN Equity Shares (m) 521.8 M. Cap. (INR b)/(usd b) 227/4.1 52-Week Range (INR) 441/242 1,6,12 Rel.Perf.(%) 3/15/52 Financials & Valuation (INR b) Y/E March
Jaypee Infratech. CMP: INR33 TP: INR45 Buy
 BSE SENSEX S&P CNX 2,550,318 Bloomberg JPIN IN Equity Shares (m) 1,388.9 M.Cap. (INR b) / (USD b) 51.3/0.9 52-Week Range (INR) 2/1 1,, 12 Rel. Per (%) 1/9/-3 Financials & Valuation (INR m) Y/E Mar 201
HUL. Q4FY17 Result Update Healthy performance, rich valuations. Sector: FMCG CMP: ` Recommendation: Hold
 HUL QFY17 Result Update Healthy performance, rich valuations Sector: FMCG CMP: ` 1009 Recommendation: Hold Market Statistics Current stock price (`) 1,009 Shares O/S (cr.) 21. Mcap (`cr) 218,9 52W H/L
Previous Recommendation: Neutral
 2QFY11 Results Update SECTOR: PHARMACEUTICALS STOCK INFO. BSE Sensex: 20,589 S&P CNX: 6,194 BLOOMBERG JOL IN REUTERS CODE JUBO.BO Equity Shares (m) 170.0 52-Week Range 413/255 1,6,12 Rel. Perf. (%) -4/-34/-8
Stress test: Weak capital servicing ratios to drive pricing discipline
 Stress test: Weak capital servicing ratios to drive pricing discipline Operating performance near trough; expect gradual improvement 20 Update Cement Our analysis of a cross-section of cement companies
Birla Corporation. CMP: INR216 TP: INR277 Buy
 BSE SENSEX S&P CNX 16,839 5,100 Bloomberg BCORP IN Equity Shares (m) 77.0 52-Week Range (INR) 348/211 1,6,12 Rel. Perf. (%) -5/-19/-25 M.Cap. (INR b) 16.6 M.Cap. (USD b) 0.3 30 July 2012 1QFY13 Results
Just Dial. CMP: INR1,129 TP: INR1,475 Buy
 BSE SENSEX S&P CNX 23,871 7,109 Bloomberg JUST IN Equity Shares (m) 70.2 M.Cap. (INR b) / (USD b) 79.2/1.3 52-Week Range (INR) 1,774/589 1, 6, 12 Rel. Per (%) -18/-7/- Financials & Valuation (INR m) Y/E
Coal India. CMP: INR322 TP: INR370 Buy
 BSE SENSEX S&P CNX 16,439 4,990 Bloomberg COAL IN Equity Shares (m) 6,316.4 52-Week Range (INR) 422/294 1,6,12 Rel. Perf. (%) -4/-3/-7 M.Cap. (INR b) 2,033.9 M.Cap. (USD b) 36.4 30 May 2012 4QFY12 Results
Jinesh Gandhi Chirag Jain
 BSE Sensex S&P CNX 19,722 5,995 Bloomberg EIM IN Equity Shares (m) 27.0 M.Cap. (INR b)/(usd b) 88.1/1.6 52-Week Range (INR) 3,285/1,620 1,6,12 Rel. Perf. (%) 10/20/36 Financials & Valuation (INR b) Y/E
Previous Recommendation: Buy
 2QCY10 Results Update SECTOR: CEMENT ACC STOCK INFO. BSE Sensex: 18,113 S&P CNX: 5,442 BLOOMBERG ACC IN REUTERS CODE ACC.BO Previous Recommendation: Buy Buy Rs816 Equity Shares (m) 187.9 52-Week Range
Torrent Pharmaceuticals
 BSE SENSEX S&P CNX 21,338 6,339 Bloomberg TRP IN Equity Shares (m) 169.2 M.Cap. (INR b) / (USD b) 80.4/1.3 52-Week Range (INR) 535/324 1, 6, 12 Rel.Per (%) 4/12/32 Financials & Valuation (INR Million)
Godrej Properties. CMP: INR368 TP: INR420 Neutral
 BSE SENSEX S&P CNX 21,034 6,252 Bloomberg GPL IN Equity Shares (m) 99.6 M.Cap. (INR b) / (USD b) 36.4/ 0.7 52-Week Range (INR) 641/340 1, 6, 12 Rel. Per (%) -1/-44/-47 Financials & Valuation (INR b) Y/E
Reliance Communications
 1QFY11 Results Update SECTOR: TELECOM Reliance Communications STOCK INFO. BSE Sensex: 18,167 S&P CNX: 5,452 BLOOMBERG RCOM IN REUTERS CODE RLCM.BO 13 August 2010 Previous Recommendation: Under Review Buy
Shoppers Stop. CMP: INR339 TP: INR355 Neutral
 BSE SENSEX S&P CNX 20,684 6,145 Bloomberg SHOP IN Equity Shares (m) 83.1 M.Cap. (INR b) / (USD b) 28.1/0.5 52-Week Range (INR) 494/331 1, 6, 12 Rel. Per (%) -7/-16/-28 Financials & Valuation (INR b) Y/E