Hardick Bora
|
|
|
- Roxanne Bishop
- 5 years ago
- Views:
Transcription
 -18/-28/-34 Financials & Valuation (INR b) Y/E March 2013 2014E 2015E Sales 51.4 59.0 68.5 EBITDA 10.2 11.9 14.0 Net Profit 2.2 4.9 5.7 Adj. EPS (INR) 8.3 31.0 35.7 EPS Gr. (%) -38.9 272.6 14.")
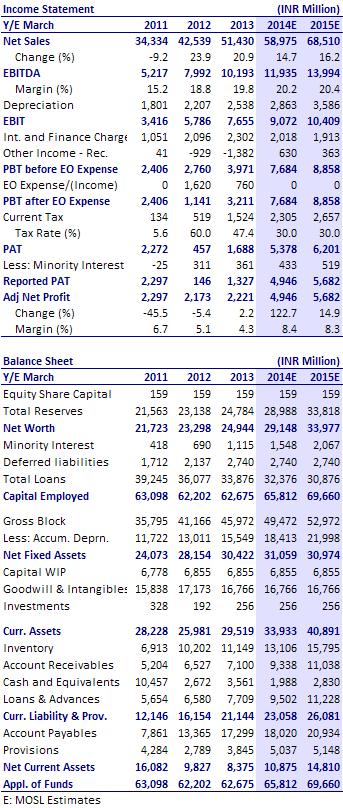
1 BSE Sensex S&P CNX 19,990 6,069 Bloomberg JOL IN Equity Shares (m) M.Cap. (INR b)/(usd b) 26.0/ Week Range (INR) 248/154 1,6,12 Rel. Perf. (%) -18/-28/-34 Financials & Valuation (INR b) Y/E March E 2015E Sales EBITDA Net Profit Adj. EPS (INR) EPS Gr. (%) BV/Sh. (INR) RoE (%) RoCE (%) Payout (%) Valuations P/E (x) P/BV (x) EV/EBITDA (x) Div. Yield (%) May QFY13 Results Update Sector: Healthcare CMP: INR163 TP: INR213 Neutral Jubilant Life Sciences 4QFY13 results were in line with estimates. Key highlights: Jubilant Life Sciences (JOL) 4QFY13 operational performance was in line with estimates. Sales were up 18.5% YoY to INR13.88b (v/s est INR13.3b), EBITDA was up 29% YoY to INR2.33b (v/s est INR2.25b), while EBITDA margin stood at 16.8% (v/s est of 17%). JOL reported a net loss of INR310m v/s a net loss of INR635m last year. PAT, adjusted for exceptional items, fell 5% to INR454m (v/s est INR915m), mainly impacted by higher tax outgo and forex losses. Top line growth was led by a 24% growth in Life Sciences business to INR6.9b, while Pharma business grew 13% to INR7b. Growth due to favorable forex was 7%. EBITDA margin expanded by 130bp YoY (in-line), aided by increased capacity utilization in Life Sciences division and better product mix in Pharma business. Guidance: While management refrained from giving specific guidance for FY14, it retained long term guidance of 20% revenue CAGR over FY13-15E, with EBITDA margin at 21% in FY15. Tax rate has been guided at 30% over the next two years, with a capex guidance of INR3.5b. Valuation and view: Post 4QFY13 results, we lower FY14E/15E EPS estimates by 5%/6%, mainly due to the high tax guidance at 30%, against our earlier guidance of 25%. For the FY13-15E period, we expect JOL to record 15.5% top line CAGR, 17% EBITDA CAGR and 60% EPS CAGR (on a low base). EPS CAGR will be much higher than EBITDA CAGR due to large forex losses in FY13. High debt (net debt was INR34.32b as in Mar-13) continues to be our main concern. We believe JOL needs to restructure its balance sheet significantly for the stock to get re-rated. We also believe that some of its past acquisitions (like Draxis) have been made at expensive valuations, resulting in extended payback periods and lower return ratios. The stock trades at 5.2x FY14E EPS and 4.6x FY15E EPS. We maintain Neutral with a target price of INR213 (6x FY15E EPS). Hardick Bora (Hardick.Bora@MotilalOswal.com); Investors are advised to refer through disclosures made at the end of the Research Report.
. Topline growth was led by a 24% growth in Life Sciences business to INR6.9b, while the Pharma business grew 13% growth to INR7b. Growth due to favorable foreign currency was 7%.")
2 Operational performance was in line with estimates Sales were up 18.5% YoY to INR13.88b (v/s est. INR13.3b), EBITDA was up 29% YoY to INR2.33b (v/s est INR2.25b) while EBITDA margins stood at 16.8% (v/s est of 17%). Topline growth was led by a 24% growth in Life Sciences business to INR6.9b, while the Pharma business grew 13% growth to INR7b. Growth due to favorable foreign currency was 7%. The company reported net loss of INR310m against net loss of INR635m last year. PAT Adjusted for exceptional items de-grew 5% to INR454m (v/s est INR915m) mainly impacted by higher tax outgo and forex losses. Adjusted EBITDA growth of 29% - Impacted by lower margins in LSI business While the company has reported a 13% YoY EBITDA growth, 4QFY12 EBITDA included the extraordinary income received from a customer terminating a contract. Adjusted for this, EBITDA has grown 29% YoY to INR2.33b, in line with estimate. EBITDA for the LSI business has doubled to INR950m (on a low base). EBITDA from Pharma Business has de-grown by 5 to INR1.75b, impacted by DDSS business. EBITDA Margin Trend Source: Company/MOSL Key highlights of the conference call The management has maintained long-term revenue guidance of 20% CAGR over FY13-15E and has not given any specific guidance for FY14E. The management is confident of achieving this growth on account of (1) higher utilization of new, expanded and existing capacities in Life Science Ingredients and CMO business, and (2) new product launches as well as expansion in new territories in APIs, Generics and Specialty Pharma businesses. During the quarter, the company reported 18.5% revenue growth led by 14% volume growth and favorable currency. The 24% growth in Life Sciences vertical was led by high growth in PPES and Life Sciences Chemical division. Growth in Pharma division was led by the Generic segment. In Life Science Ingredients business, the company continues to face pricing pressure in proprietary products and nutritional ingredients segments. The growth is coming on the back of increase volumes led by commercialization of new capacities. 9 May
3 FDA warning letter: The company has responded to the warning letter in time and FDA has agreed to majority of the remediation measures outlined by the company. However, there management did not share any timeline for the resolution. They had earlier indicated that the warning letter will not have more than USD10m of revenue impact and USD2-3m of EBITDA impact. EBITDA margins are guided to be 21% by FY15E. This will be driven by hedges taken at favorable rates, new launches, change in product mix and higher capacity utilization in Symtet facility. Tax guidance has been increased from earlier 25% to 30% for the next two years. Capex will be to the tune of INR3.5b over the same period. During the quarter, the company reported exceptional item of INR760m: (1) INR650m pertaining to products under development and (2) INR110 of inventory write-off. JOL has net debt of INR34.32b, down INR1.1b QoQ, of which INR0.7b is on account of repayment. The company targets to bring down the D/E ration to <1x over next 3 years. High debt on the books remains concern; Higher interest cost to impact profitability Net debt on JOL's books stands at INR34.32b. It had raised debt in 4QFY11 for the redemption of FCCBs worth USD142m (USD202m incl YTM). The management is targeting to reduce debt by INR4b in FY14. However, we believe this target to be aggressive given the (1) high working capital requirement, (2) large FY13 capex at INR3.5b and (3) Dividend payment to shareholders. The company is also planning to raise USD250m non-convertible debentures to refinance its outstanding debt. The management indicated that this will not increase overall debt levels. Overall interest cost for FY13 has increased by 10% to INR2.3b, despite debt reduction YoY. We believe the increased interest cost will impact profitability. Outlook and Valuation For the FY13-15 period, we expect JOL to record 15.5% topline CAGR, 17% EBITDA CAGR, and 60% EPS CAGR (on a low base). EPS CAGR will be much higher than EBITDA CAGR as company had reported a large forex losses in FY13. High debt (net debt was INR34.32b as of Mar-13) continues to be our main concern area for JOL. We believe JOL needs to restructure its balance sheet significantly for its stock to get re-rated. We also believe that some of its past acquisitions (like Draxis) have been made at expensive valuations, resulting in extended payback periods and lower return ratios. High debt and low RoCE (15-17%) remain overhangs. The stock trades at 5.2x FY14E EPS and 4.6x FY15E EPS. We maintain Neutral with price target of INR213 (6x FY15E EPS). 9 May
4 : an investment profile Company description Jubilant Organosys Limited is the largest specialty chemicals company in India with high degree of vertical integration along with global scale and reach in almost all its key products. Its business model thus spans pharmaceuticals & life sciences, industrial chemicals and performance chemicals. It has forayed into API business (by acquiring Max India's API operations) and into formulations and regulatory services (by acquiring PSI n.v and PSI supply). Key investment arguments A composite and integrated player with offerings across the pharma and specialty chemicals value chain. Continuous forward integration, with global scale capacities in key products and widespread global presence puts Jubilant on the high growth path. Growing share of the profitable Pharma business, driven by CRAMS, steriles & radiopharmaceuticals business, to ensure improved profitability and earnings visibility. Key investment risk High debt on the books is a concern which may impact the profitability going forward - It also lowers RoCE. Adverse foreign currency movement can impact the revenue and profitability of the company. Recent developments Nil Valuation and view For the FY13-15 period, we expect JOL to record 15.4% topline CAGR, 17.2% EBITDA CAGR, and 60% EPS CAGR. EPS CAGR will be much higher than EBITDA CAGR as company had reported a large forex losses in FY13. The stock trades at 5.2x FY14E EPS and 4.6x FY15E EPS. We maintain Neutral with price target of INR213 (6x FY15E EPS). Sector view The CRAMS segment is likely to witness sustained growth over the next few years led by increased out-sourcing from India. Comparative valuations Jubilant Divis Dishman P/E (x) FY14E FY15E P/BV (x) FY14E FY15E EV/Sales (x) FY14E FY15E EV/EBITDA (x) FY14E FY15E EPS: MOSL forecast v/s consensus (INR) MOSL Consensus Variation Forecast Forecast (%) FY FY Target price and recommendation Current Target Upside Reco. Price (INR) Price (INR) (%) Neutral Stock performance (1 year) Shareholding pattern (%) Mar-13 Dec-12 Mar-12 Promoter Domestic Inst Foreign Others May
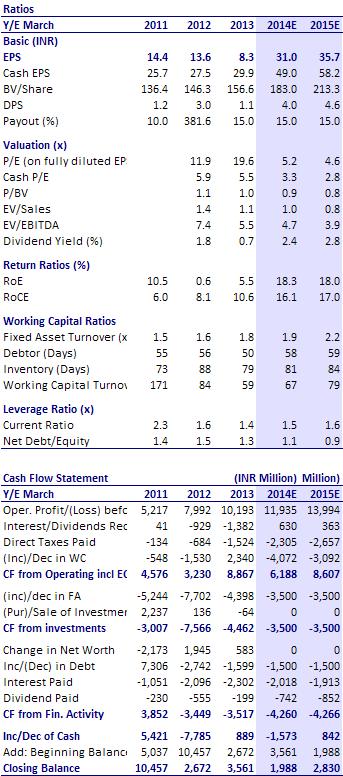
5 Financials and Valuation 9 May
6 Disclosures This report is for personal information of the authorized recipient and does not construe to be any investment, legal or taxation advice to you. This research report does not constitute an offer, invitation or inducement to invest in securities or other investments and Motilal Oswal Securities Limited (hereinafter referred as MOSt) is not soliciting any action based upon it. This report is not for public distribution and has been furnished to you solely for your information and should not be reproduced or redistributed to any other person in any form. Unauthorized disclosure, use, dissemination or copying (either whole or partial) of this information, is prohibited. The person accessing this information specifically agrees to exempt MOSt or any of its affiliates or employees from, any and all responsibility/liability arising from such misuse and agrees not to hold MOSt or any of its affiliates or employees responsible for any such misuse and further agrees to hold MOSt or any of its affiliates or employees free and harmless from all losses, costs, damages, expenses that may be suffered by the person accessing this information due to any errors and delays. The information contained herein is based on publicly available data or other sources believed to be reliable. While we would endeavour to update the information herein on reasonable basis, MOSt and/or its affiliates are under no obligation to update the information. Also there may be regulatory, compliance, or other reasons that may prevent MOSt and/or its affiliates from doing so. MOSt or any of its affiliates or employees shall not be in any way responsible and liable for any loss or damage that may arise to any person from any inadvertent error in the information contained in this report. MOSt or any of its affiliates or employees do not provide, at any time, any express or implied warranty of any kind, regarding any matter pertaining to this report, including without limitation the implied warranties of merchantability, fitness for a particular purpose, and non-infringement. The recipients of this report should rely on their own investigations. This report is intended for distribution to institutional investors. Recipients who are not institutional investors should seek advice of their independent financial advisor prior to taking any investment decision based on this report or for any necessary explanation of its contents. MOSt and/or its affiliates and/or employees may have interests/positions, financial or otherwise in the securities mentioned in this report. To enhance transparency, MOSt has incorporated a Disclosure of Interest Statement in this document. This should, however, not be treated as endorsement of the views expressed in the report. Disclosure of Interest Statement 1. Analyst ownership of the stock No 2. Group/Directors ownership of the stock No 3. Broking relationship with company covered No 4. Investment Banking relationship with company covered No Analyst Certification The views expressed in this research report accurately reflect the personal views of the analyst(s) about the subject securities or issues, and no part of the compensation of the research analyst(s) was, is, or will be directly or indirectly related to the specific recommendations and views expressed by research analyst(s) in this report. The research analysts, strategists, or research associates principally responsible for preparation of MOSt research receive compensation based upon various factors, including quality of research, investor client feedback, stock picking, competitive factors and firm revenues. Regional Disclosures (outside India) This report is not directed or intended for distribution to or use by any person or entity resident in a state, country or any jurisdiction, where such distribution, publication, availability or use would be contrary to law, regulation or which would subject MOSt & its group companies to registration or licensing requirements within such jurisdictions. For U.K. This report is intended for distribution only to persons having professional experience in matters relating to investments as described in Article 19 of the Financial Services and Markets Act 2000 (Financial Promotion) Order 2005 (referred to as "investment professionals"). This document must not be acted on or relied on by persons who are not investment professionals. Any investment or investment activity to which this document relates is only available to investment professionals and will be engaged in only with such persons. For U.S. Motilal Oswal Securities Limited (MOSL) is not a registered broker - dealer under the U.S. Securities Exchange Act of 1934, as amended (the"1934 act") and under applicable state laws in the United States. In addition MOSL is not a registered investment adviser under the U.S. Investment Advisers Act of 1940, as amended (the "Advisers Act" and together with the 1934 Act, the "Acts), and under applicable state laws in the United States. Accordingly, in the absence of specific exemption under the Acts, any brokerage and investment services provided by MOSL, including the products and services described herein are not available to or intended for U.S. persons. This report is intended for distribution only to "Major Institutional Investors" as defined by Rule 15a-6(b)(4) of the Exchange Act and interpretations thereof by SEC (henceforth referred to as "major institutional investors"). This document must not be acted on or relied on by persons who are not major institutional investors. Any investment or investment activity to which this document relates is only available to major institutional investors and will be engaged in only with major institutional investors. In reliance on the exemption from registration provided by Rule 15a-6 of the U.S. Securities Exchange Act of 1934, as amended (the "Exchange Act") and interpretations thereof by the U.S. Securities and Exchange Commission ("SEC") in order to conduct business with Institutional Investors based in the U.S., MOSL has entered into a chaperoning agreement with a U.S. registered broker-dealer, Motilal Oswal Securities International Private Limited. ("MOSIPL"). Any business interaction pursuant to this report will have to be executed within the provisions of this chaperoning agreement. The Research Analysts contributing to the report may not be registered /qualified as research analyst with FINRA. Such research analyst may not be associated persons of the U.S. registered broker-dealer, MOSIPL, and therefore, may not be subject to NASD rule 2711 and NYSE Rule 472 restrictions on communication with a subject company, public appearances and trading securities held by a research analyst account. For Singapore Motilal Oswal Capital Markets Singapore Pte Limited is acting as an exempt financial advisor under section 23(1)(f) of the Financial Advisers Act(FAA) read with regulation 17(1)(d) of the Financial Advisors Regulations and is a subsidiary of Motilal Oswal Securities Limited in India. This research is distributed in Singapore by Motilal Oswal Capital Markets Singapore Pte Limited and it is only directed in Singapore to accredited investors, as defined in the Financial Advisers Regulations and the Securities and Futures Act (Chapter 289), as amended from time to time. In respect of any matter arising from or in connection with the research you could contact the following representatives of Motilal Oswal Capital Markets Singapore Pte Limited: Nihar Oza Kadambari Balachandran niharoza.sg@motilaloswal.com kadambari.balachandran@motilaloswal.com Contact: (+65) Contact: (+65) / Office address: 21 (Suite 31), 16 Collyer Quay, Singapore Motilal Oswal Securities Ltd Motilal Oswal Tower, Level 9, Sayani Road, Prabhadevi, Mumbai Phone: reports@motilaloswal.com
Sanjay Jain Pavas Pethia
 BSE Sensex S&P CNX 19,561 5,923 Bloomberg SAIL IN Equity Shares (m) 4,130.4 M.Cap. (INR b)/(usd b) 334.6/6.2 52-Week Range (INR) 116/76 1,6,12 Rel. Perf. (%) -11/-17/-38 Financials & Valuation (INR b)
Niket Shah
 BSE Sensex S&P CNX 20,213 6,147 Bloomberg VGRD IN Equity Shares (m) 29.8 M.Cap. (INR b)/(usd b) 14.6/0.3 52-Week Range (INR) 591/180 1,6,12 Rel. Perf. (%) -8/-6/138 Financial summary (INR b) Y/E March
Hardick Bora 4QCY12 Results Update Sector: Healthcare Sanofi India CMP: INR2,307 TP: INR2,015 Neutral
 BSE Sensex S&P CNX 19,332 5,855 Bloomberg SANL IN Equity Shares (m) 23.0 M.Cap. (INR b)/(usd b) 53.1/1.0 52-Week Range (INR) 2,450/2,002 1,6,12 Rel. Perf. (%) 9/-1/-4 Financials & Valuation (INR b) Y/E
CMP: INR350 TP: INR375 Downgrade to Neutral
 BSE Sensex S&P CNX 19,497 5,897 Bloomberg COAL IN Equity Shares (m) 6,316.4 M.Cap. (INR b)/(usd b) 2,211/41 52-Week Range (INR) 386/301 1,6,12 Rel. Perf. (%) 1/-11/-5 Financials & Valuation (INR b) Y/E
Sohail Halai Alpesh Mehta
 BSE Sensex S&P CNX 20,039 6,064 Bloomberg IDBI IN Equity Shares (m) 1,278.4 M.Cap. (INR b)/(usd b) 144.9/2.7 52-Week Range (INR) 122/82 1,6,12 Rel.Perf.(%) -1/6/2 Financials & Valuation (INR b) Y/E March
Siddharth Bothra
 BSE Sensex S&P CNX 19,152 5,797 Bloomberg CSTRL IN Equity Shares (m) 494.6 M.Cap. (INR b)/(usd b) 158/2.9 52-Week Range (INR) 338/223 1,6,12 Rel. Perf. (%) 12/-3/26 Financials & Valuation (INR b) Y/E March
Hardick Bora 4QFY13 Results Update Sector: Healthcare Dr Reddy's Laboratories CMP: INR2,026 TP: INR2,375 Buy
 BSE Sensex S&P CNX 19,772 5,995 Bloomberg DRRD IN Equity Shares (m) 169.2 M.Cap. (INR b)/(usd b) 344/6.3 52-Week Range (INR) 2,151/1,528 1,6,12 Rel. Perf. (%) -2/9/0 Financials & Valuation (INR b) Y/E
Previous Recommendation: Neutral
 2QFY11 Results Update SECTOR: PHARMACEUTICALS STOCK INFO. BSE Sensex: 20,589 S&P CNX: 6,194 BLOOMBERG JOL IN REUTERS CODE JUBO.BO Equity Shares (m) 170.0 52-Week Range 413/255 1,6,12 Rel. Perf. (%) -4/-34/-8
Pidilite Industries. CMP: INR164 TP: INR186 Buy
 BSE SENSEX S&P CNX 16,640 5,043 Bloomberg PIDI IN Equity Shares (m) 506.1 52-Week Range (INR) 188/134 1,6,12 Rel. Perf. (%) 1/20/5 M.Cap. (INR b) 83.0 M.Cap. (USD b) 1.5 27 July 2012 1QFY13 Results Update
Hardick Bora QFY13 Results Update Sector: Healthcare Lupin CMP: INR725 TP: INR851 Buy
 BSE Sensex S&P CNX 19,990 6,069 Bloomberg LPC IN Equity Shares (m) 447.6 M.Cap. (INR b)/(usd b) 324.5/6.0 52-Week Range (INR) 739/507 1,6,12 Rel. Perf. (%) 9/18/13 Financials & Valuation (INR b) Y/E March
Jubilant Foodworks. CMP: INR1,189 TP: INR1,0541,054 Neutral
 BSE SENSEX S&P CNX 16,846 5,110 Bloomberg JUBI IN Equity Shares (m) 63.5 52-Week Range (INR) 1,189/633 1,6,12 Rel. Perf. (%) 4/38/47 M.Cap. (INR b) 75.5 M.Cap. (USD b) 1.3 26 July 2012 1QFY13 Results Update
Idea Cellular. CMP: INR159 TP: INR200 Buy
 BSE SENSEX S&P CNX 19,164 5,678 Bloomberg IDEA IN Equity Shares (m) 3,316.2 M.Cap. (INR b) / (USD b) 513.7/8.4 52-Week Range (INR) 176/72 1, 6, 12 Rel. Per (%) 12/45/83 Financials & Valuation (INR Billion)
Titan Industries. CMP: INR222 TP: INR220 Neutral
 BSE SENSEX S&P CNX 17,257 5,241 Bloomberg TTAN IN Equity Shares (m) 887.8 52-Week Range (INR) 255/154 1,6,12 Rel. Perf. (%) -1/13/3 M.Cap. (Rs b) 197.1 M.Cap. (US$ b) 3.6 2 August 2012 1QFY13 Results Update
Jinesh Gandhi Chirag Jain
 BSE Sensex S&P CNX 19,561 5,923 Bloomberg EIM IN Equity Shares (m) 27.0 M.Cap. (INR b)/(usd b) 72.0/1.3 52-Week Range 3,240/1,620 1,6,12 Rel. Perf. (%) -4/17/40 Financials & Valuation (INR b) Y/E Dec 2013E
NTPC CMP: INR169 TP: INR191 Buy
 BSE SENSEX S&P CNX 18,625 5,664 Bloomberg NTPC IN Equity Shares (m) 8,245.5 52-Week Range (INR) 190/139 1,6,12 Rel. Perf. (%) 3/-4/-11 M.Cap. (INR b) 1,393.5 M.Cap. (USD b) 26.0 26 October 2012 2QFY13
Sandipan Pal QFY13 Results Update Sector: Real Estate Unitech CMP: INR29 TP: INR44 Buy
 BSE Sensex S&P CNX 19,608 5,933 Bloomberg UT IN Equity Shares (m) 2,438.8 M.Cap. (INR b)/(usd b) 70/1.3 52-Week Range (INR) 41/18 1,6,12 Rel. Perf. (%) -27/24/-13 Financials & Valuation (INR b) Y/E March
Jinesh Gandhi Sandipan Pal
 BSE Sensex S&P CNX 20,224 6,157 Bloomberg BCORP IN Equity Shares (m) 77.0 M.Cap. (INR b)/(usd b) 20.5/0.4 52-Week Range (INR) 342/202 1,6,12 Rel. Perf. (%) 6/-15/-23 Financials & Valuation (INR b) Y/E
Sanofi India. CMP: INR2,200 TP: INR1,848 Neutral
 BSE SENSEX S&P CNX 16,846 5,110 Bloomberg SANL IN Equity Shares (m) 23.0 52-Week Range (INR) 2,430/1,980 1,6,12 Rel. Perf. (%) 3/-3/15 M.Cap. (INR b) 50.7 M.Cap. (USD b) 0.9 26 July 2012 2QCY12 Results
Strides Arcolab. CMP: INR717 TP: INR829 Buy
 BSE SENSEX S&P CNX 17,144 5,200 Bloomberg STR IN Equity Shares (m) 57.7 52-Week Range (INR) 794/276 1,6,12 Rel. Perf. (%) -2/37/98 M.Cap. (INR b) 41.4 M.Cap. (USD b) 0.7 31 July 2012 2QCY12 Results Update
BGR Energy. CMP: INR282 TP: INR253 Neutral
 BSE SENSEX S&P CNX 17,413 5,283 Bloomberg BGRL IN Equity Shares (m) 72.0 52-Week Range (INR) 378/173 1,6,12 Rel. Perf. (%) -9/17/-22 M.Cap. (INR b) 20.3 M.Cap. (USD b) 0.4 6 August 2012 1QFY13 Results
BGR Energy. CMP: INR266 TP: INR230 Neutral
 BSE SENSEX S&P CNX 18,562 5,645 Bloomberg BGRL IN Equity Shares (m) 72.0 52-Week Range (INR) 374/173 1,6,12 Rel. Perf. (%) -3/27/-24 M.Cap. (INR b) 19.2 M.Cap. (USD b) 0.4 3 November 2012 2QFY13 Results
Godrej Consumer Products
 BSE SENSEX S&P CNX 17,602 5,337 Bloomberg GCPL IN Equity Shares (m) 340.3 52-Week Range (INR) 658/370 1,6,12 Rel. Perf. (%) 5/37/42 M.Cap. (INR b) 205.9 M.Cap. (USD b) 3.7 7 August 2012 1QFY13 Results
IndusInd Bank. CMP: INR345 TP: INR419 Buy
 BSE SENSEX S&P CNX 17,504 5,332 Bloomberg IIB IN Equity Shares (m) 467.7 52-Week Range (INR) 352/222 1,6,12 Rel.Perf.(%) 13/25/34 M.Cap. (INR b) 161.4 M.Cap. (USD b) 3.1 20 April 2012 4QFY12 Results Update
Asian Paints. CMP: INR2,722 TP: INR3,161 Buy
 BSE SENSEX S&P CNX 16,739 5,049 Bloomberg APNT IN Equity Shares (m) 95.9 52-Week Range (INR) 3,366/2,395 1,6,12 Rel. Perf. (%) -5/-3/14 M.Cap. (INR b) 261.1 M.Cap. (USD b) 4.9 23 January 2012 3QFY12 Results
Reliance Infrastructure CMP: INR528
 BSE SENSEX S&P CNX 17,657 5,363 16 August 2012 1QFY13 Results Update Sector: Utilities Reliance Infrastructure CMP: INR528 Buy Bloomberg RELI IN Equity Shares (m) 267.5 52-Week Range (INR) 680/328 1,6,12
Idea Cellular. CMP: INR81 TP: INR Under Review
 BSE SENSEX S&P CNX 16,918 5,128 Bloomberg IDEA IN Equity Shares (m) 3,308.8 52-Week Range (INR) 104/71 1,6,12 Rel. Perf. (%) 6/-13/4 M.Cap. (INR b) 268.0 M.Cap. (USD b) 4.8 25 July 2012 1QFY13 Results
Canara Bank. CMP: INR419 TP: INR525 Buy
 BSE SENSEX S&P CNX 18,817 5,724 Bloomberg CBK IN Equity Shares (m) 443.0 52-Week Range (INR) 566/349 1,6, 12 Rel.Perf.(%) -7/-18/-17 M.Cap. (INR b) 170.3 M.Cap. (USD b) 3.0 7 November 2012 2QFY13 Results
Cross service charges at INR m/quarter
 BSE SENSEX S&P CNX 19,636 5,940 Cummins India CMP: INR504 TP: INR585 Buy LHP products to be an important growth driver Cross service charges at INR100-200m/quarter 20 February 2013 Update Sector: Capital
Jinesh Gandhi Chirag Jain
 BSE Sensex S&P CNX 19,722 5,995 Bloomberg EIM IN Equity Shares (m) 27.0 M.Cap. (INR b)/(usd b) 88.1/1.6 52-Week Range (INR) 3,285/1,620 1,6,12 Rel. Perf. (%) 10/20/36 Financials & Valuation (INR b) Y/E
Larsen & Toubro. CMP: INR1,160 TP: INR1,417 Buy
 BSE SENSEX S&P CNX 16,216 4,908 Bloomberg LT IN Equity Shares (m) 608.9 52-Week Range (INR) 1,868/971 1,6,12 Rel. Perf. (%) -4/-7/12 M.Cap. (INR b) 706.3 M.Cap. (USD b) 13.1 * Consolidated; EPS is fully
Punjab National Bank. CMP: INR716 TP: INR950 Buy
 BSE SENSEX S&P CNX 16,839 5,100 Bloomberg PNB IN Equity Shares (m) 339.2 52-Week Range (INR) 1,144/703 1,6,12 Rel.Perf.(%) -8/-24/-28 M.Cap. (INR b) 242.8 M.Cap. (USD b) 4.4 30 July 2012 1QFY13 Results
Torrent Pharmaceuticals
 BSE SENSEX S&P CNX 21,338 6,339 Bloomberg TRP IN Equity Shares (m) 169.2 M.Cap. (INR b) / (USD b) 80.4/1.3 52-Week Range (INR) 535/324 1, 6, 12 Rel.Per (%) 4/12/32 Financials & Valuation (INR Million)
Unitech. CMP: INR20 TP: INR30 Buy
 BSE SENSEX S&P CNX 16,328 4,943 Bloomberg UT IN Equity Shares (m) 2,438.8 52-Week Range (INR) 38/17 1,6,12 Rel. Perf. (%) -25/-14/-34 M.Cap. (INR b) 48.8 M.Cap. (USD b) 0.9 16 May 2012 4QFY12 Results Update
Amara Raja Batteries. CMP: INR517 TP: INR560 Buy
 BSE SENSEX S&P CNX 25,665 7,672 Bloomberg AMRJ IN Equity Shares (m) 170.8 M.Cap. (INR b) / (USD b) 88.2/1.4 52-Week Range (INR) 520/208 1, 6, 12 Rel. Per (%) 5/21/97 Financials & Valuation (INR Million)
Jaypee Infratech. CMP: INR33 TP: INR45 Buy
 BSE SENSEX S&P CNX 2,550,318 Bloomberg JPIN IN Equity Shares (m) 1,388.9 M.Cap. (INR b) / (USD b) 51.3/0.9 52-Week Range (INR) 2/1 1,, 12 Rel. Per (%) 1/9/-3 Financials & Valuation (INR m) Y/E Mar 201
Shoppers Stop. CMP: INR339 TP: INR355 Neutral
 BSE SENSEX S&P CNX 20,684 6,145 Bloomberg SHOP IN Equity Shares (m) 83.1 M.Cap. (INR b) / (USD b) 28.1/0.5 52-Week Range (INR) 494/331 1, 6, 12 Rel. Per (%) -7/-16/-28 Financials & Valuation (INR b) Y/E
BGR Energy. CMP: INR284 TP: INR296 Neutral
 BSE SENSEX S&P CNX 16,312 4,951 Bloomberg BGRL IN Equity Shares (m) 72.0 52-Week Range (INR) 512/173 1,6,12 Rel. Perf. (%) -8/8/-31 M.Cap. (INR b) 20.5 M.Cap. (USD b) 0.4 31 May 2012 4QFY12 Results Update
Stress test: Weak capital servicing ratios to drive pricing discipline
 Stress test: Weak capital servicing ratios to drive pricing discipline Operating performance near trough; expect gradual improvement 20 Update Cement Our analysis of a cross-section of cement companies
Punjab National Bank. CMP:INR1,103 TP:INR1,500 Buy
 BSE SENSEX S&P CNX 18,210 5,488 28 July 2011 1QFY12 Results Update Sector: Banking Punjab National Bank CMP:INR1,103 TP:INR1,500 Buy Bloomberg PNB IN Equity Shares (m) 316.8 52-Week Range (INR) 1,395/971
Market share recovery, price hike, content leverage to drive growth
 BSE Sensex S&P CNX 24,377 7,276 Stock Info Bloomberg DITV IN Equity Shares (m) 1,064.8 52-Week Range (INR) 71/40 1, 6, 12 Rel. Per (%) 6/-15/-41 M.Cap. (INR b) 58.2 M.Cap. (USD b) 1.0 Financial Snapshot
CMP: INR121 TP: INR193 Buy
 BSE SENSEX S&P CNX 17,085 5,139 20 October 2011 2QFY12 Results Update Sector: Metals Hindustan Zinc CMP: INR121 TP: INR193 Buy Bloomberg HZ IN Equity Shares (m) 4,225.3 52-Week Range (INR) 155/109 1,6,12
Jaiprakash Associates
 BSE SENSEX S&P CNX 16,312 4,951 Bloomberg JPA IN Equity Shares (m) 2,126.5 52-Week Range (INR) 89/50 1,6,12 Rel. Perf. (%) -14/-4/-17 M.Cap. (INR b) 127.9 M.Cap. (USD b) 2.3 31 May 2012 4QFY12 Results
Coal India CMP: INR348 TP: INR408 Buy
 BSE SENSEX S&P CNX 17,633 5,348 Bloomberg COAL IN Equity Shares (m) 6,316.4 52-Week Range (INR) 404/294 1,6,12 Rel. Perf. (%) -4/4/-15 M.Cap. (INR b) 2,198.1 M.Cap. (USD b) 39.7 14 August 2012 1QFY13 Results
IDBI Bank. CMP: INR106 TP: INR121 Neutral
 BSE SENSEX S&P CNX 17,207 5,223 Bloomberg IDBI IN Equity Shares (m) 1,278.4 52-Week Range (INR) 154/77 1,6,12 Rel.Perf.(%) -1/0/-7 M.Cap. (INR b) 135.5 M.Cap. (USD b) 2.6 24 April 2012 4QFY12 Results Update
Just Dial. CMP: INR1,129 TP: INR1,475 Buy
 BSE SENSEX S&P CNX 23,871 7,109 Bloomberg JUST IN Equity Shares (m) 70.2 M.Cap. (INR b) / (USD b) 79.2/1.3 52-Week Range (INR) 1,774/589 1, 6, 12 Rel. Per (%) -18/-7/- Financials & Valuation (INR m) Y/E
Alpesh Mehta Sohail Halai
 BSE Sensex S&P CNX 19,664 5,969 Bloomberg IIB IN Equity Shares (m) 521.8 M. Cap. (INR b)/(usd b) 227/4.1 52-Week Range (INR) 441/242 1,6,12 Rel.Perf.(%) 3/15/52 Financials & Valuation (INR b) Y/E March
Urban demand revives; Akzo gaining market share
 BSE Sensex S&P CNX 22,095 6,601 CMP: INR889 26 March 2014 Update Sector: Consumer Not Rated Urban demand revives; Akzo gaining market share Reiterates focus on Profitable growth Urban demand for Decorative
Canara Bank. CMP: INR464 TP: INR645 Buy
 BSE SENSEX S&P CNX 17,234 5,205 Bloomberg CBK IN Equity Shares (m) 443.0 52-Week Range (INR) 672/349 1,6, 12 Rel.Perf.(%) 22/2/-13 M.Cap. (INR b) 205.6 M.Cap. (USD b) 4.1 31 January 2012 3QFY12 Results
Jubilant Foodworks. CMP: INR1,051 TP: INR1,054 Neutral
 BSE SENSEX S&P CNX 16,420 4,966 Bloomberg JUBI IN Equity Shares (m) 63.5 52-Week Range (INR) 1,144/536 1,6,12 Rel. Perf. (%) -6/37/53 M.Cap. (INR b) 66.7 M.Cap. (USD b) 1.3 11 May 2012 4QFY12 Results Update
JSW Steel. CMP: INR670 TP: INR391 Sell Merger with JSW Ispat
 BSE SENSEX S&P CNX 17,384 5,254 Bloomberg JSTL IN Equity Shares (m) 223.1 52-Week Range (INR) 885/464 1,6,12 Rel. Perf. (%) -5/-12/-10 M.Cap. (INR b) 149.5 M.Cap. (USD b) 2.7 Valuation summary (INR b)
Petronet LNG. CMP: INR146 TP: INR205 Buy
 BSE SENSEX S&P CNX 17,236 5,229 Bloomberg PLNG IN Equity Shares (m) 750.0 52-Week Range (INR) 186/122 1,6,12 Rel. Perf. (%) 3/-11/-10 M.Cap. (INR b) 109.7 M.Cap. (USD b) 2.0 1 August 2012 1QFY13 Results
CPCB-2: Important long-term driver
 BSE Sensex S&P CNX 20,860 6,217 19 December 2013 Update Sector: Capital Goods Cummins India CMP: INR461 TP: INR540 Buy Stock Info Bloomberg KKC IN Equity Shares (m) 277.2 52-Week Range (INR) 550/365 1,
Godrej Properties. CMP: INR368 TP: INR420 Neutral
 BSE SENSEX S&P CNX 21,034 6,252 Bloomberg GPL IN Equity Shares (m) 99.6 M.Cap. (INR b) / (USD b) 36.4/ 0.7 52-Week Range (INR) 641/340 1, 6, 12 Rel. Per (%) -1/-44/-47 Financials & Valuation (INR b) Y/E
Larsen & Toubro. CMP: INR1,278 TP: INR1,380 Buy
 BSE SENSEX S&P CNX 16,786 5,050 Bloomberg LT IN Equity Shares (m) 608.9 52-Week Range (INR) 1,933/971 1,6,12 Rel. Perf. (%) 20/-19/-11 M.Cap. (INR b) 778.1 M.Cap. (USD b) 15.5 * Consolidated; EPS is fully
Godawari Power & Ispat
 BSE SENSEX S&P CNX CMP: INR103 TP: INR185 Buy 17,077 5,158 Bloomberg GODPI IN Equity Shares (m) 31.8 52-Week Range (INR) 200/70 1,6,12 Rel. Perf. (%) 32/-31/-33 M.Cap. (INR b) 3.3 M.Cap. (USD m) 65.3 Consolidated
Kotak Mahindra Bank. CMP: INR495 TP: INR429 Neutral
 BSE SENSEX S&P CNX 16,739 5,049 Bloomberg KMB IN Equity Shares (m) 689.3 52-Week Range 515/333 1,6,12 Rel.Perf.(%) 0/12/31 M.Cap. (Rs b) 340.5 M.Cap. (US$ b) 6.7 25 January 2012 3QFY12 Results Update Sector:
Jinesh Gandhi Sandipan Pal
 BSE Sensex S&P CNX 19,895 6,035 Bloomberg GRASIM IN Equity Shares (m) 91.7 M.Cap. (INR b)/(usd b) 275.8/5.2 52-Week Range (INR) 3,511/2,216 1,6,12 Rel. Perf. (%) -8/-12/-1 Financials & Valuation (INR b)
Kotak Mahindra Bank. CMP: INR626 TP: INR500 Neutral
 BSE SENSEX S&P CNX 18,759 5,705 Bloomberg KMB IN Equity Shares (m) 740.7 52-Week Range (INR) 652/418 1,6,12 Rel.Perf.(%) -3/-2/18 M.Cap. (INR b) 463.4 M.Cap. (USD b) 8.6 26 October 2012 2QFY13 Results
M&M Financial Services
 BSE SENSEX S&P CNX 18,793 5,717 Bloomberg MMFS IN Equity Shares (m) 102.7 52-Week Range (INR) 938/590 1,6,12 Rel.Perf.(%) 7/24/30 M.Cap. (INR b) 90.7 M.Cap. (USD b) 1.7 23 October 2012 2QFY13 Results Update
Punjab National Bank. CMP: INR768 TP: INR963 Buy
 BSE SENSEX S&P CNX 16,480 4,975 Bloomberg PNB IN Equity Shares (m) 339.2 52-Week Range (INR) 1,200/751 1,6,12 Rel.Perf.(%) -12/-16/-18 M.Cap. (INR b) 260.5 M.Cap. (USD b) 4.8 10 May 2012 4QFY12 Results
CMP: INR415 TP: INR 471 BUY
 04 Mar 2013 Update Sector: Technology Wipro CMP: INR415 TP: INR 471 BUY Pipeline and deal signings suggest improvement in growth; Multiple levers and focus on productivity will cushion margin headwinds
Shree Renuka Sugars. CMP: INR26 TP: INR45 Buy
 BSE SENSEX S&P CNX 16,219 4,924 1 June 2012 6QSY12 Results Update Sector: Sugar CMP: INR26 TP: INR45 Buy Bloomberg SHRS IN Equity Shares (m) 671.0 52-Week Range (INR) 76/23 1,6,12 Rel. Perf. (%) -10/-16/-45
To voluntarily stop supplies to US
 BSE Sensex S&P CNX 26,272 7,831 24 July 2014 Update Sector: Healthcare Ipca Laboratories CMP: INR728 TP: INR930 Buy Stock Info Bloomberg IPCA IN Equity Shares (m) 126.2 52-Week Range (INR) 907/609 1, 6,
Sun Pharmaceuticals. CMP: INR554 TP: INR614 Neutral
 BSE SENSEX S&P CNX 17,849 5,416 Bloomberg SUNP IN Equity Shares (m) 1,035.6 52-Week Range (INR) 566/404 1,6,12 Rel. Perf. (%) -3/10/31 M.Cap. (INR b) 573.7 M.Cap. (USD b) 11.6 15 February 2012 3QFY12 Results
Cummins India. CMP: INR430 TP: INR462 Neutral
 BSE SENSEX S&P CNX 16,070 4,870 Bloomberg KKC IN Equity Shares (m) 277.2 52-Week Range (INR) 515/322 1,6,12 Rel. Perf. (%) -3/30/-4 M.Cap. (INR b) 119.2 M.Cap. (USD b) 2.2 17 May 2012 4QFY12 Results Update
Hindalco. CMP: INR113 TP: INR151 Buy
 BSE SENSEX S&P CNX 18,817 5,724 Bloomberg HNDL IN Equity Shares (m) 1,990.0 52-Week Range (INR) 165/100 1,6,12 Rel. Perf. (%) -9/-18/-26 M.Cap. (INR b) 224.9 M.Cap. (USD b) 4.1 Consolidated 2QFY13 Results
Jinesh Gandhi Sandipan Pal
 BSE Sensex S&P CNX 19,576 5,944 Bloomberg GRASIM IN Equity Shares (m) 91.7 M.Cap. (INR b)/(usd b) 270.6/5.0 52-Week Range (INR) 3,511/2,216 1,6,12 Rel. Perf. (%) 2/-17/5 Financials & Valuation (INR b)
Gautam Duggad Sreekanth P V S
 BSE Sensex S&P CNX 19,990 6,069 Bloomberg FRL IN Equity Shares (m) 217.1 M.Cap. (INR b)/(usd b) 33.4/0.6 52-Week Range (INR) 276/127 1,6,12 Rel. Perf. (%) -10/-32/-20 Financials & Valuation (INR b) Y/E
CMP: INR320 TP: INR164(-49%) Sell Intending to exit UK execution is key!
 Sell Intending to exit UK execution is key!") 31 March 2016 Update Sector: Metals Tata Steel BSE SENSEX S&P CNX 25,342 7,738 Stock Info Bloomberg TATA IN Equity Shares (m) 971.2 52-Week Range (INR) 384/200 1, 6, 12 Rel. Per (%) 18/54/10 M.Cap. (INR
31 March 2016 Update Sector: Metals Tata Steel BSE SENSEX S&P CNX 25,342 7,738 Stock Info Bloomberg TATA IN Equity Shares (m) 971.2 52-Week Range (INR) 384/200 1, 6, 12 Rel. Per (%) 18/54/10 M.Cap. (INR
Dabur India. CMP: INR130 TP: INR135 Neutral
 BSE SENSEX S&P CNX 18,625 5,664 29 October 2012 2QFY13 Results Update Sector: Consumer Dabur India CMP: INR130 TP: INR135 Neutral Bloomberg DABUR IN Equity Shares (m) 1,740.7 52-Week Range (Rs) 139/92
Monnet Ispat. CMP: INR449 TP: INR518 Neutral
 4QFY12 Results Update Sector: Metals Monnet Ispat BSE SENSEX S&P CNX 16,328 4,943 CMP: INR449 TP: INR518 Neutral Bloomberg MISP IN Equity Shares (m) 64.4 52-Week Range (INR) 561/305 1,6,12 Rel. Perf. (%)
Steel Authority of India
 BSE SENSEX S&P CNX 16,439 4,990 4QFY12 Results Update Sector: Metals Steel Authority of India CMP: INR93 TP: INR99 Sell Bloomberg SAIL IN Equity Shares (m) 4,130.4 52-Week Range (INR) 151/73 1,6,12 Rel.
Punjab National Bank. CMP: INR940 TP: INR1,275 Buy
 BSE SENSEX S&P CNX 17,194 5,199 Bloomberg PNB IN Equity Shares (m) 316.8 52-Week Range (INR) 1,234/751 1,6,12 Rel.Perf.(%) 9/-10/-9 M.Cap. (INR b) 297.7 M.Cap. (USD b) 6.0 1 February 2012 3QFY12 Results
Dabur India. CMP: INR106 TP: INR94 Neutral
 28 July 2011 1QFY12 Results Update Sector: FMCG BSE SENSEX S&P CNX 18,210 5,488 Dabur India CMP: INR106 TP: INR94 Neutral Bloomberg DABUR IN Equity Shares (m) 1,740.0 52-Week Range (INR) 122/87 1,6,12
Maruti Suzuki. CMP: INR1,395 TP: INR1,730 Buy
 BSE SENSEX S&P CNX 18,431 5,598 Bloomberg MSIL IN Diluted Equity Shares (m) 302.1 52-Week Range (INR) 1,498/906 1,6,12 Rel.Perf.(%) 5/-5/20 M.Cap. (INR b) 421.3 M.Cap. (USD b) 7.8 31 October 2012 2QFY13
Axis Bank. CMP: INR1,119 TP: INR1,330 Buy
 BSE SENSEX S&P CNX 18,714 5,687 Bloomberg AXSB IN Equity Shares (m) 413.2 52-Week Range (INR) 1,309/785 1,6,12 Rel.Perf.(%) 9/-16/-8 M.Cap. (INR b) 462.4 M.Cap. (USD b) 8.7 16 October 2012 2QFY13 Results
Godrej Consumer Products
 BSE SENSEX S&P CNX 18,755 5,698 Bloomberg GCPL IN Equity Shares (m) 340.3 52-Week Range (INR) 745/370 1,6,12 Rel. Perf. (%) 4/17/67 M.Cap. (INR b) 246.4 M.Cap. (USD b) 4.6 5 November 2012 2QFY13 Results
Axis Bank. CMP: INR1,008 TP: INR1,240 Buy
 BSE SENSEX S&P CNX 16,739 5,049 Bloomberg AXSB IN Equity Shares (m) 410.5 52-Week Range 1,461/785 1,6,12 Rel.Perf.(%) 11/-9/-9 M.Cap. (INR b) 413.8 M.Cap. (USD b) 8.2 20 January 2012 Results Update Sector:
KPIT Technologies. CMP: INR175 TP: INR170 Downgrade to Neutral
 BSE SENSEX S&P CNX 26,026 7,768 Bloomberg KPIT IN Equity Shares (m) 194.9 M.Cap. (INR b) / (USD b) 34.0/0.6 52-Week Range (INR) 191/122 1, 6, 12 Rel. Per (%) 2/-27/4 Financials & Valuation (INR Billion)
Hindustan Unilever. CMP:INR324 TP:INR302 Neutral
 BSE SENSEX S&P CNX 18,197 5,482 29 July 2011 1QFY12 Results Update Sector: FMCG Hindustan Unilever CMP:INR324 TP:INR302 Neutral Bloomberg HUVR IN Equity Shares (m) 2,159.5 52-Week Range (INR) 347/250 1,6,12
Financial integrity intact; FDA resolution the key
 BSE Sensex S&P CNX 25,842 7,843 19 November 2015 Update Sector: Healthcare Dr. Reddy s Lab CMP: INR3,287 TP: INR4,000 (+22%) Buy Stock Info Bloomberg DRRD IN Equity Shares (m) 170.4 M.Cap. (INR b)/(usd
Oberoi Realty. CMP: INR269 TP: INR320 Buy
 BSE SENSEX S&P CNX 18,682 5,684 Bloomberg OBER IN Equity Shares (m) 328.2 52-Week Range (INR) 323/205 1,6,12 Rel. Perf. (%) 13/-7/7 M.Cap. (INR b) 88.3 M.Cap. (USD b) 1.6 22 October 2012 2QFY13 Results
CMP: INR124 TP: INR172 Buy. Benefit of two major motorcycle launches not priced in. Improved industry outlook and recent launch success drive upgrades
 BSE Sensex S&P CNX 24,717 7,359 Stock Info Bloomberg TVSL IN Equity Shares (m) 475.1 52-Week Range (INR) 138/28 1, 6, 12 Rel. Per (%) 34/111/210 M.Cap. (INR b) 59.1 M.Cap. (USD b) 1.0 Financial Snapshot
Automobiles. HMSI s expansion could result in short-term pressure on HMCL and BJAUT
 Sector Update Automobiles HMSI s expansion could result in short-term pressure on HMCL and BJAUT Valuations reasonable, but demand recovery key for stock performance Honda Motorcycle and Scooter India
Pantaloon Retail. CMP: INR177 TP: INR192 Neutral
 BSE SENSEX S&P CNX 17,773 5,390 Bloomberg PF IN Equity Shares (m) 217.1 52-Week Range (INR) 364/125 1,6,12 Rel. Perf. (%) 9/-49/-29 M.Cap. (Rs b) 38.4 M.Cap. (US$ b) 0.8 14 February 2012 2QFY12 Results
CMP: INR1,044 TP: INR970 (-7%) Neutral Sale of Healthcare business margin accretive
 Neutral Sale of Healthcare business margin accretive") BSE SENSEX S&P CNX 24,646 7,485 4 March 2016 Update Sector: Capital Goods Siemens CMP: INR1,044 TP: INR970 (-7%) Neutral Sale of Healthcare business margin accretive Stock Info Bloomberg SIEM IN Equity
BSE SENSEX S&P CNX 24,646 7,485 4 March 2016 Update Sector: Capital Goods Siemens CMP: INR1,044 TP: INR970 (-7%) Neutral Sale of Healthcare business margin accretive Stock Info Bloomberg SIEM IN Equity
Oberoi Realty. CMP: INR264 TP: INR315 Buy
 BSE SENSEX S&P CNX 17,151 5,202 Bloomberg OBER IN Equity Shares (m) 328.2 52-Week Range (INR) 323/205 1,6,12 Rel. Perf. (%) 4/15/16 M.Cap. (INR b) 87.0 M.Cap. (USD b) 1.7 26 April 2012 4QFY12 Results Update
Tata Power. CMP: INR111 TP: INR92 Neutral
 BSE SENSEX S&P CNX 17,749 5,382 Bloomberg TPWR IN Equity Shares (m) 2,373.3 52-Week Range (INR) 135/81 1,6,12 Rel. Perf. (%) 10/-5/-10 M.Cap. (INR b) 263.9 M.Cap. (USD b) 5.3 13 February 2012 3QFY12 Results
Individual Housing Loans: Rationalization of Risk-Weights and LTV Ratios
 8 October 2015 Sector Update Financials Individual Housing Loans: Rationalization of Risk-Weights and LTV Ratios Significant capital release for HFCs; Limited benefits for banks Event: RBI reduces risk
Godrej Properties. CMP: INR595 TP: INR635 Neutral
 BSE SENSEX S&P CNX 16,913 5,114 Bloomberg GPL IN Equity Shares (m) 78.0 52-Week Range 845/570 1,6,12 Rel. Perf. (%) 0/-9/-2 M.Cap. (INR b) 46.4 M.Cap. (USD b) 0.9 4QFY12 Results Update Sector: Real Estate
Raymond. Restructuring initiatives bearing fruit; Land bank base case value INR147/share; Reiterate Buy. CMP: INR385 TP: INR462 Buy
 14 June 2012 Update Raymond CMP: INR385 TP: INR462 Buy Restructuring initiatives bearing fruit; Land bank base case value INR147/share; Reiterate Buy We met the management of Raymond (RW IN, Mkt Cap USD0.4b,
CMP: INR2,623 TP: INR2,875 (+10%) Neutral
 Neutral") 21 March 2017 Update Sector: Healthcare Dr Reddy s Labs BSE SENSEX S&P CNX 29,485 9,122 Bloomberg DRRD IN Equity Shares (m) 170.4 M.Cap.(INR b)/(usd b) 447.0 / 6.6 52-Week Range (INR) 3689 / 2602 1, 6,
21 March 2017 Update Sector: Healthcare Dr Reddy s Labs BSE SENSEX S&P CNX 29,485 9,122 Bloomberg DRRD IN Equity Shares (m) 170.4 M.Cap.(INR b)/(usd b) 447.0 / 6.6 52-Week Range (INR) 3689 / 2602 1, 6,
Oberoi Realty. CMP: INR240 TP: INR297 Buy
 BSE SENSEX S&P CNX 25,642 7,664 Bloomberg OBER IN Equity Shares (m) 328.2 M.Cap. (INR b) / (USD b) 78.8/1.3 52-Week Range (INR) 276/154 1, 6, 12 Rel. Per (%) -8/-7/-6 Financials & Valuation (INR m) Y/E
BHEL. CMP: INR227 TP: INR233 Neutral
 BSE SENSEX S&P CNX 18,636 5,666 Bloomberg BHEL IN Equity Shares (m) 2,447.6 52-Week Range (INR) 368/198 1,6,12 Rel. Perf. (%) -7/-7/-35 M.Cap. (INR b) 556.2 M.Cap. (USD b) 10.3 30 October 2012 2QFY13 Results
Expect capacity-led rerating; maintain Buy
 BSE SENSEX S&P CNX 27,238 8,400 Stock Info Bloomberg SRCM IN Equity Shares (m) 34.8 52-Week Range (INR) 18519/9350 1, 6, 12 Rel. Per (%) -2/-3/32 M.Cap. (INR b) 523.7 M.Cap. (USD b) 7.7 Avg Val, INRm 216.4
PVR Ltd. CMP: INR685 TP: INR750 Buy
 BSE SENSEX S&P CNX 27,860 8,324 Bloomberg PVRL IN Equity Shares (m) 41.3 M.Cap. (INR b) / (USD b) 28.3/0.5 52-Week Range (INR) 747/465 1, 6, 12 Rel. Per (%) -6/9/-19 Financials & Valuation (INR Million)
CMP: INR615 TP: INR755(+23%) Buy Nominee Gold has some new competition on the block
 Buy Nominee Gold has some new competition on the block") BSE SENSEX S&P CNX 25,653 7,861 16 May 2016 Update Sector: Fertilizers PI Industries CMP: INR615 TP: INR755(+23%) Buy Nominee Gold has some new competition on the block We recently interacted with the
BSE SENSEX S&P CNX 25,653 7,861 16 May 2016 Update Sector: Fertilizers PI Industries CMP: INR615 TP: INR755(+23%) Buy Nominee Gold has some new competition on the block We recently interacted with the
Cement. Demand to grow 8%, with cost push to be passed on CCI probe to have limited impact
 15 May 2012 Update Cement Demand to grow 8%, with cost push to be passed on CCI probe to have limited impact We met with senior managements of the large cement companies in India, to get perspective on
Britannia Industries. CMP: INR546 TP: INR605 Upgrade to Neutral Volume growth bottoms out; Upgrade to Neutral
 BSE SENSEX S&P CNX 19,016 5,783 Bloomberg BRIT IN Equity Shares (m) 119.5 M.Cap. (INR b)/(usd b) 65.2/1.2 52-Week Range (INR) 595/400 1,6,12 Rel. Perf. (%) 3/10/-13 Financials & Valuation (INR b) Y/E March
ECOSCOPE. Real GDP growth eases on lower net indirect taxes. The Economy Observer. Real GVA growth exactly as expected
 31 August 2016 ECOSCOPE The Economy Observer Real GDP growth eases on lower net indirect taxes Real GVA growth exactly as expected India s real gross domestic product (GDP) grew at the slowest pace in