Larsen & Toubro. CMP: INR1,160 TP: INR1,417 Buy
|
|
|
- Samuel Lindsey
- 5 years ago
- Views:
Transcription


1 BSE SENSEX S&P CNX 16,216 4,908 Bloomberg LT IN Equity Shares (m) Week Range (INR) 1,868/971 1,6,12 Rel. Perf. (%) -4/-7/12 M.Cap. (INR b) M.Cap. (USD b) 13.1 * Consolidated; EPS is fully diluted 15 May QFY12 Results Update Sector: Capital Goods Larsen & Toubro CMP: INR1,160 TP: INR1,417 Buy 4QFY12 operational performance in line: Larsen and Toubro (LT) reported revenue growth of 21% YoY and EBITDA growth of 9% YoY for 4QFY12, largely in line with our estimates. PAT grew 22% YoY, higher than our estimate, supported by higher other income, lower interest and lower tax rates. Missed FY12 order intake guidance; EBITDA margin in line: In 4QFY12, order intake was INR212b, down 30% YoY. In FY12, order intake was INR706b, down 12%; the management had guided 5% growth. LT is seeing meaningful increase in order contribution from the Infrastructure segment while the share of Oil & Gas has declined significantly in the last two years. The contribution from overseas orders has also increased meaningfully. In FY12, E&C margins declined 95bp to 12.7% v/s management guidance of bp decline. Management guidance for FY13 a positive surprise: The management has guided 15-20% growth in order intake and revenue for FY13, and EBITDA margin within 50bp of FY12 level. Order intake of INR805b-840b in FY13 will be supported by INR120b-150b of project deferments in FY12, increase in contribution of international markets from 18% in FY12 to 25%, steady contribution of ~20% from the Buildings & Factories, Oil & Gas and Process Industries. Standalone profit to remain flat YoY; manufacturing JVs to impact consolidated profit: We expect standalone EPS (net of dividend from subsidiaries) to remain flat at INR67/INR68 for FY13/14 v/s INR67 in FY12. Revenue would grow at a CAGR of 10% while EBITDA margin would decline by 72bp over FY We estimate consolidated EPS at INR87 (+12%, upgrade of 5%) for FY13 and at INR89 (+2%, downgrade of 4%) for FY14. There exist headwinds to consolidated numbers, given poor business visibility for manufacturing JVs like Power BTG, Shipbuilding and Forgings, and investment in BOT projects. Our estimates do not fully capture the possible impact of capacity under-utilization in the initial periods. Maintain Buy with an SOTP-based target price of INR1,417. We value LT standalone at 14x FY14E earnings and subsidiaries at INR428/share. Satyam Agarwal (AgarwalS@MotilalOswal.com); Deepak Narnolia (Deepak.Narnolia@MotilalOswal.com);


2 4QFY12 operational performance in line LT reported revenue growth of 21% YoY and EBITDA growth of 9% YoY for 4QFY12, largely in line with our estimates. PAT grew 22% YoY, higher than our estimate, supported by higher other income, lower interest and lower tax rate. Interest expense at INR1.2b was lower than our estimate of INR2.2b, led by better liquidity management, repayment of high cost debt and packing credit in foreign currency. Tax rate was 26.9% in 4QFY12 v/s our estimate of 38%. EBITDA margin declined 150bp YoY, impacted by increase in raw material cost, which increased by 230bp YoY as a percentage of sales. While staff cost was flat YoY, SG&A expenses were down 120bp YoY and other manufacturing expenses declined 40bp YoY. 4QFY12 revenue up 21% YoY; execution healthy EBITDA margin down 150bp YoY Missed FY12 order intake guidance; expect 15-20% growth in FY13 Missed FY12 order intake guidance: In 4QFY12, order intake was INR212b, down 30% YoY. In FY12, order intake was INR706b, down 12%; the management had guided 5% growth. Order intake was impacted by slowdown in the Power segment and sluggish industrial capex. In the Power segment, order intake declined 42%, while in Process Industries, order intake declined 39% YoY. The Oil & Gas segment witnessed strong order growth on a low base and Infrastructure segment orders grew 12%. Order intake (INR b) impacted by order deferments Order book to bill (BTB x) at 2.7x TTM 15 May


3 Contribution of export orders doubled: Export orders in the E&C segment grew 2x to INR113b and the contribution from exports has almost doubled in FY12. In the domestic market, E&C orders declined 22%. Meaningful change in order mix LT is seeing a meaningful increase in contribution of orders from the Infrastructure segment while the share of the Oil & Gas segment has significantly declined over the last two years. The Infrastructure segment contributed 48% of the intake v/s 38% in FY11 and 27% in FY10. The share of Oil & Gas declined to 10% from ~15% over the past three years and 20-25% prior to that. The contribution from overseas orders has also increased meaningfully. Overseas markets contributed 18% of the order intake in FY12, v/s 10% in FY11 and 5% in FY10. Order intake composition: Increased share of Infra/Power segments, lower contribution of Oil & Gas adverse for margins (%) Contribution from export to order intake doubled over last two years E&C segment revenue grew 22% YoY, margins in line with guidance E&C segment revenue grew 22% YoY while EBITDA margin declined 120bp YoY during the quarter. For FY12, EBITDA margin decline was in line with the management guidance of bp reduction. 15 May

4 Net working capital rises to 12% of sales from 8% in 4QFY11 NWC increased to 12% of revenue in 4QFY12 from 8% in 4QFY11. We expect NWC of 13-15% in the long term. This led to lower operating cash flows at INR11b v/s INR38b in 4QFY11. Gross debt on the book increased to INR99b from INR86b as at 2QFY12. Cash in hand stands at INR87b, down from INR90b in March Balance Sheet (INR b) Standalone Consolidated FY12 FY11 FY12 FY11 Net Worth Long Term Liabilities Total Capital Employed Fixed Assets Non current investments Other Non Current Assets Total Non Current Assets Current Assets Current Liabilities Net Current Assets Total Assets Subsidiaries' performance robust For FY12, L&T Infotech reported 29% growth in revenue while PAT grew 33%. Growth in revenue came primarily from North American markets and INR depreciation. This is encouraging, as profit margins were impacted by the expiry of STPI tax benefits. L&T Finance Holdings reported revenue growth of 42% and PAT growth of 16%. 15 May
5 Subsidiary performance (INR m) L&T Infotech 1QFY10 2QFY10 3QFY10 4QFY10 1QFY11 2QFY11 3QFY11 4QFY11 1QFY12 2QFY12 3QFY12 4QFY12 Sales (INR m) 4,730 4,690 5,120 4,570 5,670 5,890 6,010 7,010 7,380 7,760 8,350 8,170 Growth (%) 4.6 (17.3) (2.3) (8.4) PAT ,030 1,160 1,100 Growth (%) - (29.6) (2.7) Net Profit Margin (%) L&T Finance Holdings (NBFCs) (INR m) 4QFY12 4QFY11 FY12 FY11 YoY (%) 4QFY12 FY12 Loans and Advances 254, , , , Total Income 8,520 6,030 30,070 21, PAT 1,390 1,110 4,660 4, NIM (%) Gross NPA (%) Credit Losses (%) L&T Finance Holdings (PAT) 1, ,550 3, Average Net Worth 38,230 26,190 38,230 26, Valuation and view We expect standalone profits (net of dividend from subsidiaries) to remain flat over the next two years. Manufacturing JVs would have a negative impact on consolidated profits. Dividend income from subsidiaries was INR4.1b in FY12 (v/s INR2.3b in FY11); adjusted for this, standalone EPS for FY12 was INR67 (up 11%). We expect standalone EPS (net of dividend from subsidiaries) to remain flat at INR67/INR68 for FY13/14 v/s INR67 in FY12. Revenue would grow at a CAGR of 10% while EBITDA margin would decline by 72bp over FY We estimate consolidated EPS at INR87 (+12%, upgrade of 5%) for FY13 and at INR89 (+2%, downgrade of 4%) for FY14. There exist headwinds to consolidated numbers, given poor business visibility for manufacturing JVs like Power BTG, Shipbuilding and Forgings, and investment in BOT projects. Our estimates do not fully capture the possible impact of capacity under-utilization in the initial periods. Maintain Buy with an SOTP-based target price of INR1,417. We value LT standalone at 14x FY14E earnings and subsidiaries at INR428/share. 15 May
6 Larsen & Toubro: an investment profile Company description L&T is India's largest engineering and construction company. Apart from its core construction activity the company is making significant inroads into diverse range of products & services through its subsidiaries and manufacturing JVs in Power BTG, forging and shipbuilding. The company is also involved in various developmental projects on BOT basis in roads, ports, rails and power projects. Export contributes to around ~18% of the order intake. Key investment arguments L&T is well placed to capitalize on long-term infrastructure demand. L&T's order backlog is worth INR1458b implying BTB ratio of 2.7x TTM. We believe L&T is the best play on capex with its strong execution skills, diversified portfolio and strong balance sheet and will benefit from a likely pick up in demand. L&T's operational performance continues to be encouraging in a challenging environment. Revenue growth is robust, with management guiding for FY13 growth at 15-20%, on back of 21% growth in FY12. Margins have again shown some stability, given the premium positioning and various cost optimization / productivity enhancement measures being undertaken. Order intake is also expected to be steady with management guidance for 15-20% growth, despite a challenging macro environment. Comparative valuations L&T BHEL Thermax P/E (x) FY13E FY14E P/BV (x) FY13E FY14E EV/Sales (x) FY13E FY14E EV/EBITDA (x) FY13E FY14E Key investment concerns Order intake is driven by long gestation projects and is unlikely to favorably impact FY13 revenues and margins. Also key investments in manufacturing JVs and BOT projects are likely to be a drag on profits in the near term; impacting RoEs. An unfavorable political climate, logjams relating to clearances for projects stifle fresh order intake growth, hampering earnings growth. Recent developments In a long-awaited management succession exercise, L&T announced appointment of Dr. K Venkatramanan as its new CEO and Managing Director, while its current CMD, Mr. A M Naik would continue as the Executive Chairman for the next five years. L&T has lost to competitors in the NTPC bulk tenders 1 & 2 worth INR390b with nil orders. This is a significant loss given the tenders were expected to be important drivers for growth in BTG JV. Valuation and view On our estimates standalone revenues would grow at a CAGR of 10% while EBITDA margins would decline by 72bp over FY We estimate consolidated FY13 EPS at INR87 (+12%, upgrade of 5%) / FY14 at INR89/sh (+2%, downgrade of 4%). Maintain Buy with a SOTP-based TP of INR1,417/sh. Sector view We maintain our Neutral view on the sector EPS: MOSL forecast v/s consensus (INR) MOSL Consensus Variation Forecast Forecast (%) FY FY Target price and recommendation Current Target Upside Reco. Price (INR) Price (INR) (%) 1,160 1, Buy Stock performance (1 year) Shareholding pattern (%) Mar-12 Dec-11 Mar-11 Promoter Domestic Inst Foreign Others May
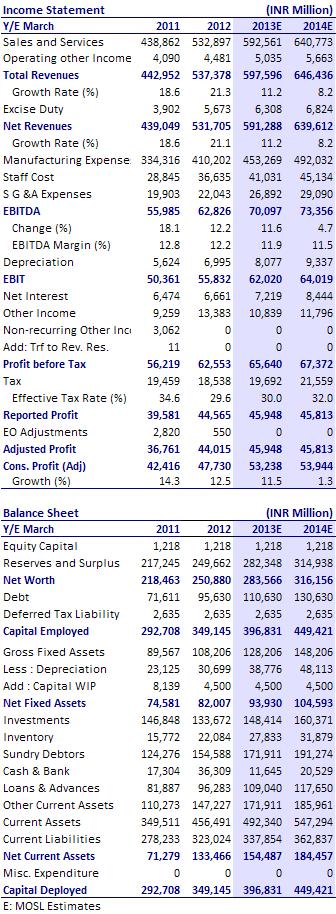
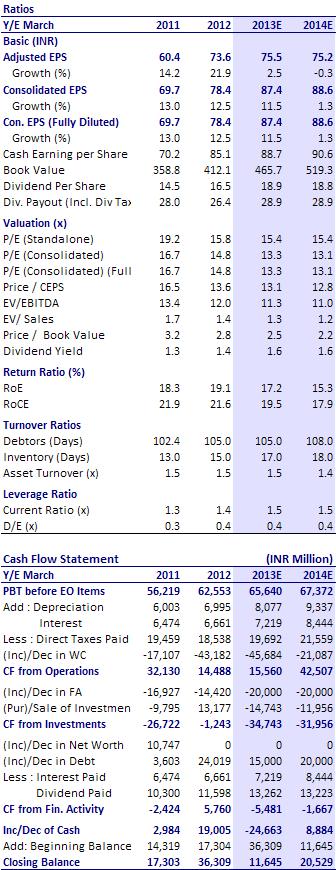
7 Financials and Valuation 15 May
8 Disclosures This report is for personal information of the authorized recipient and does not construe to be any investment, legal or taxation advice to you. This research report does not constitute an offer, invitation or inducement to invest in securities or other investments and Motilal Oswal Securities Limited (hereinafter referred as MOSt) is not soliciting any action based upon it. This report is not for public distribution and has been furnished to you solely for your information and should not be reproduced or redistributed to any other person in any form. Unauthorized disclosure, use, dissemination or copying (either whole or partial) of this information, is prohibited. The person accessing this information specifically agrees to exempt MOSt or any of its affiliates or employees from, any and all responsibility/liability arising from such misuse and agrees not to hold MOSt or any of its affiliates or employees responsible for any such misuse and further agrees to hold MOSt or any of its affiliates or employees free and harmless from all losses, costs, damages, expenses that may be suffered by the person accessing this information due to any errors and delays. The information contained herein is based on publicly available data or other sources believed to be reliable. While we would endeavour to update the information herein on reasonable basis, MOSt and/or its affiliates are under no obligation to update the information. Also there may be regulatory, compliance, or other reasons that may prevent MOSt and/or its affiliates from doing so. MOSt or any of its affiliates or employees shall not be in any way responsible and liable for any loss or damage that may arise to any person from any inadvertent error in the information contained in this report. MOSt or any of its affiliates or employees do not provide, at any time, any express or implied warranty of any kind, regarding any matter pertaining to this report, including without limitation the implied warranties of merchantability, fitness for a particular purpose, and non-infringement. The recipients of this report should rely on their own investigations. This report is intended for distribution to institutional investors. Recipients who are not institutional investors should seek advice of their independent financial advisor prior to taking any investment decision based on this report or for any necessary explanation of its contents. MOSt and/or its affiliates and/or employees may have interests/positions, financial or otherwise in the securities mentioned in this report. To enhance transparency, MOSt has incorporated a Disclosure of Interest Statement in this document. This should, however, not be treated as endorsement of the views expressed in the report. Disclosure of Interest Statement Larsen & Toubro 1. Analyst ownership of the stock No 2. Group/Directors ownership of the stock No 3. Broking relationship with company covered No 4. Investment Banking relationship with company covered No Analyst Certification The views expressed in this research report accurately reflect the personal views of the analyst(s) about the subject securities or issues, and no part of the compensation of the research analyst(s) was, is, or will be directly or indirectly related to the specific recommendations and views expressed by research analyst(s) in this report. The research analysts, strategists, or research associates principally responsible for preparation of MOSt research receive compensation based upon various factors, including quality of research, investor client feedback, stock picking, competitive factors and firm revenues. Regional Disclosures (outside India) This report is not directed or intended for distribution to or use by any person or entity resident in a state, country or any jurisdiction, where such distribution, publication, availability or use would be contrary to law, regulation or which would subject MOSt & its group companies to registration or licensing requirements within such jurisdictions. For U.K. This report is intended for distribution only to persons having professional experience in matters relating to investments as described in Article 19 of the Financial Services and Markets Act 2000 (Financial Promotion) Order 2005 (referred to as "investment professionals"). This document must not be acted on or relied on by persons who are not investment professionals. Any investment or investment activity to which this document relates is only available to investment professionals and will be engaged in only with such persons. For U.S. MOSt is not a registered broker-dealer in the United States (U.S.) and, therefore, is not subject to U.S. rules. In reliance on the exemption from registration provided by Rule 15a-6 of the U.S. Securities Exchange Act of 1934, as amended (the "Exchange Act") and interpretations thereof by the U.S. Securities and Exchange Commission ("SEC") in order to conduct business with Institutional Investors based in the U.S., Motilal Oswal has entered into a chaperoning agreement with a U.S. registered broker-dealer, Marco Polo Securities Inc. ("Marco Polo"). This report is intended for distribution only to "Major Institutional Investors" as defined by Rule 15a-6(b)(4) of the Exchange Act and interpretations thereof by SEC (henceforth referred to as "major institutional investors"). This document must not be acted on or relied on by persons who are not major institutional investors. Any investment or investment activity to which this document relates is only available to major institutional investors and will be engaged in only with major institutional investors. The Research Analysts contributing to the report may not be registered /qualified as research analyst with FINRA. Such research analyst may not be associated persons of the U.S. registered broker-dealer, Marco Polo and therefore, may not be subject to NASD rule 2711 and NYSE Rule 472 restrictions on communication with a subject company, public appearances and trading securities held by a research analyst account. Motilal Oswal Securities Ltd 3rd Floor, Hoechst House, Nariman Point, Mumbai Phone: (91-22) Fax: (91-22) reports@motilaloswal.com
Larsen & Toubro. CMP: INR1,278 TP: INR1,380 Buy
 BSE SENSEX S&P CNX 16,786 5,050 Bloomberg LT IN Equity Shares (m) 608.9 52-Week Range (INR) 1,933/971 1,6,12 Rel. Perf. (%) 20/-19/-11 M.Cap. (INR b) 778.1 M.Cap. (USD b) 15.5 * Consolidated; EPS is fully
BGR Energy. CMP: INR284 TP: INR296 Neutral
 BSE SENSEX S&P CNX 16,312 4,951 Bloomberg BGRL IN Equity Shares (m) 72.0 52-Week Range (INR) 512/173 1,6,12 Rel. Perf. (%) -8/8/-31 M.Cap. (INR b) 20.5 M.Cap. (USD b) 0.4 31 May 2012 4QFY12 Results Update
BGR Energy. CMP: INR266 TP: INR230 Neutral
 BSE SENSEX S&P CNX 18,562 5,645 Bloomberg BGRL IN Equity Shares (m) 72.0 52-Week Range (INR) 374/173 1,6,12 Rel. Perf. (%) -3/27/-24 M.Cap. (INR b) 19.2 M.Cap. (USD b) 0.4 3 November 2012 2QFY13 Results
BGR Energy. CMP: INR282 TP: INR253 Neutral
 BSE SENSEX S&P CNX 17,413 5,283 Bloomberg BGRL IN Equity Shares (m) 72.0 52-Week Range (INR) 378/173 1,6,12 Rel. Perf. (%) -9/17/-22 M.Cap. (INR b) 20.3 M.Cap. (USD b) 0.4 6 August 2012 1QFY13 Results
NTPC CMP: INR169 TP: INR191 Buy
 BSE SENSEX S&P CNX 18,625 5,664 Bloomberg NTPC IN Equity Shares (m) 8,245.5 52-Week Range (INR) 190/139 1,6,12 Rel. Perf. (%) 3/-4/-11 M.Cap. (INR b) 1,393.5 M.Cap. (USD b) 26.0 26 October 2012 2QFY13
Cummins India. CMP: INR430 TP: INR462 Neutral
 BSE SENSEX S&P CNX 16,070 4,870 Bloomberg KKC IN Equity Shares (m) 277.2 52-Week Range (INR) 515/322 1,6,12 Rel. Perf. (%) -3/30/-4 M.Cap. (INR b) 119.2 M.Cap. (USD b) 2.2 17 May 2012 4QFY12 Results Update
Asian Paints. CMP: INR2,722 TP: INR3,161 Buy
 BSE SENSEX S&P CNX 16,739 5,049 Bloomberg APNT IN Equity Shares (m) 95.9 52-Week Range (INR) 3,366/2,395 1,6,12 Rel. Perf. (%) -5/-3/14 M.Cap. (INR b) 261.1 M.Cap. (USD b) 4.9 23 January 2012 3QFY12 Results
Pidilite Industries. CMP: INR164 TP: INR186 Buy
 BSE SENSEX S&P CNX 16,640 5,043 Bloomberg PIDI IN Equity Shares (m) 506.1 52-Week Range (INR) 188/134 1,6,12 Rel. Perf. (%) 1/20/5 M.Cap. (INR b) 83.0 M.Cap. (USD b) 1.5 27 July 2012 1QFY13 Results Update
Titan Industries. CMP: INR222 TP: INR220 Neutral
 BSE SENSEX S&P CNX 17,257 5,241 Bloomberg TTAN IN Equity Shares (m) 887.8 52-Week Range (INR) 255/154 1,6,12 Rel. Perf. (%) -1/13/3 M.Cap. (Rs b) 197.1 M.Cap. (US$ b) 3.6 2 August 2012 1QFY13 Results Update
Unitech. CMP: INR20 TP: INR30 Buy
 BSE SENSEX S&P CNX 16,328 4,943 Bloomberg UT IN Equity Shares (m) 2,438.8 52-Week Range (INR) 38/17 1,6,12 Rel. Perf. (%) -25/-14/-34 M.Cap. (INR b) 48.8 M.Cap. (USD b) 0.9 16 May 2012 4QFY12 Results Update
Jaiprakash Associates
 BSE SENSEX S&P CNX 16,312 4,951 Bloomberg JPA IN Equity Shares (m) 2,126.5 52-Week Range (INR) 89/50 1,6,12 Rel. Perf. (%) -14/-4/-17 M.Cap. (INR b) 127.9 M.Cap. (USD b) 2.3 31 May 2012 4QFY12 Results
Punjab National Bank. CMP:INR1,103 TP:INR1,500 Buy
 BSE SENSEX S&P CNX 18,210 5,488 28 July 2011 1QFY12 Results Update Sector: Banking Punjab National Bank CMP:INR1,103 TP:INR1,500 Buy Bloomberg PNB IN Equity Shares (m) 316.8 52-Week Range (INR) 1,395/971
Canara Bank. CMP: INR419 TP: INR525 Buy
 BSE SENSEX S&P CNX 18,817 5,724 Bloomberg CBK IN Equity Shares (m) 443.0 52-Week Range (INR) 566/349 1,6, 12 Rel.Perf.(%) -7/-18/-17 M.Cap. (INR b) 170.3 M.Cap. (USD b) 3.0 7 November 2012 2QFY13 Results
IndusInd Bank. CMP: INR345 TP: INR419 Buy
 BSE SENSEX S&P CNX 17,504 5,332 Bloomberg IIB IN Equity Shares (m) 467.7 52-Week Range (INR) 352/222 1,6,12 Rel.Perf.(%) 13/25/34 M.Cap. (INR b) 161.4 M.Cap. (USD b) 3.1 20 April 2012 4QFY12 Results Update
Jubilant Foodworks. CMP: INR1,189 TP: INR1,0541,054 Neutral
 BSE SENSEX S&P CNX 16,846 5,110 Bloomberg JUBI IN Equity Shares (m) 63.5 52-Week Range (INR) 1,189/633 1,6,12 Rel. Perf. (%) 4/38/47 M.Cap. (INR b) 75.5 M.Cap. (USD b) 1.3 26 July 2012 1QFY13 Results Update
IDBI Bank. CMP: INR106 TP: INR121 Neutral
 BSE SENSEX S&P CNX 17,207 5,223 Bloomberg IDBI IN Equity Shares (m) 1,278.4 52-Week Range (INR) 154/77 1,6,12 Rel.Perf.(%) -1/0/-7 M.Cap. (INR b) 135.5 M.Cap. (USD b) 2.6 24 April 2012 4QFY12 Results Update
Coal India CMP: INR348 TP: INR408 Buy
 BSE SENSEX S&P CNX 17,633 5,348 Bloomberg COAL IN Equity Shares (m) 6,316.4 52-Week Range (INR) 404/294 1,6,12 Rel. Perf. (%) -4/4/-15 M.Cap. (INR b) 2,198.1 M.Cap. (USD b) 39.7 14 August 2012 1QFY13 Results
BHEL. CMP: INR227 TP: INR233 Neutral
 BSE SENSEX S&P CNX 18,636 5,666 Bloomberg BHEL IN Equity Shares (m) 2,447.6 52-Week Range (INR) 368/198 1,6,12 Rel. Perf. (%) -7/-7/-35 M.Cap. (INR b) 556.2 M.Cap. (USD b) 10.3 30 October 2012 2QFY13 Results
Reliance Infrastructure CMP: INR528
 BSE SENSEX S&P CNX 17,657 5,363 16 August 2012 1QFY13 Results Update Sector: Utilities Reliance Infrastructure CMP: INR528 Buy Bloomberg RELI IN Equity Shares (m) 267.5 52-Week Range (INR) 680/328 1,6,12
CMP: INR121 TP: INR193 Buy
 BSE SENSEX S&P CNX 17,085 5,139 20 October 2011 2QFY12 Results Update Sector: Metals Hindustan Zinc CMP: INR121 TP: INR193 Buy Bloomberg HZ IN Equity Shares (m) 4,225.3 52-Week Range (INR) 155/109 1,6,12
Hardick Bora
 BSE Sensex S&P CNX 19,990 6,069 Bloomberg JOL IN Equity Shares (m) 159.3 M.Cap. (INR b)/(usd b) 26.0/0.5 52-Week Range (INR) 248/154 1,6,12 Rel. Perf. (%) -18/-28/-34 Financials & Valuation (INR b) Y/E
Sanofi India. CMP: INR2,200 TP: INR1,848 Neutral
 BSE SENSEX S&P CNX 16,846 5,110 Bloomberg SANL IN Equity Shares (m) 23.0 52-Week Range (INR) 2,430/1,980 1,6,12 Rel. Perf. (%) 3/-3/15 M.Cap. (INR b) 50.7 M.Cap. (USD b) 0.9 26 July 2012 2QCY12 Results
Kotak Mahindra Bank. CMP: INR495 TP: INR429 Neutral
 BSE SENSEX S&P CNX 16,739 5,049 Bloomberg KMB IN Equity Shares (m) 689.3 52-Week Range 515/333 1,6,12 Rel.Perf.(%) 0/12/31 M.Cap. (Rs b) 340.5 M.Cap. (US$ b) 6.7 25 January 2012 3QFY12 Results Update Sector:
Godrej Consumer Products
 BSE SENSEX S&P CNX 17,602 5,337 Bloomberg GCPL IN Equity Shares (m) 340.3 52-Week Range (INR) 658/370 1,6,12 Rel. Perf. (%) 5/37/42 M.Cap. (INR b) 205.9 M.Cap. (USD b) 3.7 7 August 2012 1QFY13 Results
Idea Cellular. CMP: INR81 TP: INR Under Review
 BSE SENSEX S&P CNX 16,918 5,128 Bloomberg IDEA IN Equity Shares (m) 3,308.8 52-Week Range (INR) 104/71 1,6,12 Rel. Perf. (%) 6/-13/4 M.Cap. (INR b) 268.0 M.Cap. (USD b) 4.8 25 July 2012 1QFY13 Results
Punjab National Bank. CMP: INR716 TP: INR950 Buy
 BSE SENSEX S&P CNX 16,839 5,100 Bloomberg PNB IN Equity Shares (m) 339.2 52-Week Range (INR) 1,144/703 1,6,12 Rel.Perf.(%) -8/-24/-28 M.Cap. (INR b) 242.8 M.Cap. (USD b) 4.4 30 July 2012 1QFY13 Results
Canara Bank. CMP: INR464 TP: INR645 Buy
 BSE SENSEX S&P CNX 17,234 5,205 Bloomberg CBK IN Equity Shares (m) 443.0 52-Week Range (INR) 672/349 1,6, 12 Rel.Perf.(%) 22/2/-13 M.Cap. (INR b) 205.6 M.Cap. (USD b) 4.1 31 January 2012 3QFY12 Results
Niket Shah
 BSE Sensex S&P CNX 20,213 6,147 Bloomberg VGRD IN Equity Shares (m) 29.8 M.Cap. (INR b)/(usd b) 14.6/0.3 52-Week Range (INR) 591/180 1,6,12 Rel. Perf. (%) -8/-6/138 Financial summary (INR b) Y/E March
Sanjay Jain Pavas Pethia
 BSE Sensex S&P CNX 19,561 5,923 Bloomberg SAIL IN Equity Shares (m) 4,130.4 M.Cap. (INR b)/(usd b) 334.6/6.2 52-Week Range (INR) 116/76 1,6,12 Rel. Perf. (%) -11/-17/-38 Financials & Valuation (INR b)
Thermax. CMP: INR522 TP: INR414 Neutral
 BSE SENSEX S&P CNX 17,605 5,326 Bloomberg TMX IN Equity Shares (m) 119.2 52-Week Range (INR) 720/388 1,6,12 Rel. Perf. (%) 14/1/-21 M.Cap. (INR b) 60.3 M.Cap. (USD b) 1.1 3 February 2012 3QFY12 Results
Godawari Power & Ispat
 BSE SENSEX S&P CNX CMP: INR103 TP: INR185 Buy 17,077 5,158 Bloomberg GODPI IN Equity Shares (m) 31.8 52-Week Range (INR) 200/70 1,6,12 Rel. Perf. (%) 32/-31/-33 M.Cap. (INR b) 3.3 M.Cap. (USD m) 65.3 Consolidated
Jubilant Foodworks. CMP: INR1,051 TP: INR1,054 Neutral
 BSE SENSEX S&P CNX 16,420 4,966 Bloomberg JUBI IN Equity Shares (m) 63.5 52-Week Range (INR) 1,144/536 1,6,12 Rel. Perf. (%) -6/37/53 M.Cap. (INR b) 66.7 M.Cap. (USD b) 1.3 11 May 2012 4QFY12 Results Update
CMP: INR350 TP: INR375 Downgrade to Neutral
 BSE Sensex S&P CNX 19,497 5,897 Bloomberg COAL IN Equity Shares (m) 6,316.4 M.Cap. (INR b)/(usd b) 2,211/41 52-Week Range (INR) 386/301 1,6,12 Rel. Perf. (%) 1/-11/-5 Financials & Valuation (INR b) Y/E
Steel Authority of India
 BSE SENSEX S&P CNX 16,439 4,990 4QFY12 Results Update Sector: Metals Steel Authority of India CMP: INR93 TP: INR99 Sell Bloomberg SAIL IN Equity Shares (m) 4,130.4 52-Week Range (INR) 151/73 1,6,12 Rel.
Petronet LNG. CMP: INR146 TP: INR205 Buy
 BSE SENSEX S&P CNX 17,236 5,229 Bloomberg PLNG IN Equity Shares (m) 750.0 52-Week Range (INR) 186/122 1,6,12 Rel. Perf. (%) 3/-11/-10 M.Cap. (INR b) 109.7 M.Cap. (USD b) 2.0 1 August 2012 1QFY13 Results
Sohail Halai Alpesh Mehta
 BSE Sensex S&P CNX 20,039 6,064 Bloomberg IDBI IN Equity Shares (m) 1,278.4 M.Cap. (INR b)/(usd b) 144.9/2.7 52-Week Range (INR) 122/82 1,6,12 Rel.Perf.(%) -1/6/2 Financials & Valuation (INR b) Y/E March
Punjab National Bank. CMP: INR768 TP: INR963 Buy
 BSE SENSEX S&P CNX 16,480 4,975 Bloomberg PNB IN Equity Shares (m) 339.2 52-Week Range (INR) 1,200/751 1,6,12 Rel.Perf.(%) -12/-16/-18 M.Cap. (INR b) 260.5 M.Cap. (USD b) 4.8 10 May 2012 4QFY12 Results
Monnet Ispat. CMP: INR449 TP: INR518 Neutral
 4QFY12 Results Update Sector: Metals Monnet Ispat BSE SENSEX S&P CNX 16,328 4,943 CMP: INR449 TP: INR518 Neutral Bloomberg MISP IN Equity Shares (m) 64.4 52-Week Range (INR) 561/305 1,6,12 Rel. Perf. (%)
Strides Arcolab. CMP: INR717 TP: INR829 Buy
 BSE SENSEX S&P CNX 17,144 5,200 Bloomberg STR IN Equity Shares (m) 57.7 52-Week Range (INR) 794/276 1,6,12 Rel. Perf. (%) -2/37/98 M.Cap. (INR b) 41.4 M.Cap. (USD b) 0.7 31 July 2012 2QCY12 Results Update
Tata Power. CMP: INR111 TP: INR92 Neutral
 BSE SENSEX S&P CNX 17,749 5,382 Bloomberg TPWR IN Equity Shares (m) 2,373.3 52-Week Range (INR) 135/81 1,6,12 Rel. Perf. (%) 10/-5/-10 M.Cap. (INR b) 263.9 M.Cap. (USD b) 5.3 13 February 2012 3QFY12 Results
Oberoi Realty. CMP: INR264 TP: INR315 Buy
 BSE SENSEX S&P CNX 17,151 5,202 Bloomberg OBER IN Equity Shares (m) 328.2 52-Week Range (INR) 323/205 1,6,12 Rel. Perf. (%) 4/15/16 M.Cap. (INR b) 87.0 M.Cap. (USD b) 1.7 26 April 2012 4QFY12 Results Update
Punjab National Bank. CMP: INR940 TP: INR1,275 Buy
 BSE SENSEX S&P CNX 17,194 5,199 Bloomberg PNB IN Equity Shares (m) 316.8 52-Week Range (INR) 1,234/751 1,6,12 Rel.Perf.(%) 9/-10/-9 M.Cap. (INR b) 297.7 M.Cap. (USD b) 6.0 1 February 2012 3QFY12 Results
Shree Renuka Sugars. CMP: INR26 TP: INR45 Buy
 BSE SENSEX S&P CNX 16,219 4,924 1 June 2012 6QSY12 Results Update Sector: Sugar CMP: INR26 TP: INR45 Buy Bloomberg SHRS IN Equity Shares (m) 671.0 52-Week Range (INR) 76/23 1,6,12 Rel. Perf. (%) -10/-16/-45
Dabur India. CMP: INR106 TP: INR94 Neutral
 28 July 2011 1QFY12 Results Update Sector: FMCG BSE SENSEX S&P CNX 18,210 5,488 Dabur India CMP: INR106 TP: INR94 Neutral Bloomberg DABUR IN Equity Shares (m) 1,740.0 52-Week Range (INR) 122/87 1,6,12
Hindalco. CMP: INR113 TP: INR151 Buy
 BSE SENSEX S&P CNX 18,817 5,724 Bloomberg HNDL IN Equity Shares (m) 1,990.0 52-Week Range (INR) 165/100 1,6,12 Rel. Perf. (%) -9/-18/-26 M.Cap. (INR b) 224.9 M.Cap. (USD b) 4.1 Consolidated 2QFY13 Results
Kotak Mahindra Bank. CMP: INR626 TP: INR500 Neutral
 BSE SENSEX S&P CNX 18,759 5,705 Bloomberg KMB IN Equity Shares (m) 740.7 52-Week Range (INR) 652/418 1,6,12 Rel.Perf.(%) -3/-2/18 M.Cap. (INR b) 463.4 M.Cap. (USD b) 8.6 26 October 2012 2QFY13 Results
CMP: INR415 TP: INR 471 BUY
 04 Mar 2013 Update Sector: Technology Wipro CMP: INR415 TP: INR 471 BUY Pipeline and deal signings suggest improvement in growth; Multiple levers and focus on productivity will cushion margin headwinds
Idea Cellular. CMP: INR159 TP: INR200 Buy
 BSE SENSEX S&P CNX 19,164 5,678 Bloomberg IDEA IN Equity Shares (m) 3,316.2 M.Cap. (INR b) / (USD b) 513.7/8.4 52-Week Range (INR) 176/72 1, 6, 12 Rel. Per (%) 12/45/83 Financials & Valuation (INR Billion)
Axis Bank. CMP: INR1,008 TP: INR1,240 Buy
 BSE SENSEX S&P CNX 16,739 5,049 Bloomberg AXSB IN Equity Shares (m) 410.5 52-Week Range 1,461/785 1,6,12 Rel.Perf.(%) 11/-9/-9 M.Cap. (INR b) 413.8 M.Cap. (USD b) 8.2 20 January 2012 Results Update Sector:
Axis Bank. CMP: INR1,119 TP: INR1,330 Buy
 BSE SENSEX S&P CNX 18,714 5,687 Bloomberg AXSB IN Equity Shares (m) 413.2 52-Week Range (INR) 1,309/785 1,6,12 Rel.Perf.(%) 9/-16/-8 M.Cap. (INR b) 462.4 M.Cap. (USD b) 8.7 16 October 2012 2QFY13 Results
Sandipan Pal QFY13 Results Update Sector: Real Estate Unitech CMP: INR29 TP: INR44 Buy
 BSE Sensex S&P CNX 19,608 5,933 Bloomberg UT IN Equity Shares (m) 2,438.8 M.Cap. (INR b)/(usd b) 70/1.3 52-Week Range (INR) 41/18 1,6,12 Rel. Perf. (%) -27/24/-13 Financials & Valuation (INR b) Y/E March
Cement. Demand to grow 8%, with cost push to be passed on CCI probe to have limited impact
 15 May 2012 Update Cement Demand to grow 8%, with cost push to be passed on CCI probe to have limited impact We met with senior managements of the large cement companies in India, to get perspective on
Maruti Suzuki. CMP: INR1,395 TP: INR1,730 Buy
 BSE SENSEX S&P CNX 18,431 5,598 Bloomberg MSIL IN Diluted Equity Shares (m) 302.1 52-Week Range (INR) 1,498/906 1,6,12 Rel.Perf.(%) 5/-5/20 M.Cap. (INR b) 421.3 M.Cap. (USD b) 7.8 31 October 2012 2QFY13
Raymond. Restructuring initiatives bearing fruit; Land bank base case value INR147/share; Reiterate Buy. CMP: INR385 TP: INR462 Buy
 14 June 2012 Update Raymond CMP: INR385 TP: INR462 Buy Restructuring initiatives bearing fruit; Land bank base case value INR147/share; Reiterate Buy We met the management of Raymond (RW IN, Mkt Cap USD0.4b,
JSW Steel. CMP: INR670 TP: INR391 Sell Merger with JSW Ispat
 BSE SENSEX S&P CNX 17,384 5,254 Bloomberg JSTL IN Equity Shares (m) 223.1 52-Week Range (INR) 885/464 1,6,12 Rel. Perf. (%) -5/-12/-10 M.Cap. (INR b) 149.5 M.Cap. (USD b) 2.7 Valuation summary (INR b)
Hindustan Unilever. CMP:INR324 TP:INR302 Neutral
 BSE SENSEX S&P CNX 18,197 5,482 29 July 2011 1QFY12 Results Update Sector: FMCG Hindustan Unilever CMP:INR324 TP:INR302 Neutral Bloomberg HUVR IN Equity Shares (m) 2,159.5 52-Week Range (INR) 347/250 1,6,12
Hardick Bora 4QCY12 Results Update Sector: Healthcare Sanofi India CMP: INR2,307 TP: INR2,015 Neutral
 BSE Sensex S&P CNX 19,332 5,855 Bloomberg SANL IN Equity Shares (m) 23.0 M.Cap. (INR b)/(usd b) 53.1/1.0 52-Week Range (INR) 2,450/2,002 1,6,12 Rel. Perf. (%) 9/-1/-4 Financials & Valuation (INR b) Y/E
Godrej Properties. CMP: INR595 TP: INR635 Neutral
 BSE SENSEX S&P CNX 16,913 5,114 Bloomberg GPL IN Equity Shares (m) 78.0 52-Week Range 845/570 1,6,12 Rel. Perf. (%) 0/-9/-2 M.Cap. (INR b) 46.4 M.Cap. (USD b) 0.9 4QFY12 Results Update Sector: Real Estate
Siddharth Bothra
 BSE Sensex S&P CNX 19,152 5,797 Bloomberg CSTRL IN Equity Shares (m) 494.6 M.Cap. (INR b)/(usd b) 158/2.9 52-Week Range (INR) 338/223 1,6,12 Rel. Perf. (%) 12/-3/26 Financials & Valuation (INR b) Y/E March
Dabur India. CMP: INR130 TP: INR135 Neutral
 BSE SENSEX S&P CNX 18,625 5,664 29 October 2012 2QFY13 Results Update Sector: Consumer Dabur India CMP: INR130 TP: INR135 Neutral Bloomberg DABUR IN Equity Shares (m) 1,740.7 52-Week Range (Rs) 139/92
Cross service charges at INR m/quarter
 BSE SENSEX S&P CNX 19,636 5,940 Cummins India CMP: INR504 TP: INR585 Buy LHP products to be an important growth driver Cross service charges at INR100-200m/quarter 20 February 2013 Update Sector: Capital
Jinesh Gandhi Chirag Jain
 BSE Sensex S&P CNX 19,561 5,923 Bloomberg EIM IN Equity Shares (m) 27.0 M.Cap. (INR b)/(usd b) 72.0/1.3 52-Week Range 3,240/1,620 1,6,12 Rel. Perf. (%) -4/17/40 Financials & Valuation (INR b) Y/E Dec 2013E
Jinesh Gandhi Sandipan Pal
 BSE Sensex S&P CNX 20,224 6,157 Bloomberg BCORP IN Equity Shares (m) 77.0 M.Cap. (INR b)/(usd b) 20.5/0.4 52-Week Range (INR) 342/202 1,6,12 Rel. Perf. (%) 6/-15/-23 Financials & Valuation (INR b) Y/E
M&M Financial Services
 BSE SENSEX S&P CNX 18,793 5,717 Bloomberg MMFS IN Equity Shares (m) 102.7 52-Week Range (INR) 938/590 1,6,12 Rel.Perf.(%) 7/24/30 M.Cap. (INR b) 90.7 M.Cap. (USD b) 1.7 23 October 2012 2QFY13 Results Update
Godrej Consumer Products
 BSE SENSEX S&P CNX 18,755 5,698 Bloomberg GCPL IN Equity Shares (m) 340.3 52-Week Range (INR) 745/370 1,6,12 Rel. Perf. (%) 4/17/67 M.Cap. (INR b) 246.4 M.Cap. (USD b) 4.6 5 November 2012 2QFY13 Results
Jaypee Infratech. CMP: INR33 TP: INR45 Buy
 BSE SENSEX S&P CNX 2,550,318 Bloomberg JPIN IN Equity Shares (m) 1,388.9 M.Cap. (INR b) / (USD b) 51.3/0.9 52-Week Range (INR) 2/1 1,, 12 Rel. Per (%) 1/9/-3 Financials & Valuation (INR m) Y/E Mar 201
Sun Pharmaceuticals. CMP: INR554 TP: INR614 Neutral
 BSE SENSEX S&P CNX 17,849 5,416 Bloomberg SUNP IN Equity Shares (m) 1,035.6 52-Week Range (INR) 566/404 1,6,12 Rel. Perf. (%) -3/10/31 M.Cap. (INR b) 573.7 M.Cap. (USD b) 11.6 15 February 2012 3QFY12 Results
Pantaloon Retail. CMP: INR177 TP: INR192 Neutral
 BSE SENSEX S&P CNX 17,773 5,390 Bloomberg PF IN Equity Shares (m) 217.1 52-Week Range (INR) 364/125 1,6,12 Rel. Perf. (%) 9/-49/-29 M.Cap. (Rs b) 38.4 M.Cap. (US$ b) 0.8 14 February 2012 2QFY12 Results
Oberoi Realty. CMP: INR269 TP: INR320 Buy
 BSE SENSEX S&P CNX 18,682 5,684 Bloomberg OBER IN Equity Shares (m) 328.2 52-Week Range (INR) 323/205 1,6,12 Rel. Perf. (%) 13/-7/7 M.Cap. (INR b) 88.3 M.Cap. (USD b) 1.6 22 October 2012 2QFY13 Results
Phoenix Mills. CMP: INR184 TP: INR255 Buy
 BSE SENSEX S&P CNX 16,439 4,990 Bloomberg PHNX IN Equity Shares (m) 144.8 52-Week Range (INR) 229/149 1,6,12 Rel. Perf. (%) -8/-5/10 M.Cap. (INR b) 26.8 M.Cap. (USD b) 0.5 30 May 2012 4QFY12 Results Update
Tribhovandas Bhimji Zaveri
 24 April 2012 Update CMP INR TP INR TRIBHOVANDAS BHIMJI ZAVERI Pure jewellery retail play with strong brand; Execution risks priced in; Subscribe (TBZ) is a pure play on the fast-growing branded jewellery
Urban demand revives; Akzo gaining market share
 BSE Sensex S&P CNX 22,095 6,601 CMP: INR889 26 March 2014 Update Sector: Consumer Not Rated Urban demand revives; Akzo gaining market share Reiterates focus on Profitable growth Urban demand for Decorative
Market share recovery, price hike, content leverage to drive growth
 BSE Sensex S&P CNX 24,377 7,276 Stock Info Bloomberg DITV IN Equity Shares (m) 1,064.8 52-Week Range (INR) 71/40 1, 6, 12 Rel. Per (%) 6/-15/-41 M.Cap. (INR b) 58.2 M.Cap. (USD b) 1.0 Financial Snapshot
CMP: INR401 TP: INR516 Buy. * After ESOP charges; # Axon consolidated in December 2008
 19 October 2011 1QFY12 Results Update Sector: Technology BSE SENSEX S&P CNX 16,748 5,038 Bloomberg HCLT IN Equity Shares (m) 700.9 52-Week Range (INR) 528/360 1,6,12 Rel. Perf. (%) 4/-1/7 M.Cap. (INR b)
Coal India. CMP: INR322 TP: INR370 Buy
 BSE SENSEX S&P CNX 16,439 4,990 Bloomberg COAL IN Equity Shares (m) 6,316.4 52-Week Range (INR) 422/294 1,6,12 Rel. Perf. (%) -4/-3/-7 M.Cap. (INR b) 2,033.9 M.Cap. (USD b) 36.4 30 May 2012 4QFY12 Results
Shriram Transport Finance
 Results Update SECTOR: BANKING STOCK INFO. BSE Sensex: 18,113 S&P CNX: 5,442 BLOOMBERG SHTF IN REUTERS CODE SRTR.BO Equity Shares (m) 225.5 52-Week Range 651/291 1,6,12 Rel.Perf.(%) -1/12/71 M.Cap. (Rs
Maruti Suzuki. CMP:Rs1,327 TP:Rs1,625 Buy
 25 April 2011 4QFY11 Results Update Sector: Automobiles Maruti Suzuki BSE SENSEX S&P CNX 19,584 5,875 Bloomberg MSIL IN Diluted Equity Shares (m) 289.0 52-Week Range (Rs) 1,600/1,126 1,6,12 Rel.Perf.(%)
CPCB-2: Important long-term driver
 BSE Sensex S&P CNX 20,860 6,217 19 December 2013 Update Sector: Capital Goods Cummins India CMP: INR461 TP: INR540 Buy Stock Info Bloomberg KKC IN Equity Shares (m) 277.2 52-Week Range (INR) 550/365 1,
Shree Renuka Sugars. CMP: INR41 TP: INR50 Buy
 BSE SENSEX S&P CNX 18,202 5,532 Bloomberg SHRS IN Equity Shares (m) 671.0 52-Week Range (INR) 87/23 1,6,12 Rel. Perf. (%) 14/-39/-51 M.Cap. (INR b) 27.3 M.Cap. (USD b) 0.6 16 February 2012 5QSY12 Results
Stress test: Weak capital servicing ratios to drive pricing discipline
 Stress test: Weak capital servicing ratios to drive pricing discipline Operating performance near trough; expect gradual improvement 20 Update Cement Our analysis of a cross-section of cement companies
ITC. CMP: INR201 TP: INR230 Buy
 BSE SENSEX S&P CNX 16,739 5,049 Bloomberg ITC IN Equity Shares (m) 7,738.1 52-Week Range (INR) 211/149 1,6,12 Rel. Perf. (%) 3/23/38 M.Cap. (INR b) 1,601.0 M.Cap. (USD b) 32.1 21 January 2012 Results Update
Alpesh Mehta Sohail Halai
 BSE Sensex S&P CNX 19,664 5,969 Bloomberg IIB IN Equity Shares (m) 521.8 M. Cap. (INR b)/(usd b) 227/4.1 52-Week Range (INR) 441/242 1,6,12 Rel.Perf.(%) 3/15/52 Financials & Valuation (INR b) Y/E March
Amara Raja Batteries. CMP: INR517 TP: INR560 Buy
 BSE SENSEX S&P CNX 25,665 7,672 Bloomberg AMRJ IN Equity Shares (m) 170.8 M.Cap. (INR b) / (USD b) 88.2/1.4 52-Week Range (INR) 520/208 1, 6, 12 Rel. Per (%) 5/21/97 Financials & Valuation (INR Million)
Jinesh Gandhi Chirag Jain
 BSE Sensex S&P CNX 19,722 5,995 Bloomberg EIM IN Equity Shares (m) 27.0 M.Cap. (INR b)/(usd b) 88.1/1.6 52-Week Range (INR) 3,285/1,620 1,6,12 Rel. Perf. (%) 10/20/36 Financials & Valuation (INR b) Y/E
Birla Corporation. CMP: INR216 TP: INR277 Buy
 BSE SENSEX S&P CNX 16,839 5,100 Bloomberg BCORP IN Equity Shares (m) 77.0 52-Week Range (INR) 348/211 1,6,12 Rel. Perf. (%) -5/-19/-25 M.Cap. (INR b) 16.6 M.Cap. (USD b) 0.3 30 July 2012 1QFY13 Results
Hardick Bora QFY13 Results Update Sector: Healthcare Lupin CMP: INR725 TP: INR851 Buy
 BSE Sensex S&P CNX 19,990 6,069 Bloomberg LPC IN Equity Shares (m) 447.6 M.Cap. (INR b)/(usd b) 324.5/6.0 52-Week Range (INR) 739/507 1,6,12 Rel. Perf. (%) 9/18/13 Financials & Valuation (INR b) Y/E March
Cummins India. Profitability supported by cost optimization measures. CMP: INR449 TP: INR432 Neutral
 BSE SENSEX S&P CNX 17,618 5,345 Bloomberg KKC IN Equity Shares (m) 277.2 52-Week Range (INR) 506/322 1,6,12 Rel. Perf. (%) -1/16/-1 M.Cap. (INR b) 124.5 M.Cap. (USD b) 2.2 Valuation summary (INR b) Y/E
Godrej Consumer Products
 BSE SENSEX S&P CNX 16,739 5,049 Bloomberg GCPL IN Equity Shares (m) 323.6 52-Week Range (INR) 464/325 1,6,12 Rel. Perf. (%) 3/3/16 M.Cap. (INR b) 135.6 M.Cap. (USD b) 2.7 24 January 2012 3QFY12 Results
Hardick Bora 4QFY13 Results Update Sector: Healthcare Dr Reddy's Laboratories CMP: INR2,026 TP: INR2,375 Buy
 BSE Sensex S&P CNX 19,772 5,995 Bloomberg DRRD IN Equity Shares (m) 169.2 M.Cap. (INR b)/(usd b) 344/6.3 52-Week Range (INR) 2,151/1,528 1,6,12 Rel. Perf. (%) -2/9/0 Financials & Valuation (INR b) Y/E
Shoppers Stop. CMP: INR339 TP: INR355 Neutral
 BSE SENSEX S&P CNX 20,684 6,145 Bloomberg SHOP IN Equity Shares (m) 83.1 M.Cap. (INR b) / (USD b) 28.1/0.5 52-Week Range (INR) 494/331 1, 6, 12 Rel. Per (%) -7/-16/-28 Financials & Valuation (INR b) Y/E
Dabur India. Neutral. Rs93
 3QFY11 Results Update SECTOR: FMCG BSE SENSEX S&P CNX 18,022 5,417 Bloomberg DABUR IN Equity Shares (m) 1,738.0 52-Week Range (Rs) 112/79 1,6,12 Rel. Perf. (%) 5/-5/2 M.Cap. (Rs b) 160.8 M.Cap. (US$ b)
Torrent Pharmaceuticals
 BSE SENSEX S&P CNX 21,338 6,339 Bloomberg TRP IN Equity Shares (m) 169.2 M.Cap. (INR b) / (USD b) 80.4/1.3 52-Week Range (INR) 535/324 1, 6, 12 Rel.Per (%) 4/12/32 Financials & Valuation (INR Million)
Jinesh Gandhi Sandipan Pal
 BSE Sensex S&P CNX 19,576 5,944 Bloomberg GRASIM IN Equity Shares (m) 91.7 M.Cap. (INR b)/(usd b) 270.6/5.0 52-Week Range (INR) 3,511/2,216 1,6,12 Rel. Perf. (%) 2/-17/5 Financials & Valuation (INR b)
Punjab National Bank. CMP: INR760 TP: INR964 Buy Asset quality deteriorates; asset-liability well-matched Highlights of FY12 Annual Report
 BSE SENSEX S&P CNX 16,706 5,064 19 June 2012 Annual Report Update Sector: Financials Punjab National Bank CMP: INR760 TP: INR964 Buy Asset quality deteriorates; asset-liability well-matched Highlights
Godrej Properties. CMP: INR368 TP: INR420 Neutral
 BSE SENSEX S&P CNX 21,034 6,252 Bloomberg GPL IN Equity Shares (m) 99.6 M.Cap. (INR b) / (USD b) 36.4/ 0.7 52-Week Range (INR) 641/340 1, 6, 12 Rel. Per (%) -1/-44/-47 Financials & Valuation (INR b) Y/E
Jinesh Gandhi Sandipan Pal
 BSE Sensex S&P CNX 19,895 6,035 Bloomberg GRASIM IN Equity Shares (m) 91.7 M.Cap. (INR b)/(usd b) 275.8/5.2 52-Week Range (INR) 3,511/2,216 1,6,12 Rel. Perf. (%) -8/-12/-1 Financials & Valuation (INR b)
Reliance Communications
 1QFY11 Results Update SECTOR: TELECOM Reliance Communications STOCK INFO. BSE Sensex: 18,167 S&P CNX: 5,452 BLOOMBERG RCOM IN REUTERS CODE RLCM.BO 13 August 2010 Previous Recommendation: Under Review Buy
Previous Recommendation: Neutral
 2QFY11 Results Update SECTOR: PHARMACEUTICALS STOCK INFO. BSE Sensex: 20,589 S&P CNX: 6,194 BLOOMBERG JOL IN REUTERS CODE JUBO.BO Equity Shares (m) 170.0 52-Week Range 413/255 1,6,12 Rel. Perf. (%) -4/-34/-8
Previous Recommendation: Buy
 2QCY10 Results Update SECTOR: CEMENT ACC STOCK INFO. BSE Sensex: 18,113 S&P CNX: 5,442 BLOOMBERG ACC IN REUTERS CODE ACC.BO Previous Recommendation: Buy Buy Rs816 Equity Shares (m) 187.9 52-Week Range
Just Dial. CMP: INR1,129 TP: INR1,475 Buy
 BSE SENSEX S&P CNX 23,871 7,109 Bloomberg JUST IN Equity Shares (m) 70.2 M.Cap. (INR b) / (USD b) 79.2/1.3 52-Week Range (INR) 1,774/589 1, 6, 12 Rel. Per (%) -18/-7/- Financials & Valuation (INR m) Y/E