CMP: INR826 TP: INR810 (-2%) Neutral
|
|
|
- Claire Wheeler
- 5 years ago
- Views:
Transcription
 2,163.5 52-Week Range (INR) 979/744 1, 6, 12 Rel. Per (%) 7/6/11 M.Cap. (INR b)/(usd b) 1,787.1/26.")
 6.4 7.9 8.8 BV/Sh.(INR) 17.2 16.4 12.9 RoE (%) 108.1 112.4 140.2 RoCE (%) 137.6 148.1 186.2 Payout (%) 85.7 89.5 99.8 Valuations P/E (x) 47.2 43.8 40.2 P/BV (x) 48.0 50.4 63.")
 We interacted with the management of Hindustan Unilever Mr Sanjiv Mehta (CEO &MD) and Mr. P.B.")
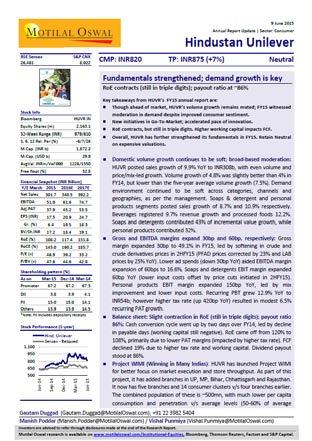
1 8 December 2015 Update Sector: Consumer Hindustan Unilever BSE SENSEX S&P CNX 25,310 7,702 CMP: INR826 TP: INR810 (-2%) Neutral Maneuvering pricing in a deflationary environment Delayed winter a risk for 3Q performance Stock Info Bloomberg HUVR IN Equity Shares (m) 2, Week Range (INR) 979/744 1, 6, 12 Rel. Per (%) 7/6/11 M.Cap. (INR b)/(usd b) 1,787.1/26.8 Avg Val ( INR m) 1,427 Free float (%) 32.8 Financials Snapshot (INR b) Y/E March E 2017E Sales EBITDA Adj. PAT Adj. EPS (INR) EPS Gr. (%) BV/Sh.(INR) RoE (%) RoCE (%) Payout (%) Valuations P/E (x) P/BV (x) EV/EBITDA (x) Div. Yield (%) Shareholding pattern (%) As On Sep-15 Jun-15 Sep-14 Promoter DII FII Others FII Includes depository receipts Stock Performance (1-year) We interacted with the management of Hindustan Unilever Mr Sanjiv Mehta (CEO &MD) and Mr. P.B.Balaji (CFO) on the sidelines of IND-AS session, hosted by HUVR. Following are the key takeaways: Flexing the pricing muscle?: HUVR is using pricing power as a tool in the prevailing deflationary environment. Selectively, it is making pricing changes in several categories depending on its market positioning. For example, overall, YTD, HUVR has hiked prices in ~50% of its portfolio and reduced prices for the other half. As per the management, innovation will drive pricing growth in the near term given the largely benign commodity pricing dynamics. Flood disruption in Tamil Nadu + Delayed Winter may impact 3Q16: Though the management did not provide color on the near-term demand environment, it indicated that disruption in Tamil Nadu due to floods could impact performance as the state is an important market for HUVR. Also, we believe delayed commencement of winter will have a bearing on performance of its Personal Care portfolio. Nonetheless, the management remains confident of long-term consumption opportunity and continues to see premiumization in various product categories e.g., Surf Excel is now the largest brand for HUVR in Detergents (earlier Wheel, its mass market offering, was the largest brand). Rural growth = Urban growth: For HUVR, rural consumption trends have incrementally softened reflecting the lagged impact of lower rural wage growth and weak MSP increases. With rural growth now being equal to urban growth, HUVR is gradually driving increased assortment in rural markets to drive mix improvement (category, brand, SKUs and channel). Other takeaways: a) Internal philosophy for consistent profit growth: Volume growth<sales growth<ebit growth<cash profit growth. b) Oral Care: Pepsodent s performance has not seen any material improvement even as Close-Up continues to do well. c) GST: The impact of GST would depend on Revenue Neutral Rate; however, it will certainly provide a level playing field with unorganized players coming under the tax ambit and reduction in operational inefficiencies, which will aid in the ease of doing business. HUVR India AS Class 101: The management had detailed discussion on the new accounting standards to be implemented w.e.f. April 1, These are still provisional and may undergo changes before being actually implemented. Key changes in HUVR s financial reporting as a consequence of new standards are: a) Reclassification of excise duty from the current practice of netting off from gross sales to inclusion in the cost of goods sold. b) Sales Gautam Duggad (Gautam.Duggad@MotilalOswal.com); Manish Poddar (manish.poddar@motilaloswal.com); / Vishal Punmiya (vishal.punmiya@motilaloswal.com) Investors are advised to refer through important disclosures made at the last page of the Research Report. Motilal Oswal research is available on Bloomberg, Thomson Reuters, Factset and S&P Capital.
2 Hindustan Unilever incentive, discounts or rebates will be netted off from revenue as against the current practice of adjusting it in advertising and promotional expenses. c) Dividends would be recognized post the approval from shareholders as against the current practice of creating a provision on the date of announcement. Valuation and view: HUVR s volume growth over last few quarters has been competitive, though in a narrow band of 5-7%. Rural demand pressures and continued deflationary environment are the key near-term risks for HUVR, in our view. Valuations at 40x FY17E EPS are rich, in our view. Maintain Neutral with a target price of INR810 (35x Dec 17 EPS). 8 December
3 Hindustan Unilever Financials and Valuations Income Statement (INR Million) Net Sales 193, , , , , , ,310 Other Oper. Income 3,545 3,808 6,038 6,108 6,351 6,671 7,485 Total Revenue 197, , , , , , ,796 Change (%) COGS 100, , , , , , ,635 Gross Profit 96, , , , , , ,161 Gros Margin (%) Operating Exp 69,790 70,873 83,176 92, , , ,837 % of sales EBIDTA 26,784 32,913 40,038 44,753 51,043 56,872 62,324 Change (%) Margin (%) Depreciation 2,208 2,183 2,360 2,606 2,867 3,069 3,304 Int. and Fin. Charges Other Income - Recurring 2,729 2,783 6,069 6,210 6,184 5,404 5,837 Profit before Taxes 27,302 33,502 43,495 47,997 54,192 59,198 64,848 Change (%) Margin (%) Tax 5,919 7,769 11,518 12,196 16,671 17,760 19,779 Deferred Tax Tax Rate (%) Profit after Taxes 20,992 25,725 31,883 35,553 37,859 40,846 44,421 Change (%) Margin (%) Non-rec. (Exp)/Income 2,068 1,189 6,084 3,122 5, Reported PAT 23,060 26,914 37,967 38,675 43,152 40,846 44,421 Balance Sheet (INR Million) Share Capital 2,160 2,162 2,163 2,163 2,164 2,164 2,164 Reserves 24,436 32,968 24,578 30,608 35,084 33,266 25,796 Net Worth 26,595 35,129 26,740 32,771 37,248 35,430 27,960 Capital Employed 26,595 35,129 26,740 32,771 37,248 35,430 27,960 Gross Block 36,037 35,747 38,793 41,706 44,306 47,306 51,306 Less: Accum. Depn. -13,624-14,169-15,761-17,409-19,731-22,800-26,104 Net Fixed Assets 22,413 21,578 23,032 24,298 24,575 24,506 25,203 Capital WIP 2,166 2,051 2,053 3,121 4,790 4,790 4,790 Investment in Subsidiaries 1,206 1,863 5,480 6,362 6,541 6,541 6,541 Current Investments 11,401 22,519 17,826 24,580 26,238 25,845 27,316 Deferred Charges 2,097 2,142 2,048 1,617 1,960 2,120 2,293 Curr. Assets, L&A 62,345 59,429 64,685 70,007 72,236 75,435 80,648 Inventory 28,108 25,167 25,270 27,475 26,027 30,523 32,483 Account Receivables 9,432 6,790 8,335 8,164 7,829 8,781 10,768 Cash and Bank Balance 16,285 18,300 17,079 22,210 25,376 22,036 28,656 Others 8,520 9,172 14,001 12,158 13,005 14,096 8,741 Curr. Liab. and Prov. 75,031 74,453 88,385 97,214 99, , ,831 Account Payables 38,904 37,826 41,336 49,115 48,515 50,959 57,057 Other Liabilities 28,569 27,981 34,073 30,558 29,828 29,929 34,382 Provisions 7,558 8,646 12,975 17,540 20,749 22,920 27,392 Net Current Assets -12,687-15,024-23,700-27,206-26,857-28,373-38,183 Application of Funds 26,595 35,129 26,740 32,771 37,248 35,430 27,960 E: MOSL Estimates December
4 Hindustan Unilever Financials and Valuations Ratios Basic (INR) EPS Cash EPS BV/Share DPS Payout % Valuation (x) P/E Cash P/E EV/Sales EV/EBITDA P/BV Dividend Yield (%) Return Ratios (%) RoE RoCE Working Capital Ratios Debtor (Days) Asset Turnover (x) Leverage Ratio Debt/Equity (x) Cash Flow Statement (INR Million) OP/(loss) before Tax 27,302 33,502 43,495 47,997 54,192 59,198 64,848 Int./Div. Received -2,729-2,783-6,069-6,210-6,184-5,404-5,837 Depreciation -2,208-2,183-2,360-2,606-2,867-3,069-3,304 Interest Paid Direct Taxes Paid 5,919 7,769 11,518 12,196 16,671 17,760 19,779 (Incr)/Decr in WC 3,605-4,353-7,454-8,638-2,816 1,823-16,430 CF from Operations 31,886 31,939 38,878 42,379 58,828 70,298 59,048 Extraordinary Items 2,068 1,189 6,084 3,122 5, (Incr)/Decr in FA ,048-3,981-4,269-3,000-4,000 Free Cash Flow 32,243 32,344 35,830 38,398 54,558 67,298 55,048 (Pur)/Sale of Investments 16,643-11,775 1,076-7,635-1, ,471 CF from Invest. 19,068-10,182 4,112-8, ,606-5,471 Change in Networth -5, change in equity change in reserves -5, (Incr)/Decr in Debt Dividend Paid -16,420-18,839-46,557-32,730-38,812-42,779-51,892 Others -14,683-1,361 2,144 3,890-16,172-28,367 4,933 CF from Fin. Activity -36,983-19,741-44,212-28,755-54,847-71,032-46,958 Incr/Decr of Cash 13,971 2,016-1,222 5,131 3,166-3,339 6,619 Add: Opening Balance 2,314 16,285 18,300 17,079 22,210 25,376 22,036 Closing Balance 16,285 18,301 17,078 22,210 25,376 22,036 28,656 E: MOSL Estimates 8 December


5 COMPANIES CONSUMER GALLERY COMPANIES SECTOR UPDATES
.")
 is not")
6 Disclosures Hindustan Unilever This document has been prepared by Motilal Oswal Securities Limited (hereinafter referred to as Most) to provide information about the company(ies) and/sector(s), if any, covered in the report and may be distributed by it and/or its affiliated company(ies). This report is for personal information of the selected recipient/s and does not construe to be any investment, legal or taxation advice to you. This research report does not constitute an offer, invitation or inducement to invest in securities or other investments and Motilal Oswal Securities Limited (hereinafter referred as MOSt) is not soliciting any action based upon it. This report is not for public distribution and has been furnished to you solely for your general information and should not be reproduced or redistributed to any other person in any form. This report does not constitute a personal recommendation or take into account the particular investment objectives, financial situations, or needs of individual clients. Before acting on any advice or recommendation in this material, investors should consider whether it is suitable for their particular circumstances and, if necessary, seek professional advice. The price and value of the investments referred to in this material and the income from them may go down as well as up, and investors may realize losses on any investments. Past performance is not a guide for future performance, future returns are not guaranteed and a loss of original capital may occur. MOSt and its affiliates are a full-service, integrated investment banking, investment management, brokerage and financing group. We and our affiliates have investment banking and other business relationships with a some companies covered by our Research Department. Our research professionals may provide input into our investment banking and other business selection processes. Investors should assume that MOSt and/or its affiliates are seeking or will seek investment banking or other business from the company or companies that are the subject of this material and that the research professionals who were involved in preparing this material may educate investors on investments in such business. The research professionals responsible for the preparation of this document may interact with trading desk personnel, sales personnel and other parties for the purpose of gathering, applying and interpreting information. Our research professionals are paid on the profitability of MOSt which may include earnings from investment banking and other business. MOSt generally prohibits its analysts, persons reporting to analysts, and members of their households from maintaining a financial interest in the securities or derivatives of any companies that the analysts cover. Additionally, MOSt generally prohibits its analysts and persons reporting to analysts from serving as an officer, director, or advisory board member of any companies that the analysts cover. Our salespeople, traders, and other professionals or affiliates may provide oral or written market commentary or trading strategies to our clients that reflect opinions that are contrary to the opinions expressed herein, and our proprietary trading and investing businesses may make investment decisions that are inconsistent with the recommendations expressed herein. In reviewing these materials, you should be aware that any or all of the foregoing among other things, may give rise to real or potential conflicts of interest. MOSt and its affiliated company(ies), their directors and employees and their relatives may; (a) from time to time, have a long or short position in, act as principal in, and buy or sell the securities or derivatives thereof of companies mentioned herein. (b) be engaged in any other transaction involving such securities and earn brokerage or other compensation or act as a market maker in the financial instruments of the company(ies) discussed herein or act as an advisor or lender/borrower to such company(ies) or may have any other potential conflict of interests with respect to any recommendation and other related information and opinions.; however the same shall have no bearing whatsoever on the specific recommendations made by the analyst(s), as the recommendations made by the analyst(s) are completely independent of the views of the affiliates of MOSt even though there might exist an inherent conflict of interest in some of the stocks mentioned in the research report Reports based on technical and derivative analysis center on studying charts company's price movement, outstanding positions and trading volume, as opposed to focusing on a company's fundamentals and, as such, may not match with a report on a company's fundamental analysis. In addition MOST has different business segments / Divisions with independent research separated by Chinese walls catering to different set of customers having various objectives, risk profiles, investment horizon, etc, and therefore may at times have different contrary views on stocks sectors and markets. Unauthorized disclosure, use, dissemination or copying (either whole or partial) of this information, is prohibited. The person accessing this information specifically agrees to exempt MOSt or any of its affiliates or employees from, any and all responsibility/liability arising from such misuse and agrees not to hold MOSt or any of its affiliates or employees responsible for any such misuse and further agrees to hold MOSt or any of its affiliates or employees free and harmless from all losses, costs, damages, expenses that may be suffered by the person accessing this information due to any errors and delays. The information contained herein is based on publicly available data or other sources believed to be reliable. Any statements contained in this report attributed to a third party represent MOSt s interpretation of the data, information and/or opinions provided by that third party either publicly or through a subscription service, and such use and interpretation have not been reviewed by the third party. This Report is not intended to be a complete statement or summary of the securities, markets or developments referred to in the document. While we would endeavor to update the information herein on reasonable basis, MOSt and/or its affiliates are under no obligation to update the information. Also there may be regulatory, compliance, or other reasons that may prevent MOSt and/or its affiliates from doing so. MOSt or any of its affiliates or employees shall not be in any way responsible and liable for any loss or damage that may arise to any person from any inadvertent error in the information contained in this report. MOSt or any of its affiliates or employees do not provide, at any time, any express or implied warranty of any kind, regarding any matter pertaining to this report, including without limitation the implied warranties of merchantability, fitness for a particular purpose, and non-infringement. The recipients of this report should rely on their own investigations. This report is intended for distribution to institutional investors. Recipients who are not institutional investors should seek advice of their independent financial advisor prior to taking any investment decision based on this report or for any necessary explanation of its contents. Most and it s associates may have managed or co-managed public offering of securities, may have received compensation for investment banking or merchant banking or brokerage services, may have received any compensation for products or services other than investment banking or merchant banking or brokerage services from the subject company in the past 12 months. Most and it s associates have not received any compensation or other benefits from the subject company or third party in connection with the research report. Subject Company may have been a client of Most or its associates during twelve months preceding the date of distribution of the research report MOSt and/or its affiliates and/or employees may have interests/positions, financial or otherwise of over 1 % at the end of the month immediately preceding the date of publication of the research in the securities mentioned in this report. To enhance transparency, MOSt has incorporated a Disclosure of Interest Statement in this document. This should, however, not be treated as endorsement of the views expressed in the report. Motilal Oswal Securities Limited is registered as a Research Analyst under SEBI (Research Analyst) Regulations, SEBI Reg. No. INH There are no material disciplinary action that been taken by any regulatory authority impacting equity research analysis activities Analyst Certification The views expressed in this research report accurately reflect the personal views of the analyst(s) about the subject securities or issues, and no part of the compensation of the research analyst(s) was, is, or will be directly or indirectly related to the specific recommendations and views expressed by research analyst(s) in this report. The research analysts, strategists, or research associates principally responsible for preparation of MOSt research receive compensation based upon various factors, including quality of research, investor client feedback, stock picking, competitive factors and firm revenues Disclosure of Interest Statement HINDUSTAN UNILEVER Analyst ownership of the stock No Served as an officer, director or employee No A graph of daily closing prices of securities is available at and Regional Disclosures (outside India) This report is not directed or intended for distribution to or use by any person or entity resident in a state, country or any jurisdiction, where such distribution, publication, availability or use would be contrary to law, regulation or which would subject MOSt & its group companies to registration or licensing requirements within such jurisdictions. For U.S. Motilal Oswal Securities Limited (MOSL) is not a registered broker - dealer under the U.S. Securities Exchange Act of 1934, as amended (the"1934 act") and under applicable state laws in the United States. In addition MOSL is not a registered investment adviser under the U.S. Investment Advisers Act of 1940, as amended (the "Advisers Act" and together with the 1934 Act, the "Acts), and under applicable state laws in the United States. Accordingly, in the absence of specific exemption under the Acts, any brokerage and investment services provided by MOSL, including the products and services described herein are not available to or intended for U.S. persons. This report is intended for distribution only to "Major Institutional Investors" as defined by Rule 15a-6(b)(4) of the Exchange Act and interpretations thereof by SEC (henceforth referred to as "major institutional investors"). This document must not be acted on or relied on by persons who are not major institutional investors. Any investment or investment activity to which this document relates is only available to major institutional investors and will be engaged in only with major institutional investors. In reliance on the exemption from registration provided by Rule 15a-6 of the U.S. Securities Exchange Act of 1934, as amended (the "Exchange Act") and interpretations thereof by the U.S. Securities and Exchange Commission ("SEC") in order to conduct business with Institutional Investors based in the U.S., MOSL has entered into a chaperoning agreement with a U.S. registered broker-dealer, Motilal Oswal Securities International Private Limited. ("MOSIPL"). Any business interaction pursuant to this report will have to be executed within the provisions of this chaperoning agreement. The Research Analysts contributing to the report may not be registered /qualified as research analyst with FINRA. Such research analyst may not be associated persons of the U.S. registered broker-dealer, MOSIPL, and therefore, may not be subject to NASD rule 2711 and NYSE Rule 472 restrictions on communication with a subject company, public appearances and trading securities held by a research analyst account. For Singapore Motilal Oswal Capital Markets Singapore Pte Limited is acting as an exempt financial advisor under section 23(1)(f) of the Financial Advisers Act(FAA) read with regulation 17(1)(d) of the Financial Advisors Regulations and is a subsidiary of Motilal Oswal Securities Limited in India. This research is distributed in Singapore by Motilal Oswal Capital Markets Singapore Pte Limited and it is only directed in Singapore to accredited investors, as defined in the Financial Advisers Regulations and the Securities and Futures Act (Chapter 289), as amended from time to time. In respect of any matter arising from or in connection with the research you could contact the following representatives of Motilal Oswal Capital Markets Singapore Pte Limited: Kadambari Balachandran kadambari.balachandran@motilaloswal.com Contact : (+65) / Office Address : 21 (Suite 31),16 Collyer Quay,Singapore Motilal Oswal Securities Ltd Motilal Oswal Tower, Level 9, Sayani Road, Prabhadevi, Mumbai Phone: reports@motilaloswal.com 8 December
CMP: INR859 TP: INR810 (-6%) Neutral
 Neutral") 18 December 2015 Update Sector: Consumer Hindustan Unilever BSE SENSEX S&P CNX 25,519 7,762 CMP: INR859 TP: INR810 (-6%) Neutral Foray into Premium Ayurvedic Hair Oil First Acquisition in a decade Stock
18 December 2015 Update Sector: Consumer Hindustan Unilever BSE SENSEX S&P CNX 25,519 7,762 CMP: INR859 TP: INR810 (-6%) Neutral Foray into Premium Ayurvedic Hair Oil First Acquisition in a decade Stock
CMP: INR320 TP: INR164(-49%) Sell Intending to exit UK execution is key!
 Sell Intending to exit UK execution is key!") 31 March 2016 Update Sector: Metals Tata Steel BSE SENSEX S&P CNX 25,342 7,738 Stock Info Bloomberg TATA IN Equity Shares (m) 971.2 52-Week Range (INR) 384/200 1, 6, 12 Rel. Per (%) 18/54/10 M.Cap. (INR
31 March 2016 Update Sector: Metals Tata Steel BSE SENSEX S&P CNX 25,342 7,738 Stock Info Bloomberg TATA IN Equity Shares (m) 971.2 52-Week Range (INR) 384/200 1, 6, 12 Rel. Per (%) 18/54/10 M.Cap. (INR
Individual Housing Loans: Rationalization of Risk-Weights and LTV Ratios
 8 October 2015 Sector Update Financials Individual Housing Loans: Rationalization of Risk-Weights and LTV Ratios Significant capital release for HFCs; Limited benefits for banks Event: RBI reduces risk
Amara Raja Batteries. CMP: INR517 TP: INR560 Buy
 BSE SENSEX S&P CNX 25,665 7,672 Bloomberg AMRJ IN Equity Shares (m) 170.8 M.Cap. (INR b) / (USD b) 88.2/1.4 52-Week Range (INR) 520/208 1, 6, 12 Rel. Per (%) 5/21/97 Financials & Valuation (INR Million)
Expect capacity-led rerating; maintain Buy
 BSE SENSEX S&P CNX 27,238 8,400 Stock Info Bloomberg SRCM IN Equity Shares (m) 34.8 52-Week Range (INR) 18519/9350 1, 6, 12 Rel. Per (%) -2/-3/32 M.Cap. (INR b) 523.7 M.Cap. (USD b) 7.7 Avg Val, INRm 216.4
Financial integrity intact; FDA resolution the key
 BSE Sensex S&P CNX 25,842 7,843 19 November 2015 Update Sector: Healthcare Dr. Reddy s Lab CMP: INR3,287 TP: INR4,000 (+22%) Buy Stock Info Bloomberg DRRD IN Equity Shares (m) 170.4 M.Cap. (INR b)/(usd
ECOSCOPE. Real GDP growth eases on lower net indirect taxes. The Economy Observer. Real GVA growth exactly as expected
 31 August 2016 ECOSCOPE The Economy Observer Real GDP growth eases on lower net indirect taxes Real GVA growth exactly as expected India s real gross domestic product (GDP) grew at the slowest pace in
CMP: INR1,044 TP: INR970 (-7%) Neutral Sale of Healthcare business margin accretive
 Neutral Sale of Healthcare business margin accretive") BSE SENSEX S&P CNX 24,646 7,485 4 March 2016 Update Sector: Capital Goods Siemens CMP: INR1,044 TP: INR970 (-7%) Neutral Sale of Healthcare business margin accretive Stock Info Bloomberg SIEM IN Equity
BSE SENSEX S&P CNX 24,646 7,485 4 March 2016 Update Sector: Capital Goods Siemens CMP: INR1,044 TP: INR970 (-7%) Neutral Sale of Healthcare business margin accretive Stock Info Bloomberg SIEM IN Equity
CMP: INR2,623 TP: INR2,875 (+10%) Neutral
 Neutral") 21 March 2017 Update Sector: Healthcare Dr Reddy s Labs BSE SENSEX S&P CNX 29,485 9,122 Bloomberg DRRD IN Equity Shares (m) 170.4 M.Cap.(INR b)/(usd b) 447.0 / 6.6 52-Week Range (INR) 3689 / 2602 1, 6,
21 March 2017 Update Sector: Healthcare Dr Reddy s Labs BSE SENSEX S&P CNX 29,485 9,122 Bloomberg DRRD IN Equity Shares (m) 170.4 M.Cap.(INR b)/(usd b) 447.0 / 6.6 52-Week Range (INR) 3689 / 2602 1, 6,
CMP: INR475 TP: INR609 (+28%) Buy
 Buy") 10 April 2017 Update Sector: Automobiles Tata Motors BSE SENSEX S&P CNX 29,576 9,181 Stock Info Bloomberg TTMT IN Equity Shares (m) 3,395.9 52-Week Range (INR) 599 / 373 1, 6, 12 Rel. Per (%) -1/-21/8
10 April 2017 Update Sector: Automobiles Tata Motors BSE SENSEX S&P CNX 29,576 9,181 Stock Info Bloomberg TTMT IN Equity Shares (m) 3,395.9 52-Week Range (INR) 599 / 373 1, 6, 12 Rel. Per (%) -1/-21/8
CMP: INR2,013 TP: INR2,384 (+18%) DBEL to be merged with OCL India
 DBEL to be merged with OCL India") BSE SENSEX S&P CNX 27,459 8,497 CMP: INR2,013 TP: INR2,384 (+18%) DBEL to be merged with OCL India 7 November 2016 Update Sector: Cement Dalmia Bharat Buy Stock Info Bloomberg DBEL IN Equity Shares (m)
BSE SENSEX S&P CNX 27,459 8,497 CMP: INR2,013 TP: INR2,384 (+18%) DBEL to be merged with OCL India 7 November 2016 Update Sector: Cement Dalmia Bharat Buy Stock Info Bloomberg DBEL IN Equity Shares (m)
City Union Bank BUY. 24 February 2016 INR82
 SECTOR: FINANCIAL STOCK INFO. BSE Sensex : 23410 BLOOMBERG CUBK:IN BUY S&P CNX : 7110 REUTERS CODE CTBK.NS Initiating Coverage INR82 (INR CR) Y/E MARCH FY16E FY17E FY18E We recommend 'BUY' on for a target
CMP: INR615 TP: INR755(+23%) Buy Nominee Gold has some new competition on the block
 Buy Nominee Gold has some new competition on the block") BSE SENSEX S&P CNX 25,653 7,861 16 May 2016 Update Sector: Fertilizers PI Industries CMP: INR615 TP: INR755(+23%) Buy Nominee Gold has some new competition on the block We recently interacted with the
BSE SENSEX S&P CNX 25,653 7,861 16 May 2016 Update Sector: Fertilizers PI Industries CMP: INR615 TP: INR755(+23%) Buy Nominee Gold has some new competition on the block We recently interacted with the
Urban demand revives; Akzo gaining market share
 BSE Sensex S&P CNX 22,095 6,601 CMP: INR889 26 March 2014 Update Sector: Consumer Not Rated Urban demand revives; Akzo gaining market share Reiterates focus on Profitable growth Urban demand for Decorative
JSW Steel. CMP: INR670 TP: INR391 Sell Merger with JSW Ispat
 BSE SENSEX S&P CNX 17,384 5,254 Bloomberg JSTL IN Equity Shares (m) 223.1 52-Week Range (INR) 885/464 1,6,12 Rel. Perf. (%) -5/-12/-10 M.Cap. (INR b) 149.5 M.Cap. (USD b) 2.7 Valuation summary (INR b)
To voluntarily stop supplies to US
 BSE Sensex S&P CNX 26,272 7,831 24 July 2014 Update Sector: Healthcare Ipca Laboratories CMP: INR728 TP: INR930 Buy Stock Info Bloomberg IPCA IN Equity Shares (m) 126.2 52-Week Range (INR) 907/609 1, 6,
Hardick Bora
 BSE Sensex S&P CNX 19,990 6,069 Bloomberg JOL IN Equity Shares (m) 159.3 M.Cap. (INR b)/(usd b) 26.0/0.5 52-Week Range (INR) 248/154 1,6,12 Rel. Perf. (%) -18/-28/-34 Financials & Valuation (INR b) Y/E
CMP: INR949 TP: INR1,140 (+20%) Buy
 Buy") BSE SENSEX S&P CNX 26,766 8,204 Stock Info Bloomberg PVRL IN Equity Shares (m) 46.7 52-Week Range (INR) 977/617 1, 6, 12 Rel. Per (%) 3/15/47 M.Cap. (INR b)/ (USD b) 44.3/0.7 Avg Val ( INR m) 157 Free
BSE SENSEX S&P CNX 26,766 8,204 Stock Info Bloomberg PVRL IN Equity Shares (m) 46.7 52-Week Range (INR) 977/617 1, 6, 12 Rel. Per (%) 3/15/47 M.Cap. (INR b)/ (USD b) 44.3/0.7 Avg Val ( INR m) 157 Free
No significant jump in retail electronic payments post demonetization
 No significant jump in retail electronic payments post demonetization Confirms a considerable dent in consumer demand in 4Q2016 29 December 2016 ECOSCOPE The Economy Observer The government s attempts
Jaypee Infratech. CMP: INR33 TP: INR45 Buy
 BSE SENSEX S&P CNX 2,550,318 Bloomberg JPIN IN Equity Shares (m) 1,388.9 M.Cap. (INR b) / (USD b) 51.3/0.9 52-Week Range (INR) 2/1 1,, 12 Rel. Per (%) 1/9/-3 Financials & Valuation (INR m) Y/E Mar 201
Castrol India. CMP: INR407 TP: INR474 (+16%) Neutral
 Neutral") BSE SENSEX S&P CNX 23,089 7,019 Bloomberg CSTRL IN Equity Shares (m) 494.6 M.Cap. (INR b) / (USD b) 201/2.9 52-Week Range (INR) 518 / 370 1, 6, 12 Rel. Per (%) 3/3/6 Avg Val (INR m) 128 Free float (%)
BSE SENSEX S&P CNX 23,089 7,019 Bloomberg CSTRL IN Equity Shares (m) 494.6 M.Cap. (INR b) / (USD b) 201/2.9 52-Week Range (INR) 518 / 370 1, 6, 12 Rel. Per (%) 3/3/6 Avg Val (INR m) 128 Free float (%)
Niket Shah
 BSE Sensex S&P CNX 20,213 6,147 Bloomberg VGRD IN Equity Shares (m) 29.8 M.Cap. (INR b)/(usd b) 14.6/0.3 52-Week Range (INR) 591/180 1,6,12 Rel. Perf. (%) -8/-6/138 Financial summary (INR b) Y/E March
Bata India. CMP: INR415 TP: INR483 (+16%) Upgrade to Buy Aggressive, focused strategy to drive growth. Upgrading to Buy
 Upgrade to Buy Aggressive, focused strategy to drive growth. Upgrading to Buy") BSE SENSEX S&P CNX 26,393 8,143 Stock Info Bloomberg BATA IN Equity Shares (m) 128.5 52-Week Range (INR) 614 / 400 1, 6, 12 Rel. Per (%) -6/-24/-17 M.Cap. (INR b) 53.3 M.Cap. (USD b) 0.8 Avg Val, INRm
BSE SENSEX S&P CNX 26,393 8,143 Stock Info Bloomberg BATA IN Equity Shares (m) 128.5 52-Week Range (INR) 614 / 400 1, 6, 12 Rel. Per (%) -6/-24/-17 M.Cap. (INR b) 53.3 M.Cap. (USD b) 0.8 Avg Val, INRm
No major improvement in value proposition expected
 Sector Update 18 July 2017 Oil & Gas Motilal Oswal values your support in the Asiamoney Brokers Poll 2017 for India Research, Sales and Trading team. We request your ballot. Refer to our report on Oil
Sanjay Jain Pavas Pethia
 BSE Sensex S&P CNX 19,561 5,923 Bloomberg SAIL IN Equity Shares (m) 4,130.4 M.Cap. (INR b)/(usd b) 334.6/6.2 52-Week Range (INR) 116/76 1,6,12 Rel. Perf. (%) -11/-17/-38 Financials & Valuation (INR b)
CMP: INR158 TP: INR199 (+26%) Buy NTPC FY16 annual report analysis
 Buy NTPC FY16 annual report analysis") BSE SENSEX S&P CNX 28,060 8,650 Stock Info Bloomberg NTPC IN Equity Shares (m) 158.0 52-Week Range (INR) 170/112 1, 6, 12 Rel. Per (%) 1/10/24 M.Cap. (INR b) 13449.0 M.Cap. (USD b) 20.1 Avg. Val, INR m
BSE SENSEX S&P CNX 28,060 8,650 Stock Info Bloomberg NTPC IN Equity Shares (m) 158.0 52-Week Range (INR) 170/112 1, 6, 12 Rel. Per (%) 1/10/24 M.Cap. (INR b) 13449.0 M.Cap. (USD b) 20.1 Avg. Val, INR m
ABB India to remain a key sourcing hub
 BSE SENSEX S&P CNX 27,430 8,485 Stock Info Bloomberg IN Equity Shares (m) 211.9 52-Week Range (INR) 1433/963 1, 6, 12 Rel. Per (%) -4/-21/-17 M.Cap. (INR b) 231.0 M.Cap. (USD b) 3.4 Avg Val, INRm 93.6
Sohail Halai Alpesh Mehta
 BSE Sensex S&P CNX 20,039 6,064 Bloomberg IDBI IN Equity Shares (m) 1,278.4 M.Cap. (INR b)/(usd b) 144.9/2.7 52-Week Range (INR) 122/82 1,6,12 Rel.Perf.(%) -1/6/2 Financials & Valuation (INR b) Y/E March
Can Fin Homes BUY. 23 September 2015 INR821
 SECTOR: FINANCIAL Can Fin Homes STOCK INFO. BSE Sensex : 25590 BLOOMBERG CANF:IN BUY S&P CNX : 7812 REUTERS CODE CNFH.NS Re-Initiating Coverage INR821 Y/E MARCH FY15 FY16E (INR CR) FY17E We recommend 'BUY'
SKS Microfinance. CMP: INR478 TP: INR589 (+23%) Buy Clouds of uncertainty cleared. RBI to be the sole regulator of the MFI sector
 Buy Clouds of uncertainty cleared. RBI to be the sole regulator of the MFI sector") BSE SENSEX S&P CNX 24,188 7,351 Stock Info Bloomberg SKSM IN Equity Shares (m) 126.3 52-Week Range (INR) 590 / 369 1, 6, 12 Rel. Per (%) 5/5/16 M.Cap. (INR b)/(usd b) 61.1/0.9 12M Avg Val (INR M) 868 Free
BSE SENSEX S&P CNX 24,188 7,351 Stock Info Bloomberg SKSM IN Equity Shares (m) 126.3 52-Week Range (INR) 590 / 369 1, 6, 12 Rel. Per (%) 5/5/16 M.Cap. (INR b)/(usd b) 61.1/0.9 12M Avg Val (INR M) 868 Free
REPORT THREADBARE. New accounting standards from FY The ART of annual report analysis
 23 February 2015 ANNUAL New accounting standards from FY16-17 Financial reporting set for revamp with introduction of Ind-AS The Government has unveiled a roadmap to implement Ind-AS (equivalent IFRS standards)
CMP: INR113 TP: INR180(+59%) Buy Some pricing pressure, but fundamentals are strong
 Buy Some pricing pressure, but fundamentals are strong") 6 July 2017 Update Sector: Metals NMDC BSE SENSEX S&P CNX 31,246 9,638 Motilal Oswal values your support in the Asiamoney Brokers Poll 2017 for India Research, Sales and Trading team. We request your ballot.
6 July 2017 Update Sector: Metals NMDC BSE SENSEX S&P CNX 31,246 9,638 Motilal Oswal values your support in the Asiamoney Brokers Poll 2017 for India Research, Sales and Trading team. We request your ballot.
Widening the moat. CMP: INR3,353 TP: INR3,870 (+15%) Buy
 Buy") BSE Sensex S&P CNX 27,990 8,633 23 August 2016 Update Sector: Consumer Britannia Industries CMP: INR3,353 TP: INR3,870 (+15%) Buy Widening the moat Stock Info Bloomberg BRIT IN Equity Shares (m) 119.9
BSE Sensex S&P CNX 27,990 8,633 23 August 2016 Update Sector: Consumer Britannia Industries CMP: INR3,353 TP: INR3,870 (+15%) Buy Widening the moat Stock Info Bloomberg BRIT IN Equity Shares (m) 119.9
CMP: INR830 TP: INR1,040(+25%) Buy Driving value through simplification
 Buy Driving value through simplification") BSE SENSEX S&P CNX 30,435 9,429 18 May 2017 Update Sector: Utilities CMP: INR830 TP: INR1,040(+25%) Buy Driving value through simplification Stock Info Bloomberg IN Equity Shares (m) 133.2 52-Week Range
BSE SENSEX S&P CNX 30,435 9,429 18 May 2017 Update Sector: Utilities CMP: INR830 TP: INR1,040(+25%) Buy Driving value through simplification Stock Info Bloomberg IN Equity Shares (m) 133.2 52-Week Range
Shoppers Stop. CMP: INR339 TP: INR355 Neutral
 BSE SENSEX S&P CNX 20,684 6,145 Bloomberg SHOP IN Equity Shares (m) 83.1 M.Cap. (INR b) / (USD b) 28.1/0.5 52-Week Range (INR) 494/331 1, 6, 12 Rel. Per (%) -7/-16/-28 Financials & Valuation (INR b) Y/E
CPCB-2: Important long-term driver
 BSE Sensex S&P CNX 20,860 6,217 19 December 2013 Update Sector: Capital Goods Cummins India CMP: INR461 TP: INR540 Buy Stock Info Bloomberg KKC IN Equity Shares (m) 277.2 52-Week Range (INR) 550/365 1,
JSW Energy. CMP: INR59 TP: INR84 (+42%) Buy Valuations heavily discounting merchant capacities
 Buy Valuations heavily discounting merchant capacities") BSE SENSEX S&P CNX 26,653 8,225 Stock Info Bloomberg JSW IN Equity Shares (m) 1640 52-Week Range (INR) 88 / 54 1, 6, 12 Rel. Per (%) -6/-14/-34 M.Cap. (INR b) 109.9 M.Cap. (USD b) 1.6 Avg Val, INRm 223
BSE SENSEX S&P CNX 26,653 8,225 Stock Info Bloomberg JSW IN Equity Shares (m) 1640 52-Week Range (INR) 88 / 54 1, 6, 12 Rel. Per (%) -6/-14/-34 M.Cap. (INR b) 109.9 M.Cap. (USD b) 1.6 Avg Val, INRm 223
Cross service charges at INR m/quarter
 BSE SENSEX S&P CNX 19,636 5,940 Cummins India CMP: INR504 TP: INR585 Buy LHP products to be an important growth driver Cross service charges at INR100-200m/quarter 20 February 2013 Update Sector: Capital
Decent performance by the sector in a tough quarter
 Sector Update 17 February 2017 Cement MOSL Cement Universe volume (mt) trend Volume (mt) 3QFY17 YoY 5.5-9% 11.4-1% 1.7-11% 2.4 21% 4.9 3.6 20% 1.9-1.8 2.0 2 1.3 19% Volumes in Jan-17 revive to pre-demonetization
Titan Industries. CMP: INR222 TP: INR220 Neutral
 BSE SENSEX S&P CNX 17,257 5,241 Bloomberg TTAN IN Equity Shares (m) 887.8 52-Week Range (INR) 255/154 1,6,12 Rel. Perf. (%) -1/13/3 M.Cap. (Rs b) 197.1 M.Cap. (US$ b) 3.6 2 August 2012 1QFY13 Results Update
Demand trends bottoming out
 BSE SENSEX S&P CNX 28,975 8,755 Bloomberg JUBI IN Equity Shares (m) 65.3 M.Cap. (INR b) / 104/1.7 ( 52-Week b) Range 1,695/939 ( ) 1, 6, 12 Rel. Per (%) 16/12/12 Avg Val (INR M)/Vol 328/262 Free float
CMP: INR388 TP: INR465(+20%) Buy
 Buy") BSE SENSEX S&P CNX 30,858 9,504 29 June 2017 Update Sector: Technology Tech Mahindra CMP: INR388 TP: INR465(+20%) Buy Steeper-than-anticipated challenges at the start of the year Revenue headwinds to add
BSE SENSEX S&P CNX 30,858 9,504 29 June 2017 Update Sector: Technology Tech Mahindra CMP: INR388 TP: INR465(+20%) Buy Steeper-than-anticipated challenges at the start of the year Revenue headwinds to add
ECOSCOPE. 3QFY16 CAD/GDP corrects to 1.3% The Economy Observer. Balance of Payments. See surplus in 4Q and to remain low in FY17; INR to correct still
 3QFY16 CAD/GDP corrects to 1.3% See surplus in 4Q and to remain low in FY17; INR to correct still 21 March 216 ECOSCOPE The Economy Observer Balance of Payments 3QFY16 CAD/GDP at 1.3% and trade deficit
CMP: INR158 TP: INR195 (+24%) Buy Lowering crude oil price estimates
 Buy Lowering crude oil price estimates") BSE SENSEX S&P CNX 30,858 9,504 Stock Info Bloomberg ONGC IN Equity Shares (m) 12,833 52-Week Range (INR) 212 / 141 1, 6, 12 Rel. Per (%) -9/-33/-5 M.Cap. (INR b) 2,335.7 M.Cap. (USD b) 34.4 Avg Val, INRm
BSE SENSEX S&P CNX 30,858 9,504 Stock Info Bloomberg ONGC IN Equity Shares (m) 12,833 52-Week Range (INR) 212 / 141 1, 6, 12 Rel. Per (%) -9/-33/-5 M.Cap. (INR b) 2,335.7 M.Cap. (USD b) 34.4 Avg Val, INRm
CMP: INR350 TP: INR375 Downgrade to Neutral
 BSE Sensex S&P CNX 19,497 5,897 Bloomberg COAL IN Equity Shares (m) 6,316.4 M.Cap. (INR b)/(usd b) 2,211/41 52-Week Range (INR) 386/301 1,6,12 Rel. Perf. (%) 1/-11/-5 Financials & Valuation (INR b) Y/E
Market share recovery, price hike, content leverage to drive growth
 BSE Sensex S&P CNX 24,377 7,276 Stock Info Bloomberg DITV IN Equity Shares (m) 1,064.8 52-Week Range (INR) 71/40 1, 6, 12 Rel. Per (%) 6/-15/-41 M.Cap. (INR b) 58.2 M.Cap. (USD b) 1.0 Financial Snapshot
CMP: INR164 TP: INR198(+21%) Buy Project commissioning augurs well for capitalization
 Buy Project commissioning augurs well for capitalization") 12 July 2017 Update Sector: Utilities NTPC BSE SENSEX S&P CNX 31,805 9,816 Motilal Oswal values your support in the Asiamoney Brokers Poll 2017 for India Research, Sales and Trading team. We request your
12 July 2017 Update Sector: Utilities NTPC BSE SENSEX S&P CNX 31,805 9,816 Motilal Oswal values your support in the Asiamoney Brokers Poll 2017 for India Research, Sales and Trading team. We request your
Hardick Bora 4QCY12 Results Update Sector: Healthcare Sanofi India CMP: INR2,307 TP: INR2,015 Neutral
 BSE Sensex S&P CNX 19,332 5,855 Bloomberg SANL IN Equity Shares (m) 23.0 M.Cap. (INR b)/(usd b) 53.1/1.0 52-Week Range (INR) 2,450/2,002 1,6,12 Rel. Perf. (%) 9/-1/-4 Financials & Valuation (INR b) Y/E
Sylvania sales a positive
 14 December 2015 Update Sector: Capital Goods Havells India BSE Sensex S&P CNX 25,150 7,650 Stock Info Bloomberg HAVL IN Equity Shares (m) 623.9 M.Cap. (INR b)/(usd b) 189/2.8 52-Week Range (INR) 316/236
Jubilant Foodworks. CMP: INR1,189 TP: INR1,0541,054 Neutral
 BSE SENSEX S&P CNX 16,846 5,110 Bloomberg JUBI IN Equity Shares (m) 63.5 52-Week Range (INR) 1,189/633 1,6,12 Rel. Perf. (%) 4/38/47 M.Cap. (INR b) 75.5 M.Cap. (USD b) 1.3 26 July 2012 1QFY13 Results Update
Stress test: Weak capital servicing ratios to drive pricing discipline
 Stress test: Weak capital servicing ratios to drive pricing discipline Operating performance near trough; expect gradual improvement 20 Update Cement Our analysis of a cross-section of cement companies
Dispatches impacted by destocking at power plants
 BSE Sensex S&P CNX 28,532 8,810 2 September 2016 Update Sector: Utilities Coal India CMP: INR333 TP: INR370 (+11) Buy Stock Info Bloomberg COAL IN Equity Shares (m) 6,316.4 52-Week Range (INR) 9/272 1,
Siddharth Bothra
 BSE Sensex S&P CNX 19,152 5,797 Bloomberg CSTRL IN Equity Shares (m) 494.6 M.Cap. (INR b)/(usd b) 158/2.9 52-Week Range (INR) 338/223 1,6,12 Rel. Perf. (%) 12/-3/26 Financials & Valuation (INR b) Y/E March
ULTRAMARINE & PIGMENTS LTD
 02 December 2016 ULTRAMARINE & PIGMENTS LTD CMP INR 170 Initiating Coverage (BUY) Target Price INR 226 Stock Details Industry SPECIALTY CHEMICALS Bloomberg Code UMP:IN BSE Code 506685 Face Value (Rs.)
Dr Urjit Patel to maintain continuity of monetary policy stance
 Dr Urjit Patel to maintain continuity of monetary policy stance Appointment helps retain government s credibility to fight against inflation 22 August 2016 ECOSCOPE The Economy Observer The government
Pidilite Industries. CMP: INR164 TP: INR186 Buy
 BSE SENSEX S&P CNX 16,640 5,043 Bloomberg PIDI IN Equity Shares (m) 506.1 52-Week Range (INR) 188/134 1,6,12 Rel. Perf. (%) 1/20/5 M.Cap. (INR b) 83.0 M.Cap. (USD b) 1.5 27 July 2012 1QFY13 Results Update
SHRIRAM TRANSPORT FINANCE COMPANY LTD
 27 June 2017 SHRIRAM TRANSPORT FINANCE COMPANY LTD CMP INR 975 Initiating Coverage (BUY) Target Price INR 1225 Stock Details Industry Finance (including NBFCs) Bloomberg Code SHTF:IN BSE Code 511218 Face
Just Dial. CMP: INR1,129 TP: INR1,475 Buy
 BSE SENSEX S&P CNX 23,871 7,109 Bloomberg JUST IN Equity Shares (m) 70.2 M.Cap. (INR b) / (USD b) 79.2/1.3 52-Week Range (INR) 1,774/589 1, 6, 12 Rel. Per (%) -18/-7/- Financials & Valuation (INR m) Y/E
Century Plyboards (I) Limited
 Limited") ANTIQUE STOCK BROKING LIMITED 2 November 2017 1 Current Reco Previous Reco CMP Basudeb Banerjee +91 22 4031 3443 basudeb.banerjee@antiquelimited.com Market data Sensex : 33,600 Sector : Mid Cap Market
ANTIQUE STOCK BROKING LIMITED 2 November 2017 1 Current Reco Previous Reco CMP Basudeb Banerjee +91 22 4031 3443 basudeb.banerjee@antiquelimited.com Market data Sensex : 33,600 Sector : Mid Cap Market
Asian Paints. Valuations no longer euphoric; upgrade to Buy. CMP: INR729 TP: INR840 (+15%) Upgrade to Buy
 Upgrade to Buy") BSE SENSEX S&P CNX 27,116 8,175 Bloomberg APNT IN Equity Shares (m) 959.2 M.Cap. (INR b) / (USD b) 699.3/11.0 52-Week Range (INR) 923/551 1, 6, 12 Rel. Per (%) -3/-5/24 Avg Val(INRm)/Vol 000 1081/1464
BSE SENSEX S&P CNX 27,116 8,175 Bloomberg APNT IN Equity Shares (m) 959.2 M.Cap. (INR b) / (USD b) 699.3/11.0 52-Week Range (INR) 923/551 1, 6, 12 Rel. Per (%) -3/-5/24 Avg Val(INRm)/Vol 000 1081/1464
PVR Ltd. CMP: INR685 TP: INR750 Buy
 BSE SENSEX S&P CNX 27,860 8,324 Bloomberg PVRL IN Equity Shares (m) 41.3 M.Cap. (INR b) / (USD b) 28.3/0.5 52-Week Range (INR) 747/465 1, 6, 12 Rel. Per (%) -6/9/-19 Financials & Valuation (INR Million)
Proposed quality order can contain imports. These measures can at best protect downside risk to estimates. 16 December
 Sector Update 16 Metals December Update 2015 Metals Steel Please see our sector report dated 11 December 2015 Proposed quality order can contain imports These measures can at best protect downside risk
Jinesh Gandhi Chirag Jain
 BSE Sensex S&P CNX 19,561 5,923 Bloomberg EIM IN Equity Shares (m) 27.0 M.Cap. (INR b)/(usd b) 72.0/1.3 52-Week Range 3,240/1,620 1,6,12 Rel. Perf. (%) -4/17/40 Financials & Valuation (INR b) Y/E Dec 2013E
CMP: INR124 TP: INR172 Buy. Benefit of two major motorcycle launches not priced in. Improved industry outlook and recent launch success drive upgrades
 BSE Sensex S&P CNX 24,717 7,359 Stock Info Bloomberg TVSL IN Equity Shares (m) 475.1 52-Week Range (INR) 138/28 1, 6, 12 Rel. Per (%) 34/111/210 M.Cap. (INR b) 59.1 M.Cap. (USD b) 1.0 Financial Snapshot
KNR CONSTRUCTIONS LTD
 14 June 2017 KNR CONSTRUCTIONS LTD CMP INR 210 Initiating Coverage (BUY) Target Price INR 242 Stock Details Industry Construction & Engineering Bloomberg Code KNRC:IN BSE Code 532942 Face Value (Rs.) 2.00
Canara Bank. CMP: INR419 TP: INR525 Buy
 BSE SENSEX S&P CNX 18,817 5,724 Bloomberg CBK IN Equity Shares (m) 443.0 52-Week Range (INR) 566/349 1,6, 12 Rel.Perf.(%) -7/-18/-17 M.Cap. (INR b) 170.3 M.Cap. (USD b) 3.0 7 November 2012 2QFY13 Results
April 2017: Off-take growth remains strong
 BSE Sensex S&P CNX 29,9 9,3 2 May 17 Update Sector: Utilities Coal India CMP: INR275 TP: INR3 (+%) Buy April 17: Off-take growth remains strong E-auction realization impacted by weaker mix in March 17
CMP: INR6,183 TP: INR5,750 (-7%) Neutral Will a new Nestle emerge from the Maggi crisis?
 Neutral Will a new Nestle emerge from the Maggi crisis?") 23 November 2015 Update Sector: Consumer Nestle India BSE SENSEX S&P CNX 25,868 7,857 Stock Info Bloomberg NEST IN Equity Shares (m) 96.4 52-Week Range (INR) 7,500/5,499 1, 6, 12 Rel. Per (%) 0/-4/8 M.Cap.
23 November 2015 Update Sector: Consumer Nestle India BSE SENSEX S&P CNX 25,868 7,857 Stock Info Bloomberg NEST IN Equity Shares (m) 96.4 52-Week Range (INR) 7,500/5,499 1, 6, 12 Rel. Per (%) 0/-4/8 M.Cap.
Sanofi India. CMP: INR2,200 TP: INR1,848 Neutral
 BSE SENSEX S&P CNX 16,846 5,110 Bloomberg SANL IN Equity Shares (m) 23.0 52-Week Range (INR) 2,430/1,980 1,6,12 Rel. Perf. (%) 3/-3/15 M.Cap. (INR b) 50.7 M.Cap. (USD b) 0.9 26 July 2012 2QCY12 Results
Zee Entertainment. CMP: INR535 TP: INR610 (+14%) Buy. Attempts to fix hole in the ship via sports assets sale
 Buy. Attempts to fix hole in the ship via sports assets sale") BSE SENSEX S&P CNX 28, 423 8,775 Stock Info Bloomberg Z IN Equity Shares (m) 960.4 M.Cap. (INR b)/(usd b) 371.7/5.8 52-Week Range (INR) 402 / 265 52-Week Range (INR) 545 / 350 1, 6, 12 Rel. Per (%) 5/20/33
BSE SENSEX S&P CNX 28, 423 8,775 Stock Info Bloomberg Z IN Equity Shares (m) 960.4 M.Cap. (INR b)/(usd b) 371.7/5.8 52-Week Range (INR) 402 / 265 52-Week Range (INR) 545 / 350 1, 6, 12 Rel. Per (%) 5/20/33
CMP: INR855 TP: INR980(+14%) Neutral
 Neutral") BSE SENSEX S&P CNX 24,492 7,438 Bloomberg CLGT IN Equity Shares (m) 272.0 M.Cap.(INRb)/(USDb) 232.5 / 3.4 52-Week Range (INR) 1099 / 852 1, 6, 12 Rel. Per (%) -8/-6/6 12M Avg Val (INR M) 376 Free float
BSE SENSEX S&P CNX 24,492 7,438 Bloomberg CLGT IN Equity Shares (m) 272.0 M.Cap.(INRb)/(USDb) 232.5 / 3.4 52-Week Range (INR) 1099 / 852 1, 6, 12 Rel. Per (%) -8/-6/6 12M Avg Val (INR M) 376 Free float
INDIAN TONERS & DEVELOPERS LTD
 29 March 2017 INDIAN TONERS & DEVELOPERS LTD CMP INR 160 Initiating Coverage (BUY) Target Price INR 220 Stock Details Industry SPECIALTY CHEMICALS Bloomberg Code INTD:IN BSE Code 523586 Face Value (Rs.)
Idea Cellular. CMP: INR159 TP: INR200 Buy
 BSE SENSEX S&P CNX 19,164 5,678 Bloomberg IDEA IN Equity Shares (m) 3,316.2 M.Cap. (INR b) / (USD b) 513.7/8.4 52-Week Range (INR) 176/72 1, 6, 12 Rel. Per (%) 12/45/83 Financials & Valuation (INR Billion)
CMP: INR270 TP: INR335(+24%) Buy Takes price hike disguised as evacuation charges
 Buy Takes price hike disguised as evacuation charges") BSE SENSEX S&P CNX 33,777 10,444 Stock Info Bloomberg COAL IN Equity Shares (m) 6,207 52-Week Range (INR) 332/234 1, 6, 12 Rel. Per (%) -2/2/-36 M.Cap. (INR b) 1,673.5 M.Cap. (USD b) 26.1 Avg Val, INRm
BSE SENSEX S&P CNX 33,777 10,444 Stock Info Bloomberg COAL IN Equity Shares (m) 6,207 52-Week Range (INR) 332/234 1, 6, 12 Rel. Per (%) -2/2/-36 M.Cap. (INR b) 1,673.5 M.Cap. (USD b) 26.1 Avg Val, INRm
BGR Energy. CMP: INR282 TP: INR253 Neutral
 BSE SENSEX S&P CNX 17,413 5,283 Bloomberg BGRL IN Equity Shares (m) 72.0 52-Week Range (INR) 378/173 1,6,12 Rel. Perf. (%) -9/17/-22 M.Cap. (INR b) 20.3 M.Cap. (USD b) 0.4 6 August 2012 1QFY13 Results
Gujarat Pipavav Port. CMP: INR162 TP: INR212 (31%) Buy
 Buy") BSE SENSEX S&P CNX 26,838 8,112 Bloomberg GPPV IN Equity Shares (m) 483.4 M.Cap. INR b /USD b 162.3/2.5 52-Week Range (INR) 262/156 1, 6, 12 Rel. Per (%) -15/-26/3 Avg Val INRm 248 Free float (%) 57.0
BSE SENSEX S&P CNX 26,838 8,112 Bloomberg GPPV IN Equity Shares (m) 483.4 M.Cap. INR b /USD b 162.3/2.5 52-Week Range (INR) 262/156 1, 6, 12 Rel. Per (%) -15/-26/3 Avg Val INRm 248 Free float (%) 57.0
BGR Energy. CMP: INR266 TP: INR230 Neutral
 BSE SENSEX S&P CNX 18,562 5,645 Bloomberg BGRL IN Equity Shares (m) 72.0 52-Week Range (INR) 374/173 1,6,12 Rel. Perf. (%) -3/27/-24 M.Cap. (INR b) 19.2 M.Cap. (USD b) 0.4 3 November 2012 2QFY13 Results
Birla Corporation. CMP: INR484 TP: INR590 (+22%) Buy
 Buy") BSE SENSEX S&P CNX 28,851 8,712 Bloomberg BCORP IN Equity Shares (m) 77.0 M.Cap. (INR b) / (USD b) 37.3/0.6 52-Week Range (INR) 615/226 1, 6, 12 Rel. Per (%) 1/5/64 Avg Val (INRm)/Vol 000 34/72 Free float
BSE SENSEX S&P CNX 28,851 8,712 Bloomberg BCORP IN Equity Shares (m) 77.0 M.Cap. (INR b) / (USD b) 37.3/0.6 52-Week Range (INR) 615/226 1, 6, 12 Rel. Per (%) 1/5/64 Avg Val (INRm)/Vol 000 34/72 Free float
Oil & Gas. India FY16 POL consumption growth at 8 year high of 11% Petroleum, oil and lubricants (POL) consumption grows at double digits
 consumption grows at double digits") 13 April 2016 India POL consumption growth at 8 year high of 11% Except kerosene, all products grew at 8-25%; Gasoline/diesel at 14.5%/7.5% Petroleum, oil and lubricants (POL) consumption grows at double
13 April 2016 India POL consumption growth at 8 year high of 11% Except kerosene, all products grew at 8-25%; Gasoline/diesel at 14.5%/7.5% Petroleum, oil and lubricants (POL) consumption grows at double
Ground Reality. Channel check: VOLT maintains pole position in ACs. VOLTAS Sector: Capital Goods
 Channel check: VOLT maintains pole position in ACs Premiumization to increase ASPs; competitive intensity elevated 7 April 2015 VOLTAS Sector: Capital Goods Ground Reality BSE Sensex S&P CNX 28,504 8,660
CMP: INR473 TP: INR545(+15%) Buy Mega merger on the anvil
 Buy Mega merger on the anvil") BSE SENSEX S&P CNX 26,626 8,170 Stock Info Bloomberg MAXF IN Equity Shares (m) 267.0 52-Week Range (INR) 514/303 1, 6, 12 Rel. Per (%) 22/14/24 M.Cap. (INR b) 126.2 M.Cap. (USD b) 1.9 Avg Val ( INRm) 170
BSE SENSEX S&P CNX 26,626 8,170 Stock Info Bloomberg MAXF IN Equity Shares (m) 267.0 52-Week Range (INR) 514/303 1, 6, 12 Rel. Per (%) 22/14/24 M.Cap. (INR b) 126.2 M.Cap. (USD b) 1.9 Avg Val ( INRm) 170
Godrej Consumer Products
 BSE SENSEX S&P CNX 17,602 5,337 Bloomberg GCPL IN Equity Shares (m) 340.3 52-Week Range (INR) 658/370 1,6,12 Rel. Perf. (%) 5/37/42 M.Cap. (INR b) 205.9 M.Cap. (USD b) 3.7 7 August 2012 1QFY13 Results
Jindal Steel & Power. CMP: INR274 TP: INR379 Buy
 BSE SENSEX S&P CNX 25,665 7,672 Bloomberg JSP IN Equity Shares (m) 914.9 M.Cap. (INR b) / (USD b) 250.9/4.1 52-Week Range (INR) 350/190 1, 6, 12 Rel. Per (%) -15/-14/3 Financials & Valuation (INR Billion)
NTPC CMP: INR169 TP: INR191 Buy
 BSE SENSEX S&P CNX 18,625 5,664 Bloomberg NTPC IN Equity Shares (m) 8,245.5 52-Week Range (INR) 190/139 1,6,12 Rel. Perf. (%) 3/-4/-11 M.Cap. (INR b) 1,393.5 M.Cap. (USD b) 26.0 26 October 2012 2QFY13
CMP: INR865 TP: INR1,015 (+17%) Buy Building blocks for strong growth
 Buy Building blocks for strong growth") BSE SENSEX S&P CNX 29,647 9,174 Stock Info Bloomberg KMB IN Equity Shares (m) 1,840 52-Week Range (INR) 885 / 656 1, 6, 12 Rel. Per (%) 5/5/10 M.Cap. (INR b) 1,580.8 M.Cap. (USD b) 24.4 Avg Val, INRm 1618
BSE SENSEX S&P CNX 29,647 9,174 Stock Info Bloomberg KMB IN Equity Shares (m) 1,840 52-Week Range (INR) 885 / 656 1, 6, 12 Rel. Per (%) 5/5/10 M.Cap. (INR b) 1,580.8 M.Cap. (USD b) 24.4 Avg Val, INRm 1618
Oberoi Realty. CMP: INR240 TP: INR297 Buy
 BSE SENSEX S&P CNX 25,642 7,664 Bloomberg OBER IN Equity Shares (m) 328.2 M.Cap. (INR b) / (USD b) 78.8/1.3 52-Week Range (INR) 276/154 1, 6, 12 Rel. Per (%) -8/-7/-6 Financials & Valuation (INR m) Y/E
Eicher Motors. CMP: INR9,281 TP: INR11,401 Buy
 BSE SENSEX S&P CNX 25,881 7,727 Bloomberg EIM IN Equity Shares (m) 27.1 M.Cap. (INR b) / (USD b) 251.5/4.1 52-Week Range (INR) 9,350/2,975 1, 6, 12 Rel. Per (%) 9/83/144 Financials & Valuation (INR Million)
CMP: INR162 TP: INR225(+39%) Buy
 Buy") 10 February 2016 Q3FY16 Results Update Sector: Real Estate BSE SENSEX S&P CNX 23,759 7,216 Bloomberg PEPL IN Equity Shares (m) 375.0 M.Cap.(INRb)/(USDb) 64.0 / 0.9 52-Week Range (INR) 299/166 1, 6, 12
10 February 2016 Q3FY16 Results Update Sector: Real Estate BSE SENSEX S&P CNX 23,759 7,216 Bloomberg PEPL IN Equity Shares (m) 375.0 M.Cap.(INRb)/(USDb) 64.0 / 0.9 52-Week Range (INR) 299/166 1, 6, 12
Torrent Pharmaceuticals
 BSE SENSEX S&P CNX 21,338 6,339 Bloomberg TRP IN Equity Shares (m) 169.2 M.Cap. (INR b) / (USD b) 80.4/1.3 52-Week Range (INR) 535/324 1, 6, 12 Rel.Per (%) 4/12/32 Financials & Valuation (INR Million)
TRIDENT LTD. 21 Sept 2017 CMP INR 101. Initiating Coverage (BUY) Target Price INR 126
 Target Price INR 126") 21 Sept 2017 TRIDENT LTD CMP INR 101 Initiating Coverage (BUY) Target Price INR 126 Stock Details Industry TEXTILES Bloomberg Code TRID:IN BSE Code 521064 Face Value (Rs.) 10.00 Market Cap. (Rs. mn) 52,376.6
21 Sept 2017 TRIDENT LTD CMP INR 101 Initiating Coverage (BUY) Target Price INR 126 Stock Details Industry TEXTILES Bloomberg Code TRID:IN BSE Code 521064 Face Value (Rs.) 10.00 Market Cap. (Rs. mn) 52,376.6
Britannia Industries. CMP: INR546 TP: INR605 Upgrade to Neutral Volume growth bottoms out; Upgrade to Neutral
 BSE SENSEX S&P CNX 19,016 5,783 Bloomberg BRIT IN Equity Shares (m) 119.5 M.Cap. (INR b)/(usd b) 65.2/1.2 52-Week Range (INR) 595/400 1,6,12 Rel. Perf. (%) 3/10/-13 Financials & Valuation (INR b) Y/E March
Asian Paints. CMP: INR2,722 TP: INR3,161 Buy
 BSE SENSEX S&P CNX 16,739 5,049 Bloomberg APNT IN Equity Shares (m) 95.9 52-Week Range (INR) 3,366/2,395 1,6,12 Rel. Perf. (%) -5/-3/14 M.Cap. (INR b) 261.1 M.Cap. (USD b) 4.9 23 January 2012 3QFY12 Results
Monsanto India. CMP: INR2,680 TP: INR3,500 (+30%) Buy
 Buy") BSE SENSEX S&P CNX 26,425 7,983 Bloomberg MCHM IN Equity Shares (m) 17.3 M.Cap. (INR b) / (USD b) 46.3/0.8 52-Week Range (INR) 3756/1700 1, 6, 12 Rel. Per (%) -6/-8/19 Avg Val INRm/Vol 000 149/54 Free
BSE SENSEX S&P CNX 26,425 7,983 Bloomberg MCHM IN Equity Shares (m) 17.3 M.Cap. (INR b) / (USD b) 46.3/0.8 52-Week Range (INR) 3756/1700 1, 6, 12 Rel. Per (%) -6/-8/19 Avg Val INRm/Vol 000 149/54 Free
Coal India CMP: INR348 TP: INR408 Buy
 BSE SENSEX S&P CNX 17,633 5,348 Bloomberg COAL IN Equity Shares (m) 6,316.4 52-Week Range (INR) 404/294 1,6,12 Rel. Perf. (%) -4/4/-15 M.Cap. (INR b) 2,198.1 M.Cap. (USD b) 39.7 14 August 2012 1QFY13 Results
Sandipan Pal QFY13 Results Update Sector: Real Estate Unitech CMP: INR29 TP: INR44 Buy
 BSE Sensex S&P CNX 19,608 5,933 Bloomberg UT IN Equity Shares (m) 2,438.8 M.Cap. (INR b)/(usd b) 70/1.3 52-Week Range (INR) 41/18 1,6,12 Rel. Perf. (%) -27/24/-13 Financials & Valuation (INR b) Y/E March
CMP: INR78 TP: INR88 (+13%) Neutral
 Neutral") BSE SENSEX S&P CNX 23,759 7,216 Bloomberg ICEM IN Equity Shares (m) 307.2 M.Cap.(INRb)/(USDb) 23.9 / 0.4 52-Week Range (INR) 112/64 1, 6, 12 Rel. Per (%) -17/9/1 Avg Val, (INR m) 314 Free float (%) 71.8
BSE SENSEX S&P CNX 23,759 7,216 Bloomberg ICEM IN Equity Shares (m) 307.2 M.Cap.(INRb)/(USDb) 23.9 / 0.4 52-Week Range (INR) 112/64 1, 6, 12 Rel. Per (%) -17/9/1 Avg Val, (INR m) 314 Free float (%) 71.8
CMP: INR1,047 TP: INR1,300 (+24%) Much-awaited SEBI guidelines on options finally out
 Much-awaited SEBI guidelines on options finally out") BSE SENSEX S&P CNX 31,103 9,607 Stock Info Bloomberg MCX IN Equity Shares (m) 51 52-Week Range (INR) 1,420/919 1, 6, 12 Rel. Per (%) -8/-36/-10 M.Cap. (INR b) 53.4 M.Cap. (USD b) 0.8 Avg Val, INRm 485.0
BSE SENSEX S&P CNX 31,103 9,607 Stock Info Bloomberg MCX IN Equity Shares (m) 51 52-Week Range (INR) 1,420/919 1, 6, 12 Rel. Per (%) -8/-36/-10 M.Cap. (INR b) 53.4 M.Cap. (USD b) 0.8 Avg Val, INRm 485.0
IndusInd Bank. CMP: INR345 TP: INR419 Buy
 BSE SENSEX S&P CNX 17,504 5,332 Bloomberg IIB IN Equity Shares (m) 467.7 52-Week Range (INR) 352/222 1,6,12 Rel.Perf.(%) 13/25/34 M.Cap. (INR b) 161.4 M.Cap. (USD b) 3.1 20 April 2012 4QFY12 Results Update
Attractive valuations could be illusory
 Company update Sector: Cement ACC BSE Sensex S&P CNX 28,797 8,867 Stock Info Bloomberg ACC IN Equity Shares (m) 188.0 52-Week Range (INR) 1,738/1,173 1, 6, 12 Rel. Per (%) -4/20/11 M.Cap. (INR b) 310.8
Piyush Goyal, MoS (IC) for Power, Coal, RE & Mining
 for Power, Coal, RE & Mining") 7 September 2016 Utilities Piyush Goyal, MoS (IC) for Power, Coal, RE & Mining Takeaways from CEO track Mr Piyush Goyal Minister of State for Power, Coal & Mining We hosted Mr. Piyush Goyal, Minister of
7 September 2016 Utilities Piyush Goyal, MoS (IC) for Power, Coal, RE & Mining Takeaways from CEO track Mr Piyush Goyal Minister of State for Power, Coal & Mining We hosted Mr. Piyush Goyal, Minister of