SPP PLANNING AND COST ALLOCATION OVERVIEW
|
|
|
- Cathleen Fields
- 6 years ago
- Views:
Transcription
1 Benefit/Cost Ratio Primer 101 for the Regional Allocation Review Task Force August 4, SPP PLANNING AND COST ALLOCATION OVERVIEW 2 1


2 Transmission = 10% Retail Electricity Rates Transmission enables optimal use of our region s diverse generating resources, including coal, natural gas, hydroelectric, nuclear, and wind energy 3 How does SPP decide what and where transmission is needed? Generation Interconnection Studies Dt Determines transmission i upgrades needed dto connect new generation to electric grid Aggregate Transmission Service Studies Determines transmission upgrades needed to transmit energy from new generation to load Shares costs of studies and new transmission Specific transmission studies Integrated Transmission Planning process 4 2


3 Why do we need more transmission? In the past, built least cost transmission to meet local needs 5 Today, proactively building superhighways to benefit region Finding Balance More SPP Today Minimum for Reliable Delivery to Customers Expand Transmission More Transmission Needed Less In nvestment Less Amount of Transmission More Customer Energy Cost 6 3


4 What is congestion? Congestion or bottlenecks happen when you can t get energy to customers along a certain path Desired electricity flows exceed physical capability Congestion caused by: Lack of transmission, often due to load growth Line and generator maintenance outages Unplanned outages such as storms or trees on lines Too much generation pushed to grid in a particular location Preferred energy source located far from customers Results in inability to use least cost electricity to meet demand 7 Congestion prevents access to lower cost generation 500 kv 345 kv 230 kv 161 kv 138 kv 115 kv 69 kv 8 8 4


5 Congestion s Impact on Wholesale Market Prices 9 What is Integrated Transmission Planning? Goal: Design transmission backbone to connect load to the most reasonable generation alternatives Strengthen ties to Eastern and Western Interconnections Improve connections between SPP s east and west regions Horizons: 20, 10, and 4 year 40 years Focus: Regional, integrated with local Resulting in: Comprehensive list of needed projects for SPP region over next 20 years With 40 year financial/economic analysis Underlying Value: Reliability and Economics are inseparable 10 5
6 Integrated Transmission Planning Conceptual ITP20 ITP10 Near Term Increasing Refinement Reducing Uncertainty Narrowing Focus Implementation 11 Integrated Transmission Planning Process Reliability Analysis Annual Near Term plan Identifies potential problems and needed upgrades Coordinates with ITP10, ITP20, Aggregate and Generation Interconnection study processes Economics and Reliability Analysis Analyzes transmissionsystemsystem for 10 year horizon Establishes timing of ITP20 projects Develops 345 kv+ backbone for 20 year horizon Studies broad range of possible futures 12 6
?")
7 Transmission planners consider: What parts of grid need strengthening to keep the lights on? Redundancies necessary to account for a line being out Where is current and future generation located? Where are electricity consumers located? Where on the grid do we frequently see congestion (more traffic than roads can accommodate)? Will laws mandating more renewable energy or a carbon tax impact traffic? How do coal/gas prices impact traffic? People will use more coal if gas prices rise, and vice versa How do regional temperatures impact traffic? If temperature differs across region, one area may need more energy 13 Generation = 60% Retail Electricity Rates Without transmission, we can t deliver this capital-intensive generation to where it s needed across region 14 7


8 Who pays for these transmission projects? Sponsored: Project owner builds and receives credit for use of transmission lines Directly assigned:project owner builds and recovers cost through retail rates Highway/Byway: Most SPP projects paid for under this methodology Voltage Region Pays Local Zone Pays 300 kv and above 100% 0% above 100 kv and below 300 kv 33% 67% 100 kv and below 0% 100% 1515 Projects Constructed


9 Projects with Notifications to Construct 17 Balanced Portfolio


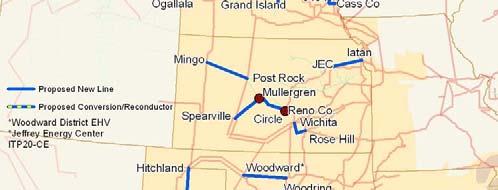
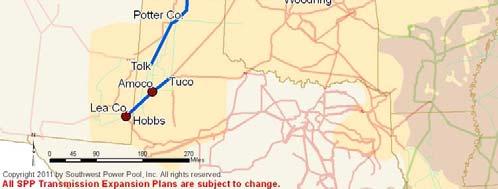
10 Priority Projects Plan for
11 POWER WORLD DEMONSTRATION 21 BENEFIT ANALYSIS BACKGROUND 22 11
12 Background: Cost Allocation H/B Background: Adjusted Production Cost Adjusted Production Costs (APC): Industry accepted metric tied to generation costs Based on a Day Ahead Market: Locational Marginal Price (LMPs) Measures benefit on an hourly basis, over a year s simulation Adjusted means that the simulation takes into account the purchase and sale of economic energy Price nodes are aggregated by zone 24 12
13 Background: APC Formulation APC = Production Cost Revenue from Sales + Cost of Purchases Where Revenue from Sales= MW Export x Zonal LMP gen weighted And Cost of Purchases = MW Import x Zonal llmp load weighted 25 Background: Input Assumptions Fuel Price Forecasts Coal, Gas, Oil, Uranium Generating Unit Parameters Operating Characteristics Ramp Rates Availability: Forced Outages, Maintenance Schedules Wind Profiles Load Forecasts: Peak Demand, Energy Profiles Hurdle Rates Between Utilities & Regions Transmission Topology 26 13
14 Background: Benefits, Outputs APC captures the effects of: Fuel Prices Run Times Congestion Ramp Rates Energy Purchases Energy Sales Emission Costs (Environmental) 27 Background: Benefits, Benchmarking Benchmarking uses planning data to compare to historical operations This is an important step to build confidence in model results It s important to note: since historical data is an imbalance market, and planning is on a day ahead market, results should not match exactly Instead, benchmarking represents a sanity test to validate a model 28 14

15 Generation by Unit Category in SPP Coal and combined cycle gas generation sources provide 79% of the total generation in the simulation. Historically, according to the EIA, these sources provided 77%. The gas prices between 2010 and the simulation warrant this difference. 29 Hydro Generation by Month 30 15


16 Operating & Spinning Reserve 31 Generator Maintenance Outages Graph of capacity outaged by time period Correlates with GADS data 32 16


17 Transmission Line & Transformer Outages PROMOD simulations do not take transmission maintenance into account This is an everyday operational concern Take Away: Results from PROMOD may demonstrate lower benefit than may be actual 33 Average LMP by Area The average LMP of each area trends well with the results of the EIS market in 2008, 2009, and


18 Expected Peak Aug 3ITP10 Load at Peak rd, 5pm Serving Kansas City 36 18


 $0.")


19 Current Goals & Standards 10% 2020 Wind Energy 37 TWh for Future 1 20% % % % TWh for Future 2 Other Renewable Energy 2 TWh for both futures Approximate RES % 5,880 MW by % in Future 1 20% in Future 2 37 Future 1 Congestion Number of Flowgates Binding 48 flowgates Average Shadow Price ($/MWh) $0.5 $2 $2 $8 Avg. Shadow Price 4.19 $/MWh $8 $15 $15 $30 $30 $45 Red indicates % of binding hours at flowgate Hours with Congestion 7,563 Highest Prices in Hours July 13 th 1500 July 13 th 1600 July 13 th
20 Benefits/Cost (B/C) Ratio Computation Benefits are determined on a zone by zone basis for a year This benefit is compared to the allocated costs by each zone This gives a B/C ratio A B/C ratio of 1.0 means that a project just pays for itself 39 HYPOTHETICAL RTO EXAMPLE 40 20
21 Intro: Hypothetical RTO (H RTO) RTO B/C 101 at the request of the RARTF is designed to provide background for RARTF to better understanding B/C Ratios RTO B/C 101 uses a Hypothetical RTO (H RTO) H RTO has Five Zones, A thru E H RTO has 2 sets of transmission upgrades: Portfolio I (2011 $107.5M) Portfolio 2 (2014 $92.5M) 41 H RTO Considerations Cost Allocation Methodology: H RTO has the same Cost Allocation Method as SPP (Highway/Byway) H RTO load share ration for each zone is computed the same as SPP CP 12 Benefit Approach: H RTO uses 2 approaches to calculating B/C Ratios Adjusted Production Cost (APC) B/C Societal B/C 42 21
22 H RTO: CHARACTERISTICS AND FACTS 43 H RTO Foot Print Zone A Zone B Zone C Zone D Zone E 44 22

23 H RTO Foot Print Overview Zone A Zone A and Zone B in the west are high renewable zones with low cost power These zones wish to move renewable energy to the east Zone C 45 H RTO Foot Print Overview Zones B, D & E are higher cost zones with a desire to import renewable energy Zone B Zone D Zone E 46 23
24 H RTO Foot Print Overview Congestion Zone A Zone B Zone C Zone D Zone E Congestion exists between the western and the eastern zones This congestion limits the import of desired energy 47 Hypothetical RTO Load Ratio Share (12CP) A B Load Ratio Share C D E E, 3.3% D, 13.3% Zone A C, 16.7% B, 25.0% A, 41.7% B C D E 48 24
25 Hypothetical RTO Characteristics by Zone 49 H RTO PORTFOLIO 1 PROJECTS:
26 H RTO Portfolio 1 Projects A1 A2 Zone A Zone B Zone C Zone D Zone E E1 51 H RTO: Portfolio I ( ) 52 26

27 Portfolio 1: First Year Cost Allocated by Zones 53 Portfolio 1: C/A by Zone to
28 Portfolio 1: APC Benefits Zones (2013) Zone Costs APC B/C Zone A $ 7,337,396 $ 9,000, Zone B $ 4,402,438 $ 6,000, Zone C $ 2,934,958 $ 2,900, Zone D $ 2,347,967 $ 1,700, Zone E $ 727,242 $ 50, $ 17,750,000 $ 19,650, Zone A Zone B Zone C Zone D Zone E 55 Portfolio 1: APC + Societal Benefit (2013) $45,000,000 $40,000,000 $35,000,000 $30,000,000 Zone Est. Benefit APC + Societal B/C Zone A $ 8,000,000 $ 17,000, Zone B $ 4,000,000 $ 10,000, Zone C $ 1,000,000 $ 3,900, Zone D $ 3,500,000 $ 5,200, Zone E $ 600,000 $ 650, $ 17,100,000 $ 36,750, $25,000,000 $20,000,000 APC Benefit Societal Benefit $15,000,000 $10,000,000 $5,000,000 $ Zone A Zone B Zone C Zone D Zone E 56 28
29 Portfolio 1: Benefits to 2051 $60,000,000 P1: APC Benefit Over Time $50,000,000 $40,000,000 $30,000,000 $20,000,000 $10,000,000 $0 Zone A Zone B Zone C Zone D Zone E 57 Portfolio 1: 40 Year Benefits vs Costs P1: 40 Year Benefit vs Costs (APC Only) $140,000,000 $120,000,000 Benefits Costs $100,000,000 $80,000,000 $60,000,000 $40,000, $20,000,000 $ 58 29
30 H RTO PORTFOLIO 2 PROJECTS: H RTO Portfolio 2 Projects B1 Zone A B2 Zone B Zone C Zone D Zone E C1 D
31 HRTO: Portfolio 2 ( ) 61 Portfolio 2: Cost Allocated by Zones 62 31

32 Portfolio 2: C/A by Zone to ALL PORTFOLIO PROJECTS: PORTFOLIO 1 & 2 COMBINED 64 32
 66 33")
33 All Portfolio Projects A1 A2 B1 Zone A B2 Zone B Zone C Zone D Zone E C1 E1 D1 65 H RTO: All Portfolios ( ) 66 33
 67 All")

34 All Projects: By Zone (H/B) 67 All Projects: Cost Allocation by Zones 68 34

35 All Portfolio: C/A by Zone to Portfolio 1 & 2: APC Benefits Zones (2016)* 1.6 Zone Costs APC B/C Zone A $ 12,492,292 $ 17,000, Zone B $ 8,148,625 $ 12,000, Zone C $ 4,996,917 $ 3,000, Zone D $ 3,997,533 $ 4,100, Zone E $ 1,139, $ 100, $ 30,775,000 $ 36,200, Zone A Zone B Zone C Zone D Zone E *Note: Portfolio 2 is incremental to Portfolio 1, i.e. both Portfolios together account for the benefit shown 70 35
36 Portfolio 1 & 2: APC + Societal Benefits (2016) * $45,000,000 $40,000,000 $35,000,000 $30,000,000 Zone Est. Benefit APC + Societal B/C Zone A $ 12,000,000 $ 29,000, Zone B $ 7,000,000 $ 19,000, Zone C $ 3,000,000 $ 6,000, Zone D $ 4,200,000 $ 8,300, Zone E $ 700,000 $ 800, $ 26,900,000 $ 63,100, $25,000,000 $20,000,000 APC Benefit Societal Benefit $15,000,000 $10,000,000 $5,000,000 $ Zone A Zone B Zone C Zone D Zone E *Note: Portfolio 2 is incremental to Portfolio 1, i.e. both Portfolios together account for the benefit shown 71 Portfolio 1 & 2: Total Benefit to 2051 $60,000,000 P1&2: APC Benefit Over Time $50,000,000 $40,000,000 $30,000,000 $20,000,000 $10,000,000 $0 Zone A Zone B Zone C Zone D Zone E 72 36
37 Portfolio 1 & 2: 40 Year Benefits vs Costs P1 & 2 : 40 Year Benefit vs Costs (APC Only) $140,000,000 $120,000,000 Benefits $100,000,000 Costs $80,000,000 $60,000,000 $40,000,000 $20,000,000 $ 73 Who is losing? Zone APC + Societal APC + Societal Zone E Zone C Zone D Zone E is still a loser after even societal benefits are added to the equation Zone C and D are losers at points in time Zones A and B are always winners 74 37
38 What about remedies?? Possible Remedies: Revenue Transfers Advance Projects/Staging Timing New Projects (Portfolio 3?) 75 Contact Information Paul Suskie, Sr. Vice President & General Charles Cates PE, Lead Engineer Dan Jones PE, Lead Engineer


39 8/4/2011 SPP Staff White Paper on Analytical Methods for Unintended d Consequence Review RARTF Meeting August 4 5, 2011 Dallas, Texas Paul Suskie psuskie@spp.org
40 8/4/2011 SPP Staff White Paper for RARTF. SPP Staff White Paper is divided into 3 Sections Section 1 Contains an overview of SPP Tariff Requirement Section 2 Contains SPP Staff s research Section 3 Contains SPP Staff s recommendations 3 SPP Staff White Section 1 Section 1.1 Overview of SPP Tariff Requirements Section 1.2 Cost Allocation Challenges for Transmission Upgrades 4 2
41 8/4/2011 SPP Staff White Section 2. Section 2.1 SPP Staff Research for this White Paper Section 2.2 Transmission Cost Allocation Methods in the United States and SPP Section Methods of Measuring Transmission Upgrade Benefits 5 SPP Staff White Section 3. Section 3.1 SPP Staff Recommendations For Unintended Consequences Review Section 3.2 SPP Staff Recommendation: Three Tiered Benefit Analysis Approach Section 3.3 SPP Staff Recommends Analyzing Transmission Projects in 4 Stages Section 3.4 Unintended Consequences Threshold Section 3.5 Proposed Unintended Consequences Mitigation Section 3.6 Proposed Unintended Consequences Review Timeline 6 3
42 8/4/2011 Section 1.1 SPP Tariff Requirements Step 1: One year prior to each three year planning cycle (starting in 2013) the Markets and Operations Policy Committee and Regional State Committee will define the analytical methods to be used to report under this Section III.D and suggest adjustments to the Regional State Committee and Board of Directors on any imbalanced zonal cost allocation in the SPP footprint. 7 Section 1.1 SPP Tariff Requirements Step 2: For each review conducted in accordance with Section III.D.1, the Transmission Provider shall determine the cost allocation impacts of the Base Plan Upgrades with Notifications to Construct issued after June 19, 2010 to each pricing Zone within the SPP Region. The Transmission Provider in collaboration with the Regional State Committee shall determine the cost allocation impacts utilizing the analysis specified in Section III.e of Attachment O and the results produced by the analytical methods defined pursuant to Section III.D.4(i) of this Attachment J. 8 4
43 8/4/2011 Section 1.1 SPP Tariff Requirements Step 3: The Transmission Provider shall review the results of the cost allocation analysis with SPP s Regional Tariff Working Group, Markets and Operations Policy Committee, and the Regional State Committee. The Transmission Provider shall publish the results of the cost allocation impact analysis and any corresponding presentations on thespp website. Attachment J, Section III.D.3 of SPP s OATT. 9 Section 1.1 SPP Tariff Requirements Step 4: The Transmission Provider shall request the Regional State Committee provide its recommendations, if any, to adjust or change the costs allocated under this Attachment J if the results of the analysis show an imbalanced cost allocation in one or more Zones. 10 5


44 8/4/2011 Section 1.2 Cost Allocation Challenges Determining the costs and benefits of adding transmission infrastructure to the grid is a complex process, particularly for projects that affect multiple systems and therefore may have multiple beneficiaries. At the same time, the expansion of regional power markets and the increasing adoption of renewable energy requirements have led to a growing need for transmission projects that cross multiple utility and RTO systems. There are few rate structures in place today that provide the allocation and recovery of costs for these intersystem projects, creating significant risk for developers that they will have no identified group of customers from which to recover the cost of their investment. FERC Transmission Planning Processes Under Order No. 890, Notice of Request for Comments at 5, Docket No. AD (Oct. 8, 2009). 11 Section 2.2 Cost Allocation Methodologies 12 6


45 8/4/2011 Section 2.2 SPP Cost Allocation Methods 13 Section 2.3 Methods of Measuring Benefits 14 7
46 8/4/2011 Section 2.3 Methods of Measuring Benefits Adjusted Production Cost Meeting State and Utility Goals and Standards Improvements poe e in Reliability eab Enable Efficient Location of New Generation Capacity Reduced Losses Increased Effective Capacity Factor Ability to Reduce Cost of Capacity Positive Impact on Capacity Required for Losses Levelization of Locational Marginal Price Improved access to economical resources participating in SPP markets Change in operating reserves Transmission Loading Relief (TLR) Reduction Enabling Market Solutions Improvements to Import/Export Limits Improved poedeconomic o c market etdynamics not measured in the security constrained economic dispatch model Improved economic market dynamics measured in the nodal security constrained economic dispatch model Reduction in market price volatility Reduction of emission rates and values Transmission corridor utilization Ability to reduce cycling of base load units Generation resource diversity Part of overall EHV Overlay Plan Ability to serve unexpected new load 15 Section 3.1 SPP Staff REcommendation Basedupon research and experience, SPP staff recommends that the Unintended Consequences review contain two components. First, a threetiered analytical methodology evaluating different benefits will be considered. Second, the review should be conducted looking at transmission projects in stages. 16 8
47 8/4/2011 Section 3.2 Recommendation: 3 Tiered Approach Because both a too conservative approach and a too broad approach to analyzing benefits of transmission projects can be problematic, SPP staff proposes using a three tiered approach that utilizes three perspectives for transmission benefit assessment. As described below, these methods include a type of method with conservative benefits, moderate benefits, and broad benefits. These methodologies are incremental and contemplate benefits from the prior tier, i.e., the moderate approach considers all benefits from the conservative approach, plus additional value metrics. The three recommended methodologies are discussed below. 17 Section st Conservative Approach The first tiered approach is the conservative approach. This approach consists of using the following metrics: Dispatch Savings, Loss Reductions, Avoided Projects, Applicable EnvironmentalImpacts Impacts, Reduction in Required Operating Reserves, and Interconnection Improvements. * Note: The proposed conservative approach comes directly from Attachment O, Section III.8.e to the SPP OATT. 18 9
48 8/4/2011 Section st Conservative Approach Adj Prod Cost = Production Cost Revenue from Sales + Cost of Purchases Where: Revenues from Sales = MW Export x Zonal LMP Gen Weighted and Cost of Purchases = MW Import x Zonal LMP Load Weighted 19 Section nd Moderate Approach The second tiered approach is the moderate approach. This approach consists of using the methodology from the conservative approach, but adds the following benefit metrics: Meeting State and Utility Goals and Standards, Positive Impact on Capacity Required for Losses, and Improvements in Reliability
49 8/4/2011 Section nd Moderate Approach Value of improved ATCs of the SPP grid: This metric provides a non monetized (qualitative) assessment of the added flexibility for the potential ti redirection of power flows within SPP made possible by ATC increases. The challenge in defining this metric is the development of a meaningful weighting structure of ATC defined for multiple combinations of points of receipt and points of delivery. Value of providing a backstop to a catastrophic event: This metric provides a qualitative assessment of improved grid reliability and its ability to withstand the impact of catastrophic events electrically expressed as multiple contingencies. This metric requires the assessment of catastrophic events and the determination of their probability. 21 Section rd Broad Approach This approach consists of using the methodology from the moderate approach, but adds to it the metric of Societal Benefit... These benefits include, but are not limited it to, the following: Overall economic output during construction, Overall jobs impact during construction, Additional earnings related to construction jobs impact, Overall economic output tduring operation, Overall jobs impact during operation, Additional earnings related to operation jobs impact, and Tax benefits to the state
50 8/4/2011 Section 3.3 Analyzing Projects in 4 Stages SPP staff recommends that the Unintended Consequence analysis be conducted on transmission projects at varying stages in time over a 40 year timeframe. Staff s recommendation is that the analysis be conducted in four stages: (1) projects in service at the time of the study, (2) projects projected to be in service in 6 years, (3)projects projected to be inservice in10years; and (4) projects projected to be in service in 20 years. * The 6, 10, and 20 year stages mirror SPP s planning timelines defined in SPP s OATT. 23 Section 3.4 Unintended Consequences Threshold Per the request of the RARTF, SPP staff recommends that an Unintended Consequences threshold be established. This threshold h will define when an Unintended dconsequences determination will trigger zonal mitigation. If a zone is determined to be below this threshold, mitigation may be necessary to prevent undue unintended consequences. It is recommended that the threshold utilized for the Unintended Consequences take a broad look at the overall benefits for each of the recommended dstages and metric methods considered for the analysis. In other words, the threshold will apply to the 40 year analysis of the four stages of transmission projects using the three tiers of assessed benefits
51 8/4/2011 Section 3.4 Unintended Consequences Threshold SPP staff recommends that an initial threshold be set at a.8 B/C ratio for the conservative tiered analysis, and.9 B/C ratio for the moderate tiered ti d analysis, and a 10B/C 1.0 ratio for the broad tiered analysis. These ratios will be applied to each of the tiered approaches over the four proposed stages, that is to say, each tier will be summed up from the current year through year 20. This number will be averaged for each tier to represent a final value. This value will be compared to the threshold index chosen for each tier and given a pass/fail result. If a zone passes the analysis for a minimum of twothirds of the categories, then it is determined to have no unintended consequences. The chart below shows how staff proposes that the threshold will work. 25 Section 3.4 Unintended Consequences Threshold 26 13

52 8/4/2011 Section 3.4 Unintended Consequences Mitigation If the results for a zone are below an Unintended Consequences threshold, mitigation may be implemented to reduce negative zonal impacts. SPP staff recommends that, in addition to the current authority of the RSC on Cost Allocation issues, the following mitigation techniques may be used to alleviate unintended consequences: Acceleration of already planned upgrades required to bring benefits to a deficient zone earlier to offset unintended consequences of other upgrades; Issuance of NTCs for selected new upgrades required to bring benefits to a deficient zone to offset unintended consequences of other upgrades; and Zonal Transfers (similar to Balanced Portfolio Transfers) to offset costs or a lack of benefits to a zone to offset unintended consequences. 27 Section 3.5 Proposed Timeline 28 14
53 Annual Transmission Revenue Requirement ATRR: What is it, Why it Matters and How is it calculated? l Annual Transmission Revenue Requirement What is it? Why it matters. How is it calculated. A Simple Example. 1
54 ATRR: What is It? The Annual Transmission Revenue Requirement (ATRR) is the amount of Revenue that the Transmission Owner receives from SPP for RECOVERY OF its expenses (Cost of Debt, O&M, Depreciation, Taxes) for the project and EARNINGS ON the project (Return On Equity). ATRR set in a Section 205 filing with the FERC for jurisdictional utilities or in a rate filing a state commission. By either a Stated Rate or Formula Rate ATRR: Why it Matters Year 0 ATRR n = Net Plant * Net Plant Carrying Charge (NPCC) oftransmission Owner building Project) until Project is fully depreciated Example: Year 0 Net Plant = $100 million Project NPCC = 16% Depreciation = $0 Life = 40 years ATRR 0 = $100M * 16% = $16M 2
55 ATRR: Why it Matters Year 1 ATRR n = Net Plant * Net Plant Carrying Charge (NPCC) oftransmission Owner building Project) Example: Year 1 Net Plant = $100M Project NPCC = 16% Depreciation = $2.5M Life = 40 years ATRR 1 = $97.5M * 16% = $15.6M ATRR: Why it Matters Year 2 ATRR n = Net Plant * Net Plant Carrying Charge (NPCC) of Transmission i Owner building Project) Example: Year 2 Net Plant = $100M Project NPCC = 16% Depreciation = $2.5M ATRR 2 = $95.0M * 16% = $15.2M 3
56 ATRR: How is it calculated? ATRR n = Net Plant * Net Plant Carrying Charge (NPCC) of Transmission i Owner building Project n = 1, 40 (or other depreciable life of Asset Net Plant = Cost of Project Accumulated Depreciation Net Plant Carrying Charge = Weighted Average Cost of Capital + O&M + Taxes + Depreciation ATRR: How is it calculated? Net Plant Carrying Charge = Weighted Average Cost of Capital + O&M + Taxes + Depreciation Weighted Average Cost of Capital (WACC) = Cost of Debt * Debt/Equity ratio + Return On Equity (ROE) * (1 Debt/Equity ratio) In Example: WACC = 8%*(.5) + 11%*(.5) = 9.5% NPCC = 9.5% + 4% + 2% + 2.5% = 16% 4
57 ATRR: Effect of Depreciation Over Time $18.00 $16.00 $14.00 $12.00 $10.00 $8.00 Depreciation ATRR $6.00 $4.00 $2.00 $ Effect on Net Plant over time due to Accumulated Depreciation $ $ $80.00 $60.00 Net Plant Accumulated Depreciation $40.00 $20.00 $
58 Annual Transmission Revenue Requirement ATRR: What is it, Why it Matters and How is it calculated? l 6
New Member Cost Allocation Review Process. Prepared by: COST ALLOCATION WORKING GROUP
 New Member Cost Allocation Review Process Prepared by: COST ALLOCATION WORKING GROUP TABLE OF CONTENTS 1. HISTORY AND BACKGROUND... 1 2. PURPOSE / GOAL STATEMENT... 3 3. OVERVIEW OF PROCESS... 3 4. NEW
BEFORE THE NEW MEXICO PUBLIC REGULATION COMMISSION ) ) ) ) ) ) ) ) ) ) ) DIRECT TESTIMONY WILLIAM A. GRANT. on behalf of
 ) ) ) ) ) ) ) ) ) ) DIRECT TESTIMONY WILLIAM A. GRANT. on behalf of") BEFORE THE NEW MEXICO PUBLIC REGULATION COMMISSION IN THE MATTER OF SOUTHWESTERN PUBLIC SERVICE COMPANY S APPLICATION FOR REVISION OF ITS RETAIL RATES UNDER ADVICE NOTICE NO., SOUTHWESTERN PUBLIC SERVICE
BEFORE THE NEW MEXICO PUBLIC REGULATION COMMISSION IN THE MATTER OF SOUTHWESTERN PUBLIC SERVICE COMPANY S APPLICATION FOR REVISION OF ITS RETAIL RATES UNDER ADVICE NOTICE NO., SOUTHWESTERN PUBLIC SERVICE
Regional Cost Allocation Review (RCAR II) July 11, 2016 SPP Regional Cost Allocation Review Report for RCAR II
 July 11, 2016 SPP Regional Cost Allocation Review Report for RCAR II") Regional Cost Allocation Review (RCAR II) July 11, 2016 SPP Regional Cost Allocation Review Report for RCAR II 1 Table of Contents EXECUTIVE SUMMARY...5 BACKGROUND...7 SECTION 1: OVERVIEW OF THE RARTF
Regional Cost Allocation Review (RCAR II) July 11, 2016 SPP Regional Cost Allocation Review Report for RCAR II 1 Table of Contents EXECUTIVE SUMMARY...5 BACKGROUND...7 SECTION 1: OVERVIEW OF THE RARTF
October 8, SPP Regional Cost Allocation Review Report
 Regional Cost Allocation Review October 8, 2013 SPP Regional Cost Allocation Review Report 1 Table of Contents EXECUTIVE SUMMARY...5 BACKGROUND...7 SECTION 1: OVERVIEW OF THE RARTF AND RCAR REVIEW...8
SPP s Regional Review of SPP-MISO Coordinated System Plan Recommended Interregional Projects
 SPP s Regional Review of SPP-MISO Coordinated System Plan Recommended Interregional Projects January 4, 2016 SPP Interregional Relations Table of Contents Executive Summary... 2 Introduction... 5 Stakeholder
10-YEAR COSTS AND BENEFITS TO SPP MEMBERS OF INTEGRATING MOUNTAIN WEST TRANSMISSION GROUP Quantitative Analysis of Costs and Benefits
 10-YEAR COSTS AND BENEFITS TO SPP MEMBERS OF INTEGRATING MOUNTAIN WEST TRANSMISSION GROUP Quantitative Analysis of Costs and Benefits Published on March 19, 2018 By SPP Staff REVISION HISTORY DATE OR VERSION
SPP New Member Communication and Integration Process. Mountain West Transmission Group. Background Information October 2017
 1 SPP New Member Communication and Integration Process Mountain West Transmission Group Background Information October 2017 Contents Introduction... 2 1. Westside Tariff Design... 2 2. Operational Provisions...
Southwest Power Pool s Balanced Portfolio Approach for Economic Upgrades
 Southwest Power Pool s Balanced Portfolio Approach for Economic Upgrades Presentation by Michael Proctor Chief Economist, Missouri PSC Harvard Electricity Policy Group Chicago, Illinois October 2, 2008
Costs and Revenue Offsets Item # Description
 Item # CUS-13 Costs and Description Total Cost Allocation - Total cost (PV of 40-year ATRR's ) are listed as $7,382M on ESWG slide 3. Could we get a breakdown (listing) of how this total was determined.
Cost Allocation Principles for Seams Transmission Expansion Projects
 Cost Allocation Principles for Seams Transmission Expansion Projects SPP s seams agreements currently contain requirements for SPP to develop coordinated system plans with its neighbors. The extent and
Mountain West Transmission Group (MWTG) Introduction and Process
 Introduction and Process") Mountain West Transmission Group (MWTG) Introduction and Process October 13 Denver, CO October 16 Little Rock, AR 2 Agenda Overview of SPP Overview of the MWTG Members SPP Process New Member Integration
Mountain West Transmission Group (MWTG) Introduction and Process October 13 Denver, CO October 16 Little Rock, AR 2 Agenda Overview of SPP Overview of the MWTG Members SPP Process New Member Integration
Posting Date: 08/01/2015 Gentry Crowson, Market Forensics
 VRL Analysis Posting Date: 08/01/2015 Gentry Crowson, Market Forensics 2 Contents Executive Summary... 3 Background... 6 Analysis of OC Breach Characteristics in the Marketplace... 8 VRL Yearly Analysis
RR16 - Page 1 of
 DOCKET NO. APPLICATION OF SOUTHWESTERN PUBLIC SERVICE COMPANY FOR AUTHORITY TO CHANGE RATES PUBLIC UTILITY COMMISSION OF TEXAS DIRECT TESTIMONY of ARTHUR P. FREITAS on behalf of SOUTHWESTERN PUBLIC SERVICE
Seams Cost Allocation: A Flexible Framework to Support Interregional Transmission Planning (Summary of Final Report)
") Seams Cost Allocation: A Flexible Framework to Support Interregional Transmission Planning (Summary of Final Report) Presented at: SPP RSC Quarterly Meeting Presented by: Johannes Pfeifenberger Delphine
Seams Cost Allocation: A Flexible Framework to Support Interregional Transmission Planning (Summary of Final Report) Presented at: SPP RSC Quarterly Meeting Presented by: Johannes Pfeifenberger Delphine
The cost allocation principles and methodologies in this Attachment Y cover only
 31.5 Cost Allocation and Cost Recovery 31.5.1 The Scope of Attachment Y Cost Allocation 31.5.1.1 Regulated Responses The cost allocation principles and methodologies in this Attachment Y cover only regulated
PJM/MISO Cost Allocation For Economic Upgrades
 PJM/MISO Cost Allocation For Economic Upgrades Stakeholder Meeting Hilton Baltimore BWI, Baltimore MD May 19, 2008 1 Topics for Discussion Background FERC Order / Schedule (RTO Staffs) Review Internal
Regional Transmission Organization Frequently Asked Questions
 1. The CRA analysis showed greater trade benefits to the Entergy region from joining SPP rather than joining MISO. Did Entergy re-do the CRA analysis? No. The CRA analysis was a key component of the Entergy
Southwest Power Pool, Inc. Policy Recommendation for the SPP Board of Directors and Members Committee. March 6, 2018 Mountain West Transmission Group
 Southwest Power Pool, Inc. Policy for the SPP Board of Directors and Members Committee Policy Area #1 DC Ties March 6, 2018 Mountain West Transmission Group SPP and MWTG anticipate that incorporating the
Cost Allocation for Transmission Infrastructure
 USAID/NARUC East Africa Regional Regulatory Partnership Exchange: Cost Allocation for Transmission Infrastructure Andrew Greene Massachusetts Dept. of Public Utilities Energy Facilities Siting Board Dar
APPENDIX B: WHOLESALE AND RETAIL PRICE FORECAST
 Seventh Northwest Conservation and Electric Power Plan APPENDIX B: WHOLESALE AND RETAIL PRICE FORECAST Contents Introduction... 3 Key Findings... 3 Background... 5 Methodology... 7 Inputs and Assumptions...
Filed with the Iowa Utilities Board on May 31, 2017, E STATE OF IOWA DEPARTMENT OF COMMERCE UTILITIES BOARD
 STATE OF IOWA DEPARTMENT OF COMMERCE UTILITIES BOARD IN RE: MIDAMERICAN ENERGY IN RE: DOCKET NOS. E-22269, E-22270, AND E-22271 DOCKET NO. E-22279 (consolidated) ITC MIDWEST LLC BRIEF BY THE MIDCONTINENT
FTR Credit Requirements Prevailing Flow Paths Affected by Transmission System Upgrades
 FTR Credit Requirements Prevailing Flow Paths Affected by Transmission System Upgrades Hal Loomis Manager, Credit Markets & Reliability Committee December 7, 2017 Credit Risk Exposure Issue Description
MISO Cost Allocation Response. RECBWG February 15, 2018
 MISO Cost Allocation Response RECBWG February 15, 2018 MISO Cost Allocation Response: February 2018 Context The overall objective of the MISO transmission cost allocation methodology is to align who pays
Informational Filing of Midwest Independent Transmission System Operator, Inc. s Independent Market Monitor
 Potomac Economics, Ltd. 9990 Fairfax Boulevard, Suite 560 Telephone: 703-383-0720 Fairfax, Virginia 22030 Facsimile: 703-383-0796 Honorable Kimberly D. Bose, Secretary Federal Energy Regulatory Commission
TRANSMISSION OWNER ZONAL PLACEMENT PROCESS
 TRANSMISSION OWNER ZONAL PLACEMENT PROCESS Published July 2017 CONTENTS Section 1: Introduction, Scope & Steps... 1 Subsection A: Introduction To Zonal Placement... 1 Subsection B: Scope... 1 Subsection
MISO Planning Process. May 31, 2013
 MISO Planning Process May 31, 2013 MISO Planning Objectives Fundamental Goal The development of a comprehensive expansion plan that meets reliability needs, policy needs, and economic needs MISO Board
Standard Market Design: FERC Process and Issues
 Standard Market Design: FERC Process and Issues Richard O Neill and Udi Helman Division of the Chief Economic Advisor, Office of Markets, Tariffs and Rates Federal Energy Regulatory Commission IEEE PES
Stakeholder Survey I Cross Border Cost Allocation for Economic Transmission Projects For Discussion September 24, 2008
 PJM and the Midwest ISO are seeking input from stakeholders on various concepts that have been discussed during the PJM/Midwest ISO Cross-Border meetings for dealing with transmission projects constructed
Injection / Withdrawal CARP
 Injection / Withdrawal CARP Decisions Note: To inform the RECB Stakeholders at their upcoming September 30 th meeting, this version of the Decision Tree contains the decisions made by CARP (in bold/italics)
Cost Allocation Reform Update
 Cost Allocation Reform Update Regional Expansion Criteria and Benefits Working Group May 18, 2017 Conditions Precedent for Regional Transmission Investment 1. Increased consensus regarding the issue(s)
BEFORE THE NEW MEXICO PUBLIC REGULATION COMMISSION SOUTHWESTERN PUBLIC SERVICE COMPANY S UNOPPOSED RESPONSE TO STAFF S COMMENTS
 BEFORE THE NEW MEXICO PUBLIC REGULATION COMMISSION IN THE MATTER OF SOUTHWESTERN ) PUBLIC SERVICE COMPANY S 2018 ) INTEGRATED RESOURCE PLAN FOR ) NEW MEXICO. ) CASE NO. 18-00215-UT ) SOUTHWESTERN PUBLIC
Financial Transmission and Auction Revenue Rights
 Section 13 FTRs and ARRs Financial Transmission and Auction Revenue Rights In an LMP market, the lowest cost generation is dispatched to meet the load, subject to the ability of the transmission system
Transmission Investment Trends and Planning Challenges
 Transmission Investment Trends and Planning Challenges Presented at: EEI Transmission and Wholesale Markets School Presented by: Johannes Pfeifenberger Madison, WI August 8, 2012 Copyright 2012 The Brattle
Long Term Access Goal Final Report Update
 Long Term Access Goal 2007-09 Final Report 2008-10 Update SME Version of Presentation for ATC Board of Directors Meeting December 14, 2009 2007-09 and 2008-10 Long Term Goals Access (10%) Reduce congestion
Memo to the MOPC and Board of Directors Highway-Byway Cost Allocation
 Memo to the MOPC and Board of Directors Highway-Byway Cost Allocation SPP believes that the proposed Highway-Byway cost allocation methodology will promote new transmission construction by allocating:
Benefits Determination and Cost Allocation
 Benefits Determination and Cost Allocation Johannes Pfeifenberger Transmission Executive Forum West 2012 Meeting Public Policy Objectives through Transmission Investment San Diego, CA October 22, 2012
Southern California Edison Stakeholder Comments. Energy Imbalance Market 2 nd Revised Straw Proposal issued July 2, 2013
 Southern California Edison Stakeholder Comments Energy Imbalance Market 2 nd Revised Straw Proposal issued July 2, 2013 Submitted by Company Date Submitted Paul Nelson (626) 302-4814 Jeff Nelson (626)
Transmission System Expansion Cost Allocation Alternatives for Renewable Resources. Cost Allocation Working Group March 26, 2008 OG&E Ver 2 3/20/8
 Transmission System Expansion Cost Allocation Alternatives for Renewable Resources Cost Allocation Working Group March 26, 2008 OG&E Ver 2 3/20/8 Page 1 Why Page 2 Page 1 of 11 Basic Principles Wind generation
Valuation of Transmission Assets and Projects. Transmission Investment: Opportunities in Asset Sales, Recapitalization and Enhancements
 Valuation of Transmission Assets and Projects Assef Zobian Cambridge Energy Solutions Alex Rudkevich Tabors Caramanis and Associates Transmission Investment: Opportunities in Asset Sales, Recapitalization
SPP TLR (TEMPORARY
 SPP TLR 5 Investigation Report Flowgate 15369 (TEMPORARY 11) Plant X Sundown 230 kv Line for the Loss of Tolk Yoakum 230 kv Line TLR Level 5: February 1, 2009 Report Issued: March 11, 2009 1. Description
EIPC Roll-Up Report & Scenarios
 EIPC Roll-Up Report & Scenarios Zach Smith Director, Transmission Planning New York Independent System Operator IPTF/EGCWG/ESPWG Meeting January 6, 2014 2013 New York Independent System Operator, Inc.
WHITE PAPER. Financial Transmission Rights (FTR)/ Congestion Revenue Rights (CRR) Analysis Get ahead with ABB Ability PROMOD
/ Congestion Revenue Rights (CRR) Analysis Get ahead with ABB Ability PROMOD") WHITE PAPER Financial Transmission Rights (FTR)/ Congestion Revenue Rights (CRR) Analysis Get ahead with ABB Ability PROMOD 2 W H I T E PA P E R F T R / C R R A N A LY S I S Market participants and system
WHITE PAPER Financial Transmission Rights (FTR)/ Congestion Revenue Rights (CRR) Analysis Get ahead with ABB Ability PROMOD 2 W H I T E PA P E R F T R / C R R A N A LY S I S Market participants and system
History of Cost Allocation within MISO RECB TF. January 29, 2015
 History of Cost Allocation within MISO RECB TF January 29, 2015 Cost Allocation FERC Orders, Filings, and Rulings Cost allocation for MISO began with Order 2003 which instituted a pro forma Generator Interconnection
Calculate Net Annual Transmission Revenue Requirements (ATRR) and Rates for SPP Tariff. Total Transmission A. Zonal Net ATRR 1 Gross ATRR $60,516,589
 and Rates for SPP Tariff. Total Transmission A. Zonal Net ATRR 1 Gross ATRR $60,516,589") Page 1 Formula-based Rate Template Calculate Net Annual Transmission Revenue Requirements (ATRR) and Rates for SPP Tariff Line No. Acct Description Notes Total Transmission A. Zonal Net ATRR 1 Gross ATRR
Page 1 Formula-based Rate Template Calculate Net Annual Transmission Revenue Requirements (ATRR) and Rates for SPP Tariff Line No. Acct Description Notes Total Transmission A. Zonal Net ATRR 1 Gross ATRR
Financial Transmission and Auction Revenue Rights
 Section 13 FTRs and ARRs Financial Transmission and Auction Revenue Rights In an LMP market, the lowest cost generation is dispatched to meet the load, subject to the ability of the transmission system
2019 Integrated Resource Plan (IRP) Public Input Meeting January 24, 2019
 Public Input Meeting January 24, 2019") 1 2019 Integrated Resource Plan (IRP) Public Input Meeting January 24, 2019 Agenda January 24 9:00am-9:30am pacific Capacity-Contribution Values for Energy-Limited Resources 9:30am-11:30am pacific Coal
1 2019 Integrated Resource Plan (IRP) Public Input Meeting January 24, 2019 Agenda January 24 9:00am-9:30am pacific Capacity-Contribution Values for Energy-Limited Resources 9:30am-11:30am pacific Coal
Financial Transmission and Auction Revenue Rights
 Section 13 FTRs and ARRs Financial Transmission and Auction Revenue Rights In an LMP market, the lowest cost generation is dispatched to meet the load, subject to the ability of the transmission system
Portland General Electric Reports 2017 Financial Results and Initiates 2018 Earnings Guidance
 February 16, 2018 Portland General Electric Reports 2017 Financial Results and Initiates 2018 Earnings Guidance Full-year 2017 financial results on target excluding the effects of the Tax Cuts and Jobs
ATC Customer Benefit Metric
 ATC Customer Benefit Metric Marty Smith ATC Economic Planning April 5, 2012 Helping to keep the lights on, businesses running and communities strong Background ATC has used the Customer Benefit (CB) Metric
PJM & MISO Assumptions and Criteria for Testing of New Resources
 & Assumptions and Criteria for Testing of New Resources 1 Introduction These slides provide a description and comparison of the assumptions and criteria used by and during the study of customer proposed
Transmission Cost Allocation
 Transmission Cost Allocation IPSAC February 2, 2010 John P. Buechler NYISO Executive Regulatory Policy Advisor Background FERC Policy has evolved Order 888 No Planning Requirement for ISOs Order 2000 Planning
February 23, 2015 VIA ELECTRONIC FILING
 February 23, 2015 VIA ELECTRONIC FILING The Honorable Kimberly D. Bose Secretary Federal Energy Regulatory Commission 888 First Street, N.E. Washington, D.C. 20426 Re: Southwest Power Pool, Inc., Docket
Generation Retirement Scenario Special Assessment Update
 Generation Retirement Scenario Special Assessment Update John Moura, Director, Reliability Assessments and Technical Committees Member Representatives Committee Meeting November 6, 2018 Assessment Objectives
Comments of Pacific Gas & Electric Company Energy Imbalance Market Draft Tariff Language
 Comments of Pacific Gas & Electric Company Energy Imbalance Market Draft Tariff Language Submitted by Company Date Submitted Will Dong Paul Gribik (415) 973-9267 (415) 973-6274 PG&E December 5, 2013 Pacific
Generation Retirement Scenario
 Generation Retirement Scenario Special Reliability Assessment December 18, 2018 NERC Report Title Report Date I Table of Contents Preface... iii Executive Summary... v Key Findings... vii Recommendations...
Price Inconsistency Market Enhancements. Revised Straw Proposal
 Price Inconsistency Market Enhancements Revised Straw Proposal August 2, 2012 Price Inconsistency Market Enhancements Table of Contents 1 Introduction... 3 2 Plan for Stakeholder Engagement... 3 3 Background...
J.P. Morgan Comments on CAISO Straw Proposal on Data Release & Accessibility Phase 1: Transmission Constraints
 J.P. Morgan Comments on CAISO Straw Proposal on Data Release & Accessibility Phase 1: Transmission Constraints Submitted by Company Date Submitted Steve Greenleaf (916) 802-5420 J.P. Morgan December 16,
Calculate Net Annual Transmission Revenue Requirements (ATRR) and Rates for SPP Tariff. Total Transmission A. Zonal Net ATRR 1 Gross ATRR $48,861,618
 and Rates for SPP Tariff. Total Transmission A. Zonal Net ATRR 1 Gross ATRR $48,861,618") Page 1 Formula-based Rate Template Calculate Net Annual Transmission Revenue Requirements (ATRR) and Rates for SPP Tariff Line Acct Description Notes Total Transmission A. Zonal Net ATRR 1 Gross ATRR $48,861,618
Page 1 Formula-based Rate Template Calculate Net Annual Transmission Revenue Requirements (ATRR) and Rates for SPP Tariff Line Acct Description Notes Total Transmission A. Zonal Net ATRR 1 Gross ATRR $48,861,618
Renewable Generation, Transmission and the Energy Marketplace
 Renewable Generation, Transmission and the Energy Marketplace Portfolio Development and Business Case October 25, 2012 Overview Multi Value Projects reflect the transformation of the MISO planning process
SPP TLR (TEMPORARY
 SPP TLR 5 Investigation Report Flowgate 15613 (TEMPORARY 20) Sikeston Idalia 161 kv Line for the Loss of New Madrid Tipton 161 kv Line TLR Level 5: February 12, 2009 Report Issued: March 11, 2009 1. Description
DUKE ENERGY OHIO REQUEST FOR PROPOSALS FOR PEAKING/INTERMEDIATE POWER SUPPLY IN RESPONSE TO OHIO SENATE BILL 221
 DUKE ENERGY OHIO REQUEST FOR PROPOSALS FOR PEAKING/INTERMEDIATE POWER SUPPLY IN RESPONSE TO OHIO SENATE BILL 221 DUKE ENERGY OHIO Table of Contents Section Description Page 1.0 Purpose of Request for Proposals
1. MARS Base Case Model Assumptions
 1. MARS Base Case Model Assumptions 1.1 Load s Peak Load Load Shape Load Forecast Uncertainty 2014 IRM Model Assumptions October 1, 2013 forecast NYCA: 33,655 MW NYC: 11,740 MW Long Island 5,461 MW Multiple
NYISO s Compliance Filing to Order 745: Demand Response. Wholesale Energy Markets
 NYISO s Compliance Filing to Order 745: Demand Response Compensation in Organized Wholesale Energy Markets (Docket RM10-17-000) Donna Pratt NYISO Manager, Demand Response Products Market Issues Working
Wells Fargo Securities 11 th Annual Pipeline, MLP & Energy Symposium. New York December 5, 2012
 Wells Fargo Securities 11 th Annual Pipeline, MLP & Energy Symposium New York December 5, 2012 1 Safe Harbor Statement under the Private Securities Litigation Reform Act of 1995 This presentation contains
PROPOSAL FOR COST ESTIMATION REVIEW PROCESS FOR SPP TRANSMISSION
 PROPOSAL FOR COST ESTIMATION REVIEW PROCESS FOR SPP REGIONALLY FUNDED TRANSMISSION Presented on behalf of SPP s Transmission Owners SPP Strategic Planning Committee Meeting December 3, 2010 REGIONALLY
California Independent System Operator Corporation Fifth Replacement Electronic Tariff
 Table of Contents 33 Hour-Ahead Scheduling Process (HASP)... 2 33.1 Submission Of Bids For The HASP And RTM... 2 33.2 The HASP Optimization... 3 33.3 Treatment Of Self-Schedules In HASP... 3 33.4 MPM For
Impacts of Marginal Loss Implementation in ERCOT
 Impacts of Marginal Loss Implementation in ERCOT 2018 Reference Scenario Results PREPARED BY Metin Celebi Bruce Tsuchida Rebecca Carroll Colin McIntyre Ariel Kaluzhny October 11, 2017 Copyright 2017 The
TUCSON ELECTRIC POWER COMPANY. Transmission Reliability Margin Implementation Document (TRMID)
") A UniSource Energy Company TUCSON ELECTRIC POWER COMPANY Transmission Reliability Margin Implementation Document (TRMID) Approved by: Effective Date: /c Version 1 Based on North American Electric Reliability
A UniSource Energy Company TUCSON ELECTRIC POWER COMPANY Transmission Reliability Margin Implementation Document (TRMID) Approved by: Effective Date: /c Version 1 Based on North American Electric Reliability
April 28, Southwest Power Pool, Inc., Docket No. ER11- Submission of Formula Rate Template
 Secretary Federal Energy Regulatory Commission 888 First Street NE Washington, DC 20426 Re: Southwest Power Pool, Inc., Docket No. ER11- Submission of Formula Rate Template Honorable Secretary Bose: Pursuant
TABLE OF CONTENTS ARTICLE ONE: RECITALS... 5 ARTICLE TWO: ABBREVIATIONS, ACRONYMS, AND DEFINITIONS... 6 ARTICLE THREE: OPERATING COMMITTEE...
 TABLE OF CONTENTS ARTICLE ONE: RECITALS... 5 ARTICLE TWO: ABBREVIATIONS, ACRONYMS, AND DEFINITIONS... 6 2.1 Abbreviations and Acronyms... 6 2.2 Definitions... 7 2.3 Rules of Construction... 10 ARTICLE
BEFORE THE MINNESOTA OFFICE OF ADMINISTRATIVE HEARINGS 600 North Robert Street St. Paul, MN 55101
 BEFORE THE MINNESOTA OFFICE OF ADMINISTRATIVE HEARINGS 00 North Robert Street St. Paul, MN 1 FOR THE MINNESOTA PUBLIC UTILITIES COMMISSION th Place East, Suite 0 St Paul MN 1-1 IN THE MATTER OF THE APPLICATION
COMMENTS OF NV ENERGY LOCAL MARKET POWER MITIGATION ENHANCEMENTS DRAFT FINAL PROPOSAL DATED JANUARY 31, 2019 CAISO STAKEHOLDER PROCESS
 COMMENTS OF NV ENERGY LOCAL MARKET POWER MITIGATION ENHANCEMENTS DRAFT FINAL PROPOSAL DATED JANUARY 31, 2019 CAISO STAKEHOLDER PROCESS February 8 th, 2019 NV Energy appreciates the opportunity to comment
BEFORE THE MINNESOTA OFFICE OF ADMINISTRATIVE HEARINGS 600 North Robert Street St. Paul, MN 55101
 BEFORE THE MINNESOTA OFFICE OF ADMINISTRATIVE HEARINGS 00 North Robert Street St. Paul, MN 1 FOR THE MINNESOTA PUBLIC UTILITIES COMMISSION th Place East, Suite 0 St Paul MN 1-1 IN THE MATTER OF THE APPLICATION
Rate Schedules and Seams Agreements Tariff
 Rate Schedules and Seams Agreements Tariff Southwest Power Pool Rate Schedules and Seams Agreements Tariff Document Generated On: 8/20/2015 Southwest Power Pool - Rate Schedules and Seams Agreements Tariff
Constellation Energy Comments on Proposed OTC Reforms
 Constellation Energy Comments on Proposed OTC Reforms Constellation Energy Key Facts Constellation Energy is a Fortune 500 company (#125 on the 2009 list). Over 26,500 MW 2008 peak load served to retail
NPCC 2017 MARITIMES AREA INTERIM REVIEW OF RESOURCE ADEQUACY
 NPCC 2017 MARITIMES AREA INTERIM REVIEW OF RESOURCE ADEQUACY NEW BRUNSWICK POWER CORP. NOVA SCOTIA POWER INC. MARITIME ELECTRIC COMPANY, LIMITED NORTHERN MAINE ISA, INC. Approved by RCC December 5, 2017
NTTG REGIONAL TRANSMISSION PLAN. December 30, 2015
 NTTG 2014-2015 REGIONAL TRANSMISSION PLAN December 30, 2015 1 Table of Contents Executive Summary... 3 Introduction... 3 The Northern Tier Transmission Group... 3 Participating Utilities... 4 Purpose of
Portland General Electric
 Portland General Electric Earnings Conference Call Fourth Quarter and Full-Year 2017 Cautionary Statement Information Current as of February 16, 2018 Except as expressly noted, the information in this
Public Service Enterprise Group
 Public Service Enterprise Group PSEG Earnings Conference Call 2 nd Quarter 2018 August 1, 2018 Forward-Looking Statements Certain of the matters discussed in this report about our and our subsidiaries
Wairakei Ring Investment Proposal. Project Reference: CTNI_TRAN-DEV-01. Attachment A GIT Results
 Wairakei Ring Investment Proposal Project Reference: CTNI_TRAN-DEV-01 Attachment A GIT Results December 2008 Document Revision Control Document Number/Version 001/Rev A Description Wairakei Ring Investment
FERC Order Minute Settlements Manual Revisions
 FERC Order 825 5 Minute Settlements Manual Revisions Ray Fernandez Manager, Market Settlements Development Market Settlements Subcommittee October 30, 2017 Impacted Settlement Manuals M-27 Open Access
December 7, Compliance with Order No. 844 Response to Deficiency Letter
 California Independent System Operator Corporation The Honorable Kimberly D. Bose Secretary Federal Energy Regulatory Commission 888 First Street, NE Washington, DC 20426 Re: California Independent System
CONTEMPORARY TRANSMISSION ISSUES:
 CONTEMPORARY TRANSMISSION ISSUES: COST ALLOCATION SESSION 1:00 PM Wisconsin Public Utility Institute May 26, 2010 Panelist: Greg Levesque, Manager - Regional Relations & Policy, ATC, Don Neumeyer, Engineer,
PJM Market Efficiency Benefits Calculation
 PJM Market Efficiency Benefits Calculation Nicolae Dumitriu Sr. Lead Engineer, Market Simulation Market Efficiency Process Enhancement Task Force Education Session February 9, 2018 Market Efficiency Benefits
PROJECT COST TASK FORCE. June 2, 2011
 PROJECT COST TASK FORCE June 2, 2011 Table of Contents Introduction...3 RSC Motion 1...3 Problem Summary...3 RSC Motion 4...3 Problem Summary...3 Project Tracking Current Process...4 PCTF Recommendations...4
This report summarizes key market conditions, developments, and trends for November 2001.
 California Independent System Operator Memorandum To: ISO Board of Governors From: Anjali Sheffrin, Director of Market Analysis CC: ISO Officers, ISO Board Assistants Date: February 1, 22 Re: Market Analysis
Long-Term Reliability Assessment
 Long-Term Reliability Assessment Key Findings and Long-Term Issues John Moura, Director of Reliability Assessment Topics Covered Today Background on NERC s Long-Term Reliability Assessment Emerging and
Market Monitoring Unit. State of the Market Fall 2017
 State of the ket 20 published uary 22, 2018 TABLE OF CONTENTS List of figures... i 1. ket performance highlights... 1 2. Prices and market costs... 3 3. Demand, generation and unit commitment... 21 4.
FIRST QUARTERLY PROJECT TRACKING REPORT 2018 January 2018
 FIRST QUARTERLY PROJECT TRACKING REPORT 2018 January 2018 CONTENTS Executive Summary... 3 NTC Project Summary... 5 NTC Issuance... 7 NTC Withdraw... 7 Completed Projects... 8 Project status summary...
Convergence Bidding Overview. Jenny Pedersen Julianne Riessen Client Training Team
 Convergence Bidding Overview Jenny Pedersen Julianne Riessen Client Training Team Agenda Introductions Defining Convergence Bidding Project Participating in the Markets Registration and Affiliations Eligible
April 6, 2018 VIA OVERNIGHT MAIL. Sheri Young, Secretary of the Board National Energy Board th Avenue SW Calgary, Alberta T2R 0A8
 !! April 6, 2018 VIA OVERNIGHT MAIL Sheri Young, Secretary of the Board National Energy Board 517 10 th Avenue SW Calgary, Alberta T2R 0A8 Re: North American Electric Reliability Corporation Dear Ms. Young:
Wholesale Energy Markets Overview. Jeff Klarer Market Strategist
 Wholesale Energy Markets Overview Jeff Klarer Market Strategist Wisconsin Electric Utility Fuel Rules (PSC-116) Fuel Cost Components Fuel for generation (coal, natural gas, uranium, etc.) Energy market
Five-Minute Settlements Education
 Five-Minute Settlements Education Disclaimer PJM has made all efforts possible to accurately document all information in this presentation. The information seen here does not supersede the PJM Operating
Financial Transmission and Auction Revenue Rights
 Section 13 FTRs and ARRs Financial Transmission and Auction Revenue Rights In an LMP market, the lowest cost generation is dispatched to meet the load, subject to the ability of the transmission system
BEFORE THE NEW MEXICO PUBLIC REGULATION COMMISSION ) ) ) ) ) ) ) ) ) ) ) DIRECT TESTIMONY RUTH M. SAKYA. on behalf of.
 ) ) ) ) ) ) ) ) ) ) DIRECT TESTIMONY RUTH M. SAKYA. on behalf of.") BEFORE THE NEW MEXICO PUBLIC REGULATION COMMISSION IN THE MATTER OF SOUTHWESTERN PUBLIC SERVICE COMPANY S INTERIM REPORT ON ITS PARTICIPATION IN THE SOUTHWEST POWER POOL REGIONAL TRANSMISSION ORGANIZATION,
BEFORE THE NEW MEXICO PUBLIC REGULATION COMMISSION IN THE MATTER OF SOUTHWESTERN PUBLIC SERVICE COMPANY S INTERIM REPORT ON ITS PARTICIPATION IN THE SOUTHWEST POWER POOL REGIONAL TRANSMISSION ORGANIZATION,
UK ELECTRIC MARKET REFORM APPLICATION TO TEXAS POWER MARKET. Ingmar Sterzing CEIC Seminar April 10, 2013
 UK ELECTRIC MARKET REFORM APPLICATION TO TEXAS POWER MARKET Ingmar Sterzing CEIC Seminar April 10, 2013 1 Ingmar Sterzing, Pittsburgh, PA, 2013 UK and ERCOT Strikingly Similar Similar generation infrastructure
First Revised Sheet No. 448 Canceling Original WN U-60 Sheet No. 448 PUGET SOUND ENERGY Electric Tariff G SCHEDULE 448 POWER SUPPLIER CHOICE
 First Revised Sheet No. 448 Canceling Original WN U-60 Sheet No. 448 1. ELIGIBILITY FOR SERVICE POWER SUPPLIER CHOICE All Special Contract Customers, and all Schedule 48 Customers as of March 9, 2001,
UNITED STATES OF AMERICA BEFORE THE FEDERAL ENERGY REGULATORY COMMISSION
 UNITED STATES OF AMERICA BEFORE THE FEDERAL ENERGY REGULATORY COMMISSION ) California Independent System ) Docket No. ER99-3339-000 Operator Corporation ) ) REQUEST FOR REHEARING OF THE CALIFORNIA INDEPENDENT
5. Vorlesung Energiewirtschaft II: Risk Management and Electricity Trade
 5. Vorlesung Energiewirtschaft II: Risk Management and Electricity Trade Georg Zachmann V 5.3-1 - Agenda of Today's Lecture 1) Organizational Issues 2) Summary of Last Weeks Findings 3) Market Efficiency
Transmission Loss Factor Methodology
 Transmission Loss Factor Methodology Discussion Paper Operations & Reliability Draft February 9, 2005 Table of Contents 1. Introduction...3 1.1 Legislative Direction.....3 1.2 Goal and Objectives... 3