The Norwegian Aquaculture Analysis - Summary of key findings
|
|
|
- Lesley Harrison
- 6 years ago
- Views:
Transcription

1 The Norwegian Aquaculture Analysis - Summary of key findings Nordområdekonferansen Bodø - November 9 th 217 Eirik Moe Managing Partner EY Seafood

 in")
2 The EY Aquaculture Analysis Background EY has since 26 issued an annual analysis of the Oilfield Service sector We wanted to do a similar analysis of the Aquaculture industry in Norway The analysis takes a top-down view of the entire value chain The analysis will be performed on an annual basis going forward How Financials based on publically available data The majority of the activity (>5%) in Aquaculture 2


3 Top down perspective on the value chain Technical solutions Biotechnology Production Distribution Processing 3
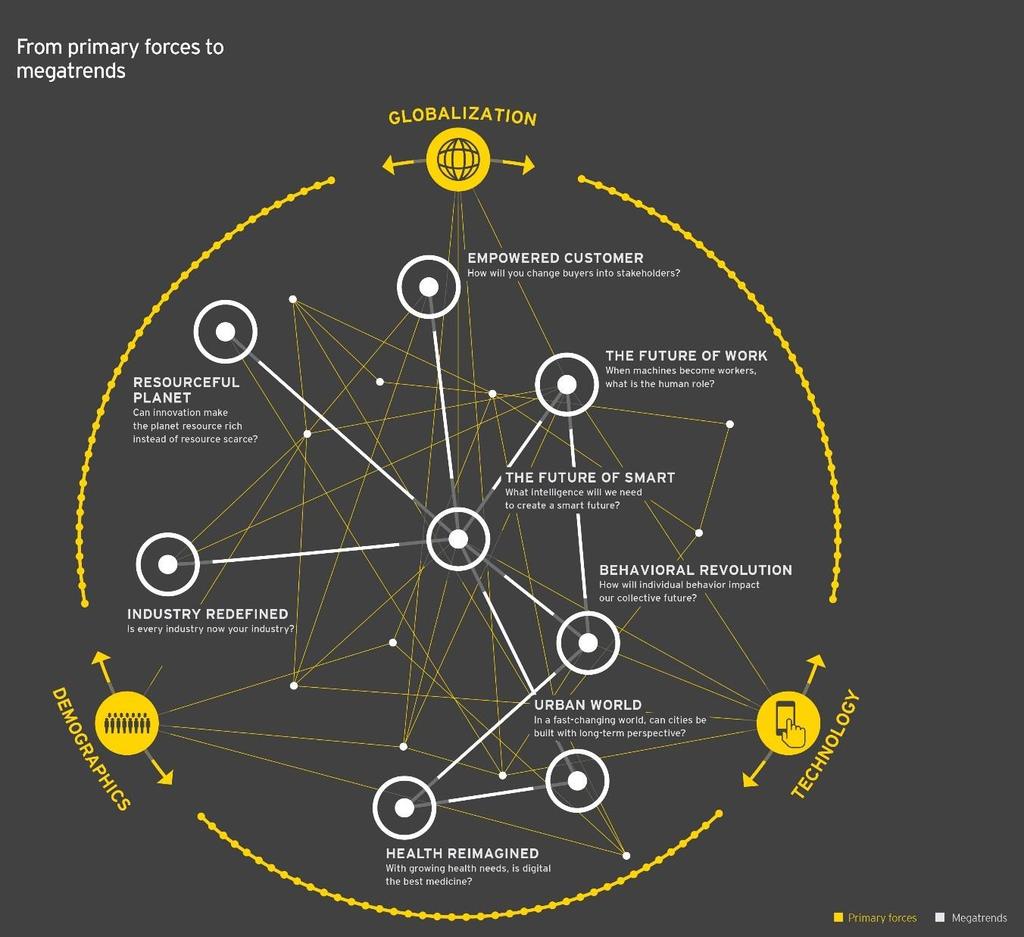


4 Global megatrends Side 4
5 Revenue, NOKb Revenue (NOKb) Financial development in Norwegian Aquaculture Norway Aquaculture revenue and profitability % 25% 2% 15% 1% 5% % Overall trends Revenues up Increase in salmon price has been the key driver the last years, with volume stagnation Norway Aquaculture segments size and growth Revenues EBITDA margin ROCE 6 7 Technology solutions Biotechnology Distribution Production Processing EBITDA and EBIT down.9 ppt. to 1.9% due to relative cost increase related to biological issues and feed ROCE up.7 ppt to 19.% due to reduction in capital employed 5
6 With the continued high salmon prices record high revenues are being recorded for the listed production companies NOKbn NOKbn EBITDA margin High revenues also seen in High sales price per kg lead to 216 being a record year for the aquaculture industry turnover/profits. This trend seems to continue, as 1H17 has seen a revenue increase of about 16% when compared to 1H16. EBIT/kg for 1H17 was NOK 25.8, a significant increase when compared to the NOK 16.2 as at 1H Key figures 1H16 and 1H17 22% 26% H1 216 H % 25.% 2.% 15.% 1.% 5.%.% Revenues Operating expenses EBITDA EBITDA margin Cost increase in spite of a small decline in harvested volume Even with lower harvest volumes in 1H17 than 1H16. Operating costs increased 1% Increasing biological challenges - sea lice / mortality. Personnel cost have increased with close to 21%, Production per FTE has decreased from 215 to 216. Trend is continuing into % 2.6% Breakdown of operating costs 17.7% H1 216 H1 217 H1 216 H1 217 H1 216 H1 217 Cost of goods sold Personnel expenses Other operating expenses 6
7 Revenue, NOKb Correlation with the salmon price Salmon price per kg (annual average) Revenue, NOKb Salmon price per kg (annual average) Revenue Salmon price EBITDA Salmon price 7
8 Costs index per kg sold fish are increasing Cost per kg sold fish Sold amount of slaughtered fish 7 1,6, % 7.8% % 12.3% % % % % ,4, 1,2, 1,, 8, 6, 4, 2, Technical solutions Biotechnology Production Processing Tonnes slaughtered fish 15% 5% 1% 9% 5% CAGR
9 Revenue (NOKb) Technical solutions Biotechnology Production Distribution Processing Segment composition: 8. 3% % 2% 15% Number of companies Revenue 23 % 24 % % 5% 77 % 76 %. % Small < NOK1m Revenues EBITDA margin ROCE Medium NOK1 NOK1,m Large > NOK1b 9
10 Revenue (NOKb) Revenue (NOKb) Technical solutions Biotechnology Production Distribution Processing Fish health: Feed: 3.5 4% % % 3% 25% 2% 15% 1% 5% % % 1% 8% 6% 4% 2% % Revenues EBITDA margin ROCE Revenues EBITDA margin ROCE 1
11 NOKb EBITDA margin Technical solutions Biotechnology Production Distribution Processing 6, 4, % 5, 35, % 3, % 4, 25, % 3, 2, % 2, 1, 15, % 1, % 5, %, , % Seafarming Smolt production Egg production Seafarming EBITDA margin Smolt production EBITDA margin Egg production EBITDA margin 11

12 Tonnes sold salmon (WFE) NOK/kg (wfe) Technical solutions Biotechnology Production Distribution Processing Volume of sold salmon and average value WFE* Percentage of sale from 1 largest companies 1,4, 1,2, 1,, 8, 6, 4, 2, Source: EY, Directorate of Fisheries
13 Revenue (NOKb) Tonnes, round weight Technical solutions Biotechnology Production Distribution Processing Trading Slaughtering Transportation on sea Sold volumes of slaughtered fish (round weight) % 2% 15% 1% 5% % 1,6, 1,4, 1,2, 1,, 8, 6, 4, 2, Revenues EBITDA margin ROCE 13 Source: EY, Directorate of Fisheries
14 Revenue (NOKb) Tonnes No. of plants Technical solutions Biotechnology Production Distribution Processing Trading Slaughtering Transportation on sea Development in slaughtered volume/no. of plants % 14% 12% 1% 8% 6% 4% 2% % 25, 2, 15, 1, 5, Revenues EBITDA margin ROCE Tonnes slaughtered per slaughtering plant No. of approved slaugthering plants for salmonids 14 Source: EY, The Norwegian Food Safety Authority
15 Revenue (NOKb) Number of well boats Technical solutions Biotechnology Production Distribution Processing Trading Slaugthering Transportation on sea Number of wellboats % 45% 4% 35% 3% 25% 2% 15% 1% 5% % Revenues EBITDA margin ROCE 15 Source: EY, Fraktefartøyenes Rederiforening
16 NOKb EBITDA margin Technology solutions Biotechnology Production Distribution Processing 14, 16, % 12, 14, % 1, 8, 6, 4, 2, 12, % 1, % 8, % 6, % 4, % 2, %, Processing Packaging Processing EBITDA margin Packaging EBITDA margin, % 16
17 NOKb EBITDA margin Trends & conclusions.. Key trends and challenges Solve biological issues to allow for volume increases, lower costs and reputation Big Data initiatives and technology transfer offshore & digitalization Production onshore, fjords and offshore depending on life cycle Further consolidation and industrialization of industry segments Increased vertical integration and know-how in value chain: ingredient traceability feed produce differentiating Can salmon and trout become the future top exports of Norway? Replicate the revenue growth from the 1 previous years, the estimate for 23 are within sight Supported by underlying global megatrends, revenues from the Norwegian aquaculture industry may well be higher than the revenues from the oil industry in 25. Considerable potential for export of technology and knowledge to global aquaculture industry 17 Seafarming figures: Inntekter EBITDA EBITDA margin 4% 35% 3% 25% 2% 15% 1% 5% %

18 EY a global partner in Aquaculture A global company The largest assurance, tax and advisory company in Norway Worldwide revenues (217): USD 31.4 billion 25, professionals worldwide across 7 offices in 15 countries 1,8 professionals in 3 locations in Norway Our dedication to Aquaculture EY Global Center of Excellence for the Aquaculture industry is located in Bergen Our industry team is located in more than 5 offices in key aquaculture cities worldwide and comprises a global network of experts with a range of professional skills EY service offering Assurance Advisory Transaction Advisory Serices Tax 18
19 Questions?
The Norwegian Aquaculture Analysis 2016
 The Norwegian Aquaculture Analysis 216 Contents Key findings...5 Introduction...6 Segment analysis...14 Technical solutions...15 Biotechnology...16 Production...19 Distribution...22 Processing...26 Geographical
SalMar ASA. Presentation Q CEO Leif Inge Nordhammer CFO Trond Tuvstein
 SalMar ASA Presentation Q1 2015 CEO Leif Inge Nordhammer CFO Trond Tuvstein Agenda Highlights Financial update Operational update Outlook First quarter 2015 highlights Improved operations Challenging biological
RS Platou Markets. Seafood conference. 10th June 2010
 RS Platou Markets Seafood conference 10th June 2010 Agenda Introduction to Cermaq Highlights Q1 2010 and outlook full year Chile Recovery 2 Overview of Cermaq One of the global leaders in the aquaculture
BAKKAFROST INTRAFISH SEAFOOD INVESTOR FORUM London 13 September 2018
 BAKKAFROST INTRAFISH SEAFOOD INVESTOR FORUM London 13 September 2018 DISCLAIMER This presentation includes statements regarding future results, which are subject to risks and uncertainties. Consequently,
SalMar ASA. Presentation Q CEO Olav-Andreas Ervik CFO Trond Tuvstein
 SalMar ASA Presentation Q1 2018 CEO Olav-Andreas Ervik CFO Trond Tuvstein Olav-Andreas Ervik new CEO of SalMar 41 years, from Frøya More than 20 years of experience from the aquaculture industry Worked
Presentation of Cermaq
 Presentation of Cermaq North Atlantic Seafood Seminar Oslo, 8 th March 2012 Agenda Introduction to Cermaq Key results 2011 Focus on Mainstream Chile Outlook 2012 Photograph: Alf Børjesson 2 This is Cermaq
Q MAY 8TH 2018
 Q1 2018 MAY 8TH 2018 1. Highlights 2. Key Financial Figures 3. Outlook Highlights Klikke for å legge til annet bilde Q1 2018 - EBIT beforefv adj. NOK 960 million - Harvest volume 37576 GWT - EBIT/kg all
Cermaq ASA Presentation for Pareto Securities Oslo, 14 th June 2012
 Cermaq ASA Presentation for Pareto Securities Oslo, 14 th June 2012 1 2020 2015 2010 2005 2000 1995 1990 1985 1980 1975 1970 1965 1960 1955 1950 Aquaculture: a sustainable growth industry Our growing population
Q U A R T E R L Y R E P O R T 2 N D Q U A R T E R
 Q U A R T E R L Y R E P O R T 2 N D Q U A R T E R 2 0 0 7 1. Grieg Seafood develops as planned Grieg Seafood was listed in June, and has now 869 shareholders after 2 shares issues of MNOK 700 in total.
Q NOVEMBER 8TH 2018
 Q3 2018 NOVEMBER 8TH 2018 1. Highlights 2. Key Financial Figures 3. Outlook Highlights Klikke for å legge til annet bilde Q3 2018 - EBIT before FV adj. NOK 660 million - Harvest volume 37 227 GWT - EBIT/kg
Your Aquaculture Technology and Service Partner. Company presentation November 2014
 Company presentation November 2014 Important Information About this Company Presentation This Company Presentation has been prepared by AKVA group ASA ("AKVA group" or the "Company") for information purposes
Q August 24th. Lerøy Seafood Group ASA. CEO Henning Beltestad CFO Sjur S. Malm
 Q2 2017 August 24th Lerøy Seafood Group ASA CEO Henning Beltestad CFO Sjur S. Malm Agenda Highlights Key financial figures Outlook Q2 2017 EBIT before FV adj. NOK 801 million Harvest volume 26 156 GWT
Financial targets and investments in sustainable growth. Atle Harald Sandtorv, CFO
 Financial targets and investments in sustainable growth Atle Harald Sandtorv, CFO 79 Financial targets Growth Target 100 000 tonnes in 2020 2017 62 598 tonnes Cost At or below industry average NOK 37.9/kg
Q November 9th. Lerøy Seafood Group ASA. CEO Henning Beltestad CFO Sjur S. Malm
 Q3 2017 November 9th Lerøy Seafood Group ASA CEO Henning Beltestad CFO Sjur S. Malm Agenda Highlights Key financial figures Outlook Q3 2017 EBIT before FV adj. NOK 861 million Harvest volume 46 024 GWT
Q Nova Austral Financial Reporting May 2nd, 2018
 Q1-2018 Nova Austral Financial Reporting May 2nd, 2018 Agenda A. Nova Austral Pillars & Fundamentals B. Market and company updates C. Financial Report 1) Key Financial summary 2) LTM EBITDA, Revenue and
Villa Organic AS fourth quarter 2012
 Notice to shareholders; Villa Organic AS fourth quarter 2012 Highlights fourth quarter 2012 The average prices were approximately at the same level as Q3, but improvement was observed towards the end of
Disclaimer. We define EBIT as EBITDA less amortizations.
 H1 2012 2 Disclaimer This document is purely informative and does not intend to be comprehensive. Financial information included in this presentation has been calculated in accordance with International
Lerøy Seafood Group. Preliminary financial figures February 25th Helge Singelstad. Alf-Helge Aarskog. Ivan Vindheim.
 Lerøy Seafood Group Preliminary financial figures 2009 February 25th 2010 Helge Singelstad Chairman Alf-Helge Aarskog CEO Ivan Vindheim CFO 1 Agenda 1. 1 Considerations 2. 2 Key financial figures Q4 2009
Highlights for the quarter Q2 / EBIT NOK 60 million pre biomass write-down
 Half year report Highlights for the quarter EBIT NOK 60 million pre biomass write-down EBIT pre fair value and biomass write-down (NOK million) 318 348 300 101 60 Mainstream results negatively impacted
Third QUARTER / 2017
 STRONG OPERATIONS AND IMPROVING BIOLOGY HIGHLIGHTS IN THE THIRD QUARTER Strong operations and effective management of the improving biological situation Lower production costs and higher prices achieved
Lerøy Seafood Group. Quarterly report Second quarter August 19th Helge Singelstad. Ivan Vindheim CEO CFO
 Lerøy Seafood Group Quarterly report Second quarter 2009 August 19th 2009 Helge Singelstad CEO Ivan Vindheim CFO 1 Agenda 1. 1 Considerations 2. 2 Key financial figures Q2 2009 3. 3 Lerøy at a glance 4.
Q BAKKAFROST GROUP Oslo 20 February 2018
 BAKKAFROST GROUP Oslo 20 February 2018 DISCLAIMER This presentation includes statements regarding future results, which are subject to risks and uncertainties. Consequently, actual results may differ significantly
From Copeinca to Mitsubishi and beyond. Jon Hindar CEO London, 31 October 2014
 From Copeinca to Mitsubishi and beyond Jon Hindar CEO London, 31 October 2014 A roller coaster with a happy ending for Cermaq and for the industry Page 2 A roller coaster with a happy ending for Cermaq
P/F Bakkafrost Condensed Consolidated Interim Report for Q and 9 months 2013
 P/F Bakkafrost Condensed Consolidated Interim Report for Q3 2013 and 9 months 2013 15000 10000 5000 0 Harvest volume - TGW Q3 12 Q4 12 Q1 13 Q2 13 Q3 13 Operational EBIT mdkk 200 150 100 50 0 Q3 12 Q4
Chile, que pasa? -an update of the situation for salmon farming in Chile, - issues and potential solutions
 Chile, que pasa? -an update of the situation for salmon farming in Chile, - issues and potential solutions Intrafish / DNB investor conference London, 4 November, 2015 Jon Hindar CEO Cermaq Group The starting
SalMar ASA. Presentation Q CEO Yngve Myhre, CFO Trond Tuvstein Oslo, 14 November w w w. s a l m a r. n o
 Presentation Q3 2013 SalMar ASA CEO Yngve Myhre, CFO Trond Tuvstein Oslo, 14 November 2013 2 Agenda Highlights Financial update Operational update Market and outlook Third quarter highlights Another strong
Q May 12th Oslo
 Q1 2016 May 12th Oslo Lerøy Seafood Group ASA CEO Henning Beltestad CFO Sjur S. Malm Agenda Highlights Key financial figures Outlook Q1 2016 EBIT before FV adj. NOK 584.5 million EBIT/kg all inclusive
THIRD QUARTER / 2018
 REPORT FOR THE THIRD QUARTER 2018 HIGHLIGHTS Operationally strong quarter, with cost improvements and good price achievement. Record-high volume for sales & processing with positive contribution Total
 - - - - - - - 20 000 15 000 10 000 5 000 0 2017 2014 2013 2012 2011 2010 2009 2008 2007 2006 2005 2004 2003 2002 2001 2000 1999 1995 1 400 30 1 200 25 1 000 800 600 400 777 20 15 10 16,5 200 5 0 0 Q4/17
Results Presentation 3Q17
 Multiexport Foods S.A. Results Presentation 3Q17 Santiago, November 2017 Agenda I. Highlights II. III. Financial Statements Supply, Demand and Prices IV. Farming Operation V. Perspectives 2 Highlights
Interim Report Q2-17
 Interim Report Q2-17 HIGHLIGHTS Operational EBIT of NOK 136 million o o o Operational EBIT per kg of NOK 29.68 in Region North Operational EBIT per kg of NOK 31.30 in Region South Non-recurring item of
Interim Report Q4-17
 Interim Report Q4-17 HIGHLIGHTS Operational EBIT of NOK 95 million o o Operational EBIT per kg of NOK 15.84 in Region North Operational EBIT per kg of NOK 14.12 in Region South The highest sold volume
Austevoll Seafood ASA
 Austevoll Seafood ASA Financial Report Q4 2016 and preliminary figures for 2016 INDEX Key figures for the group... 03 Q4 2016... 04 Operating segments... 04 Cash Flows Q4 2016... 06 Cash flows 2016...07
EMPRESAS AQUACHILE S.A. RESULTS FOR 1 TH QUARTER May 2015
 EMPRESAS AQUACHILE S.A. RESULTS FOR 1 TH QUARTER 2015 May 2015 1. About Empresas AquaChile S.A. 03 2. Quarterly Summary 04 3. Analysis of Results 06 4. Balance Sheet Analysis 13 5. Cash Flow Analysis 15
Interim Report Q2-18
 Interim Report Q2-18 HIGHLIGHTS Operational EBIT of NOK 181 million o Operational EBIT per kg of NOK 24.73 in Region North o Operational EBIT per kg of NOK 23.49 in Region South o Non-recurring item of
Q BAKKAFROST GROUP Oslo 19 February 2019
 BAKKAFROST GROUP Oslo 19 February 2019 DISCLAIMER This presentation includes statements regarding future results, which are subject to risks and uncertainties. Consequently, actual results may differ significantly
Q Financial presentation. Arne Møgster CEO Britt Kathrine Drivenes CFO
 Q4 2014 Financial presentation Arne Møgster CEO Britt Kathrine Drivenes CFO Highlights All figures in NOK 1,000 Q4 2014 Q4 2013 (restated) 2014 2013 (restated) Revenue 3 704 689 3 725 710 14 344 177 12
Q BAKKAFROST GROUP Oslo 21 August 2018
 BAKKAFROST GROUP Oslo 21 August DISCLAIMER This presentation includes statements regarding future results, which are subject to risks and uncertainties. Consequently, actual results may differ significantly
Interim Report Q1-18
 Interim Report Q1-18 HIGHLIGHTS Operational EBIT of NOK 193 million o o Operational EBIT per kg of NOK 19.22 in Region North Operational EBIT per kg of NOK 15.64 in Region South The highest sold and harvested
Aker Seafoods Second quarter 2010 Profits improved in high season
 Aker Seafoods Second quarter 21 Profits improved in high season CEO Liv Monica B Stubholt CFO Gunnar Aasbø-Skinderhaug Welcome Agenda Topic Speaker Operational Update Liv Monica Stubholt, CEO Group Harvesting
Grieg Seafood ASA. griegseafood.com. Andreas Kvame CEO. Atle Harald Sandtorv CFO. 8 November 2017
 Grieg Seafood ASA Andreas Kvame CEO Atle Harald Sandtorv CFO 8 November 2017 1 Agenda Highlights This is Grieg Seafood Business Units (Regions) Financials Outlook 2 Highlights Q3 2017 Improved results
Q Financial presentation. Arne Møgster CEO Britt Kathrine Drivenes CFO
 Q2 2015 Financial presentation Arne Møgster CEO Britt Kathrine Drivenes CFO Highlights All figures in NOK 1,000 Q2 2015 (restated) Q2 2014 H1 2015 (restated) H1 2014 2014 Revenue 4 107 801 3 606 154 7
Grieg Seafood ASA Quarterly report Q4 2018
 bv Grieg Seafood ASA Quarterly report ABOUT GRIEG SEAFOOD Grieg Seafood ASA is one of the world's leading salmon farmers, specializing in Atlantic salmon. The Group has an annual production target of 100
PRESENTATION Q Oslo, 19 February 2013 John Binde, CEO Ola Loe, CFO
 PRESENTATION Q4 2012 Oslo, 19 February 2013 John Binde, CEO Ola Loe, CFO AGENDA: Highlights for the period Segment information Group financials Outlook 2 Highlights in Q4 2012: Significant improvement
FOURTH QUARTER / 2014
 SATISFACTORY RESULT DESPITE BIOLOGICAL CHALLENGES HIGHLIGHTS IN THE FOURTH QUARTER 2014 Good salmon prices and high harvested volume produced profit growth and record operating revenues. 50% of the harvested
Dette billede kan ikke vises i øjeblikket. Q FOURTH QUARTER BAKKAFROST GROUP Glyvrar 25 February 2014
 Dette billede kan ikke vises i øjeblikket. Q4 2013 FOURTH QUARTER BAKKAFROST GROUP Glyvrar 25 February 2014 DISCLAIMER This presentation includes statements regarding future results, which are subject
Q THIRD QUARTER BAKKAFROST GROUP Glyvrar 5 November 2013
 Q3 2013 THIRD QUARTER BAKKAFROST GROUP Glyvrar 5 November 2013 DISCLAIMER This presentation includes statements regarding future results, which are subject to risks and uncertainties. Consequently, actual
i figures 2007 February 26 th 2008 Ole-Eirik Lerøy President & CEO
 Lerøy Seafood Group Preliminary i financial i figures 2007 February 26 th 2008 Ole-Eirik Lerøy President & CEO Agenda 1. 1 Considerations 2. 2 Key financial i figures Q4 2007 3. Lerøy at a glance 4. 4
Marine Harvest. Q Presentation 10 May 2017
 Marine Harvest Q1 2017 Presentation 10 May 2017 1 Forward looking statements This presentation may be deemed to include forward-looking statements, such as statements that relate to Marine Harvest s contracted
Q Financial presentation. Arne Møgster CEO Britt Kathrine Drivenes CFO
 Q2 2017 Financial presentation Arne Møgster CEO Britt Kathrine Drivenes CFO Highlights All figures in NOK 1,000 Q2 2017 Q2 2016 H1 2017 H1 2016 2016 Revenue 5 019 195 4 558 229 11 094 149 8 970 468 18
FOURTH QUARTER / 2016
 SATISFACTORY RESULT DESPITE BIOLOGICAL CHALLENGES HIGHLIGHTS IN THE FOURTH QUARTER 2016 Continued high salmon prices result in revenue and profit growth. High production costs for part of the volume harvested
Lerøy Seafood Group SEPTEMBER 2018
 Lerøy Seafood Group SEPTEMBER 2018 1. Lerøy Seafood Group 2. Key market trends supply and demand Our vision To be the leading and most profitable global supplier of sustainable high-quality seafood History
Sølvtrans Holding ASA Q Oslo, 7 November Roger Halsebakk, CEO Jon Kvalø, CFO
 Sølvtrans Holding ASA Q3 2012 Oslo, 7 November 2012 Roger Halsebakk, CEO Jon Kvalø, CFO 1 Highlights in the quarter 2 Financial review 3 Operational and market review 4 Summary and outlook 5 Appendix Highlights
Marine Harvest. Q Presentation 24 August 2017
 Marine Harvest Q2 2017 Presentation 24 August 2017 1 Forward looking statements This presentation may be deemed to include forward-looking statements, such as statements that relate to Marine Harvest s
Marine Harvest. Q Presentation 1 November 2017
 Marine Harvest 1 Q3 2017 Presentation 1 November 2017 Forward looking statements This presentation may be deemed to include forward-looking statements, such as statements that relate to Marine Harvest
Marine Harvest. Q Presentation 22 August 2018
 Marine Harvest Q2 2018 Presentation 22 August 2018 Forward looking statements This presentation may be deemed to include forward-looking statements, such as statements that relate to Marine Harvest s contracted
Lerøy Seafood Group Quarterly report 3rd Quarter 2005 November 10th 2005 Ole-Eirik Lerøy President & CEO Helge Singelstad Vice president & vice CEO
 Lerøy Seafood Group Quarterly report 3rd Quarter 2005 November 10 th 2005 Ole-Eirik Lerøy President & CEO Helge Singelstad Vice president & vice CEO Agenda 1. 1 Considerations 2. 2 Key financial figures
NORWAY ROYA L S A L M ON PRESENTATION Q Oslo, 7 November 2017 Charles Høstlund, CEO Ola Loe, CFO 1
 PRESENTATION Q3 2017 Oslo, 7 November 2017 Charles Høstlund, CEO Ola Loe, CFO 1 AGENDA: Highlights for the period Segment information Group financials Markets Outlook 2 Highlights in Q3 2017 Operational
Santiago, May 11 th, Results Presentation 1Q18
 Santiago, May 11 th, 2018 Results Presentation 1Q18 Agenda I. Highlights II. III. Financial Statements Supply, Demand and Prices IV. Farming Operation V. Prospects 2 Highlights EBIT 1Q18 USD 18.8 million
Your Aquaculture Technology and Service Partner. Q Presentation Oslo - May 8 th, 2015 Trond Williksen, CEO Eirik Børve Monsen, CFO
 Q1 2015 Presentation Oslo - May 8 th, 2015 Trond Williksen, CEO Eirik Børve Monsen, CFO Agenda 1 Highlights 2 Financial performance 3 Outlook 4 Q&A Highlights Q1 2015 - by CEO Trond Williksen 3 On track
Marine Harvest Q Presentation
 Marine Harvest Q1 2015 Presentation Forward looking statements This presentation may be deemed to include forward-looking statements, such as statements that relate to Marine Harvest s contracted volumes,
Marine Harvest Q Presentation
 Marine Harvest Q2 2015 Presentation Forward looking statements This presentation may be deemed to include forward-looking statements, such as statements that relate to Marine Harvest s contracted volumes,
Strategic pricing challenges from a buyer s perspective
 Strategic pricing challenges from a buyer s perspective A Cluster Partner Fish Pool / DNB Brussels Seminar, 24. April 2017 Dag Sletmo, dag.sletmo@dnb.no, tel +47 95286134 DNB Bank is a global seafood player
P/F Bakkafrost. Condensed Consolidated Interim Report for Q and 12 Months Operational EBIT mdkk
 P/F Bakkafrost Condensed Consolidated Interim Report for Q4 2015 and 12 Months 2015 Harvest volume TGW 15,000 12,000 9,000 6,000 3,000 Q4 14 Q1 15 Q2 15 Q3 15 Q4 15 Operational EBIT mdkk 300 250 200 150
The answers to your questions.
 The answers to your questions. By / Ragnar Nystøyl CHRISTMAS SEMINAR Bergen, 19. November 2014 Agenda - Norwegian Production & Supply issues - Global Production & Supply issues - Market- & Price-related
SalMar ASA First quarter
 SalMar ASA First quarter 2009 1 STRONG SALMON PRICES AND SATISFACTORY EARNINGS Strong salmon prices contributed to satisfactory earnings for the SalMar Group in the first quarter 2009. While Scottish Sea
Your Aquaculture Technology and Service Partner. Company presentation August 2016
 Company presentation August 2016 Important Information About this Company Presentation This Company Presentation has been prepared by AKVA group ASA ("AKVA group" or the "Company") for information purposes
Lerøy Seafood Group. Quarterly report 2nd Quarter August 12 th Ole-Eirik Lerøy President & CEO Helge Singelstad Vice president & vice CEO
 Lerøy Seafood Group Quarterly report 2nd Quarter 2005 August 12 th 2005 Ole-Eirik Lerøy President & CEO Helge Singelstad Vice president & vice CEO Agenda 1. 1 Considerations 2. 2 Key financial figures
Villa Organic AS forth quarter 2009
 Villa Organic AS forth quarter 29 Highlights Forth quarter 29 The fourth quarter was a good quarter for the Villa Group. The EBIT was 12,1 MNOK and net profit before tax 8,8 MNOK The harvested volume in
Q BAKKAFROST GROUP Oslo 10 May 2016
 2016 BAKKAFROST GROUP Oslo 10 May 2016 DISCLAIMER This presentation includes statements regarding future results, which are subject to risks and uncertainties. Consequently, actual results may differ significantly
Q BAKKAFROST GROUP New York 19 May 2016
 2016 BAKKAFROST GROUP New York 19 May 2016 DISCLAIMER This presentation includes statements regarding future results, which are subject to risks and uncertainties. Consequently, actual results may differ
Presentation Q Oslo, 8 May Charles Høstlund, CEO Ola Loe, CFO
 Presentation Q1 2018 Oslo, 8 May 2018 Charles Høstlund, CEO Ola Loe, CFO Agenda 1. Highlights for the period 2. Segment information 3. Group financials 4. Markets 5. Projects for growth 6. Outlook 2 Highlights
Presentation Q Oslo, 6 November Charles Høstlund, CEO Ola Loe, CFO
 Presentation Q3 2018 Oslo, 6 November 2018 Charles Høstlund, CEO Ola Loe, CFO Agenda 1. Highlights for the period 2. Segment information 3. Group financials 4. Markets 5. Projects for growth 6. Outlook
Q Financial presentation. CEO - Arne Møgster CFO - Britt Kathrine Drivenes
 Q2 2018 Financial presentation CEO - Arne Møgster CFO - Britt Kathrine Drivenes Highlights All figures in NOK 1,000 Q2 2018 Q2 2017 H1 2018 H1 2017 2017 Revenue 6 001 380 5 019 195 11 754 529 11 094 149
15,000 12, , , , ,158 13,004 12, , ,664
 15,000 12,000 13,004 10,934 12,940 13,158 10,664 350 307 300 9,000 335 255 254 30 26.34 21.58 22.26 23.22 16 Q2 16 Q3 16 24.33 20 200 6,000 10 100 3,000 0 400 16 Q2 16 Q3 16 Q4 16 17 0 16 Q2 16 Q3 16 Q4
Q Financial presentation. CEO - Arne Møgster CFO - Britt Kathrine Drivenes
 Q3 2018 Financial presentation CEO - Arne Møgster CFO - Britt Kathrine Drivenes Highlights All figures in MNOK Q3 2018 Q3 2017 YTD Q3 2018 YTD Q3 2017 2017 Revenue 5 317 4 903 17 072 15 997 20 799 EBITDA*
Lerøy Seafood Group. Preliminary financial figures February 24 th Ole-Eirik Lerøy. Helge Singelstad. President & CEO
 Lerøy Seafood Group Preliminary financial figures 2005 February 24 th 2006 Ole-Eirik Lerøy President & CEO Helge Singelstad Vice president & vice CEO Agenda 1. 1 Considerations 2. 2 Preliminary financial
Lerøy Seafood Group. Quarterly report First quarter May 12th Helge Singelstad. Henning Beltestad. Ivan Vindheim.
 Lerøy Seafood Group Quarterly report First quarter 2010 May 12th 2010 Helge Singelstad Chairman Henning Beltestad CEO Ivan Vindheim CFO 1 Agenda 1. 1 Considerations 2. 2 Key financial figures Q1 2010 3.
Financial report Q3 2014
 Financial report Q3 2014 Austevoll Seafood ASA Financial report Q3 2014 Index Key figures for the Group... 03 Q3 2014... 04 Operating segments... 04 Cash flows... 05 Financial information as of 30 September
GSF Quarterly report - English version
 GSF Quarterly report - English version Q1 2018 About Grieg Seafood Grieg Seafood ASA is one of the world s leading salmon farmers. The Group has an annual production capacity of more than 100,000 tons
PRESENTATION Q Oslo, 15 August 2013 John Binde, CEO Ola Loe, CFO
 PRESENTATION Q2 2013 Oslo, 15 August 2013 John Binde, CEO Ola Loe, CFO AGENDA: Highlights for the period Segment information Group financials Outlook 2 Highlights in Q2 2013: Best quarterly operational
Marine Harvest. Q Presentation 14 February 2018
 Marine Harvest Q4 2017 Presentation 14 February 2018 1 Forward looking statements This presentation may be deemed to include forward-looking statements, such as statements that relate to Marine Harvest
Harvest volume (GW) tonnes. Operating revenue NOK million. Operational EBIT NOK million Q2 11 Q3 11 Q4 11 Q1 12 Q2 12 Q2 11 Q3 11 Q4 11 Q1 12 Q2 12
 tonnes. Operating revenue NOK million. Operational EBIT NOK million Q2 11 Q3 11 Q4 11 Q1 12 Q2 12 Q2 11 Q3 11 Q4 11 Q1 12 Q2 12") The market showed strong ability to absorb 30% industry growth Prices in line with Q1 - Down 24% in Europe and ~35% in the US compared to Q2 2011 Satisfactory performance in Norway - excellent result in
The market showed strong ability to absorb 30% industry growth Prices in line with Q1 - Down 24% in Europe and ~35% in the US compared to Q2 2011 Satisfactory performance in Norway - excellent result in
PRESENTATION Q Oslo, 14 November 2012 John Binde, CEO Ola Loe, CFO
 PRESENTATION Q3 2012 Oslo, 14 November 2012 John Binde, CEO Ola Loe, CFO AGENDA: Highlights for the period Segment information Group financials Outlook 2 Highlights in Q3 2012: Strong consumption growth
ANNUAL REPORT MARINE HARVEST
 2007 ANNUAL REPORT MARINE HARVEST 2007 was a year of contrasts. While most Marine Harvest Business Units showed solid development in their operations, there were major challenges in Chile. MArine MArine
Austevoll Seafood ASA Q1 2009
 Q1 2009 Ole Rasmus Møgster Chairman Britt Kathrine Drivenes CFO Disclaimer This Presentation has been produced by (the Company or Austevoll ) solely for use at the presentation to the market held in connection
LERØY SEAFOOD GROUP. Quarterly report Third quarter 2010 November 4th Henning Beltestad. Ivan Vindheim CEO CFO
 LERØY SEAFOOD GROUP Quarterly report Third quarter 2010 November 4th 2010 Henning Beltestad CEO Ivan Vindheim CFO 1 Agenda 1. 1 Considerations 2. 2 Key financial figures Q3 2010 3. 3 Lerøy at a glance
Pareto Investor & Finance Seminar «Key value drivers in whitefish harvesting» Webjørn Barstad, CEO HAVFISK ASA
 Pareto Investor & Finance Seminar «Key value drivers in whitefish harvesting» Webjørn Barstad, CEO HAVFISK ASA HAVFISK ASA Agenda HAVFISK in brief Key financial deliveries Value-drivers Outlook Company
Consolidated Financial Statements 2017
 Notes Table of to contents the consolidated financial statements Consolidated Financial Statements 2017 The consolidated financial statements consist of 97 Key figures 98 Income statement 99 Statement
Austevoll Seafood ASA
 Austevoll Seafood ASA Financial Report Q3 2017 Index Key figures for the Group...03 Q3 2017...04 Operating segments...04 Cash flow Q3 2017...07 Financial factors at 30 September 2017...07 Cash flows at
Grieg Seafood ASA. griegseafood.com. Andreas Kvame CEO. Atle Harald Sandtorv CFO. 11 November 2016
 Grieg Seafood ASA Andreas Kvame CEO Atle Harald Sandtorv CFO 11 November 2016 1 Agenda Highlights Business Units (Regions) Financials Outlook 2 HIGHLIGHTS Q3 2016 3 Highlights Q3 2016 Good quarterly results
Q1 Financial Presentation. Arne Møgster CEO Britt K. Drivenes - CFO
 Q1 Financial Presentation Arne Møgster CEO Britt K. Drivenes - CFO As a globally integrated pelagic fishery and seafood specialist, (AUSS) operates through subsidiaries and associated companies, fishing
LERØY SEAFOOD GROUP. Quarterly report Second quarter August 22 th Henning Beltestad. Sjur S. Malm CEO CFO
 LERØY SEAFOOD GROUP Quarterly report Second quarter 2013 August 22 th 2013 Henning Beltestad CEO Sjur S. Malm CFO 1 1 Agenda 1. 1 Considerations 2. 2 Key financial figures Q2 2013 3. 3 Market glance 4.
PRESENTATION Q Oslo, 26 February 2014 John Binde, CEO Ola Loe, CFO
 PRESENTATION Q4 2013 Oslo, 26 February 2014 John Binde, CEO Ola Loe, CFO AGENDA: Highlights for the period Segment information Group financials Outlook 2 Highlights in Q4 2013: The best quarterly and yearly
LERØY SEAFOOD GROUP. Quarterly report Third quarter November 13 th Henning Beltestad. Sjur S. Malm CEO CFO
 LERØY SEAFOOD GROUP Quarterly report Third quarter 2013 November 13 th 2013 Henning Beltestad CEO Sjur S. Malm CFO 1 1 Agenda 1. 1 Considerations 2. 2 Key financial figures Q3 2013 3. 3 Market glance 4.
Lerøy Seafood Group. Quarterly report First quarter May 12th Helge Singelstad. Ivan Vindheim CEO CFO
 Lerøy Seafood Group Quarterly report First quarter 2009 May 12th 2009 Helge Singelstad CEO Ivan Vindheim CFO Agenda 1. 1 Considerations 2. 2 Key financial figures Q1 2009 3. 3 Lerøy at a glance 4. 4 Market
Lerøy Seafood Group. 1 st quarterly report May 15 th. Ole-Eirik Lerøy CEO. Helge Singelstad CFO
 Lerøy Seafood Group 1 st quarterly report 2003 May 15 th Ole-Eirik Lerøy CEO Helge Singelstad CFO Contents Sections Page I Considerations 3 II Key financial figures Q1 2003 9 III Lerøy at a glance 19 IV
Contents. Highlights Financial key figures 4 Vision & values 6 This is Cermaq 7. Mainstream 12. Other activities 22
 Annual report Contents Highlights 2007 3 Financial key figures 4 Vision & values 6 This is Cermaq 7 CEO s COMMENTS 10 Mainstream 12 EWOS 16 EWOS innovation 20 Other activities 22 DIRECTORS REPORT 24 ANNUAL
LERØY SEAFOOD GROUP. Quarterly report Preliminary financial figures February 25 th Henning Beltestad. Sjur S.
 LERØY SEAFOOD GROUP Quarterly report Preliminary financial figures 2013 February 25 th 2014 Henning Beltestad CEO Sjur S. Malm CFO 1 1 Agenda 1. 1 Considerations 2. 2 Key financial figures Q4 2013 3. 3
Annual Report April March 2018
 Annual Report 2017 1 April 2017-31 March 2018 Photo: Kenneth Soløy The BOARD OF DIRECTORS ANNUAL REPORT for fiscal year 2017 Cermaq Group AS has 18 wholly owned subsidiaries, of which Cermaq Norway AS,