Commodity Market Monthly
|
|
|
- Harvey Griffith
- 6 years ago
- Views:
Transcription


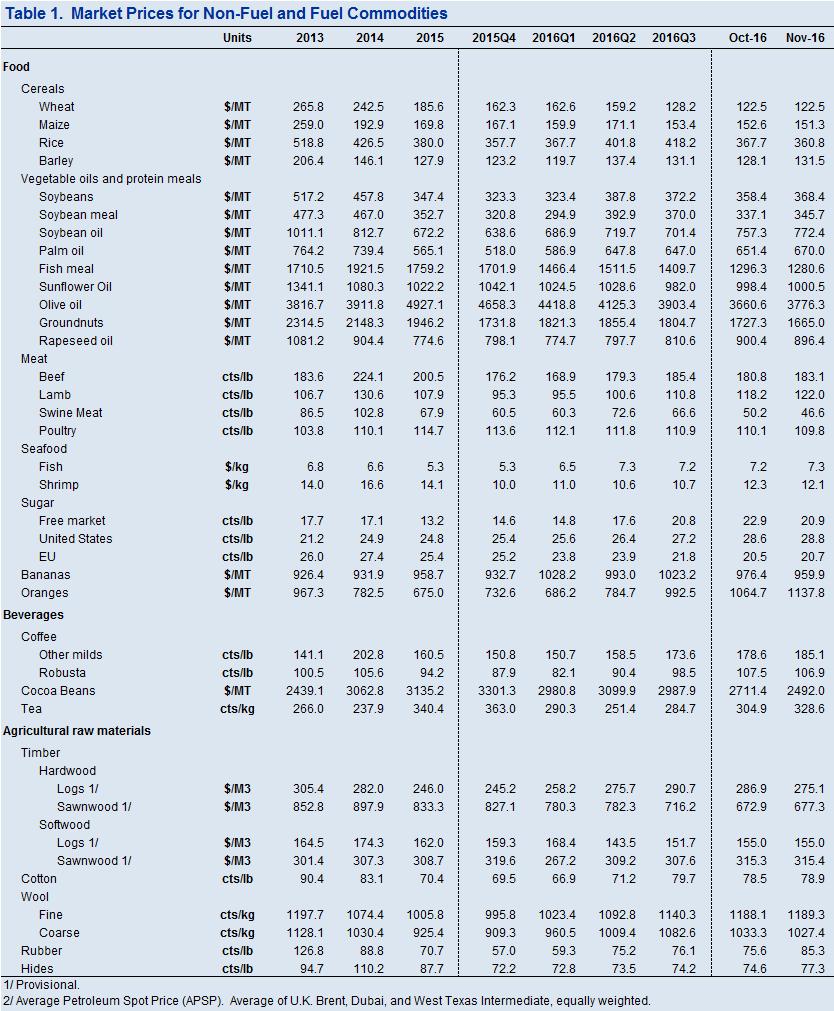
1 Commodity Market Monthly Research Department, Commodities Unit December 2, Commodity prices fell by 1.4 percent in November. This slight decrease in the IMF s commodity price index comes on account of a substantial decrease of 5.4 percent in energy prices, a jump in the price of metals, by 12.2 percent, and a moderate price increase of.5 percent for raw agricultural materials (Figure 1). Prices of food and beverages stayed roughly constant. For the first eleven months of 216 commodity prices climbed 18 percent, led by a 23 percent surge in crude oil prices, followed by increases in metals and agriculture prices of 29 and 7 percent, respectively. Over the last twelve months, the costs of solar photovoltaic (PV), onshore wind and offshore wind have fallen by 17.5, 17.4 and 27.5 percent respectively Figure 1 IMF Commodity Price Indices (5 = ) Non-Energy Total Energy 4 Jan-12 Jan-13 Jan-14 Jan-15 Jan-16 Energy Monthly average crude oil prices declined 8.1 percent in November to $45.28/bbl. During the month of November (the end of November from the end of October), Average Petroleum Spot Price (simple average. of U.K. Brent, Dubai Fateh, and West Texas Intermediate; APSP) increased 4.1 percent. On November 3, the Organization of Petroleum Exporting Countries (OPEC) agreed to reduce crude oil output to 32.5 million barrels per day (mbd), effective January 217 and for a duration of six months (extendable for another six months). That deal would imply a cut in production by 1.2 mbd from its current production level. While Saudi Arabia, Iraq, UAE and Kuwait will bear the brunt of the cuts, other member countries such as Iran, Nigeria, and Libya have been exempted. Indonesia's membership that accounted for.75 mbd of production has been suspended. At OPEC and non-opec meeting on December 1 in Vienna, additional cuts amounting to about.6 mbd have been agreed upon. Russia, a non-opec member, has committed to reducing production by.3 mbd, ten other non-opec countries will contribute the 1
2 remainder. 1 Following the agreement, Saudi Arabia has indicated it could cut production beyond its initial commitment in a bid to further support the rally in oil prices. The actual impact of the agreement will depend on the degree of compliance by OPEC countries, non-opec oil producers cooperation, and shale responses. In the past, OPEC members tended to produce more than their quota to meet their finance needs. In addition to the issue of quota compliance, an exempted Nigeria can produce 5 kbd more once they control the Niger delta. Libya s production is hard to predict as its civil war situation determines export. Most importantly, shale production might rebound strongly with future prices hovering around $55. Future curves are almost flat around the horizon just below $55, implying shale producers might have already taken hedge positions. The breakeven cost of shale production has dropped dramatically following the oil price collapse due to a reduction in service cost, a focus on extraction from the most productive fields, and technological progress. The oil rig count has rebounded by 5 percent after reaching its lowest level in May 216. The U.S. Energy Information Administration (EIA) sees that shale production has stabilized already and will increase gradually next year. With the recent increase of the oil price, markets might see another upside in shale production. Figure 2 On the demand side, the International Energy Agency (IEA) maintained its 1.2 mbd oil demand growth projection for 216 and 217. A slowdown in China or India may have significant effects on oil demand as they account for roughly a quarter of demand growth. According to the International Energy Agency (IEA), China and India s oil demands are expected to grow by.26 and.27 mbd respectively next year. If protectionist measures were to spread widely global trade could slow down significantly, which in turn would reduce oil demand. In the 216 October WEO the IMF projected global growth to slow to 3.1 percent in 216 before recovering to 3.4 percent in 217. After hitting record low prices of $42.71 in 216, futures contracts point to oil prices (APSP) increasing gradually to $51.22 in 217 and $53.5 in 218 (Figure 2). Day's Oil Future Curves ($/barrel) Brent WTI Months to expiration The list of non-opec countries involved in the OPEC non-opec agreement consists of Azerbaijan, Bahrain, Brunei, Equatorial Guinea, Kazakhstan, Malaysia, Mexico, Oman, Russia, Sudan and South Sudan. 2
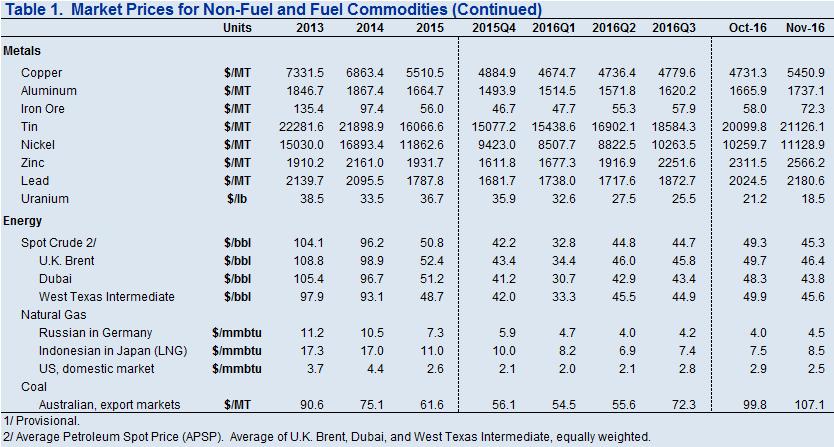
3 Figure 3 2 Jan-12 Jan-13 Jan-14 Jan-15 Jan-16 Average monthly natural gas price in the U.S. fell sharply by 15.2 percent in November, averaging $2.5/MMBtu compared to October s $2.95/MMBtu due to warm weather. However, as the weather is getting colder, natural gas prices increased to $3.3 at the end of November from 2.79 at the end of October. In Europe, long term contract prices have increased 13.2 percent to $4.54/MMBtu; however, spot prices have been relatively flat due to ample supply from Gazprom. The long term contract prices follow moving average of oil prices with a lag of a few quarters. If oil prices stabilize as future prices indicates, then long term contract prices are expected to grow gradually. LNG spot prices in Asia have been increasing gradually on account of rising demand during the winter. Crude Oil Prices ($/barrel) Dubai Brent WTI prices is mostly a temporary phenomenon, coal prices are expected to decline sharply within six months or so Figure 4 4 Jan-12 Jan-13 Jan-14 Jan-15 Jan IMF Commodity Price Indices (5 = ) Metals Agriculture Energy Figure 5 IMF Commodity Price Indices (5 = ) Vegetable Oils & Meal Cereals Beverages Meat Seafood Jan-12 Jan-13 Jan-14 Jan-15 Jan-16 Coal prices (Australia) continued to increase, rising by 7.3 percent to a 2-year high. On the supply side, this is driven by a shortage in China on account of industry restructuring that reduced supply and the economic stimulus that increased demand. Supply disruptions in Australia further added to the shortfall. In response to higher costs facing steel producers, from increased coking coal prices, China has begun slowing down the restructuring process of the coal industry by allowing more production. Since the surge in coal Metals Base Metal Market The IMF s metal index (based on 8 base metals) increased 12.1 percent in November. Except for uranium, which continues to decline, all base metals show a substantial increase from the strong Chinese demand and expectations of increased infrastructure demand after the U.S. presidential election. China s manufacturing Purchasing Managers Index (PMI) remains above 5 since July indicating expansion. That 3
4 contributed to ease the pessimism over the Chinese economy. During November, iron ore and copper prices increased sharply, thereby accounting for the bulk of the price increase of the index. Indeed, much of the price increase of iron ore is explained by Chinese demand for steel for its construction industry. The same is true for zinc (used to produce galvanized steel), nickel (used to produce stainless steel), and copper (used in electric wiring) to varying degrees. Following the win of Donald Trump in the U.S. presidential election metal prices have rallied further on account of his announced $1 trillion infrastructure spending plan. This year s price rally is also attributable to supply constraints resulting from declining investments and the closure of highcost mining operations during the past era of low prices. Other factors affecting specific markets include: (i) the Philippine government mandated closures of nickel mines for environmental violations, (ii) Indonesia s recent announcement that it is unlikely to lift its ore export ban (bauxite and nickel ore), and (iii) China s closure of tin mines for environmental concerns. Despite these recent bullish developments, it must be noted that the steel industry is still characterized by excess capacity and iron ore future prices show significant decline. The potential growth in copper demand from the U.S. should not be overestimated as the U.S. share of world copper consumption is relatively small and they rely heavily on recycled copper. Lead prices continued to rise, due to strong seasonal demand for batteries and reduced supply from zinc mine closures, lead being a byproduct of zinc mining. Aluminum prices remained flat in November, on account of oversupply and large inventories. After a large increase this year, tin prices flattened in November, as shipments from Myanmar offset supply drops caused by China and Indonesia. Table 1: Current Base Metal Prices and % changes Metal (as of November 3, 216 closing) Price (USD) Precious Metals Market % change Monthly Precious metal prices declined sharply in November as long term yield started to increase. Gold prices fell 11% in November. Before the US Presidential election, gold prices had been increasing in spite Fed officials hinting at a rate hike in the near term. Since the election, with markets expecting an increase in fiscal spending, the price of gold has fallen sharply, standing at USD 1,178/troy ounce as of November 3 th. Year- to- Date Copper 5,813/MT Aluminum 1,731/MT Tin 21,32/MT Nickel 11,196/MT Zinc 2,688/MT Lead 2,351/MT Iron Ore 74.5/MT Uranium 17.75/lb Sources: London Metal Exchange (Copper, aluminum, tin, nickel, zinc, and lead); DataStream CIF China United States (FE63.5%, iron ore); and New York Mercantile Exchange (uranium). 4
5 Table 2: Current Precious Metal Prices and % Metal Agriculture changes (as of November 3, 216) Price (USD) The price index of food and beverages changed very little in the month of November. The food price index remained roughly constant on a month-to-month basis, increasing by.1 percent, but the price index of beverages declined by 1.2 percent. While aggregate indices thus show little price changes for food and beverages in November, they hide a considerable variety across different commodities; cocoa, pork and sugar recorded heavy losses, but others such as soybean, coffee Arabica and oranges experienced moderate to large gains. Agricultural raw material prices increased by 4.1 percent. Food prices decline substantially over the last few years, but they had been steadily increasing again in the first half of the year, mainly supported by a surge in prices of sugar and pork, as well as substantial increases for barley, oranges, palm oil and soybeans. Since July this year, grains, pork, soybeans and cocoa have recorded sizeable losses, thereby putting downward pressure on the IMF s price index of food and beverages, and undoing most of the gains that were made in the first six months of 216. Monthly % change Year-to- Date Gold 1,178/toz Silver 16.7/toz Platinum 92/oz Palladium 77/oz Sources: ICE Benchmark Administration (gold), London Bullion Metal Association (silver), and London Metal Exchange (platinum and palladium) Annual food prices now are projected to stay broadly unchanged in 216 and decrease by 3 percent in 217; while current price levels are down by more than 2 percent since their record high in 211, prices in 216 were still up by more than 4 percent from their pre-crisis 5 level. In 217, prices of many major food products, such as cereals and seafood, are expected to decline from current levels. Vegetable oils, which are expected to increase by 2.5 percent, constitute a noteworthy exception to the price decline. Rising costs of energy and weather variability, including concerns over La Niña, constitute upside risks to the price forecast. Downside risks include increased agricultural supplies from China, which is bringing its accumulated stocks to market now that the Chinese government is dismantling its price floor systems. The price of wheat stayed roughly constant in November. Wheat prices have been falling for six consecutive years; USDA agricultural supply and demand estimates from December 9 indicate that the crop in many major producers, including the US, Russia, Australia and Canada, is very good. The stock-to-use ratio, a measure of the abundance of supply relative to demand, is expected to reach 34 percent in , well above the 1-year average. Wheat consumption is expected to increase with 2.8 percent this year, suggesting that demand is now stimulated by low prices. Higher-than-expected yield estimates of the US corn harvest have fostered a decline in future prices, which was also fueled by appreciation of the US dollar following the election of Donald Trump as the next president of the United States. This month s loss stands at 1 percent, with the annual price expected to fall by 5 percent. Annual corn prices have fallen for four consecutive years. This year s crop is the largest ever, exceeding 1 billion metric tons, with exports at a record high of more than.14 billion metric tons. While 5
6 demand has been growing at 3.5 percent over the last 1 years, the stock-to-use ratio is expected to reach 21.6 percent throughout 216, similar to 214 and 215, and well above the 1-year average. Prices of vegetable oils, those of soybeans and palm oil in particular, increased in November. Palm oil has climbed almost 29 percent this year after one of the strongest El Nino events on record damaged plantations and depressed inventories in top producer countries Indonesia and Malaysia, reaching price levels not seen in more than three years. The palm oil market also benefitted from a rally in rival soybean oil after the U.S. government raised its 217 biofuel quotas in the month of November. Palm oil may extend its bull market surge into next year as tight supply and a weak Malaysian ringgit boost demand for the world s most-consumed cooking oil. Soybean prices increased 2.8 percent this month on account of the before mentioned announcement of higher US biofuel quotas. While the US soybean harvest this year is of exceptional quantity and quality, ongoing strength in animal protein demand will probably increase global consumption of soybeans by as much as 6 percent in , the strongest rate for major grains and oilseeds. Pork prices fell in November, by 7.2 percent. In the beginning of the year environmental regulations and disease lowered production of piglets in China, increasing demand for imports in the largest consumer of pork meat in the world, sending prices in the US upwards. While US prices were up almost 6 percent during summer, they have been in a free fall ever since, as more piglets were born in China during the summer months, and demand from China weakened. In addition, in the US the number of hogs flowing into slaughter plants continue to overwhelm the cash hog markets, causing prices to drop. Existing slaughter capacity in the US is stretched very thin and production is at an all-time high. The price of cocoa decreased substantially in November, by 8.1 percent. This drop in prices comes at a time when the main cocoa crop in West Africa, which has started to flow into ports since November, seems very good. Weather conditions in the region have been better than last year. The annual price of cocoa is likely to fall for the first time in 4 years. With production this season exceeding demand, prices have decreased. Excess supplies could last into , but recovery of demand may support prices next year. The price of Arabica coffee increased by 4 percent this month. Coffee has risen by more than 25 percent since the beginning of this year, as supply falls short of demand and consumers in Asia continue to substitute away from tea towards coffee. Potential setbacks to harvests in top producer countries such as Columbia and Vietnam, as well as concerns over Brazil s supply in , have put upward pressure on prices. The stocks-to-use ratio, a measure of the abundance of supply relative to demand, is expected to equal 2.9 throughout 216, which is below the 1-year average. The net long position held by hedge funds in New York Arabica futures has reached its highest level in ten years. However, a bearish market may lie ahead because higher local coffee prices due to a stronger U.S. dollar encourage selling. Climate Change and Renewable Energy One of the most remarkable trends in the energy sector in recent history is the substantial decline in the cost of renewable energy. Figure 6 displays the evolution of the levelized cost of electricity (LCOE), which measures the dollar cost per MWh 6
7 of electricity generated by technology, for solar, wind and hydropower. Figure 6 shows that between 9-216, the cost of solar PV was reduced by 66 percent. Over the last twelve months alone, solar PV fell by 17.5, while onshore and offshore wind recorded cost reductions of 17. and 27.5 percent, respectively. As a direct result of these cost reductions, renewables are now competing head-to-head with coal and gas in Europe, Middle East and Africa (EMEA) and, to a lesser extent, in the US. According to December 216 estimatesfrom Bloomberg, the cost of coal ($88/MWh) and gas ($78/MWh) in EMEA exceed the cost of onshore wind ($68/MWh). As shown in Figure 7, coal and gas are still cheaper than onshore wind in the US, but the cost difference is small. While the LCOE is an important factor driving investment, it is most certainly not the only determinant. This explains why solar PV ($/MWh) and offshore wind ($126/MWh) have been popular investment choices in the US and Europe during recent years. The economics of cheap(er) renewable energy is supporting the energy transition. A wave of investment in solar PV panels and wind turbines has increased the share of renewable electricity generation in both OECD and non-oecd countries shown in Figure 8 below. Figure 8 Figure 6 Sources: Bloomberg; and IMF staff calculations Figure 7 Sources: International Energy Agency; and IMF staff calculations. Note: These shares relate to electricity generation only and exclude the heating sector. OECD = Organisation for Economic Co-operation and Development. Moving forward, the IEA predicts the share of renewables in world electricity production to increase to 29 percent by 24, up from 2 percent today, under current policies. Sources: Bloomberg; and IMF staff calculations 7

8 Figure 9 global climate change agreement that was signed by more than countries in December 215, and which entered into force on November 4 this year, further cost reductions may make more ambitious policies and targets possible in the near future. Sources: International Energy Agency; and IMF staff calculations. Note: These shares relate to electricity generation only and exclude the heating sector. November 216 saw the unexpected election of Donald Trump as the next president of the United States. The question now arises: how will the Trump administration affect the outlook for climate change and renewable energy? Figure 11 Additionally, renewable electricity generation is projected to grow more than oil, nuclear and coal through 24 according to IEA estimates. In Figure 1 below, only natural gas surpasses the growth in renewable electricity generation. Figure 1 Sources: International Energy Agency; and IMF staff calculations. Note: These shares relate to electricity generation only and exclude the heating sector. Despite the rapid growth of renewable energy, global coal-fired power generation is still expected to grow by more than 3 percent between (Figure 9). While this is clearly not enough to limit the global increase in temperatures to the 2 degree Celsius ceiling that was agreed on during last year s Paris deal, the 8
9 9

10 1
11 Commodity Prices Movements Monthly (from 5) Daily (from 211) Crude oil ($/bbl) Crude oil ($/bbl) 125 Brent Brent 9 75 WTI 65 WTI Natural Gas ($/mmbtu) 15 Natural Gas ($/mmbtu) Japan Germany 1 1 Germany 5 United States 5 United States Sources: Energy Intelligence; Bloomberg, L.P. Iron Ore ($/ton) Source: Bloomberg, L.P. Iron Ore ($/ton)
12 Commodity Prices Movements (Continued) Monthly (from 5) Daily (from 211) Copper ($/ton) Copper ($/ton) Aluminium ($/ton) Aluminium ($/ton) 2 Nickel ($/ton) Nickel ($/ton)
13 Commodity Prices Movements (Continued) Monthly (from 5) Daily (from 211) Tin ($/ton) Tin ($/ton) Wheat ($/ton) 4 Wheat ($/ton) Corn ($/ton) Corn ($/ton)
14 Commodity Prices Movements (Continued) Monthly (from 5) Daily (from 211) Cocoa ($/ton) Cocoa ($/ton) Coffee (cents/lb) Coffee (cents/lb) Swine (cents/lb) Swine (cents/lb)
15 Commodity Prices Movements (Continued) Monthly (from 5) Daily (from 211) Beef (cents/pound) Beef (cents/lb) Source: Meat & Livestock Australia. Soybeans ($/ton) Cotton (cents/pound) Source: Bloomberg, L.P Soybeans ($/ton) Cotton (cents/lb)
16 Commodity Prices Movements (Continued) Monthly (from 5) Uranium($/lb) Zinc ($/ton) Coal ($/ton) Logs ($/cubic meter) Australia 4 Hard 5 South Africa Soft Rubber ($/lb) Wool (cents/kg) Coarse Fine 25 16
17 Commodity Prices Movements (Continued) Monthly (from 5) Rice ($/ton) Bananas ($/ton) Palm Oil ($/ton) Shrimp ($/kg) Sugar (cents/pound) Tea (cents/kg)
18 Commodity Prices Movements (Continued) Gold ($/troy ounce) Daily (from 211) Silver ($/troy ounce) Platinum ($/ounce) Palladium ($/ounce)
19 Selected Commodities Market Price Outlook and Risks WTI Crude Oil (U.S. dollars a barrel) 12 Brent Crude Oil (U.S. dollars a barrel) Natural Gas (U.S. dollars a MMBtu) 8 Gasoline (U.S. cents a gallon) Copper (U.S. cents a pound) 5 Gold (U.S. dollars a troy ounce)
20 Selected Commodities Market Price Outlook and Risks (concluded) Corn (U.S. cents a bushel) 9 Coffee (U.S. cents a pound) Rough Rice (U.S. cents a hundredweight) 2 Wheat Price (U.S. cents a bushel) Soybeans (U.S. cents a bushel) 19 Soybean Meal (U.S. dollars a short ton)
21 WTI Crude Oil (probabilities in percent; prices in U.S. dollars a barrel) Threshold Prices Brent Crude Oil (probabilities in percent; prices in U.S. dollars a barrel) Threshold Prices < < < < < < < < < < < < > > > > > > > > > > U.S. Natural Gas (probabilities in percent; prices in U.S. dollars an MMBtu) Threshold Prices Gasoline (probabilities in percent; prices in U.S. dollars a gallon) Threshold Prices < < < < < < < < < < > > > > > > > > > > > > Copper (probabilities in percent; prices in U.S. dollars a pound) Threshold Prices Options-based Price Thresholds Gold (probabilities in percent; prices in U.S. dollars a troy ounce) Threshold Prices < < < < < < < < < < < < > > > > > > > > > >
22 Options-based Price Thresholds (concluded) Corn (probabilities in percent; prices in U.S. dollars a bushel) Threshold Prices Coffee (probabilities in percent; prices in U.S. dollars a pound) Threshold Prices < < < < < < > < > > > > > > > > > > > > > > Rough Rice (probabilities in percent; prices in U.S. dollars a hundredweight) Threshold Prices Wheat (probabilities in percent; prices in U.S. dollars a bushel) Threshold Prices < < < < < < < < < < > > > > > > > > > > > > Soybeans (probabilities in percent; prices in U.S. dollars a bushel) Threshold Prices Soybean Meal (probabilities in percent; prices in U.S. dollars a short ton) Threshold Prices < <.... < < < < < < < > > > > > > > > > > > > >
23 Price changes Options-based Probabilities of Price Changes (in percent) Price changes % % % % % % % % % % % % % % Price changes Price changes % % % % % % % % % % % % % % Price changes WTI Crude Oil U.S. Natural Gas Copper Brent Crude Oil Gasoline Price changes % % % % % % % % % % % % % %.... Gold 23
24 Price changes Options-based Probabilities of Price Changes (concluded) (in percent) Price changes % % % % % % % % % % % % % %....2 Price changes Price changes % % % % % % % % % % % % % % Price changes Corn Rough Rice Soybeans Coffee Wheat Soybean Meal Price changes % % % % % % % % % % % % %.... +%
25 Commodity Derivative Contract Specifications Commodity Exchange Contract Physical Characteristics Contract Size Pricing Unit Months Traded Futures Light sweet crude oil 1, barrels U.S. dollars per barrel Brent crude oil ICE Europe Options One crude oil futures contract of 1, barrels Consecutive months up to and including February 22 WTI crude oil New York Mercantile Exchange Futures Light sweet crude oil 1, barrels U.S. dollars per barrel Options One crude oil futures contract of 1, barrels Consecutive months are listed for the current year and the next five years; in addition, the Jun and Dec contract months are listed beyond the sixth year. Natural Gas New York Mercantile Exchange Futures Options Natural gas delivered at Henry Hub, LA 1, MMBtu U.S. dollars per MMBtu One natural gas futures contract of 1, MMBtu Consecutive months for the current year plus the next twelve full calendar years. Gasoline Gold New York Mercantile Exchange Chicago Mercantile Exchange Futures New York Harbor RBOB 42, gallons U.S. cents per gallon Options Futures Options Gold (a minimum of 995 fineness) One gasoline futures contract of 42, gallons troy ounces One COMEX Gold futures contract U.S. dollars per troy ounce Consecutive months for 36 months Current calendar month; the next two calendar months; any Feb, Apr, Aug, and Oct falling within a 23-month period; and any Jun and Dec falling within a 72-month period beginning with the current month. Corn Coffee Rough rice Chicago Mercantile Exchange ICE Chicago Mercantile Exchange Futures Yellow corn grade #2 5, bushels (127 MT) U.S. cents per bushel Options Futures Options Futures Options Arabica coffee from 19 countries of origin U.S. #2 long grain rough rice with a total milling yield of 65%+ One corn futures contract (of a specified month) of 5, bushels 37,5 lbs U.S. cents per pound One coffee futures contract (of a specified month) of 37,5 lbs 2, hundredweights (CWT) One rough rice futures contract of 2, hundredweights (CWT) U.S. cents per hundredweight Mar, May, Jul, Sep, Dec. The monthly option contract exercises into the nearby futures contract. Mar, May, Jul, Sep, Dec. The monthly option contract exercises into the nearby futures contract. Jan, Mar, May, Jul, Sep, Nov. The monthly option contract exercises into the nearby futures contract. Wheat Soybean meal Chicago Mercantile Exchange Chicago Mercantile Exchange Futures #2 soft red winter wheat 5, bushels (136 MT) U.S. cents per bushel Options Futures Options Meal with minimum protein of 48% One Wheat futures contract (of a specified month) of 5, bushels short tons U.S. dollars per ton One soybean meal futures contract (of a specified month) of short tons Mar, May, July, Sep, Dec. The monthly option contract exercises into the nearby futures contract. Jan, Mar, May, Jul, Aug, Sep, Oct, Dec. The monthly option contract exercises into the nearby futures contract. Soybeans Chicago Mercantile Exchange Futures Yellow soybean grade #2 5, bushels (136 MT) U.S. cents per bushel Options One soybean futures contract (of a specified month) of 5, bushels Jan, Mar, May, Jul, Aug, Sep, Nov. The monthly option contract exercises into the nearby futures contract. Sources: Chicago Board of Trade, ICE, Bloomberg, L.P. 25
Commodity Price Outlook & Risks
 Commodity Outlook & Risks Research Department, Commodities Team March, 2 www.imf.org/commodities commodities@imf.org This monthly report presents a price outlook and risk assessment for selected commodities
Commodity Price Outlook & Risks
 Commodity Outlook & Risks Research Department, Commodities Team 1 December 22, 20 www.imf.org/commodities commodities@imf.org This monthly report presents a price outlook and risk assessment for selected
Commodity Price Outlook & Risks
 Commodity Outlook & Risks Research Department, Commodities Team 1 September 18, 20 www.imf.org/commodities commodities@imf.org This monthly report presents a price outlook and risk assessment for selected
Commodity Price Outlook & Risks
 Commodity Outlook & Risks Research Department, Commodities Team 1 December 17, 20 www.imf.org/commodities commodities@imf.org This monthly report presents a price outlook and risk assessment for selected
Commodity Price Outlook & Risks
 Commodity Outlook & Risks Research Department, Commodities Team 1 November 20 www.imf.org/commodities sbeidasstrom@imf.org Today we are launching the Commodity Outlook and Risks. This new monthly publication
Weekly Commodities Outlook
 Oct-1 Mar-11 Aug-11 Jan-12 Jun-12 Nov-12 Apr-13 Feb-14 Jul-14 Dec-14 Oct-15 Mar-16 Aug-16 Exports - 1 barrels/day Crude Oil Prod - 1 barrels/day Weekly Commodities Outlook Friday, February 17, 217 Energy:
OCBC Crude Oil Outlook. Barnabas Gan Economist Global Treasury Research & Strategy 9 February 2017
 OCBC Crude Oil Outlook Barnabas Gan Economist Global Treasury Research & Strategy 9 February 2017 1 Crude Oil OPEC and its compliancy 2 Executive Summary Crude oil prices remained volatile into the new
USCF Dynamic Commodity Insight Monthly Insight September 2018
 Key Takeaways The US Commodity Index Fund (USCI) and the USCF SummerHaven Dynamic Commodity Strategy No K-1 Fund (SDCI) gained 1.94% and 1.84%, respectively, last month as September was the best month
Weakness around the corner
 Weakness around the corner Sector Advisory ABN AMRO Group Economics ABN AMRO Sector Advisory Monthly Commodity Update price outlook for commodity markets 1 All commodities Energy / Precious / Industrials
June 2018 Monthly Commodity Market Overview Newsletter. Stock Index Futures. By the ADMIS Research Team
 June 2018 Monthly Commodity Market Overview Newsletter By the ADMIS Research Team Stock Index Futures Stock index futures performed well in spite of increased global trade tensions. In fact NASDAQ and
Global economy on track for solid recovery
 Global economy on track for solid recovery World real GDP grew by 5 percent in 20 Real GDP growth, percent 8 6 4 2 0-2 -4 Emerging and developing economies Advanced economies World -6 1980 1985 1990 1995
COMMODITY PRICE MONITOR November 22, 2017
 3 RBC commodity price index January 1994 = 24 21 18 Index excluding energy product prices January 1994 = 7 6 Energy products sub-index January 1994 = RBC s commodity price index is a Fisher chain-weighted
OPEC helps oil get back above US$50 a barrel
 Cooperation Week October 16 to 22, 2016 Desjardins supports thousands of student retention and educational success projects, sources of greater economic prosperity. For more information, go to desjardins.com.
MONTHLY ECONOMIC REPORT MARCH 2014
 Ministry of Finance Department of Economic Affairs Economic Division 4(3)/Ec. Dn. /2012 MONTHLY ECONOMIC REPORT MARCH 2014 HIGHLIGHTS The growth of GDP at factor cost at constant (2004-05) prices (real
SAMPLE. INSIGHT & PERSPECTIVE Eye on Commodities. Supply Constraints / Geopolitics Lead the Complex
 The long downtrend in the commodity market has reversed as prices have bounced off of a major technical price support level. Investors may want to take notice. INSIGHT & PERSPECTIVE Eye on Commodities
Global Markets Update QNB Economics 30 October 2016
 Global Markets Update QNB Economics 30 October 2016 Executive Summary Key Takeaways Global bond yields jumped on stronger than expected global activity data No major movements in global currencies Japanese
2017 Commodity Outlook
 2017 Commodity Outlook December 29, 2016 by Nitesh Shah, Maxwell Gold of ETF Securities Summary Individual commodities trade on their own fundamentals. Near-term pressure on gold and silver to give way
MONTHLY ECONOMIC REPORT MARCH 2013 HIGHLIGHTS
 Ministry of Finance Department of Economic Affairs Economic Division 4(3)/Ec. Dn. /2012 MONTHLY ECONOMIC REPORT MARCH 2013 HIGHLIGHTS The overall growth of GDP at factor cost at constant prices, as per
Positive outlook for commodity prices
 Positive outlook for commodity prices Sector Advisory ABN AMRO Group Economics ABN AMRO Sector Advisory ust Monthly Commodity Update price outlook for commodity markets 1 All commodities Energy / Precious
COMPARATIVE ANALYSIS OF MONTHLY REPORTS ON THE OIL MARKET
 COMPARATIVE ANALYSIS OF MONTHLY REPORTS ON THE OIL MARKET AN INTERNATIONAL ENERGY FORUM PUBLICATION AUGUST 2018 RIYADH, SAUDI ARABIA AUGUST 2018 SUMMARY FINDINGS FROM A COMPARISON OF DATA AND FORECASTS
Global Markets Update QNB Economics 19 February 2017
 Global Markets Update QNB Economics 19 February 2017 Executive Summary Key Takeaways Yields in advanced economies were stable while local factors dominated emerging market performance The Egyptian pound
COMPARATIVE ANALYSIS OF MONTHLY REPORTS ON THE OIL MARKET
 COMPARATIVE ANALYSIS OF MONTHLY REPORTS ON THE OIL MARKET AN INTERNATIONAL ENERGY FORUM PUBLICATION NOVEMBER 2018 RIYADH, SAUDI ARABIA NOVEMBER 2018 SUMMARY FINDINGS FROM A COMPARISON OF DATA AND FORECASTS
Prices of political commodities drift
 Monthly Commodity Insights price forecasts for commodity markets Sector Advisory Prices of political commodities drift ABN AMRO Group Economics November 2018 1 All commodities Energy / Precious / Industrials
BLOOMBERG COMMODITY INDEX 2018 TARGET WEIGHTS
 BLOOMBERG COMMODITY INDEX 2018 TARGET WEIGHTS 2018 SUMMARY 26 commodity contracts tested for inclusion No constituent changes (22 commodities constituents / 20 commodities) Energy reaches lowest weight
Commodities. 3Q14 outlook. Citigold Private Client 3Q Strong performance amid divergence in returns...
 Commodities 3Q14 outlook Strong performance amid divergence in returns... Commodities stellar performance this year has been persistent, raising questions about how long it can last. In many ways, the
Commodities Soar as Confidence Returns
 MARCH 19, COMMODITY TRENDS Commodities Soar as Confidence Returns Commodity prices have recovered overall since the beginning of the year (graph 1). The signs pointing to a possible trade agreement between
November 2017 Monthly Commodity Market Overview Newsletter
 November 2017 Monthly Commodity Market Overview Newsletter By the ADMIS Research Team Stock Index Futures S&P 500, Dow Jones, NASDAQ and Russell 2000 futures registered new historical highs in November.
Auscap Long Short Australian Equities Fund Newsletter August 2015
 Auscap Asset Management Limited Disclaimer: This newsletter contains performance figures and information in relation to the from inception of the Fund. The actual performance for your account will be provided
FNCE4040 Derivatives Chapter 2
 FNCE4040 Derivatives Chapter 2 Mechanics of Futures Markets Futures Contracts Available on a wide range of assets Exchange traded Specifications need to be defined: What can be delivered, Where it can
Oil Markets: Where next?
 Oil Markets: Where next? Christof Rühl, Global Head of Research Singapore September 2016 1 Content Oil and the economy: Recap Why did lower oil prices not support economic growth? OPEC vs. US two sides
SEPTEMBER Overview
 Overview SEPTEMBER 214 Global growth. Global growth has been weaker than expected so far this year, as economic activity disappointed in a number of major countries in the first six months (Figure 1).
ETF Securities Weekly Flows Analysis Precious metal ETP flows strengthen as trade tensions continue
 Aneeka Gupta Associate Director, Equity & Commodity Research research@etfsecurities.com 23 April 218 ETF Securities Weekly Flows Analysis Precious metal ETP flows strengthen as trade tensions continue
Fundamental Factors Affecting Agricultural and Other Commodities. Research & Product Development Updated July 11, 2008
 Fundamental Factors Affecting Agricultural and Other Commodities Research & Product Development Updated July 11, 2008 Outline Review of key supply and demand factors affecting commodity markets World stocks-to-use
Looking Ahead on Oil & Gas
 Looking Ahead on Oil & Gas Art Berman NACE Investor Speaker Luncheon Palm Beach Gardens, Florida March 16, 217 Slide 1 Oil Prices Fell Below $5 Floor Last Week: Deflation of the OPEC Expectation Premium
CENTRAL BANK OF LIBERIA (CBL)
") CENTRAL BANK OF LIBERIA (CBL) MONTHLY ECONOMIC REVIEW 138.00 134.00 130.00 126.00 122.00 118.00 114.00 110.00 106.00 102.00 98.00 94.00 90.00 86.00 Jan Feb Mar Apr May Jun Jul Aug Sep Oct Nov Dec Jan Feb
CENTRAL BANK OF LIBERIA (CBL) MONTHLY ECONOMIC REVIEW 138.00 134.00 130.00 126.00 122.00 118.00 114.00 110.00 106.00 102.00 98.00 94.00 90.00 86.00 Jan Feb Mar Apr May Jun Jul Aug Sep Oct Nov Dec Jan Feb
King Dollar reigns over commodities
 King Dollar reigns over commodities By Ole Hansen Three consecutive weeks of commodity gains gave way to losses this past week. The US dollar, which had been retreating since April, recovered and the impact
Commodity-Linked Certificates of Deposit JPMorgan Chase Bank, N.A. 270 Park Avenue, New York, New York (212)
") DISCLOSURE STATEMENT Commodity-Linked Certificates of Deposit JPMorgan Chase Bank, N.A. 270 Park Avenue, New York, New York 10017 (212) 270-6000 We, JPMorgan Chase Bank, N.A. (the Bank ), are offering
DISCLOSURE STATEMENT Commodity-Linked Certificates of Deposit JPMorgan Chase Bank, N.A. 270 Park Avenue, New York, New York 10017 (212) 270-6000 We, JPMorgan Chase Bank, N.A. (the Bank ), are offering
Global Markets Update QNB Economics 28 August 2016
 Global Markets Update QNB Economics 28 August 2016 Executive Summary Key Takeaways Yields rose in Brazil and South Africa on political concerns; Indonesian rates jumped on worries about the cost of cleaning
Commodities and Energy
 Macro Research 24 October, 2016 Commodities and Energy Tentative commodity markets OPEC s production cut is the focus of attention Sluggish investment keeps a lid on metal prices Commodity prices slowly
World Economic outlook
 Frontier s Strategy Note: 01/23/2014 World Economic outlook IMF has just released the World Economic Update on the 21st January 2015 and we are displaying the main points here. Even with the sharp oil
Commodities. Sandra Ebner,, CFA Senior Portfolio Manager Deka Investment GmbH. May, 2010
 Commodities Sandra Ebner,, CFA Senior Portfolio Manager Deka Investment GmbH May, 2010 Long-term structural changes cause higher trendgrowth in commodity demand, but 7 5 Emerging markets are growing faster
Global Markets Update QNB Economics 7 August 2016
 Global Markets Update QNB Economics 7 August 2016 Executive Summary Key Takeaways US yields rose on strong jobs data, raising expectations of possible Federal Reserve action; Saudi rates increased on concerns
Prospects for Demand Remain Favourable
 MARCH 21ST, COMMODITY TRENDS Prospects for Demand Remain Favourable After a roaring start to, commodities prices have pulled back somewhat since the beginning of February. This initially seemed to reflect
Commodities: A Strategic Asset Allocation?
 FINANCE, INVESTMENT & RISK MANAGEMENT CONFERENCE 15-17 JUNE 2008 HILTON DEANSGATE, MANCHESTER Commodities: A Strategic Asset Allocation? John.McManus@union-investment.de Commodities: A Distinct Asset Class
Commodities Observing the fundamentals Written by: Dwayne Dippenaar, Research Analyst at Laurium Capital
 FUNDS ON FRIDAY b y G l a c i e r R e s e a r c h 24 J u n e 2 0 1 6 V o l u m e 8 6 7 Commodities Observing the fundamentals Written by: Dwayne Dippenaar, Research Analyst at Laurium Capital The South
THE SPECIALIST IN TRADING AND INVESTMENT
 WCU: US jobs shocker kicks gold back to life By Ole Hansen Commodities continue to recover with the Bloomberg Commodity Index reaching a seven-month high. During this process the index, which reflects
Global Markets Update QNB Economics 12 March 2017
 Global Markets Update QNB Economics 12 March 2017 Executive Summary Key Takeaways US yields rose on a highly likely Fed rate hike this week; Eurozone yields rose after the ECB president lowered expectations
Markets Have De-Valued Oil Prices: How Long Will It Last?
 Markets Have De-Valued Oil Prices: How Long Will It Last? Art Berman MacroVoices September 2, 218 Slide 1 Comparative inventory: The most important approach to oil & gas price formation Ivnetories of Crude
COMPARATIVE ANALYSIS OF MONTHLY REPORTS ON THE OIL MARKET
 COMPARATIVE ANALYSIS OF MONTHLY REPORTS ON THE OIL MARKET AN INTERNATIONAL ENERGY FORUM PUBLICATION SEPTEMBER 2018 RIYADH, SAUDI ARABIA SEPTEMBER 2018 SUMMARY FINDINGS FROM A COMPARISON OF DATA AND FORECASTS
Trading Commodities. An introduction to understanding commodities
 Trading Commodities An introduction to understanding commodities Brainteaser Problem: A casino offers a card game using a deck of 52 cards. The rule is that you turn over two cards each time. For each
The First Quarter Was Mixed, But the Outlook Is Encouraging
 APRIL 6, 217 COMMODITY TRENDS The First Quarter Was Mixed, But the Outlook Is Encouraging After rising sharply in 216, the main commodity price indexes declined slightly in the first three months of 217.
Soybeans face make or break moment Futures need a two-fer to avoid losses By Bryce Knorr, senior grain market analyst
 Soybeans face make or break moment Futures need a two-fer to avoid losses By Bryce Knorr, senior grain market analyst A year ago USDA shocked the market by cutting its forecast of soybean production, helping
Still waiting for sunnier skies
 November, 1 Still waiting for sunnier skies While stock indexes continue to advance at an impressive pace, most commodity prices have pulled back again in recent weeks (graph 1). Unsurprisingly, North
Market Outlook Considerations Week Beginning August 7, 2017
 Market Outlook Considerations Week Beginning August 7, 2017 DISCLAIMER-FOR-EDUCATIONAL-PURPOSES-ONLY Bobby Coats, Ph.D. Professor Economics Department of Agricultural Economics and Agribusiness University
Commodities Forecast Update Weakness awaits rest of 2014
 Investment Research 15 October 2014 2014 Commodities Forecast Update Weakness awaits rest of 2014 Key themes Oil A markedly stronger dollar and concerns about the outlook have weighed on demand for commodities
Global Markets Update QNB Economics 03 July 2016
 Global Markets Update QNB Economics 03 July 2016 Executive Summary Key Takeaways Sovereign bond yields fell globally as the continued fallout from Brexit raised expectations for widespread monetary easing
Global Markets Update QNB Economics 12 November 2017
 Global Markets Update QNB Economics 12 November 2017 Executive Summary Key Takeaways Advanced economy 10-year yields rose on expectations of reduced quantitative easing; Saudi Arabia s corruption probe
Commodities Outlook 2018: Still Bright
 SUMMARY Commodities Outlook 2018: Still Bright March 8, 2018 by Greg Sharenow, Nicholas Johnson of PIMCO Our overall positive outlook on commodities reflects our sector-specific views, which range from
KEY CONCEPTS. Understanding Commodities
 KEY CONCEPTS Understanding Commodities TABLE OF CONTENTS WHAT ARE COMMODITIES?... 3 HOW COMMODITIES ARE TRADED... 3 THE BENEFITS OF COMMODITY TRADING...5 WHO TRADES COMMODITIES?...6 TERMINOLOGY... 7 UNDERSTANDING
Oil: A Perfect Storm Hits Prices OCTOBER 23, 2014
 Oil: A Perfect Storm Hits Prices OCTOBER 23, 214 A confluence of excess supplies, weak demand, and a stronger dollar shaved more than 2% off oil prices from recent highs in late June With North American
Weekly Flows by Sector (US$mn) Top 5 Inflows/Outflows (US$mn) Top 5 / Bottom 5 Performers. TOTAL Diversified Energy Industrial
 Top 5 Inflows/Outflows (US$mn) Top 5 / Bottom 5 Performers. TOTAL Diversified Energy Industrial") Weekly Flows by Sector (US$mn) TOTAL Diversified Energy Industrial Precious -81 Agriculture Livestock Equities FX -3-38 -1 2 8 5 75-1 -5 5 1 Top 5 Inflows/Outflows (US$mn) Agriculture Copper USD Coffee
Weekly Flows by Sector (US$mn) TOTAL Diversified Energy Industrial Precious -81 Agriculture Livestock Equities FX -3-38 -1 2 8 5 75-1 -5 5 1 Top 5 Inflows/Outflows (US$mn) Agriculture Copper USD Coffee
Commodity Monthly Monitor Sentiment overshadows fundamentals for now
 Commodity Monthly Monitor Sentiment overshadows fundamentals for now June/July 2 Summary Outside the energy sector, investor sentiment for commodities has softened on the back of concern over the global
OPEC extends oil output cut through March 2018
 Economics Research Desk Market Highlights: Oil & Gas update 25 May 2017 OPEC extends oil output cut through March 2018 Oil prices swung between sharp gains and losses in volatile trade on Thursday, after
Weekly Flows by Sector (US$mn) Top 5 Inflows/Outflows (US$mn) Top 5 / Bottom 5 Performers. Diversified Energy Industrial
 Top 5 Inflows/Outflows (US$mn) Top 5 / Bottom 5 Performers. Diversified Energy Industrial") Weekly Flows by Sector (US$mn) TOTAL -22 Diversified Energy Industrial Precious -165 Agriculture Livestock Equities FX -4-2 -39-1 8 1-3 -2-1 1 Top 5 Inflows/Outflows (US$mn) Coffee Soybeans Cotton USD
Weekly Flows by Sector (US$mn) TOTAL -22 Diversified Energy Industrial Precious -165 Agriculture Livestock Equities FX -4-2 -39-1 8 1-3 -2-1 1 Top 5 Inflows/Outflows (US$mn) Coffee Soybeans Cotton USD
JULY 2017 Monthly Commodity Market Overview Newsletter. Stock Indexes. By the ADMIS Research Team
 JULY 2017 Monthly Commodity Market Overview Newsletter By the ADMIS Research Team Stock Indexes S&P 500, Dow Jones and NASDAQ futures advanced to new historical highs in spite of several bearish economic
Commodity Monthly Monitor Commodity Rebound Gains Momentum
 Commodity Monthly Monitor Commodity Rebound Gains Momentum May/June 2 Summary Despite a lacklustre performance in Q1 of this year, it increasingly looks like commodities are at a turning point, with most
Global Markets Update QNB Economics 15 October 2017
 Global Markets Update QNB Economics 15 October 2017 Executive Summary Key Takeaways US yields fell after inflation came in lower-than-expected; Turkish rates rose after a diplomatic dispute with the US
Macroeconomic Outlook: Implications for Agriculture. It has been 26 years since we have experienced a significant recession
 Macroeconomic Outlook: Implications for Agriculture John B. Penson, Jr. Regents Professor and Stiles Professor of Agriculture Texas A&M University Our Recession History September 1902 August1904 23 May
North American Steel Industry Recent Market Developments, Future Prospects and Key Challenges
 North American Steel Industry Recent Market Developments, Future Prospects and Key Challenges OECD Steel Committee December 1-11, 29 Paris, France * American Iron and Steel Institute (AISI) Steel Manufacturers
COMPARATIVE ANALYSIS OF MONTHLY REPORTS ON THE OIL MARKET
 COMPARATIVE ANALYSIS OF MONTHLY REPORTS ON THE OIL MARKET AN INTERNATIONAL ENERGY FORUM PUBLICATION JUNE 2018 RIYADH, SAUDI ARABIA JUNE 2018 SUMMARY FINDINGS FROM A COMPARISON OF DATA AND FORECASTS ON
COMMODITY FUTURES TRADING COMMISSION. Procedures to Establish Appropriate Minimum Block Sizes for Large Notional Off-
 This document is scheduled to be published in the Federal Register on 07/16/2013 and available online at http://federalregister.gov/a/2013-16938, and on FDsys.gov 6351-01-P COMMODITY FUTURES TRADING COMMISSION
Oil Value Chain & Markets. Global Oil Markets
 Oil Value Chain & Markets Global Oil Markets World Oil Reserves WORLD OPEC Middle East Former Soviet Union Africa End 2006 End 2000 End 1990 End 1980 North America USA South & Central America Asia Pacific
Global Markets Update QNB Economics 19 June 2016
 Global Markets Update QNB Economics 19 June 16 Executive Summary Key Takeaways Most advanced economy sovereign bond yields fell on heightened risk aversion due to a worse US outlook and data and rising
ETF Securities Weekly Flows Analysis Gold ETPs outflows after hawkish September FOMC minutes.
 Morgane Delledonne Associate Director Fixed Income Strategist research@etfsecurities.com 17 October 216 ETF Securities Weekly Flows Analysis Gold ETPs outflows after hawkish September FOMC minutes. Gold
Commodities Monthly Review
 Commodities Monthly Review June 2015 Lower agricultural prices despite El Niño Aggregate commodity prices have declined 2.7% since the end of April. We expect a 5.3% increase from current levels by year-end,
Market Briefing: Global Markets
 Market Briefing: Global Markets July 6, 218 Dr. Edward Yardeni 516-972-7683 eyardeni@ Mali Quintana 48-664-1333 aquintana@ Please visit our sites at blog. thinking outside the box Table Of Contents Table
COMMODITY PRICE MONITOR October 19, 2018
 COMMODITY PRICE MONITOR SEPTEMBER 218 RBC commodity price index January 1994 = 24 21 18 Index excluding energy product prices January 1994 = Energy products sub-index January 1994 = RBC s commodity price
Vantage Investment Partners. Quarterly Market Review
 Vantage Investment Partners Quarterly Market Review First Quarter 2016 Quarterly Market Review First Quarter 2016 This report features world capital market performance and a timeline of events for the
Market Outlook Considerations Week Beginning November 27,2017
 Market Outlook Considerations Week Beginning November 27,2017 DISCLAIMER-FOR-EDUCATIONAL-PURPOSES-ONLY Bobby Coats, Ph.D. Professor Economics Department of Agricultural Economics and Agribusiness University
Market Outlook Considerations Week Beginning May 14, 2018
 Market Outlook Considerations Week Beginning May 14, 2018 DISCLAIMER-FOR-EDUCATIONAL-PURPOSES-ONLY Bobby Coats, Ph.D. Professor Economics Department of Agricultural Economics and Agribusiness University
Opportunities and challenges for agriculture. How will agriculture and the swine industry fare in today s economic climate? Opportunities.
 The outlook for the swine industry and its relationship with the global economy Brian C. Briggeman Associate Professor and Director of the Arthur Capper Cooperative Center How will agriculture and the
GLOBAL FUTUS MARGIN & COMMISSION
 GLOBAL FUTUS MARGIN & COMMISSION Index Futures Currency Futures Energy Futures Metal Futures Agricultural Futures Bond Futures Name Exchange Index Futures ( & ) (per lot) Charge(per contract per side)
DAILY COMEX COMMODITY REPORT. Daily market outlook. LME Inventory. Support _Resistance. News. Daily Candlestick EPIC RESEARCH SINGAPORE
 Daily market outlook LME Inventory Support _Resistance News Daily Candlestick EPIC RESEARCH SINGAPORE PRECIOUS METALS AND INDUSTRIAL METALS COMMODITY UNIT PRICE CHANGE % CHANGE CONTRACT COMEX GOLD USD/T
Analysis & Outlook of Non-Ferrous Metals Market Trends
 May 2014 Analysis & Outlook of Non-Ferrous Metals Market Trends Mark Keenan Head of Commodities Research - Asia Important Notice: The circumstances in which this publication has been produced are such
MacroVoices Oil Discussion: OPEC Can t Fix The Problem of Low Oil Prices
 MacroVoices Oil Discussion: OPEC Can t Fix The Problem of Low Oil Prices Art Berman November 30, 2016 Slide 1 Overview: OPEC Can t Fix The Problem of Low Oil Prices OPEC may reach some agreement today
Commodity Roundup. Treasury Research Group For private circulation only
 May-15 Jun-15 Aug-15 Sep-15 Nov-15 Dec-15 Feb-16 Mar-16 May-16 Commodity Roundup Treasury Research Group For private circulation only June 7, 2016 Radhika Wadhwa radhika.wadhwa@icicibank.com Commodity
Commodities Monthly Review
 Commodities Monthly Review Monday, December 02, 2013 Higher Iron Ore, Lower Crude Oil Prices We are raising our iron ore price forecasts due to stronger-than-expected demand and lower capacity from high-cost
October 2017 Monthly Commodity Market Overview Newsletter. Stock Index Futures
 October 2017 Monthly Commodity Market Overview Newsletter By the ADMIS Research Team Stock Index Futures S&P 500, Dow Jones, NASDAQ and Russell 2000 futures registered new historical highs in October.
Bache Commodity Index SM. Q Review
 SM Bache Commodity Index SM Q3 2009 Review The Bache Commodity Index SM Built for Commodity Investors The Bache Commodity Index SM (BCI SM ) is a transparent, fully investable commodity index. Its unique
Market Outlook Considerations Week Beginning January 29, 2018
 Market Outlook Considerations Week Beginning January 29, 2018 DISCLAIMER-FOR-EDUCATIONAL-PURPOSES-ONLY Bobby Coats, Ph.D. Professor Economics Department of Agricultural Economics and Agribusiness University
Agriculture Update. Global. Food versus feed in the wheat market. Commodities Research. Sharp decline in corn supplies requires more wheat feeding
 Agriculture Update Food versus feed in the wheat market Commodities Research Sharp decline in corn supplies requires more wheat feeding We forecast that the US drought will bring corn supplies sharply
Jörg Decressin Deputy Director
 World Economic Outlook October 13 Jörg Decressin Deputy Director Research Department, IMF 1 Outline Prospects for Advanced Economies Recent Developments and Implications for Emerging Economies Medium-term
Global Resources Fund (PSPFX)
") Global Resources Fund (PSPFX) Global Resources are the building blocks of the world we live in. As the world s population grows and emerging regions develop a more vibrant infrastructure for commerce,
Global Resources Fund (PSPFX) Global Resources are the building blocks of the world we live in. As the world s population grows and emerging regions develop a more vibrant infrastructure for commerce,
Divergent Monetary Policy Implication for sub-saharan African Economies. By Sarah O. Alade Deputy Governor, Economic Policy Central Bank of Nigeria
 Divergent Monetary Policy Implication for sub-saharan African Economies By Sarah O. Alade Deputy Governor, Economic Policy Central Bank of Nigeria Crisis background The recent financial crisis is one of
Market Outlook Considerations Week Beginning November 13, 2017
 Market Outlook Considerations Week Beginning November 13, 2017 DISCLAIMER-FOR-EDUCATIONAL-PURPOSES-ONLY Bobby Coats, Ph.D. Professor Economics Department of Agricultural Economics and Agribusiness University
Michael V. Dunn Commissioner Commodity Futures Trading Commission. Agricultural Outlook Forum February 24,
 Michael V. Dunn Commissioner Commodity Futures Trading Commission Agricultural Outlook Forum February 24, 2011 1 Commodity Futures Trading Commission Mission Statement To Protect Market Users and the Public
Things are looking good for the next few months
 Things are looking good for the next few months June, After gaining approximately % in the first four months of, the main commodity price indexes lost a bit of ground in May. Contrary to what had been
Market Bulletin November 17, 2014
 Market Bulletin November 17, 214 What is behind the recent slump in oil prices? Anastasia V. Amoroso, CFA Vice President Global Market Strategist J.P. Morgan Funds Ainsley seye. Woolridge Market Analyst
Market Outlook Considerations Week Beginning April 2, 2018
 Market Outlook Considerations Week Beginning April 2, 2018 DISCLAIMER-FOR-EDUCATIONAL-PURPOSES-ONLY Bobby Coats, Ph.D. Professor Economics Department of Agricultural Economics and Agribusiness University
Market Outlook Considerations Week Beginning March 26, 2018
 Market Outlook Considerations Week Beginning March 26, 2018 DISCLAIMER-FOR-EDUCATIONAL-PURPOSES-ONLY Bobby Coats, Ph.D. Professor Economics Department of Agricultural Economics and Agribusiness University