Erika Brendan Ying (Charlene) Zhang. Sector Analysis
|
|
|
- Kimberly Ross
- 6 years ago
- Views:
Transcription
 Zhang")
1 Erika Brendan Ying (Charlene) Zhang Sector


2
3
: $3.")
4 Size of Sector Market Cap (as of March 17, 2015): $3.49T 38 Companies
5 Products categories represented in this sector include beverages (alcoholic and non), food, tobacco, personal and household items. Demand less impacted by economic downturns (defensive not cyclical) (low beta) Some firms may see positive growth in economic downturns (discount retailers, tobacco and alcohol) Low correlation to S&P 500
6 Industry Components (last updated 3/24/15 12:55p) Last % Change YTD 1-Y 3-Y 5-Y Consumer Staples 0.00% 0.99% 15.48% 45.22% 75.24% S&P 500 Index -0.22% 2.21% 12.75% 51.09% -0.22% Beverages 0.58% 1.03% 14.69% 40.91% 66.28% Food & Staples Retailing 0.27% 6.52% 26.76% 85.81% % Food Products -0.12% -1.74% 8.03% 45.67% 74.47% Household Products -0.32% -4.82% 9.15% 33.41% 44.11% Personal Products 1.52% 3.33% 1.27% -0.10% 3.95% Tobacco -0.87% 2.38% 16.93% 22.13% 94.20%
7 Largest Companies in Sector (Market Cap) Wal-Mart ($266.30B) Proctor & Gamble ($225.65B) Coca-Cola ($176.97B) Pepsi Co ($139.54B) Philip Morris International, Inc. ($120.49B) CVS ($115.92B) British American Tobacco ($102.24B)
8
9 -0.33% 1.67% 3.56% 7.31% -0.03% -4.04% -6.20% -3.60% 21.61% 22.95% 32.17% 40.62% 21.48% 5.93% -6.74% 19.13% 5.95% 8.63% 1.46% 7.00% 2.31% -2.33% 2.58% -0.43% % 0.00% 10.00% 20.00% 30.00% 40.00% 50.00% S&P 500 Consumer Staples Beverages Food & Staples Retailing Food Products Household Products Personal Products Tobacco Revenue Growth Current Historical (2010) Future (2016)
10 80.00% 60.00% 40.00% 20.00% 0.00% Earnings Growth Current Historical (2010) Future (2016) 41.82% 41.59% 31.54% 24.75% 16.71% 12.88% 11.66% 11.54% 13.20% 5.56% 7.38% 9.90% 10.86% 9.31% 7.37% 2.54% -0.02% -0.67% 69.21% 44.72% 20.36% -7.36% -0.14% % % -45% % S&P 500 Consumer Staples Beverages Food & Staples Retailing Food Products Household Products Personal Products Tobacco
11 Current Major Companies Food & Staples Retailing Household Products Beverages Food Products Tobacco S&P 500 Consumer Staples Beverages Food & Staples Retailing Food Products Household Products Personal Products Tobacco Wal-Mart Proctor & Gamble Coca-Cola Con-Agra Philip Morris Operating Margin 13.33% 9.26% 17.58% 4.7% 7.53% 16.54% 9.17% 39.71% 5.59% 16.63% 21.11% 3.67% 39.31% Profit Margin 9.16% 5.86% 12.04% 2.72% 4.99% 10.97% 1.83% 25.32% 3.37% 11.69% 15.43% 2.41% 25.17% Current Ratio P/E Ratio

12 Historical & Future CS v. S&P CY 2008 CY 2009 CY 2010 CY 2011 CY 2012 CY 2013 CY 2014 Current CY 2015 Est CY 2016 Est Months Ending Metrics Price/Earnings S&P 500 Index EV/EBITDA S&P 500 Index Dividend Yield S&P 500 Index Fundamentals Gross Margin S&P 500 Index Operating Margin S&P 500 Index Profit Margin S&P 500 Index Return on Assets S&P 500 Index Return on Equity S&P 500 Index Source: Bloomberg
13 Current Major Companies Food & Staples Retailing Household Products Beverages Food Products Tobacco Wal-Mart Proctor & Gamble Coca-Cola Con-Agra Philip Morris D/E Ratio N/A A/R Turnover Inventory Turnover Asset Turnover ROA 8.01% 6.84% 7.8% 2.00% 20.43% ROE 20.76% 14.15% 21.77% 7.29% N/A R&D (% Sales) N/A N/A N/A N/A N/A
14 Historical (2010) Major Companies Food & Staples Retailing Household Products Beverages Food Products Tobacco Wal-Mart Proctor & Gamble Coca-Cola Con-Agra Philip Morris D/E Ratio A/R Turnover Inventory Turnover Asset Turnover ROA 8.61% 9.68% 19.51% 6.36% 20.86% ROE 21.17% 20.58% 42.5% 15.05% %
15 Consumer Staples: Net User or Generator of FCF? CY 2008 CY 2009 CY 2010 CY 2011 CY 2012 CY 2013 CY 2014 Current CY 2015 Est CY 2016 Est Months Ending Cash Flow Items per Share Cash From Operations S&P 500 Index Cash Flow From Investing S&P 500 Index Cash From Financing S&P 500 Index Capital Expenditures S&P 500 Index Free Cash Flow S&P 500 Index Reference Items Free Cash Flow Yield S&P 500 Index Source: Bloomberg
16
17 MACROECONOMIC FACTORS Consumer Sentiment Initial Jobless Claims US Dollar Revaluation Commodity Prices

18 REGRESSION ANALYSIS ELATIVE TO S&P 500

19 CONSUMER SENTIMENT

20 INITIAL JOBLESS CLAIMS
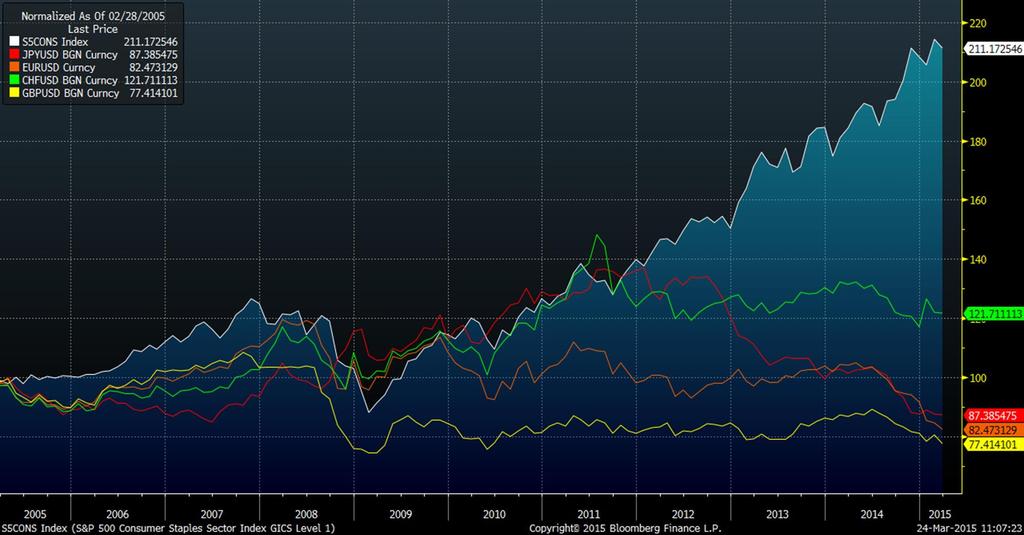
21 US DOLLAR REVALUATION
22 US DOLLAR REVALUATION CONT. Trailing Returns of US Dollar Total Returns 1 Month 3 Month 6 Month USD/Euro -3.87% % % JPY/USD 0.76% -0.57% 9.52% USD/GBP -4.25% -4.45% -8.97% RUB/USD -5.41% 9.57% 51.56%

23 COMMODITY PRICES Bloomberg Commodity Index
24

25 S&P 500 High Low Median Average Current P/E P/B P/S P/EBITDA P/FCF Numbers are based on trailing 5 years

26 Consumer Staples High Low Median Average Current P/E P/B P/S P/EBITDA P/FCF Numbers are based on trailing 5 years Relative to S&P 500 High Low Median Average Current P/E P/B P/S P/EBITDA P/FCF Numbers are based on trailing 5 years

27 Industry Comparison 1 Month 3 Month YTD 1 Year Price to Price to Dividend Earnings Sales Yield Consumer Staples -0.96% -0.45% 1.52% 18.74% % Food Staples & Retailing 2.22% 5.93% 6.92% 29.45% % Food Beverage & Tobacco -2.61% -1.22% 1.08% 17.23% % Household & Personal Products -0.58% -5.91% -3.71% 10.55% %
28

29 -- US Cycle

30 -- Cycle Sensitivity Consumer Staples Defensive Sector Constant Demand Sector Sensitivity Breakdown: Beverages: low Food & Staples Retailing: low Household Products: low Tobacco: low Food Products: low/ moderate Personal Products: moderate
31 -- Cycle Sensitivity Companies Ticker Industry Beta Procter & Gamble PG Personal Products 0.82 Coca Cola KO Beverages-Soft Drinks 0.81 Philip Morris PM Cigarettes 1.03 Anheuser Busch BUD Beverages-Brewers 1.16 AmBev ABEV Beverages-Brewers N/A PepsiCo PEP Beverages-Soft Drinks 0.59 Diageo DEO Beverages-Wineries & Distillers 0.88 CVS Caremark CVS Health Care Plans 0.96 Altria MO Cigarettes 0.66 Colgate-Palmolive CL Personal Products 0.82


32 -- Growth Drivers Demand People cannot cut consumer staples Supply Little room to increase price Reducing Cost Innovation Shifting focus on Healthy and Wellness Divestitures and Restructuring Initiatives Acquisition and Strategic Partnerships
33 Profitability and Pricing -- Five Force Power Model Threats of Potential Entrants (Moderate) Bargaining Power of Suppliers (Low) Intensity of Rivalry within the Industry (High) Bargaining Power of Buyers (High) Threats of Substitute Products (Low)

34 Profitability and Pricing -- Five Force Power Model Bargaining Power of Buyers High Price Sensitivity: High Brand Loyalty: Low Switching Costs: Low Retailer Power: High Quality Demand: Increasing Bargaining Power of Suppliers Low Quantity of Suppliers: High Raw Material Price Flexibility: Low

35 Profitability and Pricing -- Five Force Power Model Threats of Potential Entrants Moderate Economies of Scale: Moderate R&D: Moderate Capital Requirement: Moderate Access to Distribution Channels: Low Threats of Substitute Products Low Demand Consistent: High Intensity of Rivalry within the Industry High Diverse Competitor Products difference: Low
36
37 SIM Portfolio S&P 500 Index Consumer Staples: 9.32% Consumer Staples: 9.80% SIM Portfolio under weight compared to S&P 500 Strong dollar currency Declining global economy

38
Scott.Helkowski Yanjun Gu Yiqin Gao
 Scott.Helkowski Yanjun Gu Yiqin Gao Overview Primarily food, beverages (including alcoholic beverages), tobacco, retailing and household items. The staples sector has historically exhibited a beta of.52
Consumer Stapes Sector - XLP HASSAM AL- SHAMLAN TREVOR BOREN RYAN ELLINGSON BRADEN PARSONS ALYSSA WOOD
 Consumer Stapes Sector - XLP HASSAM AL- SHAMLAN TREVOR BOREN RYAN ELLINGSON BRADEN PARSONS ALYSSA WOOD Introduction Consumer Staples Sector invests in companies that are primarily involved in the development
Industrial Sector Analysis
 Industrial Sector Analysis Tongren Yan Student Investment Management - BUSFIN 4228 Spring 2016 Spring 2017 Agenda Overview Business Analysis Economic Analysis Financial Analysis Valuation Analysis Recommendation
Materials Stock Analysis. Michael Hughes Stanley The
 Materials Stock Analysis Michael Hughes Stanley The Lorraine Toth Overview Summary of Sector Cyclical sector with large beta will likely perform significantly worse than the S&P 500 if it falls Some hope
ENERGY SECTOR. Mike Essig
 ENERGY SECTOR Chris Gagnon Brian Geiser Mike Essig TABLE OF CONTENTS SECTOR OVERVIEW BUSINESS ANALYSIS ECONOMIC ANALYSIS FINANCIAL ANALYSIS VALUATIONS RECOMMENDATION SECTOR OVERVIEW 5.61% S&P 500 SECTOR
VDC Vanguard Consumer Staples ETF
 Vanguard Consumer Staples ETF ETF.com segment: Equity: U.S. Consumer Non-cyclicals Competing ETFs: XLP, IYK, FSTA, PSCC, RHS Related ETF Channels: North America, U.S., Broad-based, Vanilla, Consumer non-cyclicals,
Consumer Discretionary (S5COND)
") Consumer Discretionary (S5COND) Sector Presentation and Recommendations given by Devara Aryasta and Ashley Faulkner AGENDA Sector Information Business Analysis Economic Analysis Financial Analysis Valuation
Consumer Discretionary (S5COND) Sector Presentation and Recommendations given by Devara Aryasta and Ashley Faulkner AGENDA Sector Information Business Analysis Economic Analysis Financial Analysis Valuation
Healthcare Sector The Stock Market SIM, Professor West. Yiping Yang, Lu Yu
 Healthcare Sector The Stock Market SIM, Professor West Yiping Yang, Lu Yu 1 Agenda Sector Overview Business and Economic Analysis Financial Analysis Valuation Analysis Recommendation 2 Sector Overview
Basic Materials. Tim Stephenson Matthew Stewart November 8, 2016
 Basic Materials Tim Stephenson Matthew Stewart November 8, 2016 - The sector consists of companies engaged in the discovery, development, and processing of raw materials MATERIALS INDUSTRY - AGENDA Agenda
KXI ishares Global Consumer Staples ETF
 ishares Global Consumer Staples ETF ETF.com segment: Equity: Global Consumer Non-cyclicals Competing ETFs: ORG Related ETF Channels: Broad-based, Vanilla, Global, Consumer non-cyclicals, Equity, Sectors
EQUITY RESEARCH. February 27, 2002 S&P Sector Cons. Staples Industry Household Products. Market Cap. MSN money
 M.A. W M.A. WRIGHT FUND EQUITY RESEARCH Nat Apihunpunyakij Kimberly-Clark Corp. NYSE: KMB Buy apihunpu@rice.edu February 27, 2002 S&P Sector Cons. Staples Industry Household Products MARKET DATA Price
CIF Sector Recommendation Report (Fall 2012)
") CIF Sector Recommendation Report (Fall 2012) Date: 10/27/12 Analyst: Ryan Ellingsen Sector: Consumer Staples Review Period: October 11 th -October 24th Section (A) Sector Performance Review Consumer Staples
CIF Sector Recommendation Report (Fall 2012) Date: 10/27/12 Analyst: Ryan Ellingsen Sector: Consumer Staples Review Period: October 11 th -October 24th Section (A) Sector Performance Review Consumer Staples
CIF Stock Recommendation Report (Fall 2012)
") Date: 10/13/2012 Analyst Name: Ryan Ellingsen CIF Stock Recommendation Report (Fall 2012) Company Name and Ticker: Colgate-Palmolive Company (CL) Section (A) Summary Recommendation Buy: Hold Target Price:
Date: 10/13/2012 Analyst Name: Ryan Ellingsen CIF Stock Recommendation Report (Fall 2012) Company Name and Ticker: Colgate-Palmolive Company (CL) Section (A) Summary Recommendation Buy: Hold Target Price:
ANHEUSER BUSCH INBEV (BUD-N) Food & Beverages / Beverages / Brewers
 Food & Beverages / Beverages / Brewers") ANHEUSER BUSCH INBEV (-N) Last Close 111.35 (USD) Avg Daily Vol 1.6M 52-Week High 126.50 Trailing PE 34.2 Annual Div 4.05 ROE 7.2% LTG Forecast 22.3% 1-Mo -3.7% December 21 NEW YORK Exchange Market Cap
ANHEUSER BUSCH INBEV (-N) Last Close 111.35 (USD) Avg Daily Vol 1.6M 52-Week High 126.50 Trailing PE 34.2 Annual Div 4.05 ROE 7.2% LTG Forecast 22.3% 1-Mo -3.7% December 21 NEW YORK Exchange Market Cap
BMO Global Consumer Staples Hedged to CAD Index ETF (STPL) (the ETF )
 (the ETF )") SEMI-ANNUAL MANAGEMENT REPORT OF FUND PERFORMANCE BMO Global Consumer Staples Hedged to CAD Index ETF (STPL) (the ETF ) For the period from April 3, 2017 to June 30, 2017 (the Period ) Manager: BMO Asset
SEMI-ANNUAL MANAGEMENT REPORT OF FUND PERFORMANCE BMO Global Consumer Staples Hedged to CAD Index ETF (STPL) (the ETF ) For the period from April 3, 2017 to June 30, 2017 (the Period ) Manager: BMO Asset
Utilities Sector Presentation. Luke MacAdam
 Utilities Sector Presentation Luke MacAdam Agenda Sector Overview Business Overview Economic Analysis Financial Analysis Valuation Analysis Recommendation 2 Sector, Weight % (Difference from SIM Weight)
Information Technology Company Presentation Presented by: Benjamin Pastur, Prabha Pelluru, Brandon Plumb and Maddy Masaryk
 Information Technology Company Presentation Presented by: Benjamin Pastur, Prabha Pelluru, Brandon Plumb and Maddy Masaryk 1 Overview Very briefly recap your sector recommendation. Review what stocks we
CONSUMER DISCRETIONARY
 CONSUMER DISCRETIONARY A REPORT BY: ADAM ASHBROOK & ROBERT AURAND Sector Analysis Consumer Discretionary Encompasses industries that are most sensitive to economic cycles Broken into two main segments
CIF Stock Recommendation Report (Fall 2012)
") Date: October 9, 2012 Analyst Name: Alyssa Wood CIF Stock Recommendation Report (Fall 2012) Company Name and Ticker: Molson-Coors Brewing Company (TAP) Section (A) Summary Recommendation Buy: Hold Target
Date: October 9, 2012 Analyst Name: Alyssa Wood CIF Stock Recommendation Report (Fall 2012) Company Name and Ticker: Molson-Coors Brewing Company (TAP) Section (A) Summary Recommendation Buy: Hold Target
CIF Sector Recommendation Report (Fall 2012)
") CIF Sector Recommendation Report (Fall 2012) Date: November 6, 2012 Analyst: Alyssa Wood Sector: Consumer Staples (XLP) Review Period: October 17-31, 2012 Section (A) Sector Performance Review Cougar Investment
CIF Sector Recommendation Report (Fall 2012) Date: November 6, 2012 Analyst: Alyssa Wood Sector: Consumer Staples (XLP) Review Period: October 17-31, 2012 Section (A) Sector Performance Review Cougar Investment
Utility Sector. Jun Liu, Ran Yan, Hongda Zhang 5/28/2012
 Utility Sector Jun Liu, Ran Yan, Hongda Zhang 5/28/2012 Consumer Discretionary 10.04% Dividend Receivables 0.08% Cash 3.83% Telecommunicat ion Services 1.02% Materials 3.93% Consumer Staples 10.95% Information
American Customer Satisfaction Investable Index
 Investable Index s 52.5 45.0 37.5 30.0 22.5 15.0 7.5 0.0-7.5-15.0-22.5-30.0-37.5-45.0 YTD 2017 2016 2015 2014 2013 2012 2011 2010 2009 2008 Calendar Year s YTD 2017 2016 2015 2014 2013 2012 2011 2010 2009
American Customer Satisfaction Investable Index
 Investable Index s 52.5 45.0 37.5 30.0 22.5 15.0 7.5 0.0-7.5-15.0-22.5-30.0-37.5-45.0 YTD 2017 2016 2015 2014 2013 2012 2011 2010 2009 2008 Calendar Year s YTD 2017 2016 2015 2014 2013 2012 2011 2010 2009
EARNINGS UPDATE Nigerian Breweries Plc. February 2018
 Thousands RATING: HOLD Target Price: NGN128 Income Statement Summary FY2017 FY2016 NGN'bn NGN'bn Revenue 344.56 313.74 9.82% Cost of sales 201.01 178.22 12.79% Finance cost 10.66 13.65-21.85% PBT 46.63
July 3, Market Cap 7.1B following reasons:
 Student Investment Report: Crown Holdings Inc. Summary Crown Holdings is a leading global metal packaging Recommendation BUY producer with operations in 40 different countries. Sector Materials The company
Rahul Choudhry, Xiangyuan Li, Jiachen Wang, Shunxian Zou
 Sector Presentation: Financials Rahul Choudhry, Xiangyuan Li, Jiachen Wang, Shunxian Zou 1. Overview & Business Analysis 2. Economic & Financial Analysis Agenda 3. Risks & Valuation Analysis 4. Recommendation
The Rocky Mountain Beer: It s All Tapped Out.
 Brent Ozenbaugh bozenbau@mail.smu.edu Jennifer Pray jenniferpray@yahoo.com Meredith Price mprice@mail.smu.edu Lindsey Price lcprice1@aol.com Financial Summary (In Millions except for per share data) Price:
what s INSIDE SECTOR ANALYSIS CONSTITUENT ANALYSIS DISTRIBUTION ANALYSIS PERFORMANCE as of 6/30/16 3 Month Total Returns
 SDOG Quarterly Scorecard 2nd Quarter 2016 what s INSIDE ETF Stats Ticker: Underlying Index: Listing Exchange: SDOG SDOGXTR NYSE Arca CUSIP: 00162Q 858 Fund Inception: 6/29/12 Dividends Paid: Quarterly
CIF Stock Recommendation Report (Fall 2012)
") Section (A) Summary Date: 10/31/2012 Analyst Name: Hassam Al-Shamlan CIF Stock Recommendation Report (Fall 2012) Company Name and Ticker: (KO) Recommendation Buy: Yes No Target Price: $45.00 Sector: Consumer
Section (A) Summary Date: 10/31/2012 Analyst Name: Hassam Al-Shamlan CIF Stock Recommendation Report (Fall 2012) Company Name and Ticker: (KO) Recommendation Buy: Yes No Target Price: $45.00 Sector: Consumer
Buckeye Funds Consumer Staples Market Update
 Market Update Ryan Daulton Miheer Desai Kurt Elsasser Agenda Sector Overview Economic Analysis Financial Analysis Conclusion & Recommendation 2 Investment Thesis Preview Our thoughts: Sector has outperformed
The construction or provision of oil rigs, drilling. equipment, including seismic data collection.
 The construction or provision of oil rigs, drilling equipment and other energy related service and equipment, including seismic data collection. Engaged in the exploration, production, marketing, refining
Utilities: Company Presentation. Xingning Xu Yingxing Ye Jing You
 Utilities: Company Presentation Xingning Xu Yingxing Ye Jing You Agenda Portfolio Overview NRG Stock Pitch SO Stock Pitch AEP Stock Pitch SJI Stock Pitch Recommendation Recap Q&A Portfolio Overview Asset
MAX M. FISHER COLLEGE OF BUSINESS
 MAX M. FISHER COLLEGE OF BUSINESS Sector Presentation: Information Technology Presented by: Jason Idoine, Meera Butler, Nic Joy, Ramzi Khammari, Taylor Koch & David Jones 1 OVERVIEW 2 Sector Overview:
Information Technology Sector
 Information Technology Sector Student Investment Management Team Members: Harry Pan Sweta Sahu October 29 th, 2016 20162016 Agenda Sector Overview Business Analysis Economic Analysis Financial Analysis
Material Sector. Krista Rye. Eric Rittenour
 Material Sector Krista Rye Eric Rittenour 1 Overview Materials 2.91% S&P 500 BREAKDOWN Telecoms 2.80% Utilities 3.50% Consumer Dis. 12.53% Inf. Tech. 20.02% Consumer Sta. 10.40% Energy 7.29% Industrials
Sure Dividend HIGH QUALITY DIVIDEND STOCKS, LONG-TERM PLAN
 Sure Dividend HIGH QUALITY DIVIDEND STOCKS, LONG-TERM PLAN January 2016 Model Portfolio By Ben Reynolds 2 20 Stock Model Portfolio The 20 Stock Model Portfolio weights the Top 20 high quality dividend
Information Technology Stock Presentation. Yijun Ge, Bret Rosenthal, Yang Shen, Chengqiao Sun, Greg Van Wagnen, Ying Zhong
 Information Technology Stock Presentation Yijun Ge, Bret Rosenthal, Yang Shen, Chengqiao Sun, Greg Van Wagnen, Ying Zhong Information Technology Sector Review Recommendations Google (GOOG) Intel (INTC)
Equity Valuation and Analysis
 Equity Valuation and Analysis Leanna Dennard: leanna.c.dennard@ttu.edu Gavin Heckman: gavin.heckman@ttu.edu Kristin King: kristin.l.king@ttu.edu Michael Perrien: michael.a.perrien@ttu.edu Jason Sibley:
Ratios Current Industry Historical Median
 [1] $ 97.99 Retail - Defensive - Discount Stores Market Cap: $ 289,153 Mil Walmart Inc operates retail stores in various formats under various banners. Its operations comprise of three reportable business
Analyst s Handbook: Consumer Staples
 Analyst s Handbook: Consumer Staples July 6, Dr. Edward Yardeni 16-972-7683 eyardeni@ Mali Quintana 48-664-1333 aquintana@ Please visit our sites at www. blog. thinking outside the box Table Of Contents
MACKENZIE Q GLOBAL LARGE CAP QUALITY GROWTH CONSTRAINED USD. Initial Filters. Screening. Fundamental Analysis. Fundamental Analysis II
 STRATEGY PROFILE INCEPTION: September 2012 1 BENCHMARK: MSCI World Total Return Index STRATEGY ASSETS: US$ 365 million LEAD PORTFOLIO MANAGER: Paul Musson, CFA STRATEGY OVERVIEW We seek to provide long-term
Separately Managed Accounts
 Fourth Quarter 2017 Separately Managed Accounts Fayez Sarofim & Co. Large Cap Equity Portfolios Not FDIC-Insured. Not Bank-Guaranteed. May Lose Value. The following additional disclosures are provided
GLOBAL LARGE CAP QUALITY GROWTH CAD
 STRATEGY PROFILE Q4 2018 GLOBAL LARGE CAP QUALITY GROWTH CAD INCEPTION: October 1992 1 BENCHMARK: MSCI World Total Return Index STRATEGY ASSETS: C$ 7,464 million LEAD PORTFOLIO MANAGER: Paul Musson, CFA
CIF Stock Recommendation Report (Fall 2012)
") Date: 11/4/12 Analyst Name: Trevor Boren CIF Stock Recommendation Report (Fall 2012) Company Name: CVS Caremark Corp. Ticker: CVS Section (A) Summary Recommendation Buy: Yes No Target Price: N/A Stop-Loss
Date: 11/4/12 Analyst Name: Trevor Boren CIF Stock Recommendation Report (Fall 2012) Company Name: CVS Caremark Corp. Ticker: CVS Section (A) Summary Recommendation Buy: Yes No Target Price: N/A Stop-Loss
Bloomsburg Investment Group Equity Analysis PepsiCo, Inc.
 Bloomsburg Investment Group Opinion: Bloomsburg Investment Group Equity Analysis PepsiCo, Inc. Analyst: Eric Horowitz, Class of 2016 The Bloomsburg Investment Group recommends PepsiCo as a buy for steady
Last Earnings Release 10/25/2017. Last Qtr. Actual vs. Est. $0.50 / $0.49. Next Release 02/06/2018 $0.49. Year Ending 12/31/2016 $1.
 Grade Earnings Last Earnings Release 10/25/2017 Last Qtr. Actual vs. Est. $0.50 / $0.49 Next Release 02/06/2018 $0.49 Year Ending 12/31/2016 $1.91 Quick Facts Dividend Yield 3.22% 52 Wk High $47.43 52
COMPANY PRESENTATION - HEALTHCARE. Anthony Rogers, Thomas Rosol & Dylan Seymour
 COMPANY PRESENTATION - HEALTHCARE Anthony Rogers, Thomas Rosol & Dylan Seymour Agenda Overview Business Analysis Financial Analysis Valuation Analysis Company Analysis Recommendation 2 S&P 500 Sector Weight
CIF Stock Recommendation Report (Fall 2012)
") CIF Stock Recommendation Report (Fall 2012) Date: 10/16/2012 Analyst Name: Matt Leid Company Name and Ticker: Salesforce.com (CRM) Section (A) Summary Recommendation Buy: Yes No Target Price: NA Stop-Loss
CIF Stock Recommendation Report (Fall 2012) Date: 10/16/2012 Analyst Name: Matt Leid Company Name and Ticker: Salesforce.com (CRM) Section (A) Summary Recommendation Buy: Yes No Target Price: NA Stop-Loss
ENERGY SECTOR PRESENTATION
 NOVEMBER 16TH 2 0 10 S T U D E N T I N V E ST M E N T M A N A G E M E N T P R O G R A M T H E O H I O S T A T E U N I V E R S I T Y ENERGY SECTOR PRESENTATION David Clark- Joseph Felice Green Jiri Woschitz
CIF Sector Recommendation Report (Fall 2012)
") CIF Sector Recommendation Report (Fall 2012) Date:2/15/13 Analyst: Eric Klaasen Sector Consumer Staples Review Period:1/30/13-2/13/13 Section (A) Sector Performance Review Copy/paste Sector Review Spreadsheet
CIF Sector Recommendation Report (Fall 2012) Date:2/15/13 Analyst: Eric Klaasen Sector Consumer Staples Review Period:1/30/13-2/13/13 Section (A) Sector Performance Review Copy/paste Sector Review Spreadsheet
Telecom Company Presentation. Elliot Palmer Eric Richmond
 Telecom Company Presentation Elliot Palmer Eric Richmond Agenda Sector Overview Company Analysis AMT AT&T NIHD (NII Holdings) Recommendation S&P Sector Breakdown Sector S&P 500 Weight SIM Weight +/- Consumer
Lockheed Martin. Sector Manager: Daniel Curran. Senior Analyst: Kevin McDonnell. Team Analysts: Jason Flynn. Mike Havris. TJ O Sullivan.
 Lockheed Martin T r i n i t y S M F Lockheed Martin Sector Manager: Daniel Curran Senior Analyst: Kevin McDonnell Team Analysts: Jason Flynn Mike Havris TJ O Sullivan Mark Perham T R I N I T Y S M F Investment
Chapter 2: Analyzing a Company s Financial Statements & Operations
 Chapter 2: Analyzing a Company s Financial Statements & Operations To analyze a company s operations a close look must be taken at the day to day operations as well as examining a company s financial history.
PepsiCo, Inc. Recommending: Buy NYSE-PEP August 18, Beverages
 Analyst: Shane Connor 937-657-7371 connor.87@osu.edu PepsiCo, Inc. Recommending: Buy NYSE-PEP August 18, 2009 Beverages PEP-BUY Current Price $56.56 1-year Price Target $70.04 52 Week Range $43.78-75.25
Dollar General Corporation
 March 19, 2015 Dollar General Corporation Current Recommendation SUMMARY DATA NEUTRAL Prior Recommendation Outperform Date of Last Change 11/09/2011 Current Price (03/18/15) $75.39 Target Price $79.00
Company Presentation : Financials. Edouard Sevil Manpreet Singh Shazia Sultana Rahul Verma
 Company Presentation : Financials Edouard Sevil Manpreet Singh Shazia Sultana Rahul Verma Summary 1) Sector Overview 2) J.P. Morgan Chase (JPM) 3) Lincoln Financial Group (LNC) 4) Wells Fargo (WFS) 5)
Fund X-Ray December 2014
 Fund X-Ray December 2014 IMPORTANT INFORMATION CONCERNING THE INVESTMENT GOALS, RISKS, CHARGES AND EXPENSES IS CONTAINED IN THE PROSPECTUS, WHICH IS AVAILABLE AT ANY OF OUR GUARDIAN ASSET MANAGEMENT OFFICES,
Fresno County Employees' Retirement Association
 Cumulative Performance Comparisons Period Ending: December 31, Equity Style - Large Growth Last Quarter Two Quarters Three Quarters One Year Two Years Three Years Four Years Five Years 5th Percentile 10.9
Lecture 1: Security selection and securities analysis
 Lecture 1: Security selection and securities analysis In this lecture we will focus on the main methods used to select individual securities for a portfolio. These may be summarized on the one hand as
Healthcare - - SIM Company Presentations Lisa Liu Nadine Slezak Mark Venzor Rachel Wang
 Healthcare - - SIM Company Presentations Lisa Liu Nadine Slezak Mark Venzor Rachel Wang Agenda Sector Overview SIM Portfolio Overview Additional Companies Assessed Stocks Recommendation Healthcare Sector:
High Dividend Value Equity Q Commentary. Market Review:
 S C H A F E R C U L L E N High Dividend Value Equity Q3 2016 Commentary Market Review: C A P I T A L M A N A G E M E N T In the third quarter of 2016, the S&P 500 and Russell 1000 Value returned 3.9% and
ENERGY COMPANY PRESENTATION
 NOVEMBER 30TH 2 0 10 S T U D E N T I N V E ST M E N T M A N A G E M E N T P R O G R A M T H E O H I O S T A T E U N I V E R S I T Y ENERGY COMPANY PRESENTATION David Clark-Joseph Felice Green Jiri Woschitz
Dividend Builder Fund
 Dividend Builder Fund Review of the 4 th Quarter 2017 For registered investment professional use only Contents 2 Introduction to fund Market performance Summary fund performance Performance drivers and
Valued at 1 April, 2007
 Valued at 1 April, 2007 Matthew Lewis: matthew.lewis@ttu.edu Tyler Page: tyler.page@ttu.edu Alex Segreti: alexander.l.segreti@ttu.edu Andrea Spencer: andrea.spencer@ttu.edu Stephen Wiggins: stephen.wiggins@ttu.edu
Materials. sector analysis. Kevin Bush Dustin McCann Hanyang Wei. Fisher Fisher College College of of Business Student Investment Management
 Materials sector analysis Kevin Bush Dustin McCann Hanyang Wei Fisher Fisher College College of of Student Investment Management BUY S&P Sector Weights 3.66% 3.23% 2.98% 10.60% 10.42% 11.15% 18.07% 13.09%
Mueller Industries Inc.
 Mueller Industries Inc. Amanda Miller amanda.miller@ttu.edu Park Hunter park.hunter@ttu.edu Shyla Walton shyla.walton@ttu.edu Austin Head austin.head@ttu.edu Josh Jacobsen joshua.jacobsen@ttu.edu Table
Market Capitalization $97.8 Billion
 BUY HOLD SELL A+ A A- B+ B B- C+ C C- D+ D D- E+ E E- F HOLD December 17, 2017 HOLD RATING SINCE 11/10/2017 ABEV BUSINESS DESCRIPTION Ambev S.A., through its subsidiaries, produces, distributes, and sells
PSCC Invesco S&P SmallCap Consumer Staples ETF
 Invesco S&P SmallCap Consumer Staples ETF ETF.com segment: Equity: U.S. Consumer Non-cyclicals Competing ETFs: XLP, VDC, IYK, FSTA, RHS Related ETF Channels: North America, U.S., Vanilla, Consumer non-cyclicals,
CIF Stock Recommendation Report (Fall 2012)
") CIF Stock Recommendation Report (Fall 2012) Date: Nov 27 th 2012 Analyst Name: Tung Linh Company Name and Ticker: W.W. Grainger, Inc. (GWW) Section (A) Summary Recommendation Buy: No Target Price: Stop-Loss
CIF Stock Recommendation Report (Fall 2012) Date: Nov 27 th 2012 Analyst Name: Tung Linh Company Name and Ticker: W.W. Grainger, Inc. (GWW) Section (A) Summary Recommendation Buy: No Target Price: Stop-Loss
CIF Stock Recommendation Report (Fall 2012)
") Section (A) Summary CIF Stock Recommendation Report (Fall 2012) Recommendation: Do Not Buy Recommended Buy Price: $69 Sector: Industrials Company Name and Ticker: Caterpillar Inc. (CAT) Industry: Farm
Section (A) Summary CIF Stock Recommendation Report (Fall 2012) Recommendation: Do Not Buy Recommended Buy Price: $69 Sector: Industrials Company Name and Ticker: Caterpillar Inc. (CAT) Industry: Farm
Equity Analysis and Valuation of Carter s Inc. Group Members:
 Equity Analysis and Valuation of Carter s Inc. Group Members: Garrett Reeves garrett.reeves@ttu.edu Nick Bullington nick.bullington@ttu.edu John Tyler Myers johntyler.myers@ttu.edu Travis Wood travis.wood@ttu.edu
Wealth Creation and Growing Dividends
 Wealth Creation and Growing Dividends July 2016 Investing in Human Progress For Registered Investment Professional Use Only Fund manager biographies 2 Matthew Page, CFA Portfolio manager of strategy since
UTILITIES LUKE FRIEDMAN & GENO FRISSORA
 UTILITIES LUKE FRIEDMAN & GENO FRISSORA RECAP RECOMMENDED ADDING 23 BP TO UTILITIES Utilities 3.34% SIM Weighting Utilities 3.57% S&P Weighting Industrials 9.78% Materials 3.40% Telecom 3.53% Technology
Ratios Current Industry Historical Median
 [1] 51.90 Medical Devices Market Cap: 820 Mil Draegerwerk AG & Co KGaA provides medical and safety technology. The Company has two main divisions: safety division and medical division. It provides Fire
What s Inside. Sector Analysis. Constituent Analysis. Distribution Analysis. Performance as of 3/31/18
 ALPS SECTOR DIVIDEND DOGS ETF QUARTERLY SCORECARD SDOG ETF Stats Ticker: Underlying Index: Listing Exchange: SDOG SDOGXTR NYSE Arca CUSIP: 00162Q 858 Fund Inception: 6/29/12 Dividends Paid: Quarterly Most
Stock Rover Profile Metrics
 Stock Rover Profile Metrics Average Volume (3m) The average number of shares traded per day over the past 3 months. Company Unit: Name The full name of the company. Employees The number of direct employees.
The Sprott Equity Research
 Jan-10 Jul-10 Jan-11 Jul-11 Jan-12 Jul-12 Jan-13 Jul-13 Jan-14 Jul-14 Jan-15 Price per Share The Fund @ Sprott Equity Research The North West Company (NWC) Buy, Current: $25.63, Target: $27.25 January
Choice of comparable firms for multiple valuation. A paper by Jens Overgaard Knudsen, Simon Vesterby Kold and Thomas Plenborg
 Choice of comparable firms for multiple valuation A paper by Jens Overgaard Knudsen, Simon Vesterby Kold and Thomas Plenborg 1 Agenda 1 Comparable firm selection for multiple valuation 2 Our idea 3 How
threatened by the 'ups and downs' in the market or the volatility of the global economy.
 Wang Chaunfu He was born in a family of poor farmers. His parents died when he was young. In response to a question from Mr. Buffett: He said, We will never, never rest. 4 Why Study Exception Like Buffett?
U.S. LOW VOLATILITY EQUITY Mandate Search
 U.S. LOW VOLATILITY EQUITY Mandate Search Recommended: That State Street Global Advisors (SSgA) be appointed as a manager for a U.S. low volatility equity mandate. SSgA will be managing 10% of the Diversified
Interim Management Report of Fund Performance For the six-month period ended June 30, 2017
 Interim Management Report of Fund Performance For the six-month period ended June 30, 2017 WisdomTree U.S. High Dividend Index ETF (HID/HID.B) This interim management report of fund performance contains
WHIRLPOOL OF INDIA LIMITED
 WHIRLPOOL OF INDIA LIMITED Target Price INR 786.5 Initiating Coverage Report Symbiosis Centre for Management and Human Resource Development, India UPSIDE 15% 1. Improving Indian Economy 2. Strong brand
CIF Stock Recommendation Report (Fall 2012)
") Date: 2/27/13 Analyst Name: Eric Klaasen CIF Stock Recommendation Report (Fall 2012) Company Name and Ticker: Costco Wholesale Corporation (COST) Section (A) Summary Recommendation Buy: No Target Price:
Date: 2/27/13 Analyst Name: Eric Klaasen CIF Stock Recommendation Report (Fall 2012) Company Name and Ticker: Costco Wholesale Corporation (COST) Section (A) Summary Recommendation Buy: No Target Price:
Dividend Builder Fund Review of the 1st Quarter 2017
 Dividend Builder Fund Review of the 1st Quarter 2017 For registered investment professional use only Team biographies 2 Matthew Page, CFA Portfolio Manager Joined Guinness Atkinson Asset Management in
JPMorgan Funds statistics report: Large Cap Growth Fund
 NOT FDIC INSURED NO BANK GUARANTEE MAY LOSE VALUE JPMorgan Funds statistics report: Large Cap Growth Fund jpmorganfunds.com Table of contents PERFORMANCE ATTRIBUTION Performance at NAV 3 Performance attribution
Last Price Day Change Open Price Day Range 52-Week Range Proj. Yield Market Cap Volume Avg Vol. Forward P/E P/B P/S P/CF
 Morningstar Analyst Rating Page 1 of 5 Last Price Day Change Open Price Day Range 52-Week Range Proj. Yield Market Cap Volume Avg Vol. Forward P/E P/B P/S P/CF $ 47.65 [-0.40-0.83 % $ 47.95 47.65-48.65
USMC Principal U.S. Mega-Cap Multi-Factor Index ETF
 Principal U.S. Mega-Cap Multi-Factor Index ETF ETF.com segment: Equity: U.S. - Large Cap Competing ETFs: SPLV, LGLV, FDLO, JMIN, OVOL Related ETF Channels: North America, U.S., Smart-Beta ETFs, Large Cap,
MBF1223 Financial Management. Lecture 8: Financial Ratios and Firm Performance
 MBF1223 Financial Management Lecture 8: Financial Ratios and Firm Performance Learning Objectives 1. Create, understand, and interpret common-size financial statements. 2. Calculate and interpret financial
Consumer Discretionary
 Consumer Discretionary Jonathan Barkan Chris Cameron Yixiong Chen Amanda Grant November 2, 2010 Agenda Sector Overview Economic Analysis Business Analysis Financial Analysis Valuation Analysis Recommendation
S-Network Sector Dividend Dogs Index
 S-Network Sector Dividend Dogs Index Q4 2017 Index Rationale Well-Established Universe of Index Candidates S&P 500 Serves as Universe for SDOGX Comprises of 50 Constituents Stocks Must Meet All Screens
MBA SIM Fund. Board Presentation May 1, 2009
 MBA SIM Fund Board Presentation May 1, 2009 2008-2009 Student Managers Colin Nelson W.P. Carey MBA Finance Class of 2009 Jeremy Kelstrom W.P. Carey MBA Finance & Real Estate Class of 2009 Bill Pappa W.P.
NVIDIA Corporation. Analyst: Travis Wiedmeyer. INVESTMENT MANAGEMENT CERTIFICATE PROGRAM February 8, Information Technology
 Analyst: Travis Wiedmeyer INVESTMENT MANAGEMENT CERTIFICATE PROGRAM February 8, 2018 Recommendation NEUTRAL Target (today s value) $250.00 Current Price $223.77 52 week range $95.17-249.27 NVIDIA Corporation
CARRERAS LIMITED. Overview. S.W.O.T Analysis RECOMMENDATION: HOLD
 CARRERAS LIMITED ANALYSIS FOR THE FINANCIAL YEAR ENDING MARCH 2009 RECOMMENDATION: HOLD Overview Vital Statistics Current Price $41.09 Trailing EPS $7.27 Projected EPS $6.59 Current P/E 5.65X Market Average
Last Price Day Change Open Price Day Range 52-Week Range Proj. Yield Market Cap Volume Avg Vol. Forward P/E P/B P/S P/CF
 Morningstar Analyst Rating Page 1 of 5 Last Price Day Change Open Price Day Range 52-Week Range Proj. Yield Market Cap Volume Avg Vol. Forward P/E P/B P/S P/CF $ 52.70 [-0.70-1.31 % $ 53.55 52.10-53.85
Working with Financial Statements
 Working with Financial Statements Lakehead University September 2004 Overview of the Lecture 3.1 Cash Flow and Financial Statements 3.2 Standardizes Financial Statements 3.3 Ratio Analysis 3.4 Dupont Identity
Working with Financial Statements
 Working with Financial Statements Lakehead University September 2004 Overview of the Lecture 3.1 Cash Flow and Financial Statements 3.2 Standardizes Financial Statements 3.3 Ratio Analysis 3.4 Dupont Identity
Tingyi Holding Group (322.HK)
") 0 3 - N O V - 2 0 0 8 B a s i c I n f o r m a t i o n Sector Consumer Tingyi Holding Group (322.HK) A dominate player in the world s largest market BUY Prev. Closed 8.10 52-week High 13.6 52-week Low 6.6
0 3 - N O V - 2 0 0 8 B a s i c I n f o r m a t i o n Sector Consumer Tingyi Holding Group (322.HK) A dominate player in the world s largest market BUY Prev. Closed 8.10 52-week High 13.6 52-week Low 6.6
CIF Stock Recommendation Report (Fall 2012)
") CIF Stock Recommendation Report (Fall 2012) Company Name and Ticker: PepsiCo Inc. PEP Section (A) Summary Date: 10/12/12 Analyst Name: Trevor Boren Recommendation Buy: Yes Target Price: $75.69 Sector:
CIF Stock Recommendation Report (Fall 2012) Company Name and Ticker: PepsiCo Inc. PEP Section (A) Summary Date: 10/12/12 Analyst Name: Trevor Boren Recommendation Buy: Yes Target Price: $75.69 Sector:
CONSUMER DISCRETIONARY. Mike Anderson & Bingqian Lu
 CONSUMER DISCRETIONARY Mike Anderson & Bingqian Lu AGENDA Recommendations Industry Recap Analysis of Stocks Conclusion RECOMMENDATIONS Current Sector Weight: 12.80 Current SIM Weight: 12.61 Recommendation:
Corporate Profile 10 May 2012
 Recommendation Previous From date 52-week target Neutral Neutral 8 February 2012 1.22 Herti Business Summary Herti was founded in 1993 as a start-up company. It is producing various types of closures for