CIF Stock Recommendation Report (Fall 2012)
|
|
|
- Charity Cook
- 6 years ago
- Views:
Transcription
1 Date: 2/27/13 Analyst Name: Eric Klaasen CIF Stock Recommendation Report (Fall 2012) Company Name and Ticker: Costco Wholesale Corporation (COST) Section (A) Summary Recommendation Buy: No Target Price: N/A Stop-Loss Price: N/A Sector: Consumer Defensive Industry: Discount stores Market Cap (in Billions): $44.1 billion # of Shrs. O/S (in Millions): 425,658,364 Current Price: $ WK Hi: WK Low: EBO Valuation: Morningstar (MS) Fair Value Est.: $109 MS FV Uncertainty: Low MS Consider Buying: $87.20 MS Consider Selling: $ EPS (TTM): 4.11 EPS (FY1): 4.51 EPS (FY2): 5.13 MS Star Rating: 4 stars Next Fiscal Yr. End Year : 2013 Month : August Last Fiscal Qtr. End: Less Than 8 WK: No If Less Than 8 WK, next Earnings Ann. Date: Forward P/E: 19.5 Mean LT Growth: PEG: 1.72 Beta: 0.68 % Inst. Ownership: 31.40% Inst. Ownership- Net Buy: Y Analyst Consensus Recommendation: Buy Short Interest Ratio: 3.1 Short as % of Float: 1.50% Ratio Analysis Company Industry Sector P/E (TTM) P/S (TTM) P/B (MRQ) P/CF (TTM) Dividend Yield Total Debt/Equity (MRQ) Net Profit Margin (TTM) ROA (TTM) ROE (TTM)
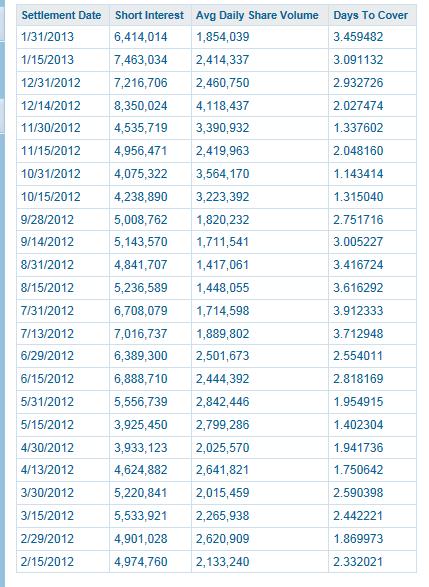
2 Investment Thesis: Costco is one of the few membership warehouse companies in the world, and has few competitors in all of their markets. They have seen increases in revenues and earnings over the past year and a half. According to the books they are financially set. They do however lack when it comes to their ratios. They do have a lower P/S and Total Debt/Equity ratio, but in the Consumer Staples sector those stocks do not always indicate that the company is well off. In the CNS, the P/CF is one of the most important and currently they have a P/CF ratio of 12.7, which is much higher than those in the industry and the sector. When you look into the stock price charts you can see that ever since the financial crisis, Costco has been on the rise, gaining close to $65 on the stock price over that time period. As of late, they are not continuing the trend. After hitting the 52 week high in early December, Costco has been stagnant and has stayed around the $100 range for the past 2 months. One reason being the current lawsuit from Tiffany jewelers over the sales of engagement rings. The stock appears to be a miss. The ratios and the current price trends indicate that the company is not as Summary Provide brief summary of your analysis in each section that follows Company Profile: Costco Wholesale corporation is engaged in the operation of membership warehouses throughout the world. They buy majority of its merchandise directly from manufacturers where they transport and sell it to those that are members in bulk. Fundamental Valuation: The EBO valuations have made the stock appear to be bearish due to the higher EPS forecasts and the higher target ROE compared to what they are at currently. All this showing that the stock is overvalued. Relative Valuation: Costco tend to be on the higher end of the valuations compared with their competitors. Their two true competitors Wal-Mart and Target show better ratios and earnings estimates than Costco. Revenue and Earnings Estimates: Costco is surprising everyone in their performance in both revenues and earnings estimates, beating estimates for the past 5 quarters. Apart from quarters ending in the August quarter, there is a steady growth in both revenues and earnings per share Analyst Recommendations: In general analysts find Costco stock to be bearish with a mean rating of However there are a good amount of analysts that want to hold the stock and one analyst that says the stock will underperform Institutional Ownership: 77.01% of the shares are held by those outside the company, and 31.4% is owned by top 10 institutions. There is currently only one company that owns more than 5% and that is Capital World Investors who have 6.6% outstanding stock Short Interest: Short interest is currently at a little over 6 million and has days to cover ratio of Currently there is no specific trend in how the short interest reacts. A month ago the days to cover ratio was Stock Price Chart: Over the past 5 years, the stock has been outperforming the sector, the S&P, and its competition. With this they are struggling over the past month, trending slowly downwards after hitting their 2
3 well off as their revenues and Earnings indicate. 52 week high at the beginning of December. The lawsuit from Tiffany has also been hindering the stock as of late. Section (B) Company Profile (two pages maximum) Company Summary Costco Wholesale Corporation is a membership warehouse club which provides a wide selection of merchandise in bulk form. They were formed in Kirkland Washington back in 1983 by James Sinegal and Jeffrey Brotman. Currently they have their headquarters in Issaquah Washington. Costco has locations in the United Kingdom, Australia, Canada, Mexico, Taiwan, South Korea, Japan, and the United States. In 1995 Costco introduced their own house brand called Kirkland Signature based off of where they were originally founded. Their idea here was to make a private label product that could provide a brand name quality at discounted prices. Business Model, Competition, Environment and Strategy Costco has mainly one operating segment in their business, which are their warehouse stores. Compared with other warehouse clubs, they do the exact same. A company such as Wal-Marts Sam s Club is the only competition that is also considered a warehouse club. While Wal-Mart and Target are somewhat competition due to the fact that they sell a wide variety of food and goods that Costco sells, just not in the extreme bulk that Costco does. The strategy that Costco brings to the table is the discount strategy. This is the main reason why Costco is showing such a consistent growth in revenues. The ability to provide goods in bulk at lower prices has been appealing to the general population. The only catch for these customers is that they have to pay an annual membership fee, which ranges around $100, which is believed to be worth it, in the amount of money the customer will end up saving. A worry for Costco going forward is growth in stores. They are currently trying to penetrate more areas on the east coast, but with the addition of more stores they are cannibalizing sales causing sales to fall in some areas. 3
4 Revenue and Earnings History This information is available in Reuters.com, Financials tab. Copy/paste the quarterly revenue and earnings per share numbers for the most recent three years. Add the numbers over four fiscal quarters to get annual revenue and earnings. For the current fiscal year, go ahead add up as many quarters as are available. NOTE: revenue numbers are in millions. Discuss any pattern in revenue and earnings (e.g., increasing year over year; seasonal; etc.) Revenue EPS $88,915 $99,137 $23715* * *=Current quarter for 2013 only For revenue there seems to be an irregular pattern where the revenue rises until the 2 nd period until there is a slight drop, followed by an extreme increase in revenue which stands far above any of the previous quarters and the following November period. Earnings per share continue the same pattern as the revenues, showing that Revenue and EPS are more correlated on each other s performance. Section (C) Fundamental Valuation (EBO) Include the following here: Copy/paste completed Fundamental Valuation (EBO) Spreadsheet 4
: Book value: 12,690,728,143.32 # of shares outstanding: 435,658,364 Book value / share: 29.13 Dividend payout ratio: 26.")
5 Inputs (provide below input values used in your analysis) EPS forecasts (FY1 & FY2): 4.51 & 5.13 Long-term growth rate: Book value /share (along with book value and number of shares outstanding): Book value: 12,690,728, # of shares outstanding: 435,658,364 Book value / share: Dividend payout ratio: 26.12% Next fiscal year end: 2013 Current fiscal month: 6 Target ROE: 14.70% 5
: 121.93 if changing above normal growth period to 6 108.")
6 Output Above normal growth period chosen: 4 EBO valuation (Implied price from the spreadsheet): Sensitivity Analysis EBO valuation would be (you can include more than one scenario in each of the following): if changing above normal growth period to if changing growth rate from mean (consensus) to the highest estimate 15.00% if changing growth rate from mean (consensus) to the lowest estimate 11.80% if changing discount rate to 8% if changing target ROE to 20% Discount rate: 5.67% (Rf:1.88% ER:10% Beta: 0.68) Section (D) Relative Valuation Copy/paste your completed relative valuation spreadsheet here From the top panel Discuss whether your stock and its competitors have very different multiples. Point out if any of the five stocks have multiple that is far off from the others. Make an attempt to explain why 6
7 (you would want to read analyst research report in Morningstar Direct; you should also look for comments from other financial sites). The discussions should address all of the following valuation metrics: forward P/E, PEG, P/B (MRQ), P/S (TTM), and P/CF (TTM). Compare the implied prices derived from various valuation metrics. Also compare those implied price to the stock s current price, and 52-week high and low. Costco compared with their competitors tends to be different than the rest. Their earnings estimate for the next fiscal year is below their true two competitors but it is much better than that of its minor competitors. Which can be a little bearish for the future, but when you look into the mean long term growth rate you can see that the growth rate of Costco is significantly better than everyone. In my opinion the earnings estimate for the next fiscal year and the mean long term growth rate do not truly show how the company will compare with their competitors in the future. For the rest of the ratios, Costco tend to be on the worse side of the spectrum when comparing to its competitors (apart from the P/S ratio). The P/CF is much higher than its true competitors, its ROE is below nearly everyone, and the P/B sits above 3 out of the 4 competitors. Both the calculated forward P/E and the PEG are both higher than the competition. It seems that Costco is doing well for itself, but it is struggling compared to its competition. The one that makes sense to be struggling against is WMT, due to their large market cap but Target on the other hand is around the same market cap but appears to be outperforming Costco. From the bottom panel Discuss the various implied prices of your stock derived from competitors ( comparables ) multiples. How different are the prices derived from the various valuation metrics? Note any valuation metrics that seem to yield outlier prices and explain why (HINT: is that because that particular valuation metrics is not very relevant for the industry? Do you best to provide convincing arguments). For each valuation metrics, Compare the current price and 52-week high /low of your stock to the High-low range derived from multiples of its competitors. Among the valuation metrics analyzed, which ones do you think are most relevant as a valuation tool for your stock? Out of all the valuation metrics, only the high value dollar value and the DG value match close to what the 52 week high, and the median for P/CF matches close to what the 52 week low. Other than those few numbers there really are no numbers that meet what the current stock price or 52 week spread. From the looks of it, we would assume that majority of these valuations is not that relevant to the Consumer Staples sector. Those that are the most relevant 7
8 to the current stock price and the 52 week spread is the value ratio and the P/CF. These are the only two that are relatively close to what the stock is trading at. Section (E) Revenue and Earnings Estimates Copy/Paste the Historical Surprises Table from Reuters.com, Analysts tab (include both revenue and earnings; make note that revenues might be in millions ) Review recent trends in company s reported revenue and earnings, and discuss whether (1) the company has a pattern of surprising the market with numbers different from analysts estimates; (2) Were they positive(actual greater than estimate) or negative (actual less than estimate) surprises? (3) Were surprises more notable for revenue or earnings? (4) Look up the stock chart to see how the stock price reacted to the surprises. NOTE: Reuters does not put the sign on the surprise. You need to put a negative sign when it is a negative surprise. There are real no patterns that go along with the historical surprises. All of the estimates were below the actual sales and the earnings per share. When the largest surprise hit in the quarter ending in August 2012, both Sales and earnings per share were the biggest surprise to take place within the last year and a half. Surprises were more notable for earnings, where the majority of the surprises were 1.2% and above. Apart from the quarter ending in November 8
9 2011, all surprises caused the stock price to increase with the surprise in November 2012 being the highest increase in stock price. Copy/paste the Consensus Estimates Analysis Table from Reuters.com, Analysts tab (include both revenue and earnings) Review the range and the consensus of analysts estimates. (1) Calculate the % difference of the high estimate from the consensus (mean); (2) Calculate the % (negative) difference of the low estimate from the consensus; (3) Are the divergent more notable for the current or outquarter, FY1 or FY2, revenue or earnings? (4) Note the number of analysts providing LT growth rate estimate. It that roughly the same as the number of analysts providing revenue and earnings estimates? Sales Difference between mean and high Quarter Feb % 2.4% Quarter May % 2.6% Year Aug % 1.8% Difference between mean and low 9
10 Year Aug % 6.1% EPS Quarter Feb % 2.9% Quarter May % 4.0% Year Aug % 2.7% Year Aug % 4.6% LT Growth rate 13.1% 10.5% The most notable differences come in during the LT growth rate, the year ending in August 2014 for revenue and the quarter ending in May 2013 for EPS. Majority of the other difference are quite close to each other and tend to trade off on those that are larger or smaller. The large differences in the LT growth rate could have come from the low amount of analysts. There are only 7 analysts analyzing the LT growth rate compared to an average of 16 analysts for revenue and an average of 21 analysts for earnings per share. Copy/paste the Consensus Estimates Trend Table from Reuters.com, Analysts tab (include both revenue and earnings) Review recent trend of analysts consensus (mean) estimates on revenue and earnings. (1) Are the consensus estimates trending up, down, or stay the same? (2) Is the trend more notable for 10
11 the near- or out- quarter, FY1 or FY2, revenue or earnings? Analysts estimates on revenue for the most part are trending up. The only exception being for the year ending Aug 2014 where the estimates have dropped a little bit compared with what it was at 2 months ago. The same trend applies to EPS, where the only year where the estimates went down was for year ending in August The trend is more notable for revenues but only a little bit. The changes (both positive and negative) are miniscule compared to the numbers given. Copy/paste the Estimates Revisions Summary Table from Reuters.com, Analysts tab (include both revenue and earnings) Review the number of analysts revising up or down their estimates (both revenue and earnings) in the last and last four weeks. (1) Note whether there are more up or down revisions; (2) are the revisions predominantly one directional? (3) Any notable difference last week versus last four weeks, revenue versus earnings? 11
12 There were many more up revisions per quarter and year than there was down revisions. The only down revision came in revenues at the most recent quarter, where one analyst down voted and two up voted. There were no revisions in within the last week. There were no more than two revisions for a single quarter or year. You will need to incorporate what you see here with Morningstar s analyst research report (you can access Morningstar Direct at the Financial Markets Lab.) and other readings/analysis you found from various on-line financial sites. Discuss whether you think the company has a good chance of making or beating analyst consensus estimate, and why. Based on how the stock has been trading lately, do you think market has already anticipated strong or lackluster financial outlook from the company? Based on the information given I believe the stock could beat analyst estimates. If it continues its trend from over the past year and follows all the up revisions, then it could most definitely beat estimates. But if you look into the stock price chart for the past year and look at the 52 week spread, then you would think something else. The stock is currently trading at $5 less than the current 52 week high and the current trend for the last month is downward. A mix of these two things makes me wonder what the stock will be doing. If it follows analysts it will increase, but if it follows its current trend, then it will go down. With a mix of the ratios I believe that we may have missed out on the opportunity and that it will currently be trending downward. 12
13 Section (F) Analysts Recommendations Copy/paste the Analyst Recommendations and Revisions Table from Reuters.com, Analysts tab. NOTE: Make sure you copy the entire table including the Mean Rating at the bottom of the table. 13
14 *There have been no upgrades or downgrades for Costco within the last two months according to CNBC.com Review the trend of analyst recommendations over the last three months. Is there a notable change of analyst opinions, turning more bullish or bearish? How many different ratings out of the five possible ones did the company receive currently, one, two, and three months ago? Is there a notable trend of opinion convergence or divergence? Is what you see here consistent to comments in Morningstar analyst s research report as well as various online financial sites you had researched on? NOTE: On a Five-point scale, Reuters assigns 1 to Buy, the most bullish recommendation, and 5 to Sell, the most bearish recommendation. Some other online sites have opposite scale, with their 1 being the most bearish and 5 being the most bullish recommendations. Overall Costco Stock looks bullish with a mean analyst recommendation of It is 0.20 less than it was 3 months ago. Overall analysts have been have been suggesting that we buy the stock more than they did a few months ago, but despite this there are still a substantial amount of analysts that are saying that we hold the stock and the one person that tells us that it will underperform. The one analyst that said to sell the stock 3 months ago is no longer feeling the same way as he/she did. This could mean that this one person started to be optimistic, or that person could one of the two people that no longer give their recommendation. Section (G) Institutional Ownership Copy/paste the completed CIF Institutional Ownership spreadsheet here. 14
 the extent of the (> 5%) owners, and (4) this could be a bullish or bearish indication of future stock price movement.")
15 Combine information provided in all three sections to discuss whether (1) institutions, on net basis, have been increasing or decreasing ownership and how significant, (2) the stock has sizable institution interests and support, (3) the extent of the (> 5%) owners, and (4) this could be a bullish or bearish indication of future stock price movement. For the most part, there have been more institutions that are increasing their share held of Costco, but those that are decreasing their ownership are getting rid of a lot of their stocks. One firm specifically that decreased their ownership was Davis selected advisors (an independent investment firm from Arizona) who sold 2.7 million shares, decreasing their ownership by 15.3%. Without selling those stocks, they still would not have held over 5% of the company. Those that are currently holding shares are major firms such as Capital world 15
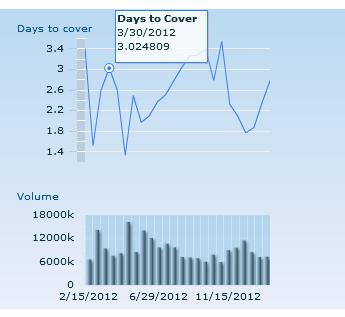
16 investors, vanguard, Blackrock, fidelity, and more. The only owner that owns more than 5% of the company is Capital World Investors who own 6.6% of the stock. This could be bullish indication for the stock, because those that hold the most stock are larger firms. Majority of those that are getting rid of the stock are smaller firms. Section (H) Short Interest (two pages) From (NASDAQ s website) Copy/paste or enter the data in the following table. You also need to copy/paste the chart to the right. Copy/paste or type the information from short interest table. You will start from the most recent release date, and go back for a year (some stocks may not have data go back for a year) 16
17 17

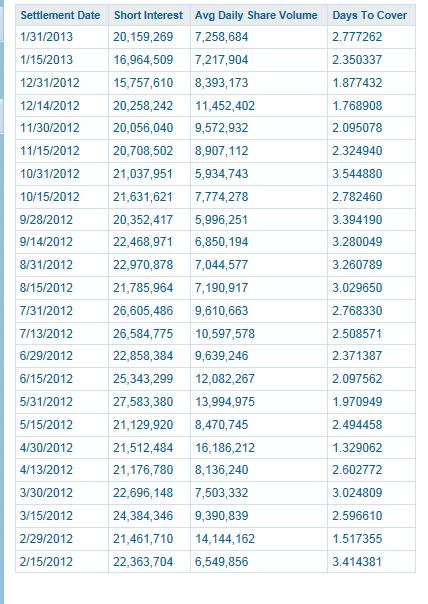
18 Wal-Mart 18
19 19

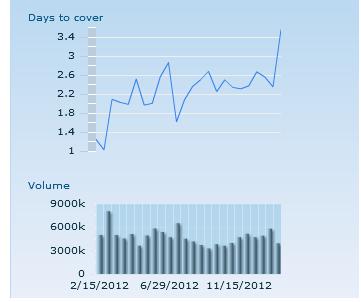
20 Target Corp From 20
21 Complete the following table with information from the share statistics table. Avg Vol Avg Vol Shares (3 month) (10 day) Outstanding Float 2,679,670 2,255, M M Shares Short Short Ratio Short % of Float Shares Short (Most recent date) (Most recent date) (Most recent date) (2 weeks prior) 6.41M % 7.46M Based on the short interest statistics and its recent trend, how is the market sentiment on the stock? Has the sentiment turned more bullish or bearish over the last year? How about in more recent month and why? From the looks of it, it seems as though the stock is becoming more bearish than it is bullish. The average volume of the stocks is much less over the past 10 days than it was 3 months ago. It seems that people are starting to sell the stock more and more than they were, meaning that they are less optimistic than they were a few months back. The float is a little bit less than the shares outstanding are, which can show that a sort of bad sign, but by the small amount in the difference, it is sort of irrelevant. The amount of shares short recently is looking much better than it did 2 weeks prior. This shows one of the only things that could indicate that the stock is bullish. Other than that, there are no indications that the stock will be bullish and outperform Section (I) Stock Charts A three months price chart Copy/paste the 3 Mos. stock chart here 21


22 A one year price chart Copy/paste the 1 Yr stock chart here A five year price chart Copy/paste the 5 Yrs. stock chart here 22

23 Discuss what you observe from the stock charts. This should include comparing your stock to competitors, sector, and SP500 over the three different time horizons. In the 3 month, Costco and its main competitors are doing worse than the S&P 500 as well as the XLP as a whole which is doing about the same as the S&P. Costco however is beating out the competition despite a sharp drop in the beginning of December of last year. When looking into the year stock chart, Wal-mart is beating out everyone including the S&P and the sector. Costco is doing the second best, just slightly below WMT. Finally in the 5 year stock chart, Costco is dominating everyone thanks to a big year in 2011 and Moving Average 6 month 23
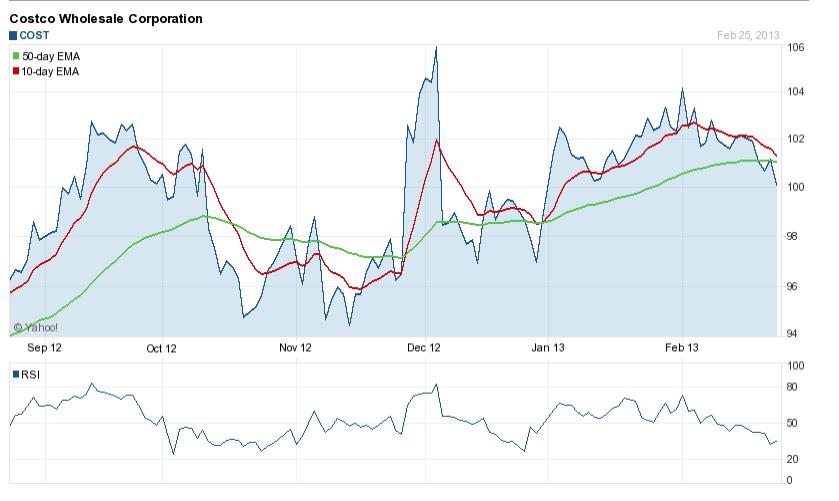
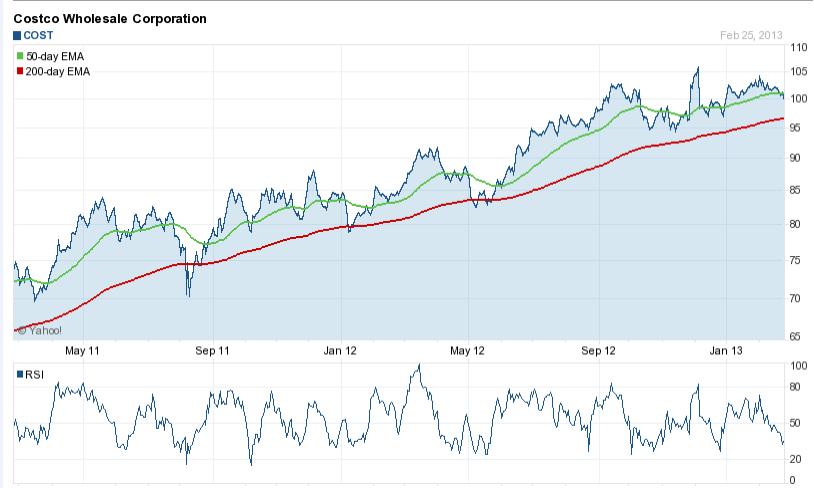
24 2 year 24
25 When looking at the 6 month moving average, it encounters two death crosses and two golden crosses. The second pair of crosses happens very quickly, meaning that it wasn t very significant that it even happened. By the way the stock is trending now, it appears that another death cross could appear very soon if the stock drops anymore. The 2 year moving average on the other hand looks much better, where there are no death crosses that are being made. It does come close at points where the stock price dips, but there are none. If the trend of the stock being stagnant and on the way down continues, we could see the first death cross on the 2 year moving average graph. 25
26 References -Morningstar Direct
CIF Stock Recommendation Report (Fall 2012)
") Date: 10/11/12 Analyst Name: Joseph Brendel CIF Stock Recommendation Report (Fall 2012) Section (A) Summary Company Name and Ticker: Prudential (PRU) Recommendation Buy: No Target Price: 35 Sector: Financials
Date: 10/11/12 Analyst Name: Joseph Brendel CIF Stock Recommendation Report (Fall 2012) Section (A) Summary Company Name and Ticker: Prudential (PRU) Recommendation Buy: No Target Price: 35 Sector: Financials
CIF Stock Recommendation Report (Spring 2013)
") Date: 4/08/2013 Analyst Name: Frank McLaughlin CIF Stock Recommendation Report (Spring 2013) Section (A) Summary Company Name and Ticker: Monsanto Co. (MON) Recommendation Buy: Yes Target Price: $115 Sector:
Date: 4/08/2013 Analyst Name: Frank McLaughlin CIF Stock Recommendation Report (Spring 2013) Section (A) Summary Company Name and Ticker: Monsanto Co. (MON) Recommendation Buy: Yes Target Price: $115 Sector:
CIF Stock Recommendation Report (Spring 2013)
") Date: 2/26/13 Analyst Name: Frank McLaughlin CIF Stock Recommendation Report (Spring 2013) Company Name and Ticker: PPG Industries Inc. (PPG) Section (A) Summary Recommendation Buy: Yes No Target Price:
Date: 2/26/13 Analyst Name: Frank McLaughlin CIF Stock Recommendation Report (Spring 2013) Company Name and Ticker: PPG Industries Inc. (PPG) Section (A) Summary Recommendation Buy: Yes No Target Price:
CIF Stock Recommendation Report (Fall 2012)
") Section (A) Summary Date: 11/29/12 Analyst Name: Eric Russell CIF Stock Recommendation Report (Fall 2012) Company Name and Ticker:_Tiffany & Co (TIF) Recommendation Buy: Yes No Target Price: $71.00 Stop-Loss
Section (A) Summary Date: 11/29/12 Analyst Name: Eric Russell CIF Stock Recommendation Report (Fall 2012) Company Name and Ticker:_Tiffany & Co (TIF) Recommendation Buy: Yes No Target Price: $71.00 Stop-Loss
CIF Stock Recommendation Report (Fall 2012)
") Date: 11/4/12 Analyst Name: Trevor Boren CIF Stock Recommendation Report (Fall 2012) Company Name: CVS Caremark Corp. Ticker: CVS Section (A) Summary Recommendation Buy: Yes No Target Price: N/A Stop-Loss
Date: 11/4/12 Analyst Name: Trevor Boren CIF Stock Recommendation Report (Fall 2012) Company Name: CVS Caremark Corp. Ticker: CVS Section (A) Summary Recommendation Buy: Yes No Target Price: N/A Stop-Loss
CIF Stock Recommendation Report (Fall 2012)
") Date: December 3, 2012 Analyst Name: Chris Letcher CIF Stock Recommendation Report (Fall 2012) Company Name and Ticker: Northern Trust Corporation (NTRS) Section (A) Summary Recommendation Buy: No Target
Date: December 3, 2012 Analyst Name: Chris Letcher CIF Stock Recommendation Report (Fall 2012) Company Name and Ticker: Northern Trust Corporation (NTRS) Section (A) Summary Recommendation Buy: No Target
CIF Stock Recommendation Report (Fall 2012)
") Date: 10/11/12 Analyst Name: Matthew Landen CIF Stock Recommendation Report (Fall 2012) Company Name and Ticker: UnitedHealth Group Inc (UNH) Section (A) Summary Recommendation Buy: No Target Price: Stop-
Date: 10/11/12 Analyst Name: Matthew Landen CIF Stock Recommendation Report (Fall 2012) Company Name and Ticker: UnitedHealth Group Inc (UNH) Section (A) Summary Recommendation Buy: No Target Price: Stop-
CIF Stock Recommendation Report (Fall 2012)
") Date:_10/9/2012 Analyst Name: Scott R. Mertens CIF Stock Recommendation Report (Fall 2012) Company Name and Ticker:_JPMorgan Chase_(JPM) Section (A) Summary Recommendation Buy: Yes Target Price: $49.24
Date:_10/9/2012 Analyst Name: Scott R. Mertens CIF Stock Recommendation Report (Fall 2012) Company Name and Ticker:_JPMorgan Chase_(JPM) Section (A) Summary Recommendation Buy: Yes Target Price: $49.24
CIF Stock Recommendation Report (Spring 2013)
") Date: February 6, 2013 Analyst Name: Matt Leid CIF Stock Recommendation Report (Spring 2013) Section (A) Summary Company Name and Ticker: Noble Corporation (NE) Recommendation Buy: Yes No Target Price:
Date: February 6, 2013 Analyst Name: Matt Leid CIF Stock Recommendation Report (Spring 2013) Section (A) Summary Company Name and Ticker: Noble Corporation (NE) Recommendation Buy: Yes No Target Price:
CIF Stock Recommendation Report (Fall 2012)
") Date: Saturday, November 10, 2012 Analyst Name: Fausto Guillén Aguilar Jr. CIF Stock Recommendation Report (Fall 2012) Company Name and Ticker: International Business Machines Corp IBM Section (A) Summary
Date: Saturday, November 10, 2012 Analyst Name: Fausto Guillén Aguilar Jr. CIF Stock Recommendation Report (Fall 2012) Company Name and Ticker: International Business Machines Corp IBM Section (A) Summary
CIF Stock Recommendation Report (spring 2013)
") Date: 4/3/2013 Analyst Name: Matt Vague CIF Stock Recommendation Report (spring 2013) Section (A) Summary Company Name and Ticker: O Reilly Automotive Inc (ORLY) Recommendation Buy: Yes No Target Price:
Date: 4/3/2013 Analyst Name: Matt Vague CIF Stock Recommendation Report (spring 2013) Section (A) Summary Company Name and Ticker: O Reilly Automotive Inc (ORLY) Recommendation Buy: Yes No Target Price:
CIF Stock Recommendation Report (Fall 2012)
") CIF Stock Recommendation Report (Fall 2012) Date: Nov 27 th 2012 Analyst Name: Tung Linh Company Name and Ticker: W.W. Grainger, Inc. (GWW) Section (A) Summary Recommendation Buy: No Target Price: Stop-Loss
CIF Stock Recommendation Report (Fall 2012) Date: Nov 27 th 2012 Analyst Name: Tung Linh Company Name and Ticker: W.W. Grainger, Inc. (GWW) Section (A) Summary Recommendation Buy: No Target Price: Stop-Loss
CIF Stock Recommendation Report (Fall 2012)
") Date: 10/13/2012 Analyst Name: Ryan Ellingsen CIF Stock Recommendation Report (Fall 2012) Company Name and Ticker: Colgate-Palmolive Company (CL) Section (A) Summary Recommendation Buy: Hold Target Price:
Date: 10/13/2012 Analyst Name: Ryan Ellingsen CIF Stock Recommendation Report (Fall 2012) Company Name and Ticker: Colgate-Palmolive Company (CL) Section (A) Summary Recommendation Buy: Hold Target Price:
CIF Stock Recommendation Report (Fall 2012)
") CIF Stock Recommendation Report (Fall 2012) Date: 10/16/2012 Analyst Name: Matt Leid Company Name and Ticker: Salesforce.com (CRM) Section (A) Summary Recommendation Buy: Yes No Target Price: NA Stop-Loss
CIF Stock Recommendation Report (Fall 2012) Date: 10/16/2012 Analyst Name: Matt Leid Company Name and Ticker: Salesforce.com (CRM) Section (A) Summary Recommendation Buy: Yes No Target Price: NA Stop-Loss
CIF Stock Recommendation Report (Fall 2012)
") Date: 10/16/2012 Analyst Name: Matthew Vague CIF Stock Recommendation Report (Fall 2012) Company Name and Ticker: Chevron (CVX) Section (A) Summary Recommendation Buy: Yes Target Price: Stop-Loss Price:
Date: 10/16/2012 Analyst Name: Matthew Vague CIF Stock Recommendation Report (Fall 2012) Company Name and Ticker: Chevron (CVX) Section (A) Summary Recommendation Buy: Yes Target Price: Stop-Loss Price:
CIF Stock Recommendation Report (Spring 2015)
") Date: March 4, 2015 Analyst Name: Brady Arnone, CJ Lee CIF Stock Recommendation Report (Spring 2015) Section (A) Investment Summary Recommendation Buy: Yes Sector: Technology Company Name and Ticker: Visa
Date: March 4, 2015 Analyst Name: Brady Arnone, CJ Lee CIF Stock Recommendation Report (Spring 2015) Section (A) Investment Summary Recommendation Buy: Yes Sector: Technology Company Name and Ticker: Visa
CIF Stock Recommendation Report (Fall 2012)
") Section (A) Summary Date: 11/06/12 Analyst Name: Austin Frazier CIF Stock Recommendation Report (Fall 2012) Company Name and Ticker: GameStop (GME) Recommendation Buy: Yes No Target Price: 26.00 Sector:
Section (A) Summary Date: 11/06/12 Analyst Name: Austin Frazier CIF Stock Recommendation Report (Fall 2012) Company Name and Ticker: GameStop (GME) Recommendation Buy: Yes No Target Price: 26.00 Sector:
CIF Stock Recommendation Report (Spring 2014)
") Date: 2/28/14 Analyst Name: Anthony Ledesma & Mason Yang CIF Stock Recommendation Report (Spring 2014) Company Name and Ticker: UnitedHealth Group (UNH) Section (A) Investment Summary Recommendation Buy:
Date: 2/28/14 Analyst Name: Anthony Ledesma & Mason Yang CIF Stock Recommendation Report (Spring 2014) Company Name and Ticker: UnitedHealth Group (UNH) Section (A) Investment Summary Recommendation Buy:
CIF Stock Recommendation Report (Spring 2015)
") Date: 3/3/2015 Analyst Name: Connor Black and Ali Al-Lawati CIF Stock Recommendation Report (Spring 2015) Company Name and Ticker: Danaher (DHR) Section (A) Investment Summary Recommendation Buy: Yes Target
Date: 3/3/2015 Analyst Name: Connor Black and Ali Al-Lawati CIF Stock Recommendation Report (Spring 2015) Company Name and Ticker: Danaher (DHR) Section (A) Investment Summary Recommendation Buy: Yes Target
CIF Stock Recommendation Report (Fall 2012)
") CIF Stock Recommendation Report (Fall 2012) Company Name and Ticker: PepsiCo Inc. PEP Section (A) Summary Date: 10/12/12 Analyst Name: Trevor Boren Recommendation Buy: Yes Target Price: $75.69 Sector:
CIF Stock Recommendation Report (Fall 2012) Company Name and Ticker: PepsiCo Inc. PEP Section (A) Summary Date: 10/12/12 Analyst Name: Trevor Boren Recommendation Buy: Yes Target Price: $75.69 Sector:
CIF Stock Recommendation Report (Fall 2012)
") Section (A) Summary Date: 3/8/13 Analyst Name: Matthew Landen CIF Stock Recommendation Report (Fall 2012) Company Name and Ticker: Aflac Inc. (AFL) Recommendation Buy: Yes Target Price: $58.77 (+15%) Sector:
Section (A) Summary Date: 3/8/13 Analyst Name: Matthew Landen CIF Stock Recommendation Report (Fall 2012) Company Name and Ticker: Aflac Inc. (AFL) Recommendation Buy: Yes Target Price: $58.77 (+15%) Sector:
CIF Stock Recommendation Report (Fall 2012) MS Consider Buying: 49. If Less Than 8 WK, next Earnings Ann. Date: Short Interest Ratio: 1.
 MS Consider Buying: 49. If Less Than 8 WK, next Earnings Ann. Date: Short Interest Ratio: 1.") Date: October 14 2012 Analyst Name: Justin L. Jaena CIF Stock Recommendation Report (Fall 2012) Company Name and Ticker:_BBBY Section (A) Summary Recommendation Buy: Yes Target Price: 70 Stop-Loss Price:
Date: October 14 2012 Analyst Name: Justin L. Jaena CIF Stock Recommendation Report (Fall 2012) Company Name and Ticker:_BBBY Section (A) Summary Recommendation Buy: Yes Target Price: 70 Stop-Loss Price:
CIF Stock Recommendation Report (Spring 2013)
") Date: 3/22/13 Analyst Name: Jacob Allen CIF Stock Recommendation Report (Spring 2013) Company Name and Ticker: CareFusion Corp. (CFN) Section (A) Summary Recommendation Buy: Yes No Target Price: Stop-Loss
Date: 3/22/13 Analyst Name: Jacob Allen CIF Stock Recommendation Report (Spring 2013) Company Name and Ticker: CareFusion Corp. (CFN) Section (A) Summary Recommendation Buy: Yes No Target Price: Stop-Loss
CIF Stock Recommendation Report (Fall 2012)
") Section (A) Summary CIF Stock Recommendation Report (Fall 2012) Recommendation: Do Not Buy Recommended Buy Price: $69 Sector: Industrials Company Name and Ticker: Caterpillar Inc. (CAT) Industry: Farm
Section (A) Summary CIF Stock Recommendation Report (Fall 2012) Recommendation: Do Not Buy Recommended Buy Price: $69 Sector: Industrials Company Name and Ticker: Caterpillar Inc. (CAT) Industry: Farm
CIF Stock Recommendation Report (Fall 2012)
") Section (A) Summary CIF Stock Recommendation Report (Fall 2012) Company Name and Ticker: Boeing BA Recommendation Buy: Yes Target Price: $83.00 Sector: Industrials Industry: Aerospace & Defense Market
Section (A) Summary CIF Stock Recommendation Report (Fall 2012) Company Name and Ticker: Boeing BA Recommendation Buy: Yes Target Price: $83.00 Sector: Industrials Industry: Aerospace & Defense Market
CIF Stock Recommendation Report (Fall 2012) Summary
 Summary") Date: 11/6/2012 Analyst Name: Kyle Temple CIF Stock Recommendation Report (Fall 2012) Company Name and Ticker: Dover Corp Summary DOV Recommendation Buy: Yes No Target Price: $65.00 Sector: Industrials
Date: 11/6/2012 Analyst Name: Kyle Temple CIF Stock Recommendation Report (Fall 2012) Company Name and Ticker: Dover Corp Summary DOV Recommendation Buy: Yes No Target Price: $65.00 Sector: Industrials
Current Price: $ WK Hi: $ WK Low: $55.21 EBO Valuation: $73.07
 Date: April 12 th, 2014 Analyst Name: Trevor Russell CIF Stock Recommendation Report (Spring 2014) Company Name and Ticker: CVS Caremark Corporation (CVS) Section (A) Investment Summary Recommendation
CIF Stock Recommendation Report (Spring 2015)
") Date:_4/4/14 Analyst Name:_Courtney Hastings, Dom Niolu CIF Stock Recommendation Report (Spring 2015) Company Name and Ticker: Praxair_PX Section (A) Investment Summary Recommendation Buy: Yes No Target
Date:_4/4/14 Analyst Name:_Courtney Hastings, Dom Niolu CIF Stock Recommendation Report (Spring 2015) Company Name and Ticker: Praxair_PX Section (A) Investment Summary Recommendation Buy: Yes No Target
CIF Sector Recommendation Report (Fall 2012)
") CIF Sector Recommendation Report (Fall 2012) Date:2/15/13 Analyst: Eric Klaasen Sector Consumer Staples Review Period:1/30/13-2/13/13 Section (A) Sector Performance Review Copy/paste Sector Review Spreadsheet
CIF Sector Recommendation Report (Fall 2012) Date:2/15/13 Analyst: Eric Klaasen Sector Consumer Staples Review Period:1/30/13-2/13/13 Section (A) Sector Performance Review Copy/paste Sector Review Spreadsheet
CIF Stock Recommendation Report (Spring 2013)
") Date: 2/11/2013 Analyst Name: Bradley Barham CIF Stock Recommendation Report (Spring 2013) Section (A) Summary Company Name and Ticker: CNH Global N.V. (CNH)_ Recommendation Buy: Yes No Target Price: 55.00
Date: 2/11/2013 Analyst Name: Bradley Barham CIF Stock Recommendation Report (Spring 2013) Section (A) Summary Company Name and Ticker: CNH Global N.V. (CNH)_ Recommendation Buy: Yes No Target Price: 55.00
CIF Stock Recommendation Report (Fall 2012)
") Section (A) Summary Date: 2/22/13 Analyst Name: Khalid Surur CIF Stock Recommendation Report (Fall 2012) Company Name and Ticker: Nike (NKE) Recommendation Buy: Yes Target Price: $60 Stop-Loss Price: $50
Section (A) Summary Date: 2/22/13 Analyst Name: Khalid Surur CIF Stock Recommendation Report (Fall 2012) Company Name and Ticker: Nike (NKE) Recommendation Buy: Yes Target Price: $60 Stop-Loss Price: $50
CIF Stock Recommendation Report (Fall 2012)
") Section (A) Summary Date: 10/31/2012 Analyst Name: Hassam Al-Shamlan CIF Stock Recommendation Report (Fall 2012) Company Name and Ticker: (KO) Recommendation Buy: Yes No Target Price: $45.00 Sector: Consumer
Section (A) Summary Date: 10/31/2012 Analyst Name: Hassam Al-Shamlan CIF Stock Recommendation Report (Fall 2012) Company Name and Ticker: (KO) Recommendation Buy: Yes No Target Price: $45.00 Sector: Consumer
CIF Stock Recommendation Report (Spring 2013)
") Date: Feb. 4th Analyst Name: Jace Hochwalt CIF Stock Recommendation Report (Spring 2013) Company Name and Ticker: Monster Beverage (MNST) Section (A) Summary Recommendation Buy: Yes No Target Price: N/A
Date: Feb. 4th Analyst Name: Jace Hochwalt CIF Stock Recommendation Report (Spring 2013) Company Name and Ticker: Monster Beverage (MNST) Section (A) Summary Recommendation Buy: Yes No Target Price: N/A
CIF Stock Recommendation Report (Fall 2012)
") Date: 2/8/13 Analyst Name:_Walter Nabarrete CIF Stock Recommendation Report (Fall 2012) Company Name and Ticker: Praxair (PX) Section (A) Summary Recommendation Buy: Yes No Target Price: N/A Stop-Loss
Date: 2/8/13 Analyst Name:_Walter Nabarrete CIF Stock Recommendation Report (Fall 2012) Company Name and Ticker: Praxair (PX) Section (A) Summary Recommendation Buy: Yes No Target Price: N/A Stop-Loss
CIF Stock Recommendation Report (Fall 2012)
") Section (A) Summary Date: 12/6/2012 Analyst Name: Jacob Allen CIF Stock Recommendation Report (Fall 2012) Company Name and Ticker: Qualcomm Inc. (QCOM) Recommendation Buy: Yes No Target Price: $67.00 Sector:
Section (A) Summary Date: 12/6/2012 Analyst Name: Jacob Allen CIF Stock Recommendation Report (Fall 2012) Company Name and Ticker: Qualcomm Inc. (QCOM) Recommendation Buy: Yes No Target Price: $67.00 Sector:
CIF Stock Recommendation Report (Fall 2012)
") Date: 2/29/2013 Analyst Name: Matt Vague CIF Stock Recommendation Report (Fall 2012) Company Name and Ticker: Wynn Resorts Ltd. (WYNN) Section (A) Summary Recommendation Buy: Yes No Target Price: Stop-Loss
Date: 2/29/2013 Analyst Name: Matt Vague CIF Stock Recommendation Report (Fall 2012) Company Name and Ticker: Wynn Resorts Ltd. (WYNN) Section (A) Summary Recommendation Buy: Yes No Target Price: Stop-Loss
CIF Stock Recommendation Report (Spring 2014)
") Date: March 7 Analyst Name: Mason Yang_ CIF Stock Recommendation Report (Spring 2014) Company Name and Ticker: St. Jude Medical Inc. (STJ) Section (A) Investment Summary Recommendation Buy: Yes No Target
Date: March 7 Analyst Name: Mason Yang_ CIF Stock Recommendation Report (Spring 2014) Company Name and Ticker: St. Jude Medical Inc. (STJ) Section (A) Investment Summary Recommendation Buy: Yes No Target
CIF Stock Recommendation Report (Fall 2012)
") Date: November 15, 2012 Analyst Name: Jun Mei CIF Stock Recommendation Report (Fall 2012) Company Name and Ticker: Simon Property Group (SPG) Section (A) Summary Recommendation Buy: Yes No Target Price:
Date: November 15, 2012 Analyst Name: Jun Mei CIF Stock Recommendation Report (Fall 2012) Company Name and Ticker: Simon Property Group (SPG) Section (A) Summary Recommendation Buy: Yes No Target Price:
CIF Stock Recommendation Report (Spring 2013)
") Date: 3/27/2013 Analyst Name: Braden Parsons CIF Stock Recommendation Report (Spring 2013) Section (A) Summary Company Name and Ticker: Xilinx (XLNX) Recommendation Buy: Yes No Target Price: $43.67 Sector:
Date: 3/27/2013 Analyst Name: Braden Parsons CIF Stock Recommendation Report (Spring 2013) Section (A) Summary Company Name and Ticker: Xilinx (XLNX) Recommendation Buy: Yes No Target Price: $43.67 Sector:
CIF Stock Recommendation Report (Spring 2014)
") Date: March 3, 2014 Analyst Name: Michael Sanders & Xiao Liu CIF Stock Recommendation Report (Spring 2014) Company Name and Ticker: Lockheed Martin Corp. (LMT) Section (A) Investment Summary Recommendation
Date: March 3, 2014 Analyst Name: Michael Sanders & Xiao Liu CIF Stock Recommendation Report (Spring 2014) Company Name and Ticker: Lockheed Martin Corp. (LMT) Section (A) Investment Summary Recommendation
CIF Stock Recommendation Report (Fall 2012)
") Date: October 9, 2012 Analyst Name: Alyssa Wood CIF Stock Recommendation Report (Fall 2012) Company Name and Ticker: Molson-Coors Brewing Company (TAP) Section (A) Summary Recommendation Buy: Hold Target
Date: October 9, 2012 Analyst Name: Alyssa Wood CIF Stock Recommendation Report (Fall 2012) Company Name and Ticker: Molson-Coors Brewing Company (TAP) Section (A) Summary Recommendation Buy: Hold Target
CIF Stock Recommendation Report (Spring 2013)
") Date: February 13, 2013 Analyst Name: Alyssa Wood CIF Stock Recommendation Report (Spring 2013) Company Name and Ticker: Urban Outfitters (URBN) Section (A) Summary Recommendation Buy: Yes Target Price:
Date: February 13, 2013 Analyst Name: Alyssa Wood CIF Stock Recommendation Report (Spring 2013) Company Name and Ticker: Urban Outfitters (URBN) Section (A) Summary Recommendation Buy: Yes Target Price:
CIF Stock Recommendation Report (Spring 2013)
") Date: March 4 th, 2013 Analyst Name: Tung Linh CIF Stock Recommendation Report (Spring 2013) Company Name and Ticker: Berkshire Hathaway Inc. (BRK.B) Section (A) Summary Recommendation Buy: Yes Target
Date: March 4 th, 2013 Analyst Name: Tung Linh CIF Stock Recommendation Report (Spring 2013) Company Name and Ticker: Berkshire Hathaway Inc. (BRK.B) Section (A) Summary Recommendation Buy: Yes Target
CIF Stock Recommendation Report (Fall 2012)
") Section (A) Summary Date:2/28/2013 Analyst Name: Kristen Hecht CIF Stock Recommendation Report (Fall 2012) Company Name and Ticker: Walt Disney Co (DIS) Recommendation Buy: Yes No Target Price: $62.00
Section (A) Summary Date:2/28/2013 Analyst Name: Kristen Hecht CIF Stock Recommendation Report (Fall 2012) Company Name and Ticker: Walt Disney Co (DIS) Recommendation Buy: Yes No Target Price: $62.00
CIF Sector Recommendation Report (Spring 2013)
") Date: 2/19/13 Analyst: Joseph Brendel CIF Sector Recommendation Report (Spring 2013) Sector: Health Care (XLV) Review Period: February 1- February 14 Section (A) Sector Performance Review Copy/paste Sector
Date: 2/19/13 Analyst: Joseph Brendel CIF Sector Recommendation Report (Spring 2013) Sector: Health Care (XLV) Review Period: February 1- February 14 Section (A) Sector Performance Review Copy/paste Sector
CIF Sector Recommendation Report (Fall 2012)
") CIF Sector Recommendation Report (Fall 2012) Date: 10/27/12 Analyst: Ryan Ellingsen Sector: Consumer Staples Review Period: October 11 th -October 24th Section (A) Sector Performance Review Consumer Staples
CIF Sector Recommendation Report (Fall 2012) Date: 10/27/12 Analyst: Ryan Ellingsen Sector: Consumer Staples Review Period: October 11 th -October 24th Section (A) Sector Performance Review Consumer Staples
CIF Stock Recommendation Report (Spring 2015)
") Date: 3/24/15 Analyst Names: _John Tupper & Michael Retallick_ CIF Stock Recommendation Report (Spring 2015) Company Name and Ticker:_The Home Depot Inc. (HD) Section (A) Investment Summary Recommendation
Date: 3/24/15 Analyst Names: _John Tupper & Michael Retallick_ CIF Stock Recommendation Report (Spring 2015) Company Name and Ticker:_The Home Depot Inc. (HD) Section (A) Investment Summary Recommendation
CIF Stock Recommendation Report (Spring 2015)
") Date:4/11/15 Analyst Name: Christine Nordlie and Connor Phelps CIF Stock Recommendation Report (Spring 2015) Section (A) Investment Summary Recommendation Buy: Yes No Limit Buy at $111 Sector: Health Care
Date:4/11/15 Analyst Name: Christine Nordlie and Connor Phelps CIF Stock Recommendation Report (Spring 2015) Section (A) Investment Summary Recommendation Buy: Yes No Limit Buy at $111 Sector: Health Care
CIF Sector Recommendation Report (Fall 2012)
") CIF Sector Recommendation Report (Fall 2012) Date: November 6, 2012 Analyst: Alyssa Wood Sector: Consumer Staples (XLP) Review Period: October 17-31, 2012 Section (A) Sector Performance Review Cougar Investment
CIF Sector Recommendation Report (Fall 2012) Date: November 6, 2012 Analyst: Alyssa Wood Sector: Consumer Staples (XLP) Review Period: October 17-31, 2012 Section (A) Sector Performance Review Cougar Investment
CIF Sector Recommendation Report (Fall 2012)
") Date: 11/27/2012 Analyst: Joseph Brendel CIF Sector Recommendation Report (Fall 2012) Sector: Finance Review Period: Monday, November 12 - Friday, November 23 Section (A) Sector Performance Review Copy/paste
Date: 11/27/2012 Analyst: Joseph Brendel CIF Sector Recommendation Report (Fall 2012) Sector: Finance Review Period: Monday, November 12 - Friday, November 23 Section (A) Sector Performance Review Copy/paste
CIF Stock Recommendation Report (Spring 2014)
") Date: 2/22/2014 Analyst Name: Battson & Gruber CIF Stock Recommendation Report (Spring 2014) Company Name and Ticker: Ameriprise Financial, Inc. (AMP) Section (A) Investment Summary Recommendation Buy:
Date: 2/22/2014 Analyst Name: Battson & Gruber CIF Stock Recommendation Report (Spring 2014) Company Name and Ticker: Ameriprise Financial, Inc. (AMP) Section (A) Investment Summary Recommendation Buy:
CIF Stock Recommendation Report (Spring 2013)
") Date:03.20.2013 Analyst Name: Justin L. Jaena CIF Stock Recommendation Report (Spring 2013) Company Name and Ticker: Cameron International Corp (CAM) Section (A) Summary Recommendation Buy: Yes No Target
Date:03.20.2013 Analyst Name: Justin L. Jaena CIF Stock Recommendation Report (Spring 2013) Company Name and Ticker: Cameron International Corp (CAM) Section (A) Summary Recommendation Buy: Yes No Target
CIF Sector Recommendation Report (Fall 2012)
") Date: 12/4/2012 Analyst: Frank McLaughlin CIF Sector Recommendation Report (Fall 2012) Sector: Industrials Review Period: 11/16/2012-11/30/2012 Section (A) Sector Performance Review Copy/paste Sector Review
Date: 12/4/2012 Analyst: Frank McLaughlin CIF Sector Recommendation Report (Fall 2012) Sector: Industrials Review Period: 11/16/2012-11/30/2012 Section (A) Sector Performance Review Copy/paste Sector Review
CIF Stock Recommendation Report (Spring 2014)
") Date: April 11, 2014 Analyst Name: Xiao Liu CIF Stock Recommendation Report (Spring 2014) Company Name and Ticker: Honeywell International Inc. (HON) Section (A) Investment Summary Recommendation Buy:
Date: April 11, 2014 Analyst Name: Xiao Liu CIF Stock Recommendation Report (Spring 2014) Company Name and Ticker: Honeywell International Inc. (HON) Section (A) Investment Summary Recommendation Buy:
CIF Stock Recommendation Report (Spring 2014)
") Date: 4/19/2014 Analyst Name: Connor McCulloh CIF Stock Recommendation Report (Spring 2014) Company Name and Ticker: Johnson & Johnson (JNJ) Section (A) Investment Summary Recommendation Buy: Yes No Target
Date: 4/19/2014 Analyst Name: Connor McCulloh CIF Stock Recommendation Report (Spring 2014) Company Name and Ticker: Johnson & Johnson (JNJ) Section (A) Investment Summary Recommendation Buy: Yes No Target
CIF Stock Recommendation Report (Spring 2014)
") Date: 4/14/2014 Analyst Name: Kevin Bertelsen CIF Stock Recommendation Report (Spring 2014) Company Name and Ticker: EOG Resources (EOG) Section (A) Investment Summary Recommendation Buy: Yes No Target
Date: 4/14/2014 Analyst Name: Kevin Bertelsen CIF Stock Recommendation Report (Spring 2014) Company Name and Ticker: EOG Resources (EOG) Section (A) Investment Summary Recommendation Buy: Yes No Target
CIF Sector Recommendation Report (Fall 2012)
") Date: 4/24/13 Analyst: Kyle Temple CIF Sector Recommendation Report (Fall 2012) Sector Technology Review Period 4/8-4/19 Section (A) Sector Performance Review Cougar Investment Fund Sector Review Spreadsheet
Date: 4/24/13 Analyst: Kyle Temple CIF Sector Recommendation Report (Fall 2012) Sector Technology Review Period 4/8-4/19 Section (A) Sector Performance Review Cougar Investment Fund Sector Review Spreadsheet
CIF Sector Recommendation Report (Fall 2012)
") CIF Sector Recommendation Report (Fall 2012) Date: 11/29/12 Analyst: Khalid Surur Sector Healthcare Review Period: November 12-November 23rd Section (A) Sector Performance Review Copy/paste Sector Review
CIF Sector Recommendation Report (Fall 2012) Date: 11/29/12 Analyst: Khalid Surur Sector Healthcare Review Period: November 12-November 23rd Section (A) Sector Performance Review Copy/paste Sector Review
CIF Sector Recommendation Report (Fall 2012)
") CIF Sector Recommendation Report (Fall 2012) Date:4/3/2013 Analyst: Trevor Boren Sector: Healthcare Review Period: 3/20/2013 4/02/2013 Section (A) Sector Performance Review Review sector performance relative
CIF Sector Recommendation Report (Fall 2012) Date:4/3/2013 Analyst: Trevor Boren Sector: Healthcare Review Period: 3/20/2013 4/02/2013 Section (A) Sector Performance Review Review sector performance relative
CIF Sector Recommendation Report (Spring 2013)
") Date: 4/10/13 Analyst: Corey Malone CIF Sector Recommendation Report (Spring 2013) Sector: XLF Review Period: 3/21/13-4/4/13 Section (A) Sector Performance Review Sector Review Spreadsheet One- Month Stock
Date: 4/10/13 Analyst: Corey Malone CIF Sector Recommendation Report (Spring 2013) Sector: XLF Review Period: 3/21/13-4/4/13 Section (A) Sector Performance Review Sector Review Spreadsheet One- Month Stock
CIF Sector Recommendation Report (Spring 2013)
") Date: 4/22/13 Analyst: Walter Nabarrete CIF Sector Recommendation Report (Spring 2013) Sector Materials Review Period 4/5 to 4/19 Section (A) Sector Performance Review MAT Ticker Current Beg. Stop-loss
Date: 4/22/13 Analyst: Walter Nabarrete CIF Sector Recommendation Report (Spring 2013) Sector Materials Review Period 4/5 to 4/19 Section (A) Sector Performance Review MAT Ticker Current Beg. Stop-loss
CIF Stock Recommendation Report (Spring 2014)
") Date: April 7 th, 2014 Analyst Name: Tanner Peterson CIF Stock Recommendation Report (Spring 2014) Company Name and Ticker: Facebook Inc (FB) Section (A) Investment Summary Recommendation Buy: Yes Sector:
Date: April 7 th, 2014 Analyst Name: Tanner Peterson CIF Stock Recommendation Report (Spring 2014) Company Name and Ticker: Facebook Inc (FB) Section (A) Investment Summary Recommendation Buy: Yes Sector:
TEC Sector Recommendation Report (Fall 2012)
") TEC Sector Recommendation Report (Fall 2012) Date: 10/30/2012 Analyst: Matt Leid Sector: TEC Review Period: 10/11/2012-10/24/2012 Section (A) Sector Performance Review Below we can see that, a few days
TEC Sector Recommendation Report (Fall 2012) Date: 10/30/2012 Analyst: Matt Leid Sector: TEC Review Period: 10/11/2012-10/24/2012 Section (A) Sector Performance Review Below we can see that, a few days
SECTOR PERFORMANCE REVIEW
 SECTOR PERFORMANCE REVIEW Healthcare MELISSA CAMERON & WADE ROERSON A. Sector Performance Review A-1 Sector HC Review Period Start Date 1/12/2015 End Date 4/13/2015 Ticker Recommend CIF Current Beg. Stop-loss
CIF Sector Recommendation Report (Spring 2013)
") Date: 4/1/2013 Analyst: Jacob Allen CIF Sector Recommendation Report (Spring 2013) Sector: Healthcare Review Period: 3/13/2013 3/26/2013 Section (A) Sector Performance Review Copy/paste Sector Review Spreadsheet
Date: 4/1/2013 Analyst: Jacob Allen CIF Sector Recommendation Report (Spring 2013) Sector: Healthcare Review Period: 3/13/2013 3/26/2013 Section (A) Sector Performance Review Copy/paste Sector Review Spreadsheet
Costco Wholesale Corporation
 Grade Earnings Last Earnings Release 10/06/2017 Last Qtr. Actual vs. Est. $2.08 / $2.02 Next Release 10/11/2017 $2.02 Year Ending 08/31/2017 $5.92 Quick Facts Dividend Yield 1.12% 52 Wk High $182.45 52
CIF Sector Update Report (Spring 2014)
") CIF Sector Update Report (Spring 2014) Sector Industrial Analyst: Xiao Liu Presentation Date: March 24, 2014 Review Period: Start Date: Feb 24, 2014 End Date: Mar 19, 2014 Section (A) Sector Performance
CIF Sector Update Report (Spring 2014) Sector Industrial Analyst: Xiao Liu Presentation Date: March 24, 2014 Review Period: Start Date: Feb 24, 2014 End Date: Mar 19, 2014 Section (A) Sector Performance
CIF Sector Recommendation Report (Fall 2012)
") CIF Sector Recommendation Report (Fall 2012) Date: March 20, 2013 Analyst: Lillian Mojica Sector: Financial Review Period: March 1 st - 15 th Section (A) Sector Performance Review FIN Ticker Current Beg.
CIF Sector Recommendation Report (Fall 2012) Date: March 20, 2013 Analyst: Lillian Mojica Sector: Financial Review Period: March 1 st - 15 th Section (A) Sector Performance Review FIN Ticker Current Beg.
CIF Sector Recommendation Report (Fall 2012)
") CIF Sector Recommendation Report (Fall 2012) Date: 04.22.2013 Analyst: Justin L. Jaena Sector: Energy (XLE) Review Period 04.12-04.23 Section (A) Sector Performance Review 1 Both the market and the sector
CIF Sector Recommendation Report (Fall 2012) Date: 04.22.2013 Analyst: Justin L. Jaena Sector: Energy (XLE) Review Period 04.12-04.23 Section (A) Sector Performance Review 1 Both the market and the sector
Detailed Stock Report
 Updated March 8, 2013 ROSS STORES INCORPORATED (-O) Retailers / Other Specialty Retailers / Apparel Retailers Description The Average Score combines the quantitative analysis of six widely-used investment
Stock Rover Profile Metrics
 Stock Rover Profile Metrics Average Volume (3m) The average number of shares traded per day over the past 3 months. Company Unit: Name The full name of the company. Employees The number of direct employees.
Trailing PE 5.3. Forward PE 7.0. Hold 6 Analysts. 1-Year Return: -52.1% 5-Year Return: -68.3%
 HIGH LINER FOODS INC (-T) Last Close 6.75 (CAD) Avg Daily Vol 83,237 52-Week High 15.67 Trailing PE 5.3 Annual Div 0.58 ROE 12.1% LTG Forecast -- 1-Mo 6.3% December 13 TORONTO Exchange Market Cap 228M
SUMMARY. Risk Level *
 February 26, 2015 The Home Depot, Inc. Current Recommendation Earnings Update: Home Depot Tops Q4 Earnings & Revenues, Guides FY15 SUMMARY DATA NEUTRAL Prior Recommendation Underperform Date of Last Change
52-Week High Trailing PE Week Low Forward PE Hold 14 Analysts. 1-Year Return: 27.3% 5-Year Return: 44.
 SUN LIFE FINANCIAL (-T) Last Close 37.86 (CAD) Avg Daily Vol 1.2M 52-Week High 40.15 Trailing PE 28.1 Annual Div 1.44 ROE 6.3% LTG Forecast 11.9% 1-Mo 4.9% May 13, 2014 TORONTO Exchange Market Cap (Consol)
52-Week High Trailing PE Week Low Forward PE Buy 15 Analysts. 1-Year Return: 26.7% 5-Year Return: -1.
 MANULIFE FINANCIAL (-T) Last Close 21.74 (CAD) Avg Daily Vol 3.8M 52-Week High 22.73 Trailing PE 10.2 Annual Div 0.62 ROE 16.3% LTG Forecast 11.1% 1-Mo -2.0% September 24, TORONTO Exchange Market Cap (Consol)
Trailing PE -- Forward PE -- Hold 13 Analysts. 1-Year Return: -7.6% 5-Year Return: -89.4%
 OBSIDIAN ENERGY (-T) Last Close 1.21 (CAD) Avg Daily Vol 202,689 52-Week High 1.85 Trailing PE -- Annual Div -- ROE -12.3% LTG Forecast -- 1-Mo -6.2% October 04 TORONTO Exchange Market Cap 614M 52-Week
CIF Sector Update Report (Spring 2014)
") CIF Sector Update Report (Spring 2014) Sector Consumer Staples (XLP) Analyst: Amy Christensen Presentation Date: 4/25/2014 Review Period: Start Date: 4/1/2014 End Date: 4/21/2014 Section (A) Sector Performance
CIF Sector Update Report (Spring 2014) Sector Consumer Staples (XLP) Analyst: Amy Christensen Presentation Date: 4/25/2014 Review Period: Start Date: 4/1/2014 End Date: 4/21/2014 Section (A) Sector Performance
Trailing PE Forward PE Buy 13 Analysts. 1-Year Return: -10.6% 5-Year Return: -9.1%
 INTER PIPELINE (-T) Last Close 22.95 (CAD) Avg Daily Vol 1.1M 52-Week High 27.91 Trailing PE 15.6 Annual Div 1.68 ROE 16.3% LTG Forecast 1.3% 1-Mo -4.3% October 02 TORONTO Exchange Market Cap 8.7B 52-Week
CIF Sector Recommendation Report (Spring 2013)
") Date: 3/6/13 Analyst: Taylor Woodruff CIF Sector Recommendation Report (Spring 2013) Sector: Technology Review Period: 2.15.13 3.1.13 Section (A) Sector Performance Review TEC Ticker Current Beg. Stop-loss
Date: 3/6/13 Analyst: Taylor Woodruff CIF Sector Recommendation Report (Spring 2013) Sector: Technology Review Period: 2.15.13 3.1.13 Section (A) Sector Performance Review TEC Ticker Current Beg. Stop-loss
Trailing PE 4.8. Forward PE 8.6. Buy 2 Analysts. 1-Year Return: -10.6% 5-Year Return: 61.4%
 MORGUARD CORP (-T) Last Close 167.20 (CAD) Avg Daily Vol 1,962 52-Week High 194.10 Trailing PE 4.8 Annual Div 0.60 ROE 13.6% LTG Forecast -- 1-Mo -1.4% 2018 June 15 TORONTO Exchange Market Cap 1.9B 52-Week
52-Week High Trailing PE Week Low Forward PE Hold 14 Analysts. 1-Year Return: 39.6% 5-Year Return: 34.
 SUN LIFE FINANCIAL (-T) Last Close 36.50 (CAD) Avg Daily Vol 1.0M 52-Week High 37.24 Trailing PE 28.6 Annual Div 1.44 ROE 13.3% LTG Forecast 9.0% 1-Mo 8.1% November 11, TORONTO Exchange Market Cap (Consol)
CIF Sector Update Report (Spring 2014)
") CIF Sector Update Report (Spring 2014) Sector: Financial Analyst: Harry Bowman Presentation Date: 4/9/2014 Review Period: Start Date: 3/20/2014 End Date: 4/3/2014 Section (A) Sector Performance Review
CIF Sector Update Report (Spring 2014) Sector: Financial Analyst: Harry Bowman Presentation Date: 4/9/2014 Review Period: Start Date: 3/20/2014 End Date: 4/3/2014 Section (A) Sector Performance Review
Trailing PE Forward PE Hold 6 Analysts. 1-Year Return: -20.6% 5-Year Return: -45.1%
 Last Close 8.75 (CAD) Avg Daily Vol 7,742 52-Week High 11.20 Trailing PE 11.8 Annual Div 0.72 ROE -0.2% LTG Forecast -- 1-Mo -1.7% 2019 April 16 TORONTO Exchange Market Cap 83M 52-Week Low 6.58 Forward
CIF Sector Update Report (Spring 2015)
") CIF Sector Update Report (Spring 2015) Sector: Technology Analysts: Jake Riddell and Bryan Mickelson Presentation Date: April 17, 2015 Review Period: Start: January 9, 2015 End: April 13, 2015 Section
CIF Sector Update Report (Spring 2015) Sector: Technology Analysts: Jake Riddell and Bryan Mickelson Presentation Date: April 17, 2015 Review Period: Start: January 9, 2015 End: April 13, 2015 Section
Trailing PE 8.9. Forward PE 8.0. Hold 7 Analysts. 1-Year Return: -17.0% 5-Year Return: -13.9%
 ER CORPORATION OF CANADA (-T) Last Close 27.12 (CAD) Avg Daily Vol 905,847 52-Week High 33.21 Trailing PE 8.9 Annual Div 1.53 ROE 9.9% LTG Forecast 6.3% 1-Mo 0.9% November 15 TORONTO Exchange Market Cap
CIF Sector Recommendation Report (Fall 2012)
") CIF Sector Recommendation Report (Fall 2012) Date: Nov 10 th 2012 Analyst: Tung Linh Sector: Industrial Review Period: Oct 25 th 2012 - Nov 7 th 2012 Section (A) Sector Performance Review IND Ticker Current
CIF Sector Recommendation Report (Fall 2012) Date: Nov 10 th 2012 Analyst: Tung Linh Sector: Industrial Review Period: Oct 25 th 2012 - Nov 7 th 2012 Section (A) Sector Performance Review IND Ticker Current
CIF Stock Recommendation Report (Spring 2014)
") Date: 2/23/2014 Analyst Name: Bertelsen and Sedlacek CIF Stock Recommendation Report (Spring 2014) Company Name and Ticker: Chevron Corp. (CVX.N) Section (A) Investment Summary Recommendation Buy: Yes
Date: 2/23/2014 Analyst Name: Bertelsen and Sedlacek CIF Stock Recommendation Report (Spring 2014) Company Name and Ticker: Chevron Corp. (CVX.N) Section (A) Investment Summary Recommendation Buy: Yes
Revenue (TTM) 79.74M Revenue (Qtrly YoY Growth) EPS Diluted (Quarterly) EPS Diluted (Qtrly YoY Growth) N/A. Profitability. Revenue (Quarterly)
 79.74M Revenue (Qtrly YoY Growth) EPS Diluted (Quarterly) EPS Diluted (Qtrly YoY Growth) N/A. Profitability. Revenue (Quarterly)") Attractive VNR.TO is probably worth a deeper look. Price is low compared to sales, earnings or assets, and historical fundamentals look strong. Value Score Good (9/10) Fundamental Score Strong (8/10) Valuation
Attractive VNR.TO is probably worth a deeper look. Price is low compared to sales, earnings or assets, and historical fundamentals look strong. Value Score Good (9/10) Fundamental Score Strong (8/10) Valuation
Trailing PE Forward PE Buy 1 Analyst. 1-Year Return: -26.2% 5-Year Return: 71.3%
 RICHELIEU HARDWARE (-T) Last Close 24.56 (CAD) Avg Daily Vol 124,594 52-Week High 33.69 Trailing PE 20.6 Annual Div 0.24 ROE 15.6% LTG Forecast -- 1-Mo 13.0% 2019 January 10 TORONTO Exchange Market Cap
Trailing PE 9.2. Forward PE 8.5. Hold 15 Analysts. 1-Year Return: -10.8% 5-Year Return: 20.4%
 CADIAN IMPERIAL BANK (-T) Last Close 107.09 (CAD) Avg Daily Vol 1.9M 52-Week High 125.21 Trailing PE 9.2 Annual Div 5.44 ROE 17.0% LTG Forecast 4.8% 1-Mo -6.5% December 13 TORONTO Exchange Market Cap 47.6B
Trailing PE Forward PE 8.8. Buy 7 Analysts. 1-Year Return: -1.3% 5-Year Return: -66.0%
 GONAUT GOLD INC (-T) Last Close 2.29 (CAD) Avg Daily Vol 338,372 52-Week High 2.92 Trailing PE 14.5 Annual Div -- ROE 3.7% LTG Forecast -- 1-Mo 3.6% July 19 TORONTO Exchange Market Cap 389M 52-Week Low
Trailing PE Forward PE Hold 6 Analysts. 1-Year Return: 3.5% 5-Year Return: 21.4%
 Last Close 11.73 (CAD) Avg Daily Vol 961,084 52-Week High 11.84 Trailing PE 25.3 Annual Div 0.80 ROE 6.9% LTG Forecast -- 1-Mo 8.4% 2019 March 26 TORONTO Exchange Market Cap 1.4B 52-Week Low 9.27 Forward
User Guide for Schwab Equity Ratings Report
 User Guide for Schwab Equity Ratings Report The Schwab Equity Ratings Report will help you make informed decisions on equities by providing you with important additional information and analysis. Each
Trailing PE -- Forward PE -- NA 0 Analysts. 1-Year Return: 424.7% 5-Year Return: 415.2%
 DIVIDEND 15 SPLIT CORP (-T) Last Close 10.23 (CAD) Avg Daily Vol 41,738 52-Week High 10.32 Trailing PE Annual Div 1.20 ROE LTG Forecast 1-Mo 0.1% 2018 August 17 TORONTO Exchange Market Cap 460M 52-Week
Bed Bath & Beyond Inc.
 January 21, 2015 Bed Bath & Beyond Inc. Current Recommendation SUMMARY DATA NEUTRAL Prior Recommendation Outperform Date of Last Change 11/23/2009 Current Price (01/20/15) $73.31 Target Price $77.00 52-Week
CIF Sector Recommendation Report (Fall 2012)
") Date: 4/22/13 Analyst: Matthew Landen CIF Sector Recommendation Report (Fall 2012) Sector: Financials Review Period: 4/4/13 4/17/13 Section (A) Sector Performance Review The financial sector has outperformed
Date: 4/22/13 Analyst: Matthew Landen CIF Sector Recommendation Report (Fall 2012) Sector: Financials Review Period: 4/4/13 4/17/13 Section (A) Sector Performance Review The financial sector has outperformed
Trailing PE Forward PE Buy 17 Analysts. 1-Year Return: -13.1% 5-Year Return: -41.4%
 DETOUR GOLD CORP (-T) Last Close 13.76 (CAD) Avg Daily Vol 819,168 52-Week High 21.48 Trailing PE 33.8 Annual Div -- ROE 3.1% LTG Forecast 26.1% 1-Mo 3.9% December 21 TORONTO Exchange Market Cap 2.3B 52-Week
Trailing PE Forward PE -- Hold 1 Analyst. 1-Year Return: 8.6% 5-Year Return: 66.9%
 A AND W REVENUE ROYALTIES (-T) Last Close 36.02 (CAD) Avg Daily Vol 19,429 52-Week High 36.83 Trailing PE 19.9 Annual Div 1.69 ROE 21.2% LTG Forecast 1-Mo 15.1% 2018 August 17 TORONTO Exchange Market Cap
Trailing PE Forward PE Buy 2 Analysts. 1-Year Return: -39.7% 5-Year Return: --
 GRANDE WEST TRANSPORTATION (-V) Last Close 1.49 (CAD) Avg Daily Vol 183,341 52-Week High 3.7 Trailing PE 74.5 Annual Div -- ROE 6.8% LTG Forecast -- 1-Mo -9.7% 218 June 15 TSX VENTURE Exchange Market Cap
Trailing PE Forward PE Buy 11 Analysts. 1-Year Return: 3.0% 5-Year Return: -19.7%
 ENCANA CORP (-T) Last Close 14.70 (CAD) Avg Daily Vol 3.3M 52-Week High 18.54 Trailing PE 188.1 Annual Div 0.08 ROE 0.7% LTG Forecast 36.4% 1-Mo -7.8% October 12 TORONTO Exchange Market Cap 14.0B 52-Week