CIF Stock Recommendation Report (Fall 2012)
|
|
|
- Angela Dickerson
- 5 years ago
- Views:
Transcription
1 Date: 10/11/12 Analyst Name: Joseph Brendel CIF Stock Recommendation Report (Fall 2012) Section (A) Summary Company Name and Ticker: Prudential (PRU) Recommendation Buy: No Target Price: 35 Sector: Financials Industry: Insurance Market Cap (in Billions): Current Price: Morningstar (MS) Fair Value Est.: $66.00 EPS (TTM): 7.03 Next Fiscal Yr. End Year : 2012 Month : Dec. Forward P/E: 7.10 % Inst. Ownership: 63.45% 52 WK Hi: MS FV Uncertainty: Not Listed EPS (FY1): 6.30 Last Fiscal Qtr. End: Less Than 8 WK: Yes Mean LT Growth: 12.29% Inst. Ownership- Net Buy: Y N 52 WK Low: MS Consider Buying: $33.00 EPS (FY2): 7.84 If Less Than 8 WK, next Earnings Ann. Date: December 31, 2012 PEG: 0.80 Short Interest Ratio: 1.50 Stop-Loss Price: N/A # of Shrs. O/S (in Millions): EBO Valuation: MS Consider Selling: $ MS Star Rating: Three stars Analyst Consensus Recommendation: Outperform Beta: 2.36 Ratio Analysis Company Industry Sector P/E (TTM) P/S (TTM) P/B (MRQ) P/CF (TTM) Dividend Yield Total Debt/Equity (MRQ) Net Profit Margin (TTM) ROA (TTM) ROE (TTM) Short as % of Float: 0.90% 1
2 Investment Thesis Based off of the research that I have conducted, I would recommend not to buy stock in Prudential (PRU). The company s current price is very much in line with its fair value and it does not have as high of a mean LT growth rate as several of its competitors. Additionally, due to it s high beta and being in an industry that does not typically generate sustained excess growth, it would not be advisable to invest money in Prudential. If the stock were to drop in price to below $35, and all of Prudential s metrics remained the same, I would at that point recommend buying the stock. At $35 the stock would be undervalued based off of its current multiples, so there would be legitimate value to be found by investing at that price. Summary Provide brief summary of your analysis in each section that follows Company Profile: Prudential is in the highly competitive Insurance industry and implement a risk mitigating strategy to prevent significant losses. Fundamental Valuation: Due to its high beta, I used a two year growth projection and came up with an implied price of for Prudential. This is right around its 52- week low. Relative Valuation: The relative valuation spreadsheet showed that PRU seems to be fairly priced based off of the multiples of their competitors. Revenue and Earnings Estimates: Prudential s revenue and earnings have been increasing each of the last two years and look to be continuing to do so in the future. Analyst Recommendations: Reuter s analysts come to the consensus of 2 out of 5, predicting that the stock will outperform. Morningstar is less bullish and give Prudential a three star rating and recommends buying it if it drops to 33. Institutional Ownership: There was a net growth in the amount of institutional owners, however no institution owns over 5% of the shares. Short Interest: The amount of shares short has been decreasing over the last year, signifying a bullish outlook on the stock. Stock Price Chart: PRU has performed well against the sector and its competitors over the last couple of months. However, the results are not as good using a 5- year chart. 2
3 3
4 Section (B) Company Profile (two pages maximum) Company Summary -Prudential is a financial company that specializes in life insurance. In terms of the industry, Prudential is the second largest life insurance company in terms of both market capitalization and total assets. In addition to life insurance, Prudential also is involved in annuities, retirement-related services, mutual funds and investment management. Prudential is a very large company overall as it has a total market cap of $ billion. -Prudential recently purchased Hartford Financial Services Group s life-insurance business on September 27 th for $615 million, and will be fully incorporate it into their business in the next couple of months. The day after the purchase, Prudential s stock did not really change in value much at all. From this it can be inferred that investors believe that the new acquisition will neither significantly harm nor help Prudential s longterm growth projections. Business Model, Competition, Environment and Strategy -Prudential is in a very competitive industry, where new innovations are quickly replicated by all competitors in the industry. Additionally, the life insurance industry is structured in a way that companies are forced to reduce their returns in order to offer competitive prices that can compete with the competitors in their industry. In order to compete in this environment, Prudential s strategy is to attempt to reduce as much risk to their earnings as possible while still maintaining high returns. As a result, Prudential s balance sheet has a lower risk exposure than many of their competitors. Revenue and Earnings History 4
5 This information is available in Reuters.com, Financials tab. Copy/paste the quarterly revenue and earnings per share numbers for the most recent three years. Add the numbers over four fiscal quarters to get annual revenue and earnings. For the current fiscal year, go ahead add up as many quarters as are available. NOTE: revenue numbers are in millions. Discuss any pattern in revenue and earnings (e.g., increasing year over year; seasonal; etc.) REVENUE Periods March June September December Totals: 2010: 36141, 2011: : Note: Units in Millions of U.S. Dollars EARNINGS PER SHARE Periods March June September December Totals: 2010: , 2011: , 2012: Note: Units in U.S. Dollars 5
6 - Prudential s revenue saw continued growth from 2010 to 2011 and based off of half of the quarters so far in 2012, seem to be headed towards another year of increased revenue (This is if you double the revenue made so far in 2012). The earnings per share increased from 2010 to 2011, but saw a negative output for the first quarter of The second quarter however saw the strongest number in this table, getting earnings per share of in the second quarter. If Prudential continues off of the success of quarter 2, then they will most likely be able to post an increase in earnings per share again in 2012, when compared to
7 Section (C) Fundamental Valuation (EBO) Include the following here: Copy/paste completed Fundamental Valuation (EBO) Spreadsheet Inputs (provide below input values used in your analysis) EPS forecasts (FY1 & FY2): FY1: 6.3 FY2: 7.84 Long-term growth rate: 12.29% Book value /share (along with book value and number of shares outstanding): Book value: $ 37,223,000,000 # of shares outstanding: 466 M Book value / share: Dividend payout ratio: 21% Next fiscal year end: 2012 (Dec) Current fiscal month: 10 7
8 Target ROE: 4.64% Output Above normal growth period chosen: 2014 (With such a high beta (2.36), I would not be comfortable using any longer than a two-year growth period, because the economy is still not very strong and the stock price could drastically drop if the economic recovery takes a turn for the worse). EBO valuation (Implied price from the spreadsheet): Sensitivity Analysis EBO valuation would be (you can include more than one scenario in each of the following): if changing above normal growth period to if changing growth rate from mean (consensus) to the highest estimate 15.50% if changing growth rate from mean (consensus) to the lowest estimate 10.00% if changing discount rate to 20% if changing discount rate to 15% if changing target ROE to 6% 8
9 Section (D) Relative Valuation Copy/paste your completed relative valuation spreadsheet here From the top panel Discuss whether your stock and its competitors have very different multiples. Point out if any of the five stocks have multiple that is far off from the others. Make an attempt to explain why (you would want to read analyst research report in Morningstar Direct; you should also look for comments from other financial sites). The discussions should address all of the following valuation metrics: forward P/E, PEG, P/B (MRQ), P/S (TTM), and P/CF (TTM). Compare the implied prices derived from various valuation metrics. Also compare those implied price to the stock s current price, and 52-week high and low. -Most of Prudential s multiples are similar to their competitors. The only significant difference between the companies comes from ROE. AIG s ROE is heavily in the negative, while Aflac Inc s is over twice the amount of Prudential who is the second highest. The only reason I can think of to explain AIG s negative ROE is the fact that 9
10 they are still struggling to recover after the recession nearly caused them to go bankrupt, needing a government bailout to avoid bankruptcy. Many of the companies P/E multiple would give PRU an implied value very similar to what it is currently at. The same is true when looking at PEG, except ING s PEG would give PRU an implied price that is about half of the value of PRU s 52 week low. Using P/B, three of the companies give an implied price that is fairly similar to the lower end of PRU s 52 week value range. However, due to a high P/B, Aflac Inc gives an implied price double of PRU s 52- week high. The value ratio and P/S give implied value medians slightly higher than the 52-week high for the stock. P/CF gives three values that are much lower than PRU s low and it gives one that is significantly higher than PRU s high, making the high very far away from the median. From the bottom panel Discuss the various implied prices of your stock derived from competitors ( comparables ) multiples. How different are the prices derived from the various valuation metrics? Note any valuation metrics that seem to yield outlier prices and explain why (HINT: is that because that particular valuation metrics is not very relevant for the industry? Do you best to provide convincing arguments). For each valuation metrics, Compare the current price and 52-week high /low of your stock to the High-low range derived from multiples of its competitors. Among the valuation metrics analyzed, which ones do you think are most relevant as a valuation tool for your stock? -I think that Price/Book value is one of the better metrics to use to determine the valuation of the stock. Usually this is one of the best multiples to use when valuing a company in the financial sector. Using the median implied value given by competitors P/B multiples, the value falls right in line with the fundamental valuation that I calculated earlier, in addition to being right in the middle of PRU s 52-week range. One of the least relevant appears to be the P/CF, because the company that gives the highest implied price from P/CF has the lowest value for its share price. 10
11 Section (E) Revenue and Earnings Estimates Copy/Paste the Historical Surprises Table from Reuters.com, Analysts tab (include both revenue and earnings; make note that revenues might be in millions ) HISTORICAL SURPRISES Sales and Profit Figures in US Dollar (USD) Earnings and Dividend Figures in US Dollar (USD) Estimates vs Actual Estimate Actual Difference Surprise % SALES (in millions) Quarter Ending Jun-12 10, , Quarter Ending Mar-12 10, , Quarter Ending Dec-11 10, , Quarter Ending Sep-11 10, , Quarter Ending Jun-11 9, , Earnings (per share) Quarter Ending Jun Quarter Ending Mar Quarter Ending Dec Quarter Ending Sep Quarter Ending Jun
12 Review recent trends in company s reported revenue and earnings, and discuss whether (1) the company has a pattern of surprising the market with numbers different from analysts estimates; (2) Were they positive(actual greater than estimate) or negative (actual less than estimate) surprises? (3) Were surprises more notable for revenue or earnings? (4) Look up the stock chart to see how the stock price reacted to the surprises. NOTE: Reuters does not put the sign on the surprise. You need to put a negative sign when it is a negative surprise. (1) Prudential seems to continuously surprise the market when it comes to earnings, as it has a surprise percentage of more than plus or minus 10% four out of the last five quarters. It seems to be less surprising when it comes to revenues as none of the quarters had a surprise percentage over 7.30%. (2) The surprises tended to be both negative and positive at about the same frequency. However, the negative surprises had the largest percentages out of any of them. (3) The surprises were much more notable for earnings as I mentioned previously. (4) The negative surprises for earnings typically caused the stock to lose value, but not by a significant margin, while the other surprises did not seem to have as much of an effect. Copy/paste the Consensus Estimates Analysis Table from Reuters.com, Analysts tab (include both revenue and earnings) CONSENSUS ESTIMATES ANALYSIS Sales and Profit Figures in US Dollar (USD) Earnings and Dividend Figures in US Dollar (USD) # of Estimates Mean High Low 1 Year Ago SALES (in millions) Quarter Ending Dec , , , ,
13 Quarter Ending Mar , , , , Year Ending Dec , , , , Year Ending Dec , , , , Earnings (per share) Quarter Ending Dec Quarter Ending Mar Year Ending Dec Year Ending Dec
14 LT Growth Rate (%) Review the range and the consensus of analysts estimates. (1) Calculate the % difference of the high estimate from the consensus (mean); (2) Calculate the % (negative) difference of the low estimate from the consensus; (3) Are the divergent more notable for the current or out- quarter, FY1 or FY2, revenue or earnings? (4) Note the number of analysts providing LT growth rate estimate. It that roughly the same as the number of analysts providing revenue and earnings estimates? (1) Sales: Quarter Dec 12: 17.97% Quarter Mar 13: 4.7% Year Dec 12: 4.93% Year Dec 13: 7.18% Earnings Quarter Dec 12: 8.05% Quarter Mar 13: 3.8% Year Dec 12: 3.97% Year Dec 13: 5.1% LT growth: 26.11% (2) Sales: Quarter Dec 12: -8.4% Quarter Mar 13: -2.4% Year Dec 12: -4.31% Year Dec 13: -9.76% Earnings Quarter Dec 12: -6.9% Quarter Mar 13: -5.98% Year Dec 12: -3.17% Year Dec 13: -3.06% LT growth: -18.6% (3) The more divergent numbers are from the current quarter and for FY2. This is consistent for both revenues and earnings, but is more pronounced in for revenues. (4) There are far fewer analysts providing LT growth rate, 4, when compared to both revenues and earnings. There are more analysts provide earnings estimates than do revenue estimates. 14
15 Copy/paste the Consensus Estimates Trend Table from Reuters.com, Analysts tab (include both revenue and earnings) CONSENSUS ESTIMATES TREND Sales and Profit Figures in US Dollar (USD) Earnings and Dividend Figures in US Dollar (USD) Current 1 Week Ago 1 Month Ago 2 Month Ago 1 Year Ago SALES (in millions) Quarter Ending Dec , , , , , Quarter Ending Mar , , , , , Year Ending Dec , , , , , Year Ending Dec , , , , ,
16 Earnings (per share) Quarter Ending Dec Quarter Ending Mar Year Ending Dec Year Ending Dec Review recent trend of analysts consensus (mean) estimates on revenue and earnings. (1) Are the consensus estimates trending up, down, or stay the same? (2) Is the trend more notable for the near- or out- quarter, FY1 or FY2, revenue or earnings? (1) The revenue totals are slowly trending upwards from a year ago to today, but there does not seem to be much change since the two-months ago mark. Earnings per share are going through a similar trend, but in the opposite direction as the projections have been decreasing from a year ago, with not much changing from two months ago. (2) The trend seems to be more notable for the quarter ending in Dec.-13 and seems to be more significant in FY2 and earnings. 16
17 Copy/paste the Estimates Revisions Summary Table from Reuters.com, Analysts tab (include both revenue and earnings) ESTIMATES REVISIONS SUMMARY Last Week Last 4 Weeks Number Of Revisions: Up Down Up Down Revenue Quarter Ending Dec Quarter Ending Mar Year Ending Dec Year Ending Dec Earnings Quarter Ending Dec Quarter Ending Mar Year Ending Dec Year Ending Dec
18 Review the number of analysts revising up or down their estimates (both revenue and earnings) in the last and last four weeks. (1) Note whether there are more up or down revisions; (2) are the revisions predominantly one directional? (3) Any notable difference last week versus last four weeks, revenue versus earnings? (1) There seem to be more upwards revisions for revenue, while earnings tend to have more downwards corrections. (2) Overall, the corrections upwards and downwards seem to be relatively balanced against one another. (3) With revenue, the corrections have basically stayed the same from four weeks ago versus two weeks ago. However, earnings saw more changes four weeks ago than two weeks ago. You will need to incorporate what you see here with Morningstar s analyst research report (you can access Morningstar Direct at the Financial Markets Lab.) and other readings/analysis you found from various on-line financial sites. Discuss whether you think the company has a good chance of making or beating analyst consensus estimate, and why. Based on how the stock has been trading lately, do you think market has already anticipated strong or lackluster financial outlook from the company? -I do not think that Prudential has a very good chance of outperforming the analysts estimates. The reason for this is that Prudential seems to be fairly priced when compared to its competitors and with its multiples. Also, Prudential is in an industry where sustained long-term growth is almost non-existent because competitors can easily copy and imitate one another. Additionally, PRU does not have the multiples that would suggest that they are undervalued, so being fairly valued with a limited LT growth, PRU is not in the situation to be outperforming the analyst estimates. 18
19 Section (F) Analysts Recommendations Copy/paste the Analyst Recommendations and Revisions Table from Reuters.com, Analysts tab. NOTE: Make sure you copy the entire table including the Mean Rating at the bottom of the table. ANALYST RECOMMENDATIONS AND REVISIONS 1-5 Linear Scale Current 1 Month Ago 2 Month Ago 3 Month Ago (1) BUY (2) OUTPERFORM (3) HOLD (4) UNDERPERFORM (5) SELL No Opinion Mean Rating
20 Review the trend of analyst recommendations over the last three months. Is there a notable change of analyst opinions, turning more bullish or bearish? How many different ratings out of the five possible ones did the company receive currently, one, two, and three months ago? Is there a notable trend of opinion convergence or divergence? Is what you see here consistent to comments in Morningstar analyst s research report as well as various online financial sites you had researched on? NOTE: On a Five-point scale, Reuters assigns 1 to Buy, the most bullish recommendation, and 5 to Sell, the most bearish recommendation. Some other online sites have opposite scale, with their 1 being the most bearish and 5 being the most bullish recommendations. -The trend of analyst recommendations is that they have remained very stable for the last three months, with not many analysts changing their recommendations. The analyst have remained slightly bullish on the stock, with the current mean rating being exactly What I see here is fairly consistent with Morningstar s analyst s report, however Morningstar seemed to be less bullish about this stock and gave it a three star rating. None of the analyst reports that I looked at gave Prudential a consensus buy recommendation. 20
21 Section (G) Institutional Ownership Copy/paste the completed CIF Institutional Ownership spreadsheet here. 21
22 Combine information provided in all three sections to discuss whether (1) institutions, on net basis, have been increasing or decreasing ownership and how significant, (2) the stock has sizable institution interests and support, (3) the extent of the (> 5%) owners, and (4) this could be a bullish or bearish indication of future stock price movement. (1) On a net basis, institutions have been increasing their ownership, but it is not a very significant increase. (2) The stock seems to have good support from institutions, as 22
23 institutions own almost two-thirds of the outstanding shares. (3) There are no institutions that are (>5%) owners. (4) Since no institution has over 5% of the shares, I view this as a bearish indication of the future stock price movement, because no institution wants to get too heavily invested into the stock. 23
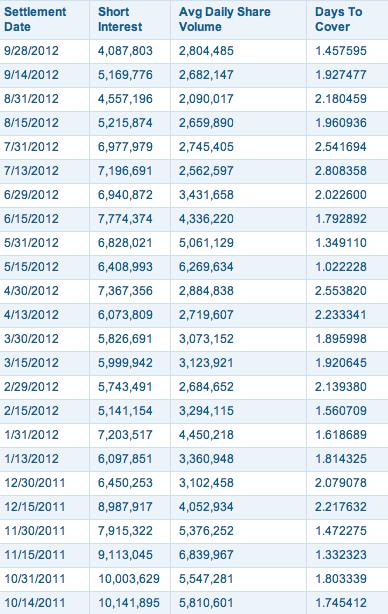
24 Section (H) Short Interest (two pages) From (NASDAQ s website) Copy/paste or enter the data in the following table. You also need to copy/paste the chart to the right. Copy/paste or type the information from short interest table. You will start from the most recent release date, and go back for a year (some stocks may not have data go back for a year) 24
25 25

26 Copy/paste the chart to the right of the short interest table, immediately follow the table below NOTE: You are encouraged to look at the short interest information for two of the companies closest competitors. This will help gauge whether the sentiment indicated in the short interest statistics is company specific or industry-wide. Settlement Date Short Interest Average Daily Shares Volume # of Days to cover 26
27 27
28 From Complete the following table with information from the share statistics table. Avg Vol Avg Vol Shares (3 month) (10 day) Outstanding Float 2,702,190 3,672, M M Shares Short Short Ratio Short % of Float Shares Short (Most recent date) (Most recent date) (Most recent date) (2 weeks prior) 4.09M (Sept. 28 th, 2012) % 5.17M Based on the short interest statistics and its recent trend, how is the market sentiment on the stock? Has the sentiment turned more bullish or bearish over the last year? How about in more recent month and why? -The number of shares short has decreased from 5.17M two weeks prior to 4.09M on September 28 th. This demonstrates that more investors believe that the stock will not drop in value over the next coming months. Over the last year, the days to cover number for Prudential has fluctuated back and forth. In addition, the number of shares short has slowly decreased signifying that investors are becoming more confident that the price of PRU will not be dropping very much. This signifies a bullish sentiment for the stock. 28

29 Section (I) Stock Charts A three months price chart Copy/paste the 3 Mos. stock chart here 29


30 A one year price chart Copy/paste the 1 Yr stock chart here A five year price chart Copy/paste the 5 Yrs. stock chart here 30

31 Additional price chart If you have other stock charts, feel free to copy/paste here Discuss what you observe from the stock charts. This should include comparing your stock to competitors, sector, and SP500 over the three different time horizons. -The stock price has remained relatively stable over the last couple of years, just fluctuating up and down slightly over time. For the 3-month chart, Prudential has seen significant, continuous growth, starting below 50 and finishing at its current price of Over this time, Prudential has outperformed both the financial sector and the S&P 500 by over 5%. It has also outperformed all of its top four competitors, as listed in the relative valuation table, except for Ing GroepNV over this time period so it has fair pretty well recently. -Going a full year, Prudential has not done nearly as well as it has recently. For the 1- year chart, Prudential has only outperformed two of it s competitors, Metlife Inc. and Ing Groep NV, by a very small margin. When compared to the sector, Prudential has done significantly worse, seeing around 20% less growth than the rest of its sector. Prudential has also underperformed the S&P 500, seeing about 10% less growth than the S&P
32 -On the 5-year chart, Prudential saw a significant loss, losing 40% of its value. However, it managed to outperform both its sector and 3 out of 4 of its top competitors over this time period, Alfac Inc being the only one to do better. Compared to the S&P 500, PRU did not do well at all during this period, seeing losses over 35% more than the S&P The final chart that I included compares the percentage increase of PRU vs. the financial sector over the last year. This chart shows that Prudential is even more volatile in its prices than the financial sector as a whole has been for the last year.. It also has underperformed the financial sector significantly over this time period. 32
CIF Stock Recommendation Report (Spring 2013)
") Date: 2/26/13 Analyst Name: Frank McLaughlin CIF Stock Recommendation Report (Spring 2013) Company Name and Ticker: PPG Industries Inc. (PPG) Section (A) Summary Recommendation Buy: Yes No Target Price:
Date: 2/26/13 Analyst Name: Frank McLaughlin CIF Stock Recommendation Report (Spring 2013) Company Name and Ticker: PPG Industries Inc. (PPG) Section (A) Summary Recommendation Buy: Yes No Target Price:
CIF Stock Recommendation Report (Spring 2013)
") Date: 4/08/2013 Analyst Name: Frank McLaughlin CIF Stock Recommendation Report (Spring 2013) Section (A) Summary Company Name and Ticker: Monsanto Co. (MON) Recommendation Buy: Yes Target Price: $115 Sector:
Date: 4/08/2013 Analyst Name: Frank McLaughlin CIF Stock Recommendation Report (Spring 2013) Section (A) Summary Company Name and Ticker: Monsanto Co. (MON) Recommendation Buy: Yes Target Price: $115 Sector:
CIF Stock Recommendation Report (Fall 2012)
") Date: December 3, 2012 Analyst Name: Chris Letcher CIF Stock Recommendation Report (Fall 2012) Company Name and Ticker: Northern Trust Corporation (NTRS) Section (A) Summary Recommendation Buy: No Target
Date: December 3, 2012 Analyst Name: Chris Letcher CIF Stock Recommendation Report (Fall 2012) Company Name and Ticker: Northern Trust Corporation (NTRS) Section (A) Summary Recommendation Buy: No Target
CIF Stock Recommendation Report (Fall 2012)
") Date: 11/4/12 Analyst Name: Trevor Boren CIF Stock Recommendation Report (Fall 2012) Company Name: CVS Caremark Corp. Ticker: CVS Section (A) Summary Recommendation Buy: Yes No Target Price: N/A Stop-Loss
Date: 11/4/12 Analyst Name: Trevor Boren CIF Stock Recommendation Report (Fall 2012) Company Name: CVS Caremark Corp. Ticker: CVS Section (A) Summary Recommendation Buy: Yes No Target Price: N/A Stop-Loss
CIF Stock Recommendation Report (Fall 2012)
") Section (A) Summary Date: 11/29/12 Analyst Name: Eric Russell CIF Stock Recommendation Report (Fall 2012) Company Name and Ticker:_Tiffany & Co (TIF) Recommendation Buy: Yes No Target Price: $71.00 Stop-Loss
Section (A) Summary Date: 11/29/12 Analyst Name: Eric Russell CIF Stock Recommendation Report (Fall 2012) Company Name and Ticker:_Tiffany & Co (TIF) Recommendation Buy: Yes No Target Price: $71.00 Stop-Loss
CIF Stock Recommendation Report (Fall 2012)
") Date: 10/11/12 Analyst Name: Matthew Landen CIF Stock Recommendation Report (Fall 2012) Company Name and Ticker: UnitedHealth Group Inc (UNH) Section (A) Summary Recommendation Buy: No Target Price: Stop-
Date: 10/11/12 Analyst Name: Matthew Landen CIF Stock Recommendation Report (Fall 2012) Company Name and Ticker: UnitedHealth Group Inc (UNH) Section (A) Summary Recommendation Buy: No Target Price: Stop-
CIF Stock Recommendation Report (Fall 2012)
") Date:_10/9/2012 Analyst Name: Scott R. Mertens CIF Stock Recommendation Report (Fall 2012) Company Name and Ticker:_JPMorgan Chase_(JPM) Section (A) Summary Recommendation Buy: Yes Target Price: $49.24
Date:_10/9/2012 Analyst Name: Scott R. Mertens CIF Stock Recommendation Report (Fall 2012) Company Name and Ticker:_JPMorgan Chase_(JPM) Section (A) Summary Recommendation Buy: Yes Target Price: $49.24
CIF Stock Recommendation Report (Fall 2012)
") Date: 2/27/13 Analyst Name: Eric Klaasen CIF Stock Recommendation Report (Fall 2012) Company Name and Ticker: Costco Wholesale Corporation (COST) Section (A) Summary Recommendation Buy: No Target Price:
Date: 2/27/13 Analyst Name: Eric Klaasen CIF Stock Recommendation Report (Fall 2012) Company Name and Ticker: Costco Wholesale Corporation (COST) Section (A) Summary Recommendation Buy: No Target Price:
CIF Stock Recommendation Report (Fall 2012)
") CIF Stock Recommendation Report (Fall 2012) Date: 10/16/2012 Analyst Name: Matt Leid Company Name and Ticker: Salesforce.com (CRM) Section (A) Summary Recommendation Buy: Yes No Target Price: NA Stop-Loss
CIF Stock Recommendation Report (Fall 2012) Date: 10/16/2012 Analyst Name: Matt Leid Company Name and Ticker: Salesforce.com (CRM) Section (A) Summary Recommendation Buy: Yes No Target Price: NA Stop-Loss
CIF Stock Recommendation Report (Fall 2012)
") Date: Saturday, November 10, 2012 Analyst Name: Fausto Guillén Aguilar Jr. CIF Stock Recommendation Report (Fall 2012) Company Name and Ticker: International Business Machines Corp IBM Section (A) Summary
Date: Saturday, November 10, 2012 Analyst Name: Fausto Guillén Aguilar Jr. CIF Stock Recommendation Report (Fall 2012) Company Name and Ticker: International Business Machines Corp IBM Section (A) Summary
CIF Stock Recommendation Report (spring 2013)
") Date: 4/3/2013 Analyst Name: Matt Vague CIF Stock Recommendation Report (spring 2013) Section (A) Summary Company Name and Ticker: O Reilly Automotive Inc (ORLY) Recommendation Buy: Yes No Target Price:
Date: 4/3/2013 Analyst Name: Matt Vague CIF Stock Recommendation Report (spring 2013) Section (A) Summary Company Name and Ticker: O Reilly Automotive Inc (ORLY) Recommendation Buy: Yes No Target Price:
CIF Stock Recommendation Report (Fall 2012)
") CIF Stock Recommendation Report (Fall 2012) Date: Nov 27 th 2012 Analyst Name: Tung Linh Company Name and Ticker: W.W. Grainger, Inc. (GWW) Section (A) Summary Recommendation Buy: No Target Price: Stop-Loss
CIF Stock Recommendation Report (Fall 2012) Date: Nov 27 th 2012 Analyst Name: Tung Linh Company Name and Ticker: W.W. Grainger, Inc. (GWW) Section (A) Summary Recommendation Buy: No Target Price: Stop-Loss
CIF Stock Recommendation Report (Fall 2012)
") Date: 10/16/2012 Analyst Name: Matthew Vague CIF Stock Recommendation Report (Fall 2012) Company Name and Ticker: Chevron (CVX) Section (A) Summary Recommendation Buy: Yes Target Price: Stop-Loss Price:
Date: 10/16/2012 Analyst Name: Matthew Vague CIF Stock Recommendation Report (Fall 2012) Company Name and Ticker: Chevron (CVX) Section (A) Summary Recommendation Buy: Yes Target Price: Stop-Loss Price:
CIF Stock Recommendation Report (Fall 2012)
") CIF Stock Recommendation Report (Fall 2012) Company Name and Ticker: PepsiCo Inc. PEP Section (A) Summary Date: 10/12/12 Analyst Name: Trevor Boren Recommendation Buy: Yes Target Price: $75.69 Sector:
CIF Stock Recommendation Report (Fall 2012) Company Name and Ticker: PepsiCo Inc. PEP Section (A) Summary Date: 10/12/12 Analyst Name: Trevor Boren Recommendation Buy: Yes Target Price: $75.69 Sector:
CIF Stock Recommendation Report (Fall 2012)
") Section (A) Summary CIF Stock Recommendation Report (Fall 2012) Recommendation: Do Not Buy Recommended Buy Price: $69 Sector: Industrials Company Name and Ticker: Caterpillar Inc. (CAT) Industry: Farm
Section (A) Summary CIF Stock Recommendation Report (Fall 2012) Recommendation: Do Not Buy Recommended Buy Price: $69 Sector: Industrials Company Name and Ticker: Caterpillar Inc. (CAT) Industry: Farm
CIF Stock Recommendation Report (Spring 2013)
") Date: February 6, 2013 Analyst Name: Matt Leid CIF Stock Recommendation Report (Spring 2013) Section (A) Summary Company Name and Ticker: Noble Corporation (NE) Recommendation Buy: Yes No Target Price:
Date: February 6, 2013 Analyst Name: Matt Leid CIF Stock Recommendation Report (Spring 2013) Section (A) Summary Company Name and Ticker: Noble Corporation (NE) Recommendation Buy: Yes No Target Price:
CIF Stock Recommendation Report (Fall 2012)
") Section (A) Summary Date: 3/8/13 Analyst Name: Matthew Landen CIF Stock Recommendation Report (Fall 2012) Company Name and Ticker: Aflac Inc. (AFL) Recommendation Buy: Yes Target Price: $58.77 (+15%) Sector:
Section (A) Summary Date: 3/8/13 Analyst Name: Matthew Landen CIF Stock Recommendation Report (Fall 2012) Company Name and Ticker: Aflac Inc. (AFL) Recommendation Buy: Yes Target Price: $58.77 (+15%) Sector:
CIF Stock Recommendation Report (Fall 2012)
") Date: 10/13/2012 Analyst Name: Ryan Ellingsen CIF Stock Recommendation Report (Fall 2012) Company Name and Ticker: Colgate-Palmolive Company (CL) Section (A) Summary Recommendation Buy: Hold Target Price:
Date: 10/13/2012 Analyst Name: Ryan Ellingsen CIF Stock Recommendation Report (Fall 2012) Company Name and Ticker: Colgate-Palmolive Company (CL) Section (A) Summary Recommendation Buy: Hold Target Price:
CIF Stock Recommendation Report (Fall 2012)
") Section (A) Summary CIF Stock Recommendation Report (Fall 2012) Company Name and Ticker: Boeing BA Recommendation Buy: Yes Target Price: $83.00 Sector: Industrials Industry: Aerospace & Defense Market
Section (A) Summary CIF Stock Recommendation Report (Fall 2012) Company Name and Ticker: Boeing BA Recommendation Buy: Yes Target Price: $83.00 Sector: Industrials Industry: Aerospace & Defense Market
CIF Stock Recommendation Report (Spring 2015)
") Date: 3/3/2015 Analyst Name: Connor Black and Ali Al-Lawati CIF Stock Recommendation Report (Spring 2015) Company Name and Ticker: Danaher (DHR) Section (A) Investment Summary Recommendation Buy: Yes Target
Date: 3/3/2015 Analyst Name: Connor Black and Ali Al-Lawati CIF Stock Recommendation Report (Spring 2015) Company Name and Ticker: Danaher (DHR) Section (A) Investment Summary Recommendation Buy: Yes Target
CIF Stock Recommendation Report (Fall 2012)
") Section (A) Summary Date: 11/06/12 Analyst Name: Austin Frazier CIF Stock Recommendation Report (Fall 2012) Company Name and Ticker: GameStop (GME) Recommendation Buy: Yes No Target Price: 26.00 Sector:
Section (A) Summary Date: 11/06/12 Analyst Name: Austin Frazier CIF Stock Recommendation Report (Fall 2012) Company Name and Ticker: GameStop (GME) Recommendation Buy: Yes No Target Price: 26.00 Sector:
CIF Stock Recommendation Report (Fall 2012) Summary
 Summary") Date: 11/6/2012 Analyst Name: Kyle Temple CIF Stock Recommendation Report (Fall 2012) Company Name and Ticker: Dover Corp Summary DOV Recommendation Buy: Yes No Target Price: $65.00 Sector: Industrials
Date: 11/6/2012 Analyst Name: Kyle Temple CIF Stock Recommendation Report (Fall 2012) Company Name and Ticker: Dover Corp Summary DOV Recommendation Buy: Yes No Target Price: $65.00 Sector: Industrials
CIF Stock Recommendation Report (Spring 2014)
") Date: 2/28/14 Analyst Name: Anthony Ledesma & Mason Yang CIF Stock Recommendation Report (Spring 2014) Company Name and Ticker: UnitedHealth Group (UNH) Section (A) Investment Summary Recommendation Buy:
Date: 2/28/14 Analyst Name: Anthony Ledesma & Mason Yang CIF Stock Recommendation Report (Spring 2014) Company Name and Ticker: UnitedHealth Group (UNH) Section (A) Investment Summary Recommendation Buy:
CIF Stock Recommendation Report (Fall 2012)
") Section (A) Summary Date: 12/6/2012 Analyst Name: Jacob Allen CIF Stock Recommendation Report (Fall 2012) Company Name and Ticker: Qualcomm Inc. (QCOM) Recommendation Buy: Yes No Target Price: $67.00 Sector:
Section (A) Summary Date: 12/6/2012 Analyst Name: Jacob Allen CIF Stock Recommendation Report (Fall 2012) Company Name and Ticker: Qualcomm Inc. (QCOM) Recommendation Buy: Yes No Target Price: $67.00 Sector:
CIF Stock Recommendation Report (Spring 2015)
") Date: March 4, 2015 Analyst Name: Brady Arnone, CJ Lee CIF Stock Recommendation Report (Spring 2015) Section (A) Investment Summary Recommendation Buy: Yes Sector: Technology Company Name and Ticker: Visa
Date: March 4, 2015 Analyst Name: Brady Arnone, CJ Lee CIF Stock Recommendation Report (Spring 2015) Section (A) Investment Summary Recommendation Buy: Yes Sector: Technology Company Name and Ticker: Visa
CIF Stock Recommendation Report (Spring 2015)
") Date:_4/4/14 Analyst Name:_Courtney Hastings, Dom Niolu CIF Stock Recommendation Report (Spring 2015) Company Name and Ticker: Praxair_PX Section (A) Investment Summary Recommendation Buy: Yes No Target
Date:_4/4/14 Analyst Name:_Courtney Hastings, Dom Niolu CIF Stock Recommendation Report (Spring 2015) Company Name and Ticker: Praxair_PX Section (A) Investment Summary Recommendation Buy: Yes No Target
CIF Stock Recommendation Report (Fall 2012)
") Section (A) Summary Date: 10/31/2012 Analyst Name: Hassam Al-Shamlan CIF Stock Recommendation Report (Fall 2012) Company Name and Ticker: (KO) Recommendation Buy: Yes No Target Price: $45.00 Sector: Consumer
Section (A) Summary Date: 10/31/2012 Analyst Name: Hassam Al-Shamlan CIF Stock Recommendation Report (Fall 2012) Company Name and Ticker: (KO) Recommendation Buy: Yes No Target Price: $45.00 Sector: Consumer
CIF Stock Recommendation Report (Spring 2013)
") Date: 3/22/13 Analyst Name: Jacob Allen CIF Stock Recommendation Report (Spring 2013) Company Name and Ticker: CareFusion Corp. (CFN) Section (A) Summary Recommendation Buy: Yes No Target Price: Stop-Loss
Date: 3/22/13 Analyst Name: Jacob Allen CIF Stock Recommendation Report (Spring 2013) Company Name and Ticker: CareFusion Corp. (CFN) Section (A) Summary Recommendation Buy: Yes No Target Price: Stop-Loss
CIF Stock Recommendation Report (Spring 2013)
") Date: 2/11/2013 Analyst Name: Bradley Barham CIF Stock Recommendation Report (Spring 2013) Section (A) Summary Company Name and Ticker: CNH Global N.V. (CNH)_ Recommendation Buy: Yes No Target Price: 55.00
Date: 2/11/2013 Analyst Name: Bradley Barham CIF Stock Recommendation Report (Spring 2013) Section (A) Summary Company Name and Ticker: CNH Global N.V. (CNH)_ Recommendation Buy: Yes No Target Price: 55.00
CIF Stock Recommendation Report (Fall 2012)
") Date: 2/8/13 Analyst Name:_Walter Nabarrete CIF Stock Recommendation Report (Fall 2012) Company Name and Ticker: Praxair (PX) Section (A) Summary Recommendation Buy: Yes No Target Price: N/A Stop-Loss
Date: 2/8/13 Analyst Name:_Walter Nabarrete CIF Stock Recommendation Report (Fall 2012) Company Name and Ticker: Praxair (PX) Section (A) Summary Recommendation Buy: Yes No Target Price: N/A Stop-Loss
CIF Stock Recommendation Report (Fall 2012) MS Consider Buying: 49. If Less Than 8 WK, next Earnings Ann. Date: Short Interest Ratio: 1.
 MS Consider Buying: 49. If Less Than 8 WK, next Earnings Ann. Date: Short Interest Ratio: 1.") Date: October 14 2012 Analyst Name: Justin L. Jaena CIF Stock Recommendation Report (Fall 2012) Company Name and Ticker:_BBBY Section (A) Summary Recommendation Buy: Yes Target Price: 70 Stop-Loss Price:
Date: October 14 2012 Analyst Name: Justin L. Jaena CIF Stock Recommendation Report (Fall 2012) Company Name and Ticker:_BBBY Section (A) Summary Recommendation Buy: Yes Target Price: 70 Stop-Loss Price:
CIF Stock Recommendation Report (Fall 2012)
") Date: 2/29/2013 Analyst Name: Matt Vague CIF Stock Recommendation Report (Fall 2012) Company Name and Ticker: Wynn Resorts Ltd. (WYNN) Section (A) Summary Recommendation Buy: Yes No Target Price: Stop-Loss
Date: 2/29/2013 Analyst Name: Matt Vague CIF Stock Recommendation Report (Fall 2012) Company Name and Ticker: Wynn Resorts Ltd. (WYNN) Section (A) Summary Recommendation Buy: Yes No Target Price: Stop-Loss
CIF Stock Recommendation Report (Fall 2012)
") Date: November 15, 2012 Analyst Name: Jun Mei CIF Stock Recommendation Report (Fall 2012) Company Name and Ticker: Simon Property Group (SPG) Section (A) Summary Recommendation Buy: Yes No Target Price:
Date: November 15, 2012 Analyst Name: Jun Mei CIF Stock Recommendation Report (Fall 2012) Company Name and Ticker: Simon Property Group (SPG) Section (A) Summary Recommendation Buy: Yes No Target Price:
CIF Sector Recommendation Report (Fall 2012)
") Date: 11/27/2012 Analyst: Joseph Brendel CIF Sector Recommendation Report (Fall 2012) Sector: Finance Review Period: Monday, November 12 - Friday, November 23 Section (A) Sector Performance Review Copy/paste
Date: 11/27/2012 Analyst: Joseph Brendel CIF Sector Recommendation Report (Fall 2012) Sector: Finance Review Period: Monday, November 12 - Friday, November 23 Section (A) Sector Performance Review Copy/paste
Current Price: $ WK Hi: $ WK Low: $55.21 EBO Valuation: $73.07
 Date: April 12 th, 2014 Analyst Name: Trevor Russell CIF Stock Recommendation Report (Spring 2014) Company Name and Ticker: CVS Caremark Corporation (CVS) Section (A) Investment Summary Recommendation
CIF Stock Recommendation Report (Fall 2012)
") Section (A) Summary Date: 2/22/13 Analyst Name: Khalid Surur CIF Stock Recommendation Report (Fall 2012) Company Name and Ticker: Nike (NKE) Recommendation Buy: Yes Target Price: $60 Stop-Loss Price: $50
Section (A) Summary Date: 2/22/13 Analyst Name: Khalid Surur CIF Stock Recommendation Report (Fall 2012) Company Name and Ticker: Nike (NKE) Recommendation Buy: Yes Target Price: $60 Stop-Loss Price: $50
CIF Stock Recommendation Report (Spring 2014)
") Date: March 7 Analyst Name: Mason Yang_ CIF Stock Recommendation Report (Spring 2014) Company Name and Ticker: St. Jude Medical Inc. (STJ) Section (A) Investment Summary Recommendation Buy: Yes No Target
Date: March 7 Analyst Name: Mason Yang_ CIF Stock Recommendation Report (Spring 2014) Company Name and Ticker: St. Jude Medical Inc. (STJ) Section (A) Investment Summary Recommendation Buy: Yes No Target
CIF Stock Recommendation Report (Spring 2014)
") Date: March 3, 2014 Analyst Name: Michael Sanders & Xiao Liu CIF Stock Recommendation Report (Spring 2014) Company Name and Ticker: Lockheed Martin Corp. (LMT) Section (A) Investment Summary Recommendation
Date: March 3, 2014 Analyst Name: Michael Sanders & Xiao Liu CIF Stock Recommendation Report (Spring 2014) Company Name and Ticker: Lockheed Martin Corp. (LMT) Section (A) Investment Summary Recommendation
CIF Stock Recommendation Report (Fall 2012)
") Date: October 9, 2012 Analyst Name: Alyssa Wood CIF Stock Recommendation Report (Fall 2012) Company Name and Ticker: Molson-Coors Brewing Company (TAP) Section (A) Summary Recommendation Buy: Hold Target
Date: October 9, 2012 Analyst Name: Alyssa Wood CIF Stock Recommendation Report (Fall 2012) Company Name and Ticker: Molson-Coors Brewing Company (TAP) Section (A) Summary Recommendation Buy: Hold Target
CIF Stock Recommendation Report (Fall 2012)
") Section (A) Summary Date:2/28/2013 Analyst Name: Kristen Hecht CIF Stock Recommendation Report (Fall 2012) Company Name and Ticker: Walt Disney Co (DIS) Recommendation Buy: Yes No Target Price: $62.00
Section (A) Summary Date:2/28/2013 Analyst Name: Kristen Hecht CIF Stock Recommendation Report (Fall 2012) Company Name and Ticker: Walt Disney Co (DIS) Recommendation Buy: Yes No Target Price: $62.00
CIF Sector Recommendation Report (Spring 2013)
") Date: 2/19/13 Analyst: Joseph Brendel CIF Sector Recommendation Report (Spring 2013) Sector: Health Care (XLV) Review Period: February 1- February 14 Section (A) Sector Performance Review Copy/paste Sector
Date: 2/19/13 Analyst: Joseph Brendel CIF Sector Recommendation Report (Spring 2013) Sector: Health Care (XLV) Review Period: February 1- February 14 Section (A) Sector Performance Review Copy/paste Sector
CIF Stock Recommendation Report (Spring 2013)
") Date: 3/27/2013 Analyst Name: Braden Parsons CIF Stock Recommendation Report (Spring 2013) Section (A) Summary Company Name and Ticker: Xilinx (XLNX) Recommendation Buy: Yes No Target Price: $43.67 Sector:
Date: 3/27/2013 Analyst Name: Braden Parsons CIF Stock Recommendation Report (Spring 2013) Section (A) Summary Company Name and Ticker: Xilinx (XLNX) Recommendation Buy: Yes No Target Price: $43.67 Sector:
CIF Stock Recommendation Report (Spring 2013)
") Date: March 4 th, 2013 Analyst Name: Tung Linh CIF Stock Recommendation Report (Spring 2013) Company Name and Ticker: Berkshire Hathaway Inc. (BRK.B) Section (A) Summary Recommendation Buy: Yes Target
Date: March 4 th, 2013 Analyst Name: Tung Linh CIF Stock Recommendation Report (Spring 2013) Company Name and Ticker: Berkshire Hathaway Inc. (BRK.B) Section (A) Summary Recommendation Buy: Yes Target
CIF Stock Recommendation Report (Spring 2015)
") Date:4/11/15 Analyst Name: Christine Nordlie and Connor Phelps CIF Stock Recommendation Report (Spring 2015) Section (A) Investment Summary Recommendation Buy: Yes No Limit Buy at $111 Sector: Health Care
Date:4/11/15 Analyst Name: Christine Nordlie and Connor Phelps CIF Stock Recommendation Report (Spring 2015) Section (A) Investment Summary Recommendation Buy: Yes No Limit Buy at $111 Sector: Health Care
CIF Sector Recommendation Report (Fall 2012)
") CIF Sector Recommendation Report (Fall 2012) Date: 10/27/12 Analyst: Ryan Ellingsen Sector: Consumer Staples Review Period: October 11 th -October 24th Section (A) Sector Performance Review Consumer Staples
CIF Sector Recommendation Report (Fall 2012) Date: 10/27/12 Analyst: Ryan Ellingsen Sector: Consumer Staples Review Period: October 11 th -October 24th Section (A) Sector Performance Review Consumer Staples
CIF Stock Recommendation Report (Spring 2013)
") Date: Feb. 4th Analyst Name: Jace Hochwalt CIF Stock Recommendation Report (Spring 2013) Company Name and Ticker: Monster Beverage (MNST) Section (A) Summary Recommendation Buy: Yes No Target Price: N/A
Date: Feb. 4th Analyst Name: Jace Hochwalt CIF Stock Recommendation Report (Spring 2013) Company Name and Ticker: Monster Beverage (MNST) Section (A) Summary Recommendation Buy: Yes No Target Price: N/A
CIF Stock Recommendation Report (Spring 2015)
") Date: 3/24/15 Analyst Names: _John Tupper & Michael Retallick_ CIF Stock Recommendation Report (Spring 2015) Company Name and Ticker:_The Home Depot Inc. (HD) Section (A) Investment Summary Recommendation
Date: 3/24/15 Analyst Names: _John Tupper & Michael Retallick_ CIF Stock Recommendation Report (Spring 2015) Company Name and Ticker:_The Home Depot Inc. (HD) Section (A) Investment Summary Recommendation
CIF Stock Recommendation Report (Spring 2014)
") Date: 2/22/2014 Analyst Name: Battson & Gruber CIF Stock Recommendation Report (Spring 2014) Company Name and Ticker: Ameriprise Financial, Inc. (AMP) Section (A) Investment Summary Recommendation Buy:
Date: 2/22/2014 Analyst Name: Battson & Gruber CIF Stock Recommendation Report (Spring 2014) Company Name and Ticker: Ameriprise Financial, Inc. (AMP) Section (A) Investment Summary Recommendation Buy:
CIF Stock Recommendation Report (Spring 2013)
") Date:03.20.2013 Analyst Name: Justin L. Jaena CIF Stock Recommendation Report (Spring 2013) Company Name and Ticker: Cameron International Corp (CAM) Section (A) Summary Recommendation Buy: Yes No Target
Date:03.20.2013 Analyst Name: Justin L. Jaena CIF Stock Recommendation Report (Spring 2013) Company Name and Ticker: Cameron International Corp (CAM) Section (A) Summary Recommendation Buy: Yes No Target
CIF Sector Recommendation Report (Fall 2012)
") CIF Sector Recommendation Report (Fall 2012) Date: 04.22.2013 Analyst: Justin L. Jaena Sector: Energy (XLE) Review Period 04.12-04.23 Section (A) Sector Performance Review 1 Both the market and the sector
CIF Sector Recommendation Report (Fall 2012) Date: 04.22.2013 Analyst: Justin L. Jaena Sector: Energy (XLE) Review Period 04.12-04.23 Section (A) Sector Performance Review 1 Both the market and the sector
TEC Sector Recommendation Report (Fall 2012)
") TEC Sector Recommendation Report (Fall 2012) Date: 10/30/2012 Analyst: Matt Leid Sector: TEC Review Period: 10/11/2012-10/24/2012 Section (A) Sector Performance Review Below we can see that, a few days
TEC Sector Recommendation Report (Fall 2012) Date: 10/30/2012 Analyst: Matt Leid Sector: TEC Review Period: 10/11/2012-10/24/2012 Section (A) Sector Performance Review Below we can see that, a few days
CIF Stock Recommendation Report (Spring 2014)
") Date: April 11, 2014 Analyst Name: Xiao Liu CIF Stock Recommendation Report (Spring 2014) Company Name and Ticker: Honeywell International Inc. (HON) Section (A) Investment Summary Recommendation Buy:
Date: April 11, 2014 Analyst Name: Xiao Liu CIF Stock Recommendation Report (Spring 2014) Company Name and Ticker: Honeywell International Inc. (HON) Section (A) Investment Summary Recommendation Buy:
CIF Sector Recommendation Report (Fall 2012)
") Date: 12/4/2012 Analyst: Frank McLaughlin CIF Sector Recommendation Report (Fall 2012) Sector: Industrials Review Period: 11/16/2012-11/30/2012 Section (A) Sector Performance Review Copy/paste Sector Review
Date: 12/4/2012 Analyst: Frank McLaughlin CIF Sector Recommendation Report (Fall 2012) Sector: Industrials Review Period: 11/16/2012-11/30/2012 Section (A) Sector Performance Review Copy/paste Sector Review
CIF Stock Recommendation Report (Spring 2013)
") Date: February 13, 2013 Analyst Name: Alyssa Wood CIF Stock Recommendation Report (Spring 2013) Company Name and Ticker: Urban Outfitters (URBN) Section (A) Summary Recommendation Buy: Yes Target Price:
Date: February 13, 2013 Analyst Name: Alyssa Wood CIF Stock Recommendation Report (Spring 2013) Company Name and Ticker: Urban Outfitters (URBN) Section (A) Summary Recommendation Buy: Yes Target Price:
CIF Sector Recommendation Report (Fall 2012)
") CIF Sector Recommendation Report (Fall 2012) Date:2/15/13 Analyst: Eric Klaasen Sector Consumer Staples Review Period:1/30/13-2/13/13 Section (A) Sector Performance Review Copy/paste Sector Review Spreadsheet
CIF Sector Recommendation Report (Fall 2012) Date:2/15/13 Analyst: Eric Klaasen Sector Consumer Staples Review Period:1/30/13-2/13/13 Section (A) Sector Performance Review Copy/paste Sector Review Spreadsheet
CIF Sector Recommendation Report (Spring 2013)
") Date: 4/1/2013 Analyst: Jacob Allen CIF Sector Recommendation Report (Spring 2013) Sector: Healthcare Review Period: 3/13/2013 3/26/2013 Section (A) Sector Performance Review Copy/paste Sector Review Spreadsheet
Date: 4/1/2013 Analyst: Jacob Allen CIF Sector Recommendation Report (Spring 2013) Sector: Healthcare Review Period: 3/13/2013 3/26/2013 Section (A) Sector Performance Review Copy/paste Sector Review Spreadsheet
CIF Stock Recommendation Report (Spring 2014)
") Date: 4/14/2014 Analyst Name: Kevin Bertelsen CIF Stock Recommendation Report (Spring 2014) Company Name and Ticker: EOG Resources (EOG) Section (A) Investment Summary Recommendation Buy: Yes No Target
Date: 4/14/2014 Analyst Name: Kevin Bertelsen CIF Stock Recommendation Report (Spring 2014) Company Name and Ticker: EOG Resources (EOG) Section (A) Investment Summary Recommendation Buy: Yes No Target
CIF Sector Recommendation Report (Fall 2012)
") CIF Sector Recommendation Report (Fall 2012) Date: March 3, 2013 Analyst: Nick Pascoe Sector: Healthcare Review Period: February 12 February 26 Section (A) Sector Performance Review Cougar Investment Fund
CIF Sector Recommendation Report (Fall 2012) Date: March 3, 2013 Analyst: Nick Pascoe Sector: Healthcare Review Period: February 12 February 26 Section (A) Sector Performance Review Cougar Investment Fund
CIF Sector Recommendation Report (Fall 2012)
") CIF Sector Recommendation Report (Fall 2012) Date: March 20, 2013 Analyst: Lillian Mojica Sector: Financial Review Period: March 1 st - 15 th Section (A) Sector Performance Review FIN Ticker Current Beg.
CIF Sector Recommendation Report (Fall 2012) Date: March 20, 2013 Analyst: Lillian Mojica Sector: Financial Review Period: March 1 st - 15 th Section (A) Sector Performance Review FIN Ticker Current Beg.
CIF Sector Recommendation Report (Spring 2013)
") Date: 4/10/13 Analyst: Corey Malone CIF Sector Recommendation Report (Spring 2013) Sector: XLF Review Period: 3/21/13-4/4/13 Section (A) Sector Performance Review Sector Review Spreadsheet One- Month Stock
Date: 4/10/13 Analyst: Corey Malone CIF Sector Recommendation Report (Spring 2013) Sector: XLF Review Period: 3/21/13-4/4/13 Section (A) Sector Performance Review Sector Review Spreadsheet One- Month Stock
CIF Sector Recommendation Report (Fall 2012)
") CIF Sector Recommendation Report (Fall 2012) Date: November 6, 2012 Analyst: Alyssa Wood Sector: Consumer Staples (XLP) Review Period: October 17-31, 2012 Section (A) Sector Performance Review Cougar Investment
CIF Sector Recommendation Report (Fall 2012) Date: November 6, 2012 Analyst: Alyssa Wood Sector: Consumer Staples (XLP) Review Period: October 17-31, 2012 Section (A) Sector Performance Review Cougar Investment
CIF Stock Recommendation Report (Spring 2014)
") Date: 4/19/2014 Analyst Name: Connor McCulloh CIF Stock Recommendation Report (Spring 2014) Company Name and Ticker: Johnson & Johnson (JNJ) Section (A) Investment Summary Recommendation Buy: Yes No Target
Date: 4/19/2014 Analyst Name: Connor McCulloh CIF Stock Recommendation Report (Spring 2014) Company Name and Ticker: Johnson & Johnson (JNJ) Section (A) Investment Summary Recommendation Buy: Yes No Target
SECTOR PERFORMANCE REVIEW
 SECTOR PERFORMANCE REVIEW Healthcare MELISSA CAMERON & WADE ROERSON A. Sector Performance Review A-1 Sector HC Review Period Start Date 1/12/2015 End Date 4/13/2015 Ticker Recommend CIF Current Beg. Stop-loss
CIF Sector Recommendation Report (Spring 2013)
") Date: 4/22/13 Analyst: Walter Nabarrete CIF Sector Recommendation Report (Spring 2013) Sector Materials Review Period 4/5 to 4/19 Section (A) Sector Performance Review MAT Ticker Current Beg. Stop-loss
Date: 4/22/13 Analyst: Walter Nabarrete CIF Sector Recommendation Report (Spring 2013) Sector Materials Review Period 4/5 to 4/19 Section (A) Sector Performance Review MAT Ticker Current Beg. Stop-loss
Trailing PE Forward PE Hold 6 Analysts. 1-Year Return: 3.5% 5-Year Return: 21.4%
 Last Close 11.73 (CAD) Avg Daily Vol 961,084 52-Week High 11.84 Trailing PE 25.3 Annual Div 0.80 ROE 6.9% LTG Forecast -- 1-Mo 8.4% 2019 March 26 TORONTO Exchange Market Cap 1.4B 52-Week Low 9.27 Forward
CIF Sector Recommendation Report (Fall 2012)
") CIF Sector Recommendation Report (Fall 2012) Date: 11/29/12 Analyst: Khalid Surur Sector Healthcare Review Period: November 12-November 23rd Section (A) Sector Performance Review Copy/paste Sector Review
CIF Sector Recommendation Report (Fall 2012) Date: 11/29/12 Analyst: Khalid Surur Sector Healthcare Review Period: November 12-November 23rd Section (A) Sector Performance Review Copy/paste Sector Review
Trailing PE Forward PE Buy 11 Analysts. 1-Year Return: 3.0% 5-Year Return: -19.7%
 ENCANA CORP (-T) Last Close 14.70 (CAD) Avg Daily Vol 3.3M 52-Week High 18.54 Trailing PE 188.1 Annual Div 0.08 ROE 0.7% LTG Forecast 36.4% 1-Mo -7.8% October 12 TORONTO Exchange Market Cap 14.0B 52-Week
CIF Stock Recommendation Report (Spring 2014)
") Date: April 7 th, 2014 Analyst Name: Tanner Peterson CIF Stock Recommendation Report (Spring 2014) Company Name and Ticker: Facebook Inc (FB) Section (A) Investment Summary Recommendation Buy: Yes Sector:
Date: April 7 th, 2014 Analyst Name: Tanner Peterson CIF Stock Recommendation Report (Spring 2014) Company Name and Ticker: Facebook Inc (FB) Section (A) Investment Summary Recommendation Buy: Yes Sector:
Trailing PE Forward PE 8.5. Buy 5 Analysts. 1-Year Return: -39.3% 5-Year Return: -91.2%
 Last Close 11.46 (CAD) Avg Daily Vol 53,811 52-Week High 20.55 Trailing PE 11.4 Annual Div 0.79 ROE 6.2% LTG Forecast 77.9% 1-Mo 4.3% 2019 April 04 TORONTO Exchange Market Cap 178M 52-Week Low 8.32 Forward
Trailing PE 8.9. Forward PE 8.0. Buy 1 Analyst. 1-Year Return: -- 5-Year Return: --
 Last Close 0.25 (MYR) Avg Daily Vol 280,263 52-Week High 0.33 Trailing PE 8.9 Annual Div -- ROE 23.0% LTG Forecast -- 1-Mo 4.3% 17 May MALAYSIA Exchange Market Cap 74M 52-Week Low 0.20 Forward PE 8.0 Dividend
Trailing PE -- Forward PE Buy 6 Analysts. 1-Year Return: -5.7% 5-Year Return: 710.7%
 ING GROUP (-AE) Last Close 0.95 (EUR) Avg Daily Vol 11.9M 52-Week High 1.62 Trailing PE -- Annual Div -- ROE -112.3% LTG Forecast -- 1-Mo 1.9% November 01 AMSTERDAM Exchange Market Cap 551M 52-Week Low
Prudential Financial Inc.
 February 06, 2015 Prudential Financial Inc. Current Recommendation NEUTRAL Prior Recommendation Outperform Date of Last Change 04/03/2014 Current Price (02/05/15) $75.32 Target Price $79.00 SUMMARY DATA
CIF Sector Recommendation Report (Fall 2012)
") Date: 4/24/13 Analyst: Kyle Temple CIF Sector Recommendation Report (Fall 2012) Sector Technology Review Period 4/8-4/19 Section (A) Sector Performance Review Cougar Investment Fund Sector Review Spreadsheet
Date: 4/24/13 Analyst: Kyle Temple CIF Sector Recommendation Report (Fall 2012) Sector Technology Review Period 4/8-4/19 Section (A) Sector Performance Review Cougar Investment Fund Sector Review Spreadsheet
RESEARCH IN MOTION LIMITED (BBRY-O) Technology Equipment / Computers, Phones & Electr. / Phones & Handheld Devices
 Technology Equipment / Computers, Phones & Electr. / Phones & Handheld Devices") - Updated June 21, 2013 RESEARCH IN MOTION LIMITED (-O) Technology Equipment / Computers, Phones & Electr. / Phones & Handheld Devices The Average Score combines the quantitative analysis of six widely-used
- Updated June 21, 2013 RESEARCH IN MOTION LIMITED (-O) Technology Equipment / Computers, Phones & Electr. / Phones & Handheld Devices The Average Score combines the quantitative analysis of six widely-used
Trailing PE -- Forward PE -- Hold 13 Analysts. 1-Year Return: -7.6% 5-Year Return: -89.4%
 OBSIDIAN ENERGY (-T) Last Close 1.21 (CAD) Avg Daily Vol 202,689 52-Week High 1.85 Trailing PE -- Annual Div -- ROE -12.3% LTG Forecast -- 1-Mo -6.2% October 04 TORONTO Exchange Market Cap 614M 52-Week
Strong Buy 2 Analysts
 Last Close 0.36 (CAD) Avg Daily Vol 173,853 52-Week High 0.46 Trailing PE -- Annual Div -- ROE -21.8% LTG Forecast -- 1-Mo 5.9% 2019 April 08 TSX VENTURE Exchange Market Cap 124M 52-Week Low 0.13 Forward
CIF Sector Recommendation Report (Spring 2013)
") Date: 24 April 2013 Analyst: Garrett Lachney CIF Sector Recommendation Report (Spring 2013) Sector: Healthcare Review Period: 04/05-04/18 Section (A) Sector Performance Review Copy/paste Sector Review
Date: 24 April 2013 Analyst: Garrett Lachney CIF Sector Recommendation Report (Spring 2013) Sector: Healthcare Review Period: 04/05-04/18 Section (A) Sector Performance Review Copy/paste Sector Review
Trailing PE Forward PE Buy 1 Analyst. 1-Year Return: -26.2% 5-Year Return: 71.3%
 RICHELIEU HARDWARE (-T) Last Close 24.56 (CAD) Avg Daily Vol 124,594 52-Week High 33.69 Trailing PE 20.6 Annual Div 0.24 ROE 15.6% LTG Forecast -- 1-Mo 13.0% 2019 January 10 TORONTO Exchange Market Cap
Trailing PE Forward PE Buy 13 Analysts. 1-Year Return: -10.6% 5-Year Return: -9.1%
 INTER PIPELINE (-T) Last Close 22.95 (CAD) Avg Daily Vol 1.1M 52-Week High 27.91 Trailing PE 15.6 Annual Div 1.68 ROE 16.3% LTG Forecast 1.3% 1-Mo -4.3% October 02 TORONTO Exchange Market Cap 8.7B 52-Week
Trailing PE -- Forward PE -- Buy 1 Analyst. 1-Year Return: -40.2% 5-Year Return: -93.3%
 Last Close 1.10 (CAD) Avg Daily Vol 39,637 52-Week High 2.42 Trailing PE Annual Div 1.43 ROE -39.1% LTG Forecast 1-Mo -20.9% 2019 April 01 TORONTO Exchange Market Cap 67M 52-Week Low 1.01 Forward PE Dividend
Trailing PE -- Forward PE -- NA 0 Analysts. 1-Year Return: 424.7% 5-Year Return: 415.2%
 DIVIDEND 15 SPLIT CORP (-T) Last Close 10.23 (CAD) Avg Daily Vol 41,738 52-Week High 10.32 Trailing PE Annual Div 1.20 ROE LTG Forecast 1-Mo 0.1% 2018 August 17 TORONTO Exchange Market Cap 460M 52-Week
Trailing PE 4.8. Forward PE 8.6. Buy 2 Analysts. 1-Year Return: -10.6% 5-Year Return: 61.4%
 MORGUARD CORP (-T) Last Close 167.20 (CAD) Avg Daily Vol 1,962 52-Week High 194.10 Trailing PE 4.8 Annual Div 0.60 ROE 13.6% LTG Forecast -- 1-Mo -1.4% 2018 June 15 TORONTO Exchange Market Cap 1.9B 52-Week
MITEL NETWORKS CORP (MNW-T) Software & IT Services / Software & IT Services / Software
 Software & IT Services / Software & IT Services / Software") MITEL NETWORKS CORP (-T) Last Close 14.32 (CAD) Avg Daily Vol 261,724 52-Week High 14.67 Trailing PE -- Annual Div -- ROE -9.0% LTG Forecast 25.2% 1-Mo -1.2% August 17 TORONTO Exchange Market Cap 1.8B
MITEL NETWORKS CORP (-T) Last Close 14.32 (CAD) Avg Daily Vol 261,724 52-Week High 14.67 Trailing PE -- Annual Div -- ROE -9.0% LTG Forecast 25.2% 1-Mo -1.2% August 17 TORONTO Exchange Market Cap 1.8B
Stock Rover Profile Metrics
 Stock Rover Profile Metrics Average Volume (3m) The average number of shares traded per day over the past 3 months. Company Unit: Name The full name of the company. Employees The number of direct employees.
Trailing PE Forward PE Hold 6 Analysts. 1-Year Return: 8.9% 5-Year Return: -8.1%
 PASON SYSTEMS INC (-T) Last Close 20.14 (CAD) Avg Daily Vol 171,050 52-Week High 22.10 Trailing PE 54.4 Annual Div 0.72 ROE 8.0% LTG Forecast -- 1-Mo 1.5% October 18 TORONTO Exchange Market Cap 1.7B 52-Week
52-Week High Trailing PE Week Low Forward PE -- NA 0 Analysts. 1-Year Return: -1.8% 5-Year Return: 3.6%
 CANOE EIT INCOME FUND (-T) Last Close 11.85 (CAD) Avg Daily Vol 129,767 52-Week High 12.08 Trailing PE 17.6 Annual Div 1.20 ROE 5.5% LTG Forecast 1-Mo 1.8% 2018 June 06 TORONTO Exchange Market Cap (Consol)
52-Week High Trailing PE Week Low Forward PE Hold 17 Analysts. 1-Year Return: 54.6% 5-Year Return: 104.
 Last Close 78.37 (CAD) Avg Daily Vol 514,211 52-Week High 79.72 Trailing PE 8.4 Annual Div 1.92 ROE 35.7% LTG Forecast 39.4% 1-Mo 8.6% 2019 April 08 TORONTO Exchange Market Cap (Consol) 39.3B 52-Week Low
Trailing PE 8.9. Forward PE 8.0. Hold 7 Analysts. 1-Year Return: -17.0% 5-Year Return: -13.9%
 ER CORPORATION OF CANADA (-T) Last Close 27.12 (CAD) Avg Daily Vol 905,847 52-Week High 33.21 Trailing PE 8.9 Annual Div 1.53 ROE 9.9% LTG Forecast 6.3% 1-Mo 0.9% November 15 TORONTO Exchange Market Cap
52-Week High Trailing PE Week Low Forward PE Buy 10 Analysts. 1-Year Return: -12.7% 5-Year Return: 188.
 Last Close 55.73 (CAD) Avg Daily Vol 279,732 52-Week High 67.63 Trailing PE 21.3 Annual Div 0.68 ROE 19.3% LTG Forecast -- 1-Mo 3.1% 2019 April 15 TORONTO Exchange Market Cap (Consol) 9.8B 52-Week Low
Trailing PE Forward PE 8.8. Buy 7 Analysts. 1-Year Return: -1.3% 5-Year Return: -66.0%
 GONAUT GOLD INC (-T) Last Close 2.29 (CAD) Avg Daily Vol 338,372 52-Week High 2.92 Trailing PE 14.5 Annual Div -- ROE 3.7% LTG Forecast -- 1-Mo 3.6% July 19 TORONTO Exchange Market Cap 389M 52-Week Low
52-Week High Trailing PE Week Low Forward PE 8.6. Buy 9 Analysts. 1-Year Return: -1.2% 5-Year Return: 21.1%
 Last Close 51.57 (CAD) Avg Daily Vol 222,784 52-Week High 55.05 Trailing PE 9.2 Annual Div 1.66 ROE 12.7% LTG Forecast -- 1-Mo 0.6% 2019 April 11 TORONTO Exchange Market Cap (Consol) 5.6B 52-Week Low 41.32
52-Week High Trailing PE Week Low Forward PE Hold 14 Analysts. 1-Year Return: 8.7% 5-Year Return: 43.
 CADIAN IMPERIAL BANK (-T) Last Close 114.56 (CAD) Avg Daily Vol 868,326 52-Week High 120.83 Trailing PE 10.4 Annual Div 5.20 ROE 18.0% LTG Forecast 4.6% 1-Mo 1.7% November 23 TORONTO Exchange Market Cap
Trailing PE Forward PE -- NA 0 Analysts. 1-Year Return: 0.0% 5-Year Return: -78.1%
 Last Close 1.10 (CAD) Avg Daily Vol 13,433 52-Week High 1.35 Trailing PE 275.0 Annual Div ROE -5.2% LTG Forecast 1-Mo 19.6% 2019 April 05 TSX VENTURE Exchange Market Cap 24M 52-Week Low 0.69 Forward PE
Trailing PE Forward PE -- NA 0 Analysts. 1-Year Return: 26.2% 5-Year Return: 263.1%
 RICHARDS PACKAGING INCOME (-T) Last Close 36.75 (CAD) Avg Daily Vol 3,844 52-Week High 40.68 Trailing PE 25.0 Annual Div 1.32 ROE 19.0% LTG Forecast 1-Mo -8.2% October 29 TORONTO Exchange Market Cap 405M
Trailing PE Forward PE Buy 4 Analysts. 1-Year Return: 1.3% 5-Year Return: -14.0%
 Last Close 3.81 (CAD) Avg Daily Vol 36,900 52-Week High 4.35 Trailing PE 17.3 Annual Div 0.20 ROE 4.9% LTG Forecast -- 1-Mo -3.1% 2019 April 01 TORONTO Exchange Market Cap 192M 52-Week Low 3.07 Forward
Trailing PE Forward PE Buy 16 Analysts. 1-Year Return: 21.5% 5-Year Return: -64.5%
 BONTERRA ENERGY CORP (-T) Last Close 19.70 (CAD) Avg Daily Vol 92,379 52-Week High 20.29 Trailing PE 57.9 Annual Div 1.20 ROE 2.2% LTG Forecast -- 1-Mo 2.2% October 03 TORONTO Exchange Market Cap 640M
Trailing PE Forward PE Hold 11 Analysts. 1-Year Return: -1.1% 5-Year Return: 31.1%
 RIDGE INCOME FUND HOLDINGS (-T) Last Close 32.01 (CAD) Avg Daily Vol 725,761 52-Week High 33.05 Trailing PE 58.2 Annual Div 2.26 ROE 1.3% LTG Forecast 4.8% 1-Mo 7.7% July 18 TORONTO Exchange Market Cap
Trailing PE Forward PE -- Hold 1 Analyst. 1-Year Return: 8.6% 5-Year Return: 66.9%
 A AND W REVENUE ROYALTIES (-T) Last Close 36.02 (CAD) Avg Daily Vol 19,429 52-Week High 36.83 Trailing PE 19.9 Annual Div 1.69 ROE 21.2% LTG Forecast 1-Mo 15.1% 2018 August 17 TORONTO Exchange Market Cap
Trailing PE -- Forward PE Buy 19 Analysts. 1-Year Return: -23.4% 5-Year Return: -40.6%
 CHCLIFF ENERGY (-T) Report Date: November 09 Last Close 4.28 (CAD) Avg Daily Vol 964,568 52-Week High 5.77 Trailing PE -- Annual Div 0.10 ROE -4.2% LTG Forecast 26.0% 1-Mo -12.8% November 08 TORONTO Exchange
Trailing PE 5.4. Forward PE Buy 18 Analysts. 1-Year Return: -42.0% 5-Year Return: -31.8%
 HUDBAY MINERALS INC (-T) Last Close 5.67 (CAD) Avg Daily Vol 1.8M 52-Week High 12.65 Trailing PE 5.4 Annual Div 0.02 ROE 10.3% LTG Forecast -13.7% 1-Mo -12.4% October 19 TORONTO Exchange Market Cap 1.5B